Commentary on explainable artificial intelligence methods: SHAP and LIME
Abstract
eXplainable artificial intelligence (XAI) methods have emerged to convert the black box of machine learning models into a more digestible form. These methods help to communicate how the model works with the aim of making machine learning models more transparent and increasing the trust of end-users into their output. SHapley Additive exPlanations (SHAP) and Local Interpretable Model Agnostic Explanation (LIME) are two widely used XAI methods particularly with tabular data. In this commentary piece, we discuss the way the explainability metrics of these two methods are generated and propose a framework for interpretation of their outputs, highlighting their weaknesses and strengths.
keywords:
XAI, Assumptions, Interpretability[1]organization=William Harvey Research Institute, NIHR Barts Biomedical Research Centre, Queen Mary University of London,addressline=Charterhouse Square, postcode=EC1M 6BQ, state=London, country=United Kingdom
[2]organization=Department of Computer Science, Faculty of Science, University of Zakho,addressline=Zakho Way Road, city=Duhok, postcode=42002, state=Kurdistan region, country=Iraq
[3]organization=Barts Heart Centre, St Bartholomew’s Hospital, Barts Health NHS Trust,addressline=West Smithfield, postcode=EC1A 7BE, state=London, country=United Kingdom
[4]organization=Department of Engineering for Innovation Medicine, University of Verona,addressline=Via S. Francesco, 22, city=Verona, postcode=37129, state=Verona, country=Italy
[5]organization=de Matemàtiques i Informàtica, Universitat de Barcelona,addressline=Gran Via de les Corts Catalanes, city=Barcelona, postcode=08007, state=Barcelona, country=Spain
[6]organization=Health Data Research,city=London, state=London, country=United Kingdom
[7]organization=Alan Turing Institute,city=London, state=London, country=United Kingdom
1 Introduction
Machine learning methods have shown great success in a variety of domains e.g. biology [1], medicine [2], economy [3] and education [4]. However, such success is accompanied by complexity in understanding how these models work, why the models make a specific decision, what features/regions are most influencing the model output and the degree of certainty the model has in the outcome generated. All of these questions and more are raised by the end users specially when advanced models including deep neural networks are implemented. Accordingly, a new field of research has emerged named eXplainable artificial intelligence (XAI) with the main objective of demystifying ’black box’ models into a more comprehensible form [5]. XAI is indispensable to increase the model transparency and the trust of end-users in the model outcome [6]. Such additional reassurances are essential for wide implementation of such models, particularly in high risk fields such as healthcare.
Several approaches have been proposed as XAI methods dealing with a variety of data and model types, aiming to locally and globally explain the models outputs, from which SHAP [7] and LIME [8] form the most popular XAI methods. SHapley Additive exPlanations (SHAP) [7] is an XAI method designed based on game theory. It aims to explain any model by considering each feature (or predictor) in the model as a player and the model outcome as the payoff. SHAP provides local and global explanation, meaning that it is able to explain the role of the features for all instances and for a specific instance. Local Interpretable Model Agnostic Explanation (LIME) [8] is another XAI method that aims to explain how the model works locally for a specific instance in the model. It approximates any complex model and transfers it to a local interpretable model for a specific instance. Many other approaches and methods were proposed with the similar aims to make the machine learning models more interpretable. SHAP and LIME are the two most common XAI methods applied to tabular data. Despite the limitations of SHAP and LIME in terms of uncertainty estimates, generalization, feature dependencies, and inability to infer causality [9], they have substantial value in explaining and interpreting complex machine models.
However, does the end user understands how these XAI methods work? And why they identify specific regions/features as more informative than others? Is it enough for the end user to know that these features/regions are more informative, because they increase the model output without knowing how the XAI method came up with such a result? For example, when SHAP assigns a high/low score for a feature, does the end user knows how this score is calculated? SHAP and LIME perform many analyses in the background and solve complex equations to come up with their explanations. In many settings, complex models will be interpreted by non-expert end-users, who may find understanding of the workings of XAI methods challenging. It is not expected that the end users from different domains understand every minutiae of XAI methods, but it is vital that they are aware of the general framework of the XAI method used. While XAI methods aimed to unveil the complexity of complex black box models, they themselves suffer from the same issue, in that their usefulness may be limited by the complexity of their outputs. In this commentary piece, we will discuss SHAP and LIME XAI methods, highlighting their underlying assumptions and whether the end users are possible to grasp their key concepts appropriately. We will also present some notions to increase the understanding XAI methods and promote their appropriate use by researchers.
1.1 SHAP
SHAP is a post-hoc model-agnostic method that can be applied to any machine learning model [7]. It is based on game theory which calculates the contribution of each player to the payout. In machine learning models, the players and the payout are substituted by features and the model outcome, respectively. SHAP calculates a score for each feature in the model, which represents its weight to the model output. To calculate the scores, it considers all collations between the features to cover all cases where all features and a subset of features are in the model. Due to the increases of computational complexity of SHAP when the number of features increases, an approximation SHAP method is proposed named Kernel SHAP [7].
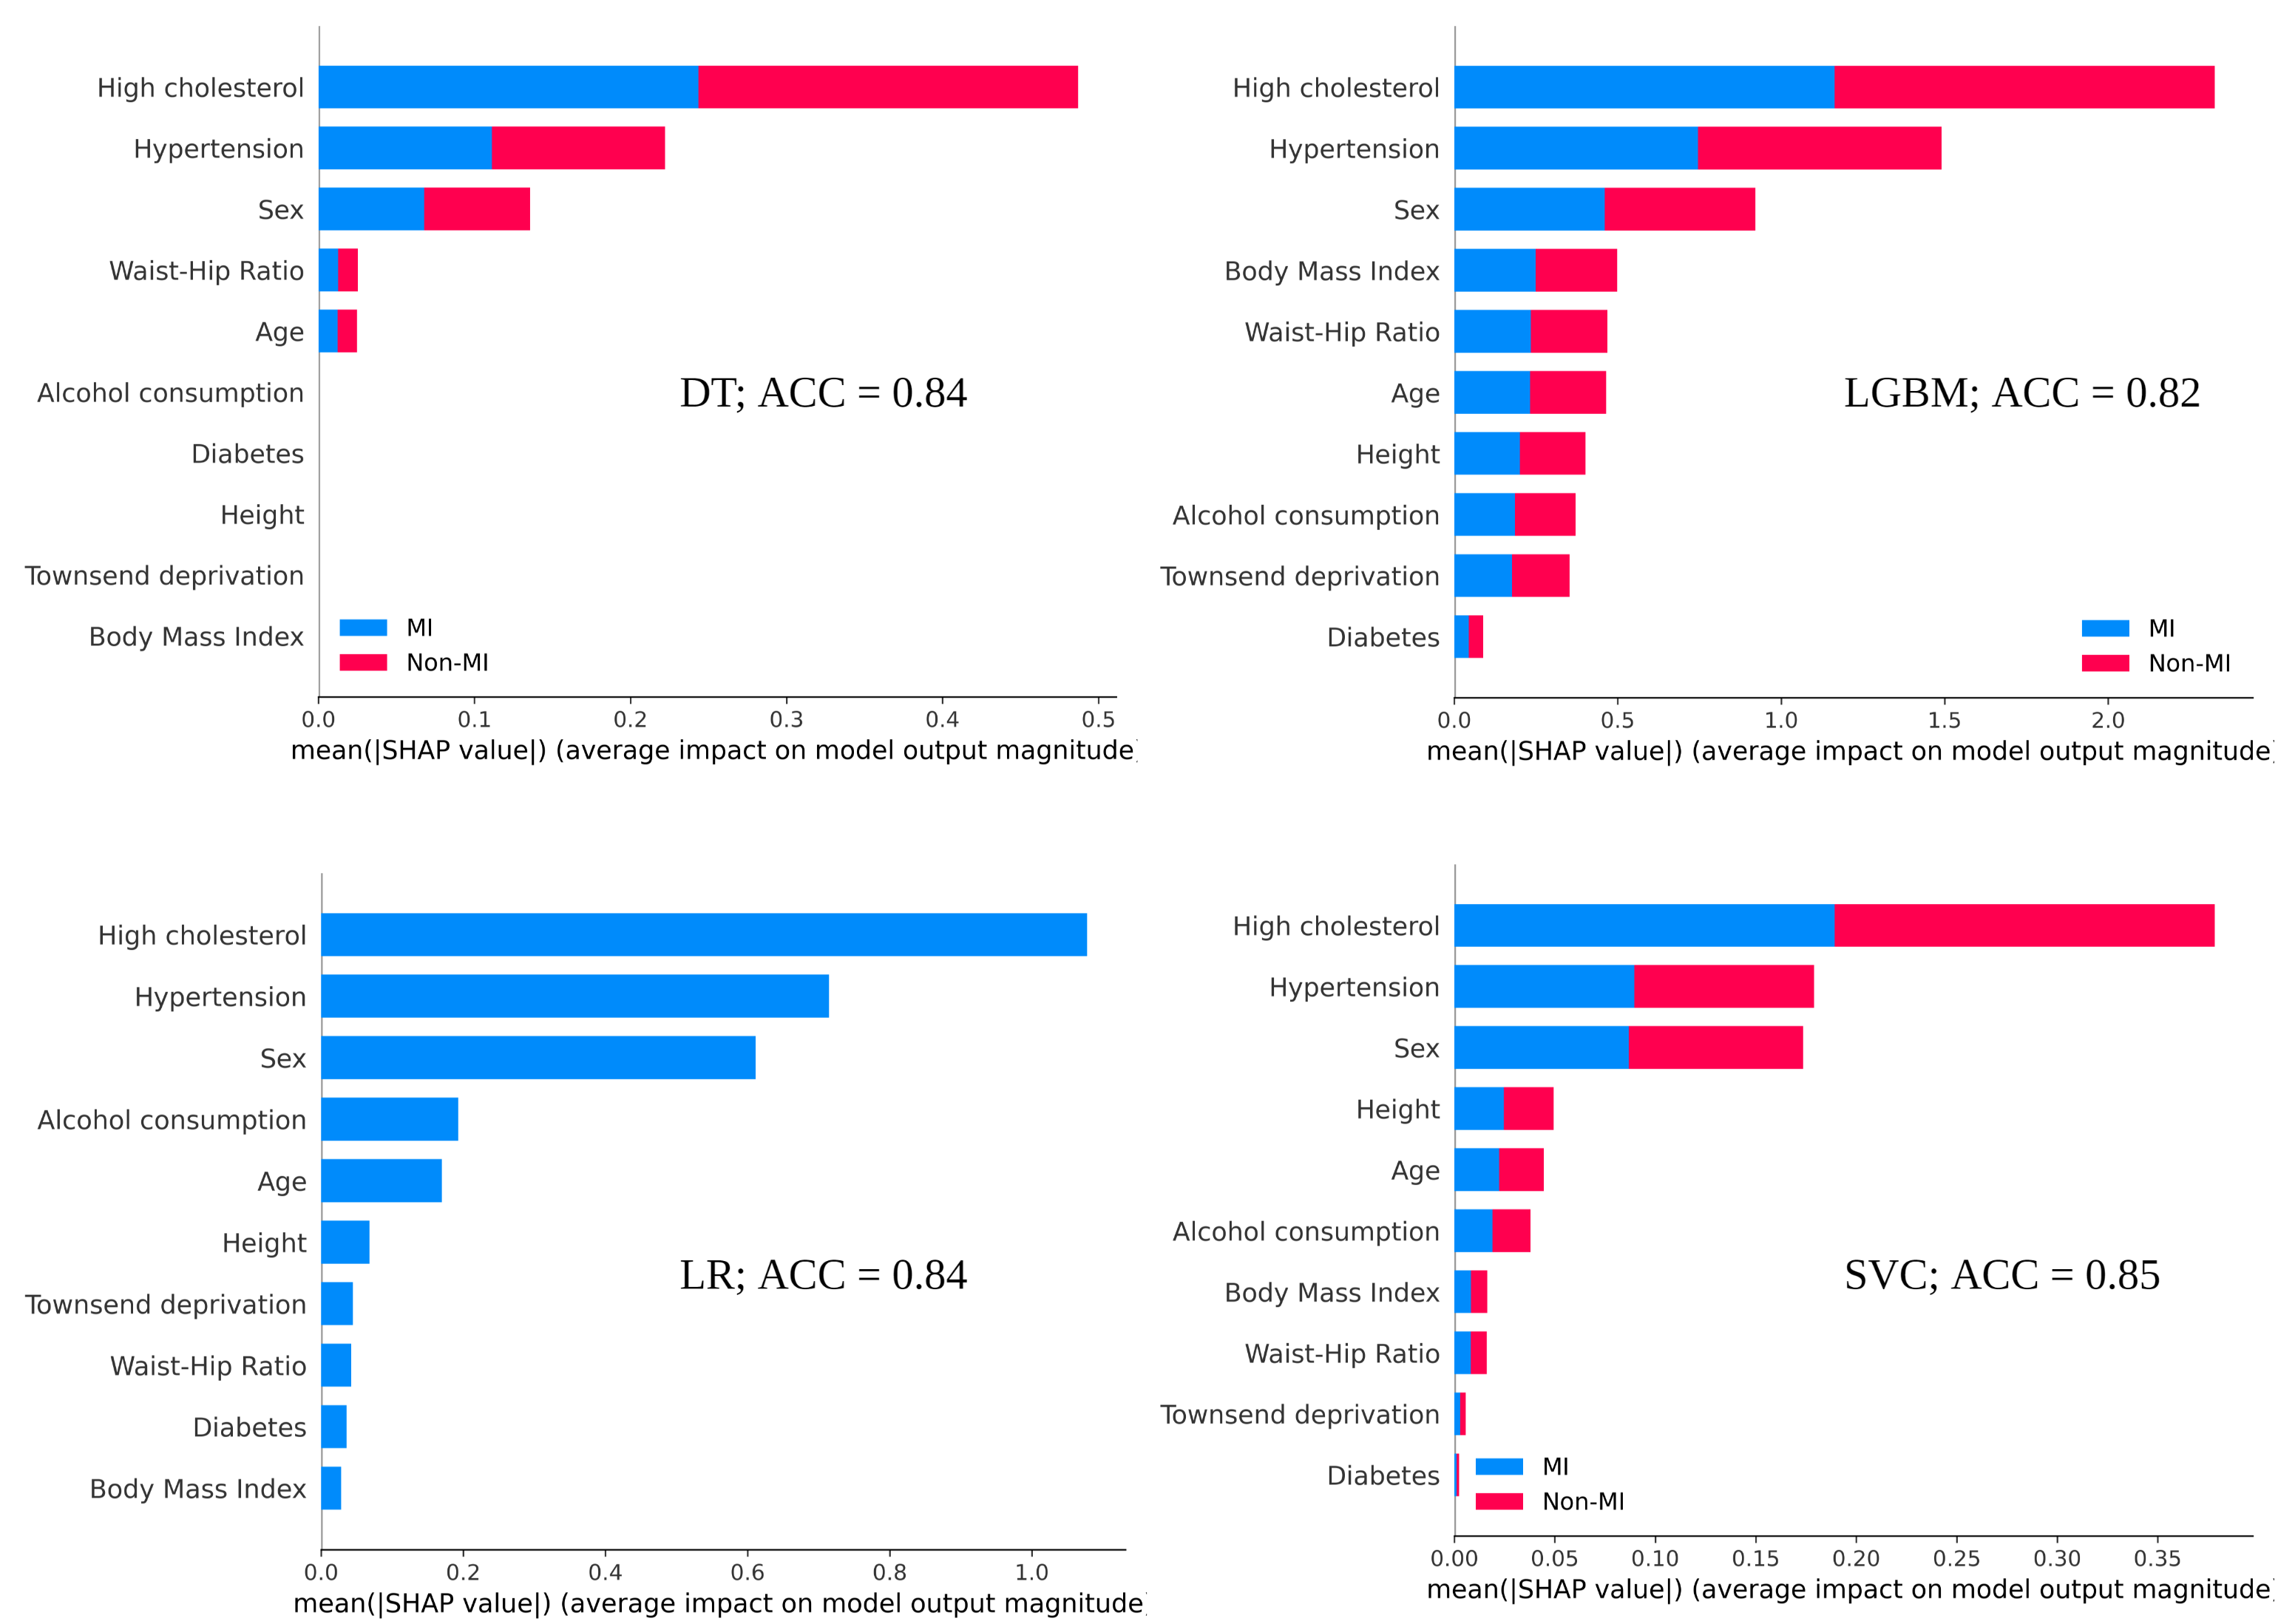
SHAP has been applied widely in a variety of domains in order to explain the model output, either locally or globally [10, 11, 12, 13]. However, there are some points the researcher end-users should be aware when applying SHAP. Firstly, SHAP is a model-dependent method. This means that the outcome of SHAP depends on the model used with different machine learning models perhaps leading to different explainability scores generated by SHAP. Accordingly, when different models are applied, the top features identified by SHAP may differ between models. To illustrate the model-dependency point, figure 1 are SHAP summary plots using four classification models. The plots reveals features in order of important, for each model based on their effect toward the model outcome. The four classification models were applied to 1500 subjects (20% test) to classify them as cases (myocardial infarction, MI) or controls (No MI). The plot shows that there is agreement on the top three most informative features among the tested models, however there is a notable variation in the order of the other seven features among. For instance, body mass index is the least important one in DT and LR while it is the third one in the LBGM model and the seventh in the SVC model. The position of alcohol consumption and Waist-Hip ratio similarly varies between models. In addition, the last five features are almost with zero SHAP score in DT model indicating they do not affect the model output. It is worth to mention that this variation is observed while the accuracy of the used model is close to each other.
Secondly, another potential pitfall is in interpretation of the score or SHAP values. This is because the assigned score does not represent the same unit as that of the feature. The end users should focus on the order of the features which represents their significance. Third, SHAP is not protected against biased classifier and might generate unrealistic explanations that do not capture the underlying biases [14]. Finally, SHAP assumes the features are independent. It means that SHAP assumes there is no correlation between the features used in the model. Such assumption will affect the assigned score (weight) to each feature in the model. Some features might be assigned a low score despite being significantly associated with the outcome. This is because they do not improve the model performance due to their collinearity with other features that already improve the model performance. Although there are some works which tried to deal with the issue of collinearity [15, 16], yet the proposed method is either limited to a local explanation [15] or the explanation is user-dependent [16]. Another approach was proposed to assess the stability of the list of informative features generated by SHAP, particulalry when the features are collinear [17]. The method calculates a value named normalized movement rate (NMR) which assesses how the order of the features (generated by SHAP) will be affected when the top features are removed from the model iteratively. The smaller the NMR, the more the list of informative features is stable.
1.2 LIME
LIME is a model agnostic local explanation method [8]. It explains the influence of each feature to the outcome for a single subject. In the classification models, it also shows the probability that the subject might be belong to any class. In addition, it shows the contribution of each feature in each class with visualized plot.
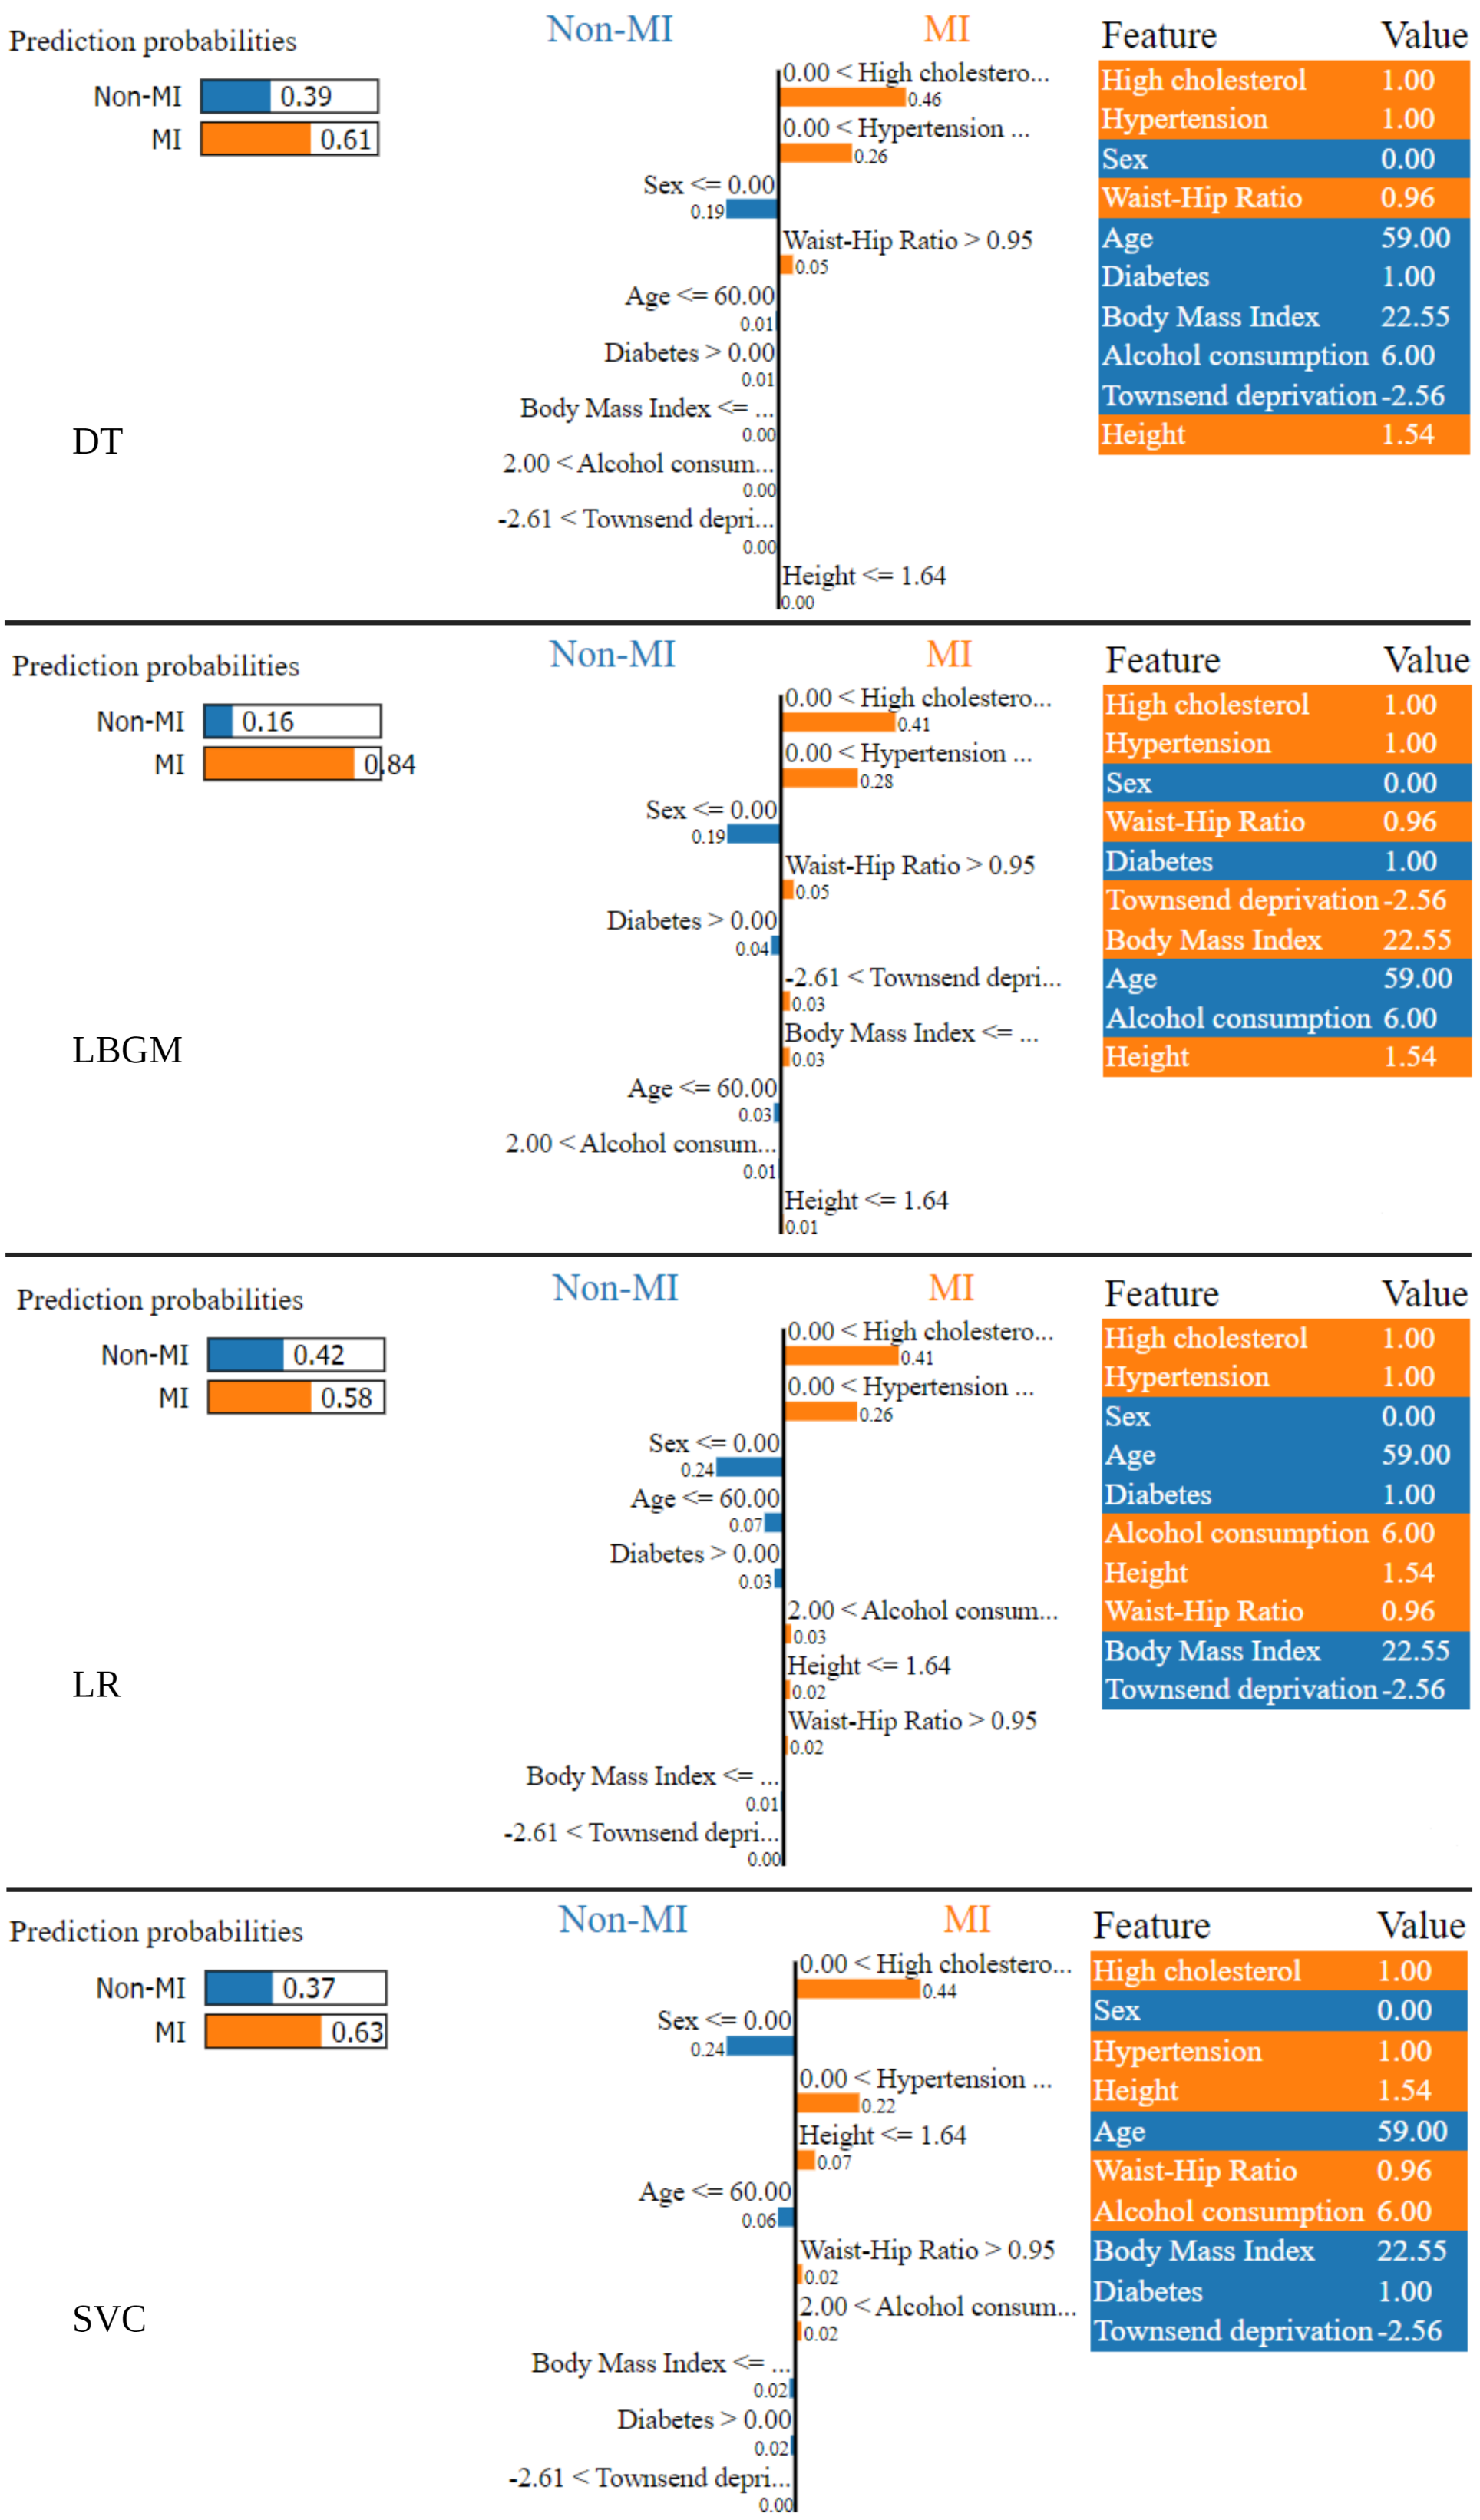
However, LIME converts any model into a linear local model, and then reports the coefficient values which represent the weights of the features in the model. In other word, if the user applies some models that take into account the non-linearity between features and the outcome, this might be missing in the explanation generated by LIME. This is because the non-linearity is lost in the linear model generated by LIME. In addition, LIME is also a model-dependent method, meaning the used model will affect the outcome of LIME. Figure 2 shows the output of LIME for the same individual using the same classifiers as explained before. The first part of the plot shows the probability that the subject is classified as control (Non-MI) or with MI in each of the used model. The second part (in the middle) shows the weight (coefficient value) of each feature in the local linear model while the last part shows the actual value of each feature. Moreover, the plot shows the features contribution toward each class based on the assigned color. First of all, the probability that the subject, whether it is control (Non-MI) or with MI, is different for each of the used model. It shows that LBGM is the most certain while DT is the least. In addition, the plot shows that the same feature is contributing in different class among the tested model. For example, alcohol consumption contributes in the MI class in LR and SVC while it contributes in the Non-MI class in the DT and LBGM. Body mass index and Townsend deprivation contribute in the MI class while they contribute in the Non-MI class in the other three models. In addition, the plot shows that the features are with similar effect size although four different models were used. This is due to that LIME generates an approximate local linear model and then reports the weights of the features.
With regards to the colinearity, the interpretation of the weights generated by LIME indicates increase/decrease per one unit change in the feature will lead to increase/decrease in the outcome while other features are constants. Such assumption is not realistic with collinear data where group of features might change simultaneously. In the example above, most of the features are collinear such as high cholesterol and body mass index. It is indeed the exact interpretation with the coefficient value in the linear models. But because they are generated by LIME, the user might think that they have more power and meaning than the classical coefficient values in the machine learning models. Finally, similar to SHAP, LIME can be fooled by biased classifiers and the generated explanations do not reflect or represent the biases [14].
2 Recommendations
SHAP and LIME are two XAI methods that aid understanding of machine learning models in different research fields. They have been implemented in some sensitive domains [18, 19, 20] where misinterpreting the outcomes might be very expensive or critical. Data scientists who are working daily on machine learning and XAI, over-trust the explanations generated by XAI methods, misuse the interpretability tools and do not accurately understand the visualized output of the XAI methods [21].
It is crucial that SHAP results are presented alongside the plots output with a simple language to explain the outcomes and the assumptions behind SHAP e.g. features are independent and model-dependent. Moreover, it would be better that the end user implements different machine learning models when the features are collinear in order to compare and contrast the outcome of SHAP from each model. Thereafter, the NMR [17] value would be useful to pick the model that presents the more stable list of informative features generated by SHAP if the aim is to explain the model globally. On the other hand, if the aim is to explain the model locally for a single instance or sub-group of individuals, then approximated SHAP value [15] would be better to be applied as this is a modified version of SHAP that takes into account the collinearity among the features. In addition, converting the scores of each feature of the model into a more digestible form e.g. coefficient value would inevitably increase the understanding of the score and ultimately the method itself. It is worthy that LIME provides explanation regarding the local model linearity with the model outcome as the users might not be familiar with the concept behind LIME. The users will be much aware and understand the outcome when a simple language accompanied the outcome. Moreover, the explanation of LIME might be different using the same model, but for other instance. In other words, the interpretation of LIME only applies for one subject and cannot be used or considered as a general interpretation for the whole model.
3 Conclusions
In the current commentary, we discussed two widely used XAI methods specially with tabular data. The highlighted and discussed points are very significant and critical to be considered when XAI methods are implemented in any domain. Considering the end users not from technical background, it is needful that they are aware of these issues in order to use the methods most appropriately. They are meant to increase the understanding of the outcomes of SHAP and LIME and ultimately produce more meaningful explanation.
Funding
AS is supported by a British Heart Foundation project grant (PG/21/10619). IBG and GM acknowledge support from Fondazione CariVerona (Bando Ricerca Scientifica di Eccellenza 2018, EDIPO project - reference number 2018.0855.2019. ZRE recognises the National Institute for Health and Care Research (NIHR) Integrated Academic Training programme which supports her Academic Clinical Lectureship post and was also supported by British Heart Foundation Clinical Research Training Fellowship No. FS/17/81/33318. SEP acknowledges support from the National Institute for Health and Care Research (NIHR) Biomedical Research Centre at Barts and have received funding from the European Union’s Horizon 2020 research and innovation programme under grant agreement No 825903 (euCanSHare project). This article is supported by the London Medical Imaging and Artificial Intelligence Centre for Value Based Healthcare (AI4VBH), which is funded from the Data to Early Diagnosis and Precision Medicine strand of the government’s Industrial Strategy Challenge Fund, managed and delivered by Innovate UK on behalf of UK Research and Innovation (UKRI). Views expressed are those of the authors and not necessarily those of the AI4VBH Consortium members, the NHS, Innovate UK, or UKRI.
Disclosure
SEP provides consultancy to Cardiovascular Imaging Inc, Calgary, Alberta, Canada. The remaining authors have no disclosures.
Statement
The paper is under consideration at Pattern Recognition Letters.
References
- [1] Blake Richards, Doris Tsao, and Anthony Zador. The application of artificial intelligence to biology and neuroscience. Cell, 185(15):2640–2643, 2022.
- [2] Pavel Hamet and Johanne Tremblay. Artificial intelligence in medicine. Metabolism, 69:S36–S40, 2017.
- [3] Emmanuel Afrane Gyasi, Heikki Handroos, and Paul Kah. Survey on artificial intelligence (ai) applied in welding: A future scenario of the influence of ai on technological, economic, educational and social changes. Procedia Manufacturing, 38:702–714, 2019.
- [4] Ke Zhang and Ayse Begum Aslan. Ai technologies for education: Recent research & future directions. Computers and Education: Artificial Intelligence, 2:100025, 2021.
- [5] David Gunning, Mark Stefik, Jaesik Choi, Timothy Miller, Simone Stumpf, and Guang-Zhong Yang. Xai—explainable artificial intelligence. Science robotics, 4(37):eaay7120, 2019.
- [6] Liliana Szabo, Zahra Raisi-Estabragh, Ahmed Salih, Celeste McCracken, Esmeralda Ruiz Pujadas, Polyxeni Gkontra, Mate Kiss, Pal Maurovich-Horvath, Hajnalka Vago, Bela Merkely, et al. Clinician’s guide to trustworthy and responsible artificial intelligence in cardiovascular imaging. Frontiers in Cardiovascular Medicine, 2022, vol. 9, 2022.
- [7] Scott M Lundberg and Su-In Lee. A unified approach to interpreting model predictions. Advances in neural information processing systems, 30, 2017.
- [8] Marco Tulio Ribeiro, Sameer Singh, and Carlos Guestrin. ” why should i trust you?” explaining the predictions of any classifier. In Proceedings of the 22nd ACM SIGKDD international conference on knowledge discovery and data mining, pages 1135–1144, 2016.
- [9] Christoph Molnar, Gunnar König, Julia Herbinger, Timo Freiesleben, Susanne Dandl, Christian A Scholbeck, Giuseppe Casalicchio, Moritz Grosse-Wentrup, and Bernd Bischl. General pitfalls of model-agnostic interpretation methods for machine learning models. In xxAI-Beyond Explainable AI: International Workshop, Held in Conjunction with ICML 2020, July 18, 2020, Vienna, Austria, Revised and Extended Papers, pages 39–68. Springer, 2022.
- [10] María Vega García and José L Aznarte. Shapley additive explanations for no2 forecasting. Ecological Informatics, 56:101039, 2020.
- [11] Yesuel Kim and Youngchul Kim. Explainable heat-related mortality with random forest and shapley additive explanations (shap) models. Sustainable Cities and Society, 79:103677, 2022.
- [12] Irfan Ullah, Kai Liu, Toshiyuki Yamamoto, Muhammad Zahid, and Arshad Jamal. Prediction of electric vehicle charging duration time using ensemble machine learning algorithm and shapley additive explanations. International Journal of Energy Research, 46(11):15211–15230, 2022.
- [13] KK Pabodha M Kannangara, Wanhuan Zhou, Zhi Ding, and Zhehao Hong. Investigation of feature contribution to shield tunneling-induced settlement using shapley additive explanations method. Journal of Rock Mechanics and Geotechnical Engineering, 14(4):1052–1063, 2022.
- [14] Dylan Slack, Sophie Hilgard, Emily Jia, Sameer Singh, and Himabindu Lakkaraju. Fooling lime and shap: Adversarial attacks on post hoc explanation methods. In Proceedings of the AAAI/ACM Conference on AI, Ethics, and Society, pages 180–186, 2020.
- [15] Kjersti Aas, Martin Jullum, and Anders Løland. Explaining individual predictions when features are dependent: More accurate approximations to shapley values. Artificial Intelligence, 298:103502, 2021.
- [16] Masayoshi Mase, Art B Owen, and Benjamin Seiler. Explaining black box decisions by shapley cohort refinement. arXiv preprint arXiv:1911.00467, 2019.
- [17] Ahmed Salih, Ilaria Boscolo Galazzo, Federica Cruciani, Lorenza Brusini, and Petia Radeva. Investigating explainable artificial intelligence for mri-based classification of dementia: a new stability criterion for explainable methods. In 2022 IEEE International Conference on Image Processing (ICIP), pages 4003–4007. IEEE, 2022.
- [18] Naomi George, Edward Moseley, Rene Eber, Jennifer Siu, Mathew Samuel, Jonathan Yam, Kexin Huang, Leo Anthony Celi, and Charlotta Lindvall. Deep learning to predict long-term mortality in patients requiring 7 days of mechanical ventilation. PloS one, 16(6):e0253443, 2021.
- [19] Adrian D Haimovich, Neal G Ravindra, Stoytcho Stoytchev, H Patrick Young, Francis P Wilson, David Van Dijk, Wade L Schulz, and R Andrew Taylor. Development and validation of the quick covid-19 severity index: a prognostic tool for early clinical decompensation. Annals of emergency medicine, 76(4):442–453, 2020.
- [20] Yiming Zhang, Ying Weng, and Jonathan Lund. Applications of explainable artificial intelligence in diagnosis and surgery. Diagnostics, 12(2):237, 2022.
- [21] Harmanpreet Kaur, Harsha Nori, Samuel Jenkins, Rich Caruana, Hanna Wallach, and Jennifer Wortman Vaughan. Interpreting interpretability: understanding data scientists’ use of interpretability tools for machine learning. In Proceedings of the 2020 CHI conference on human factors in computing systems, pages 1–14, 2020.