si
Order-of-Magnitude SNR Improvement for High-Field EPR Spectrometers via 3D-Printed Quasioptical Sample Holders
Abstract
In this paper, we present a rapidly-prototyped, cost-efficient, 3D-printed quasioptical sample holder for improving the signal-to-noise ratio (SNR) in modern, resonator-free, high-field electron paramagnetic resonance (EPR) spectrometers. Such spectrometers typically operate in induction mode: the detected EPR (“cross-polar”) signal is polarized orthogonal to the incident (“co-polar”) radiation. The sample holder improves SNR in three modes: continuous wave, pulsed, and rapid-scan. An adjustable sample positioner allows for optimizing sample position to maximize the 240 GHz magnetic field , and a rooftop mirror allows for small rotations of the cross-polar signal to maximize the signal and minimize the co-polar background. When optimized, the co-polar isolation (the ratio of incident to detected co-polar signal) was dB, an improvement of dB. This large isolation is especially beneficial for maximizing the SNR of rapid-scan EPR, but also improves the SNR in pulsed and cwEPR experiments. Through minimal modification, the sample holder may be incorporated into a variety of homebuilt, induction-mode hfEPR spectrometers in order to significantly improve the SNR (approx. 6), and thereby reduce the acquisition time (by more than a factor of 30).
Index Terms:
High-field/high-frequency ESR/EPR, rapid-scan ESR, quasioptics, Gaussian beamsI Introduction
Electron paramagnetic resonance (EPR) is a spectroscopic technique based on the Zeeman effect. An unpaired electron spin in presence of external magnet field has two eigenstates, “spin-up” and “spin-down”, and irradiating a spin-up electron with a photon of energy equal to the energy difference between the two states leads to photon absorption [1]. EPR spectrometers make use of the Zeeman effect to probe the local environments of electron spins and can be found in a large fraction of chemistry and materials science laboratories, often to study radical species in a variety of environments (biological, solution, powder, crystal, etc.) or to characterize electronic materials [2, 3, 4, 5, 6, 7, 8, 9, 10, 11]. Nowadays, EPR is also used in the development of novel materials such as single-molecule magnets [12, 13, 14, 15, 16], single-ion magnets [17, 18, 19, 20, 21], and quantum bits [22]; and thus is increasing in popularity.
EPR spectrometers most often operate between and GHz (with magnetic fields between 0.35 and 3.5 T for ), with samples in resonant cavities to enhance signal-to-noise ratio (SNR). High-frequency (frequencies above 100 GHz, fields above 3.5 T) EPR (hfEPR), however, is advantageous for increased resolution, and is especially informative for systems that have gaps in their excitation spectra at zero magnetic field, including molecules with and large zero-field splittings [23, 24, 25, 16], collective spin excitations in antiferromagnets [26, 27], as well as frustrated spin systems [28, 29]. HfEPR spectrometers are also invaluable for measuring the spin dynamics of radicals used as polarizing agents in dynamic nuclear polarization (DNP)-enhanced NMR spectrometers, which operate above 7 T [30, 31].
Motivated by the tremendous scientific opportunities, the development of hfEPR spectrometers is an active field of research [32, 33, 34, 35, 36]. The well-known challenges in generating powerful electromagnetic radiation in the GHz band has resulted in delayed development of hfEPR as compared to low field EPR and NMR. Further, higher frequencies bring additional challenges: resonant cavities get smaller, and above 200 GHz, most systems do not use a cavity at all, which forfeits the large signal-to-noise improvement they often provide [37, 38, 39]. Importantly, hfEPR spectrometers typically operate in induction mode, meaning only polarization orthogonal to the excitation polarization is detected. While typically capable of isolating the excitation polarization by about 30 dB, induction mode architectures still impart a significant background to EPR experiments, as the excitation power is typically much larger than the orthogonal induction mode signal; as a result, improving induction-mode isolation for high field-and-frequency experiments is a potential avenue for improving hfEPR resolution and is a field of interest for many researchers [40, 41, 42, 43, 44, 45].
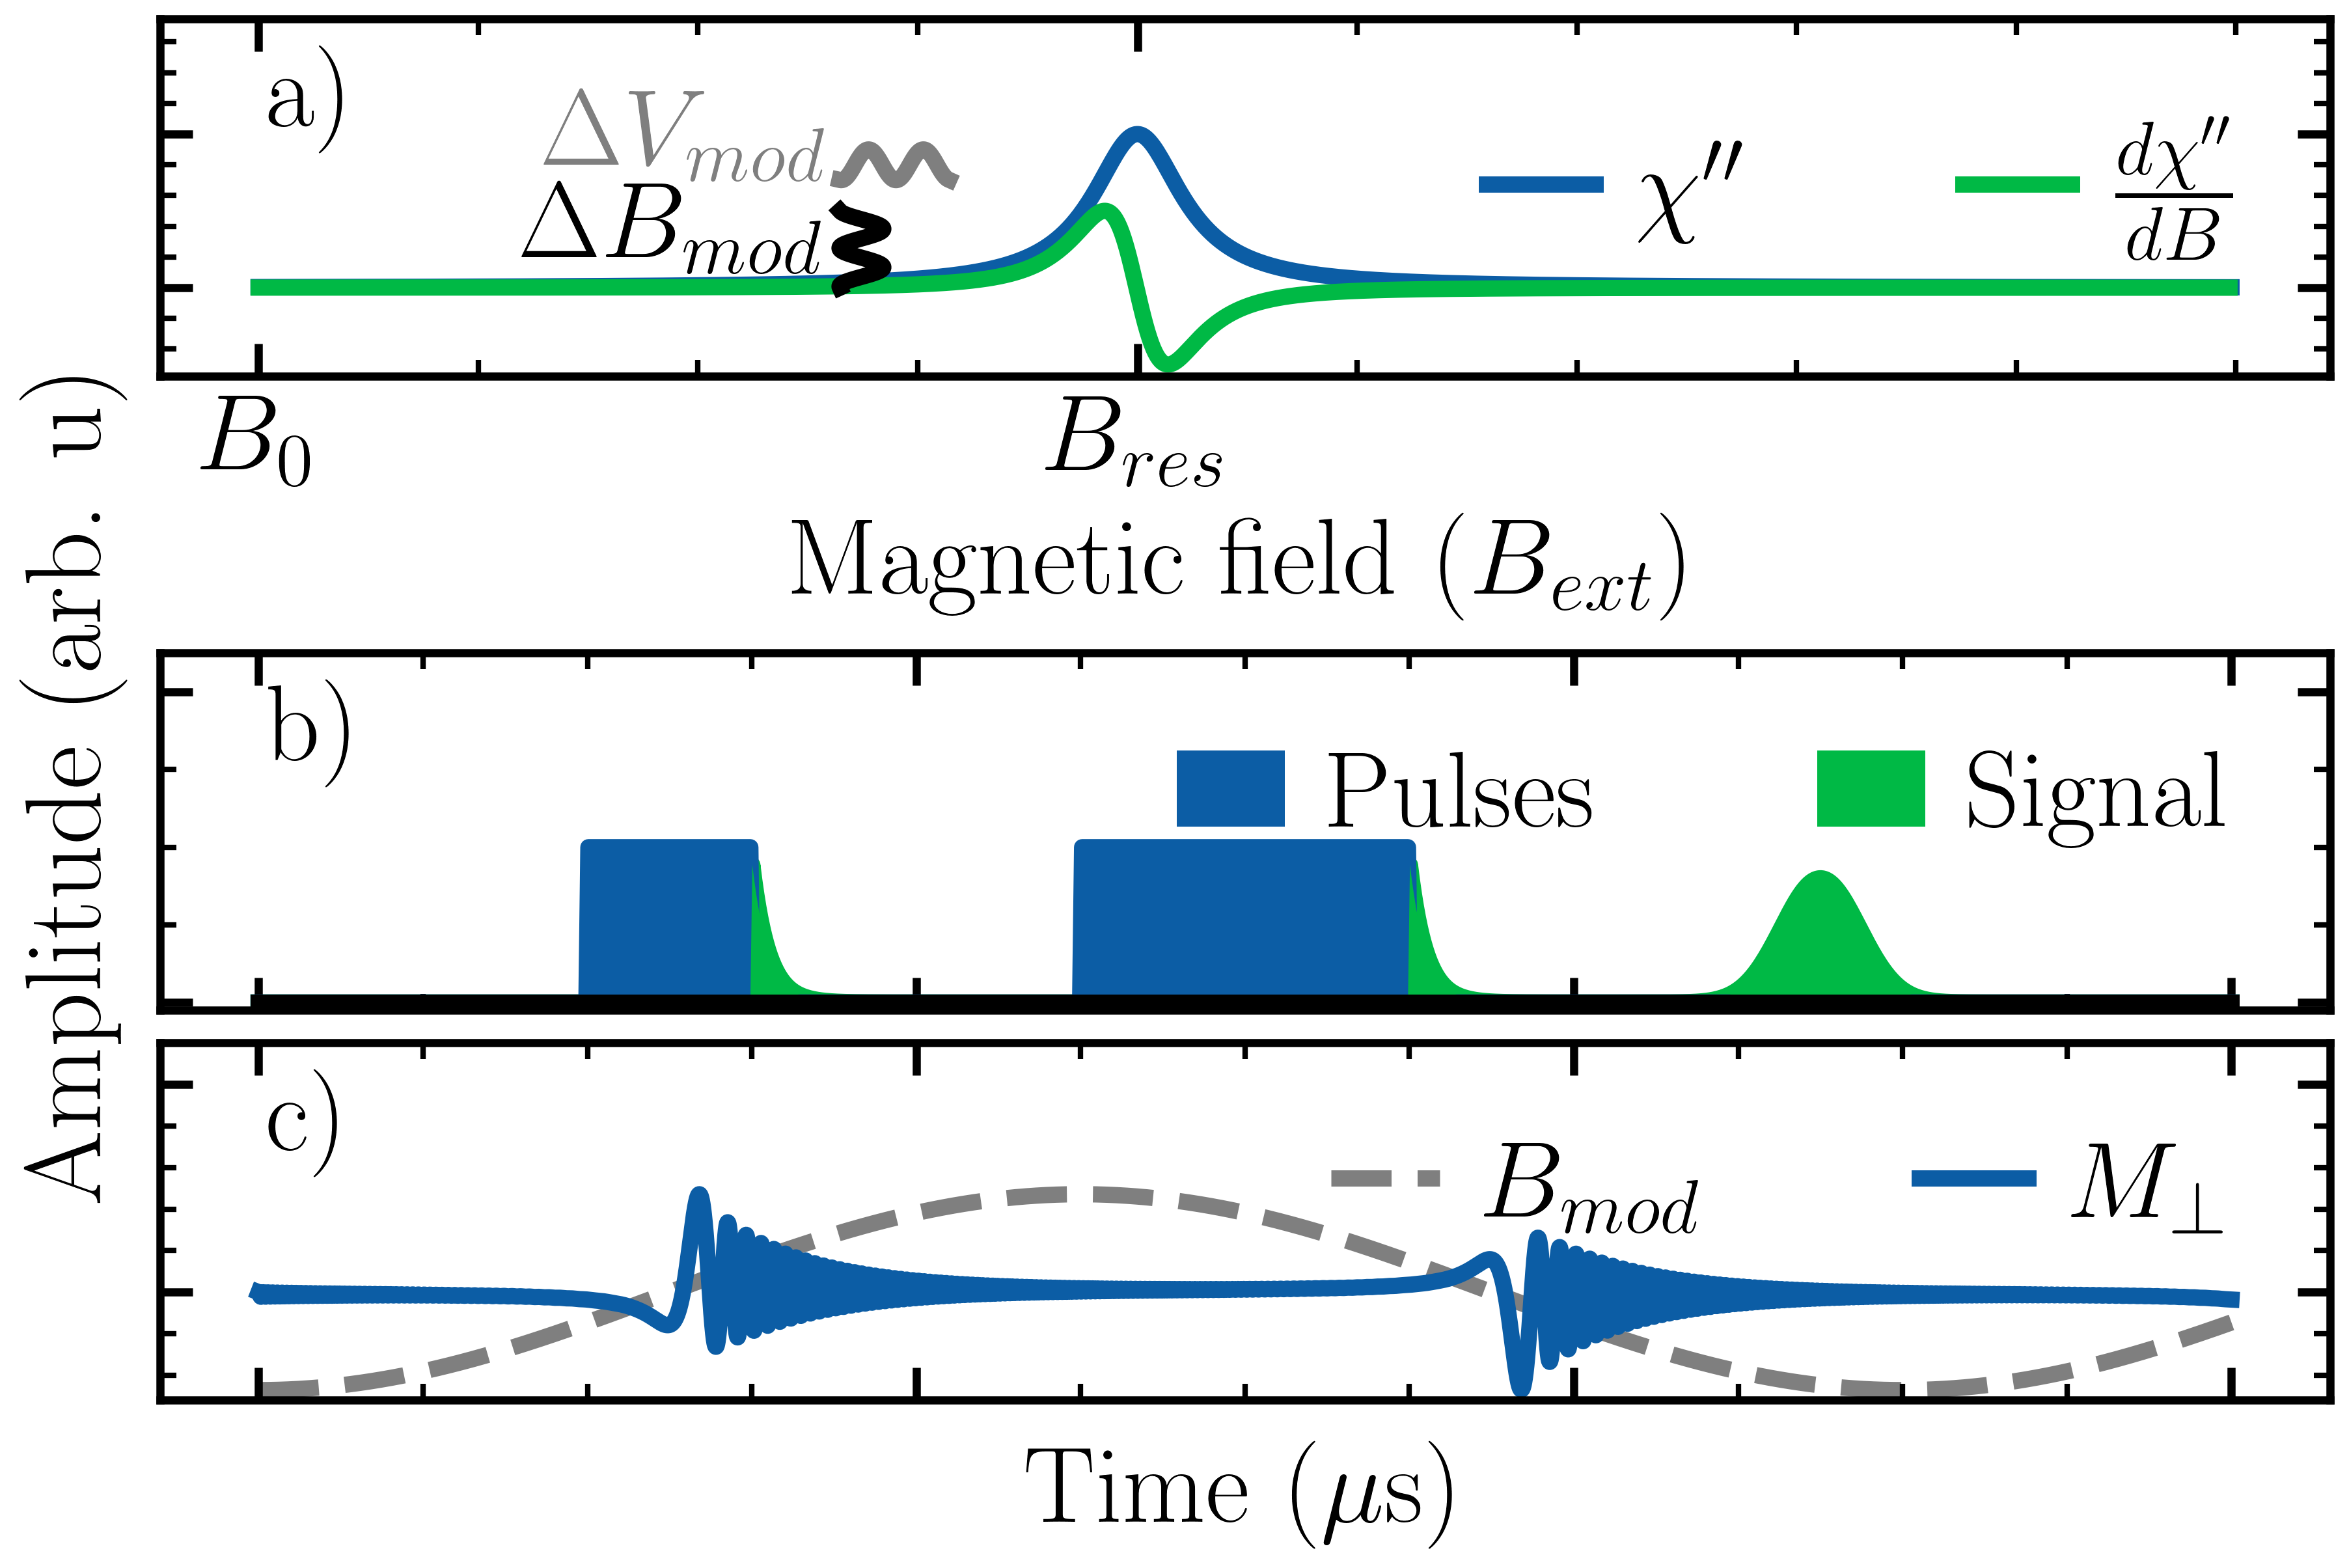
Most EPR systems operate in one (or more) of three modes: continuous wave (cw), where the resonance is swept through slowly, either by frequency or field; pulsed, with a fixed field and frequency, to obtain electron spin-lattice () or spin-spin () relaxation times; or rapid-scan, where a rapid sweep of field or frequency through the resonance distorts the EPR lineshape and can provide the slow-scan lineshape as well as relaxation time through post-processing (see Fig. 1).
In this paper, we report the frequency-independent high-field sample holder which enables an important improvement in SNR for high-frequency EPR spectrometers that is easy to design, prototype, and implement. The Quasioptical Sample Holder (QSH) presented here, designed to operate in all three modes (cw, pulsed, and rapid-scan), was fitted to attach to the EPR probe used in EPR spectrometer at the Institute for Terahertz Science and Technology (ITST). Minor adjustments to the 3D-printed model (.stp files included in S.I.) would allow for simple incorporation into other probe designs. The QSH was entirely 3D-printed for rapid prototyping, except for the 1/2” diameter parabolic mirror (), which was purchased from Thorlabs, Inc. [47], and the rooftop mirror, which was end milled from a 7 mm diameter aluminum rod (see S.I. Fig. LABEL:fig:roof-mirror).
II Experimental Details
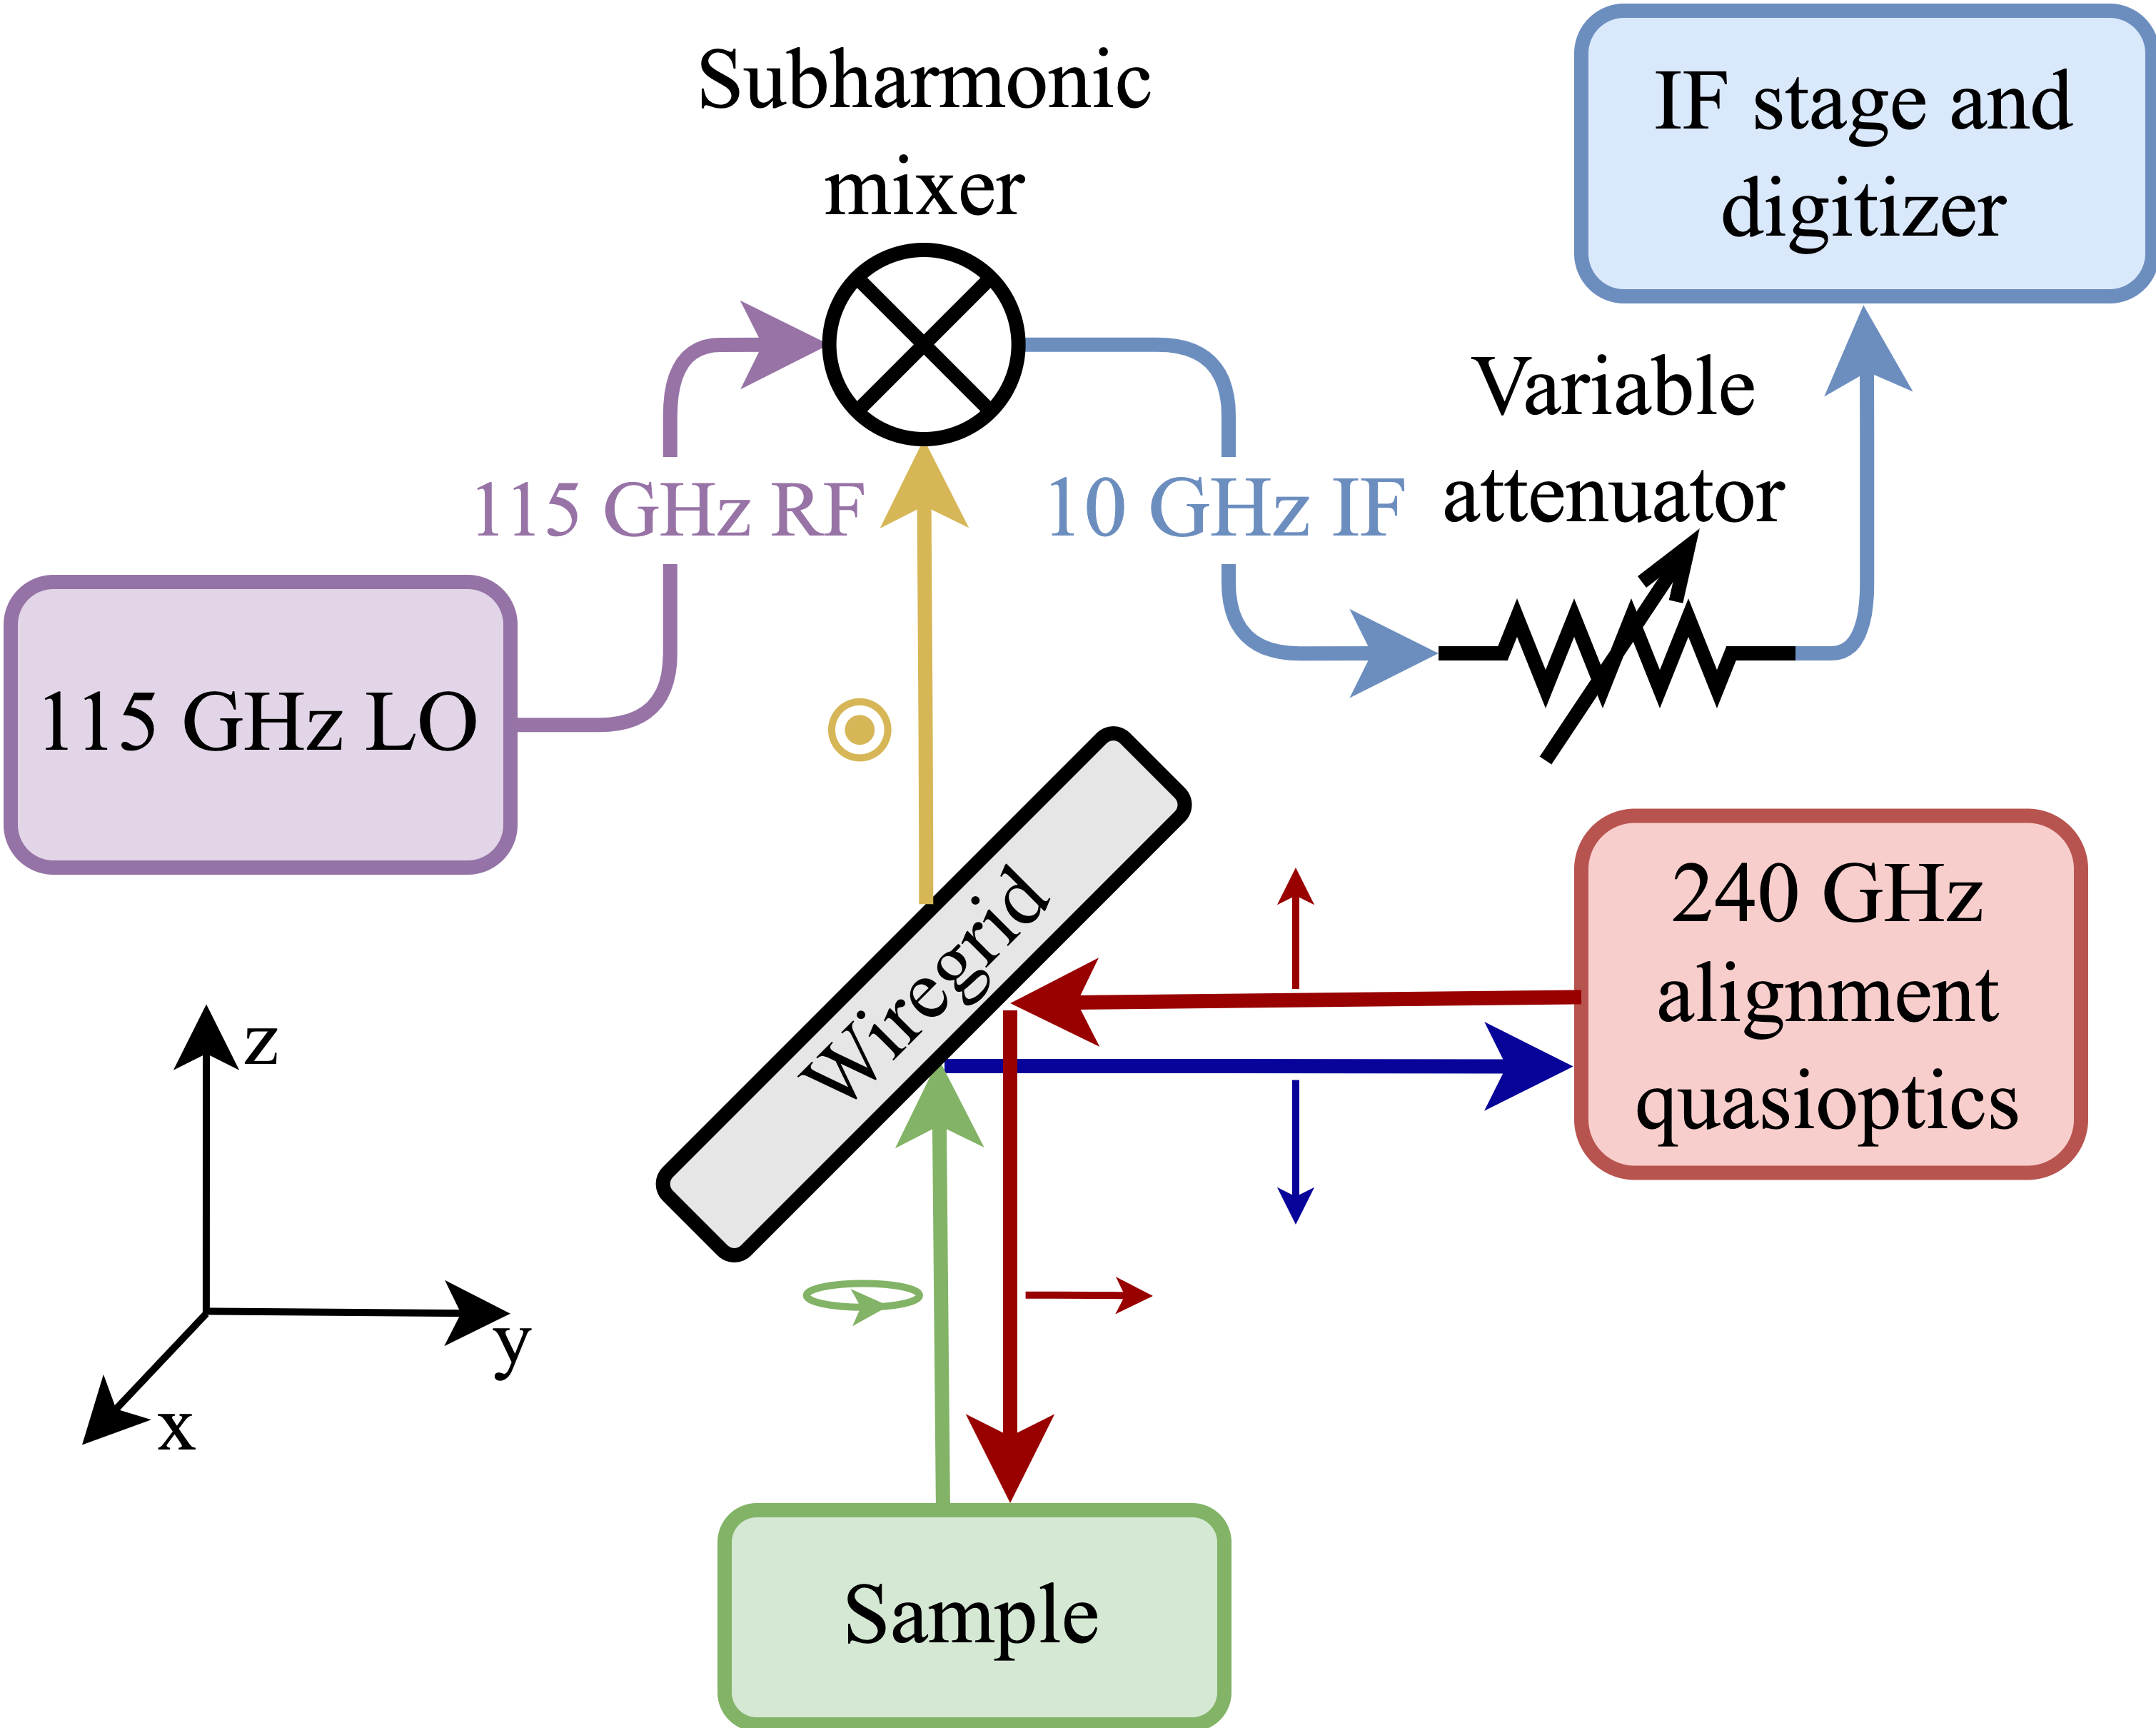
ITST’s spectrometer, which has been described in detail elsewhere [34, 48], operates in induction mode using a field-swept 12.5 T Oxford Instruments© superconducting magnet. A custom, low power source is used (60 mW, 240 GHz; Virginia Diodes, Inc.) for cw or low-power-pulsed operation. Alternatively, ITST’s free electron laser may be used as a source for kW power, s-length pulses. A wiregrid polarizer at the end of the quasioptical bridge reflects the polarized 240 GHz radiation into a 1.2 m gold-plated corrugated waveguide that is coupled to the sample space. On resonance, the radiation that is reflected by the sample acquires a small, orthogonally-polarized component (“cross-polar”) that is the EPR signal of interest. This signal is transmitted through the wiregrid at the end of the bridge, received by a WR3.4 Schottky-diode based subharmonic mixer (Virginia Diodes, Inc.), and subsequently mixed down to 10 GHz (see Fig. 2). The 10 GHz signal must be limited to no more than dBm in order to avoid saturating IF stage mixers and distorting the resulting EPR signal. Ideally, all the microwaves (mw) with polarization matching the incident radiation (“co-polar”) are reflected back toward the source, and do not reach the receiver. However, without the rooftop mirror, enough co-polar radiation reaches the receiver that both the signal and co-polar leakage must be attenuated by a variable attenuator. This attenuation degrades the SNR, especially if the noise figure of subsequent IF amplifiers is greater than the noise of the attenuated IF signal. When utilizing the rooftop end mirror [40], cross-polar isolation (the ratio of the desired cross-polar signal to the undesired co-polar signal) is greatly improved and the variable attenuator can be adjusted to attenuate much less IF power while still limiting it to dBm, resulting in improved SNR.
Design of Sample Holder
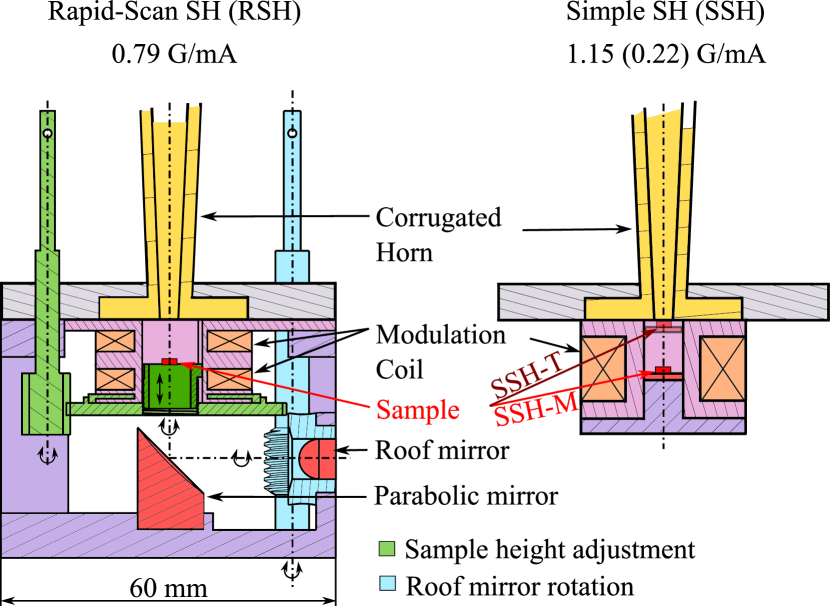
The quasioptical sample holder (QSH) was designed with a broad range of applications and user-friendliness in mind. In the case of the simple sample holder, which is similar to those used in many hfEPR spectrometers, the sample is placed close to the corrugated waveguide output at the top of the modulation coil (Fig. 3, “SSH-T”) or on a mirror in the center of the modulation coil (Fig. 3, “SSH-M”). For pulsed EPR, the SSH-T position is used in order to minimize mw loss due to divergence of the incoming Gaussian beam. For rapid-scan and cwEPR, the SSH-M position is used to obtain the largest and maximally homogeneous modulation field at the sample space.
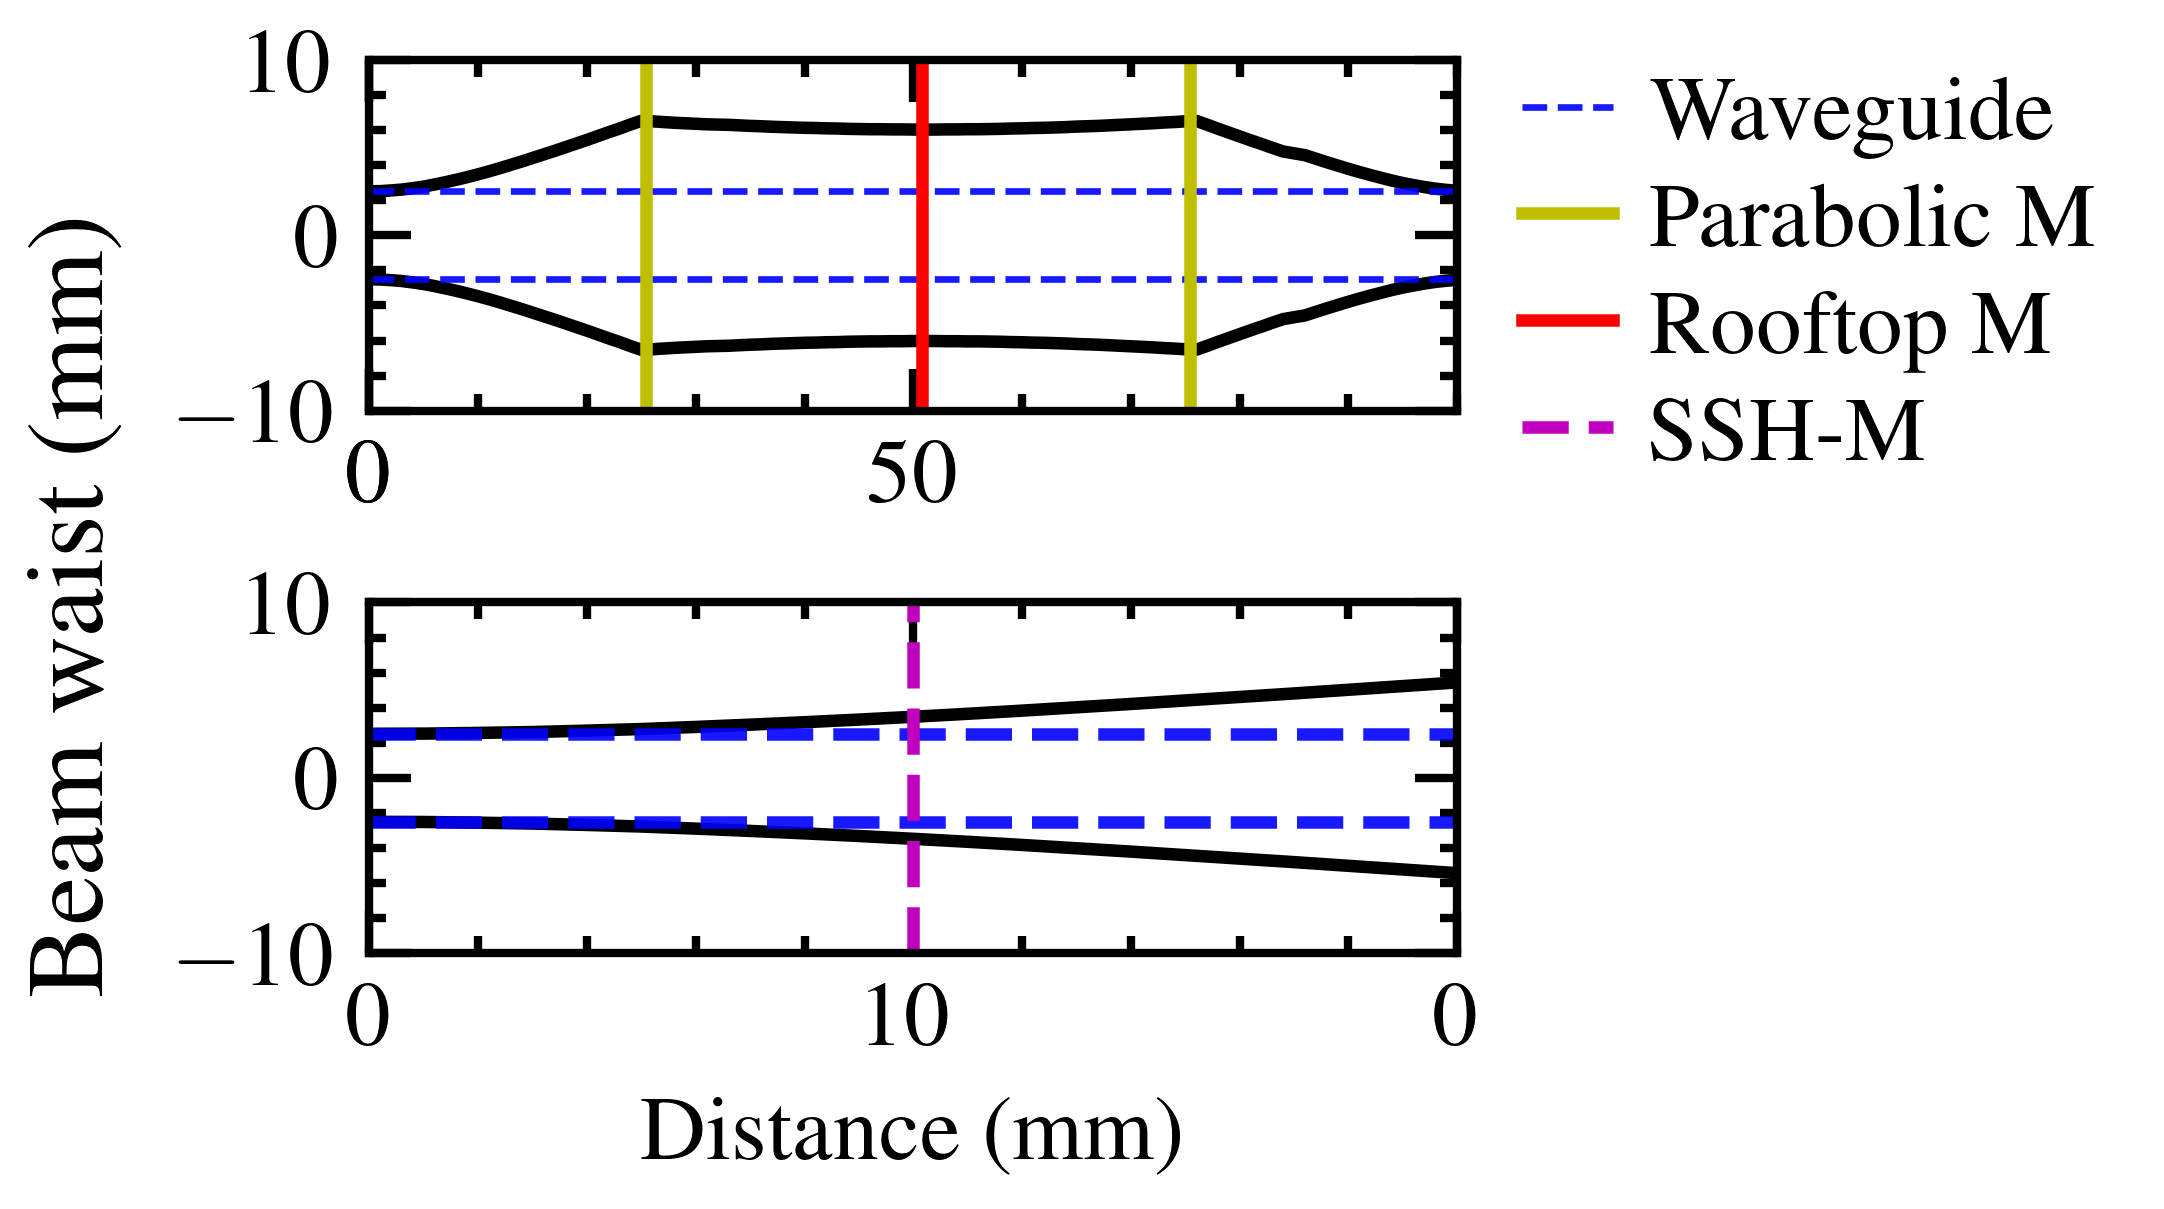
Our frequency-independent design for the QSH employs focusing quasioptics to ensure the beam waist is kept within the sample holder’s specified optical path, reducing mw beam clipping due to the waveguide aperture. Additionally, the quasioptical design does not require a waveguide or end mirror within its modulation coil, which eliminates eddy currents inside the coil, and results in an improvement of field modulation amplitude and homogeneity. It is also capable of increasing cross-polar isolation and, therefore, reducing attenuation required for the IF stage which improves SNR. The QSH contains a focusing parabolic mirror (MPD019-M03, Thorlabs Inc., USA) mounted along the axis of the corrugated wave guide. Inspired by previous work showing that precise, sub-degree rotation of a rooftop end mirror can result in 30 dB of additional cross-polar isolation [40], we have also mounted a machined Aluminium rooftop mirror at the focus of the parabolic mirror. A Gaussian beam-waist simulation [49] of the parabolic mirrors and rooftop mirror is shown in Fig. 4.
The QSH also allows for positioning the center of the sample at a maximum of the magnetic field of the applied mw () through rotation of a spur gear assembly. The sample rests on 12.7 m-thick Mylar film that is glued to a slot-guided, threaded shaft. Rotation of the spur gear is translated into linear motion of the threaded shaft along the applied mw axis.
The combination of increasing cross-polar isolation and maximizing results in an improvement of SNR, especially in the case of multilayer samples in which the sample bulk may lie at a magnetic field minimum and provide less-than-ideal SNR (e.g. [50, 51]). Translation along the mw axis is not necessary in the case of the SSH, as the standing wave condition ensures that an electric field node (and magnetic field antinode) appears on the surface of the mirror.
The QSH was designed for 3D-printing; the testing prototype and gears were 3D-printed from polylactic acid (PLA) by an Original Prusa i3 MK3S+ (Prusa Research s.r.o., CZ). The sample holder was attached to the EPR probe by screws; all screw threads were tapped post-print. The holder was initially designed for room temperature experiments, but with a different printing substrate (e.g., nylon-based filament), liquid nitrogen temperatures should be easily achievable.
The modulation coil was wound from Cu 32 AWG wire. We employed a Helmholtz modulation coil to get direct access to the sample space. Sample space access is necessary for optical excitation in experiments similar to those presented in Ref. [51] and may also allow for fast sample loading in future designs. The coil was calibrated using a reference sample of LiPc (see S.I. Fig. LABEL:fig:Modulation).
III Experimental Results
The QSH was tested with three different samples and EPR modes (see Table I): a solution of 100 M Gadolinium chloride in D2O by cwEPR, a diamond crystal with nitrogen substitutional defects (P1 centers) by pulsed EPR, and a single crystal of LiPc by rapid-scan EPR. The measurements were compared with those done with the SSH, in both the SSH-M and SSH-T positions. The QSH experiments were done with a flat (QSH-FM) and rooftop end mirror (QSH-RM) for comparison.
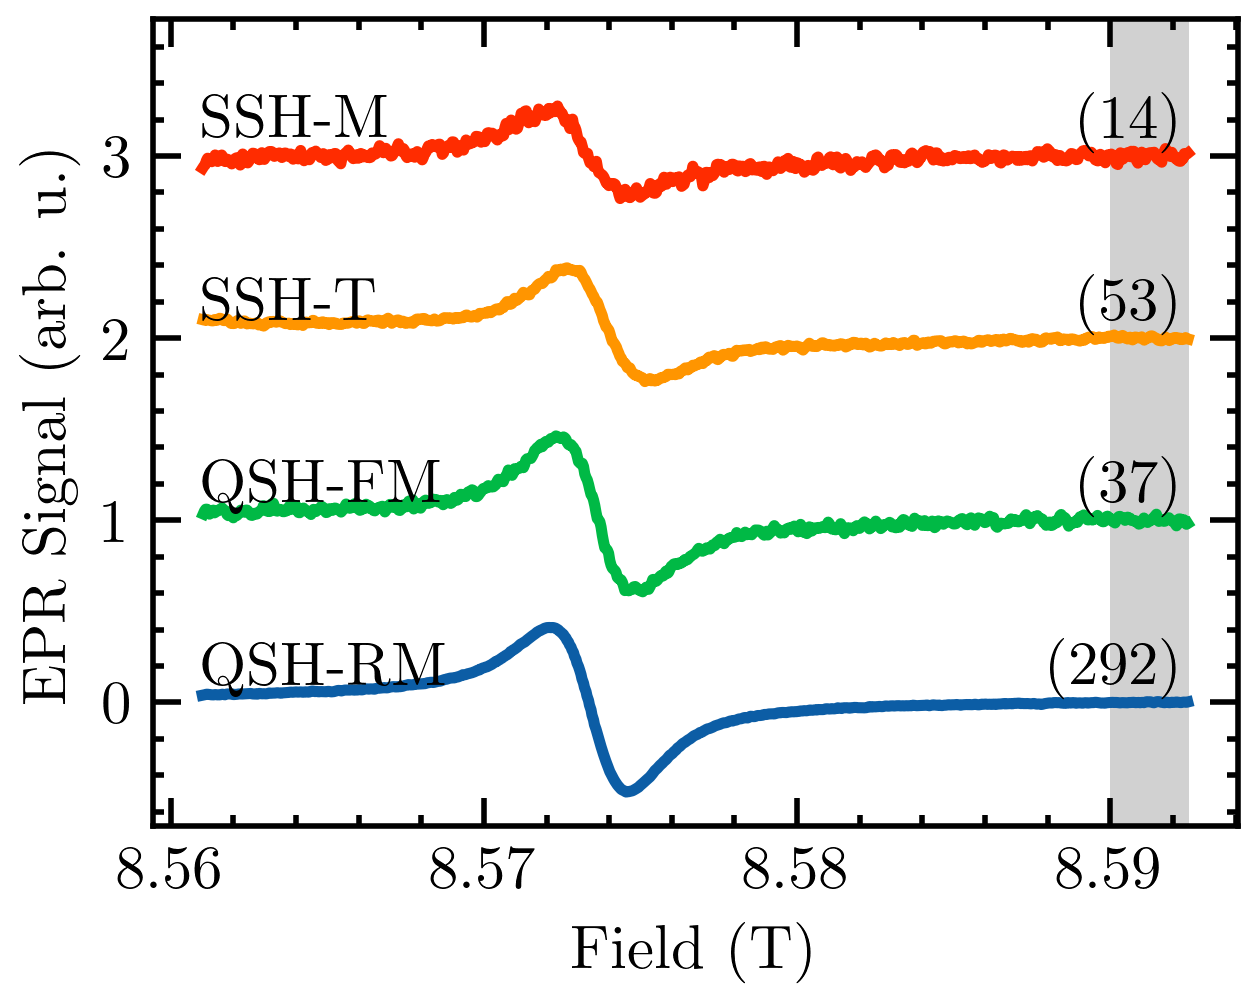
III-A Continuous wave EPR
cwEPR was performed on 100 M GdCl3 dissolved in D2O. The GdCl3 solution was inserted into a 100 m-thick, 2-by-5 mm borosilicate glass capillary (VitroCom, Mountain Lakes, NJ) in order to maximize the ratio of surface area to thickness, and sealed with wax [50]. The modulated signal was amplified using a lock-in detector (SR830, Stanford Research Systems) and is shown in Fig. 5. The SNR was best in the case of QSH-RM () because of our ability to minimize the co-polar baseline while also maximizing the spin response by optimizing the sample position. Next best was SSH-T (), due to the near-zero mw losses as a result of the mirror being placed directly at the end of the waveguide. SSH-M had the lowest SNR (): this is due to mw losses as a result of divergence of the Gaussian beam. QSH-FM () had an SNR greater than that of SSH-M because it was able to reduce divergence loss with focusing quasioptics, but, as expected, still had more divergence loss than SSH-T, which had no free-space propagation.
III-B Pulsed EPR
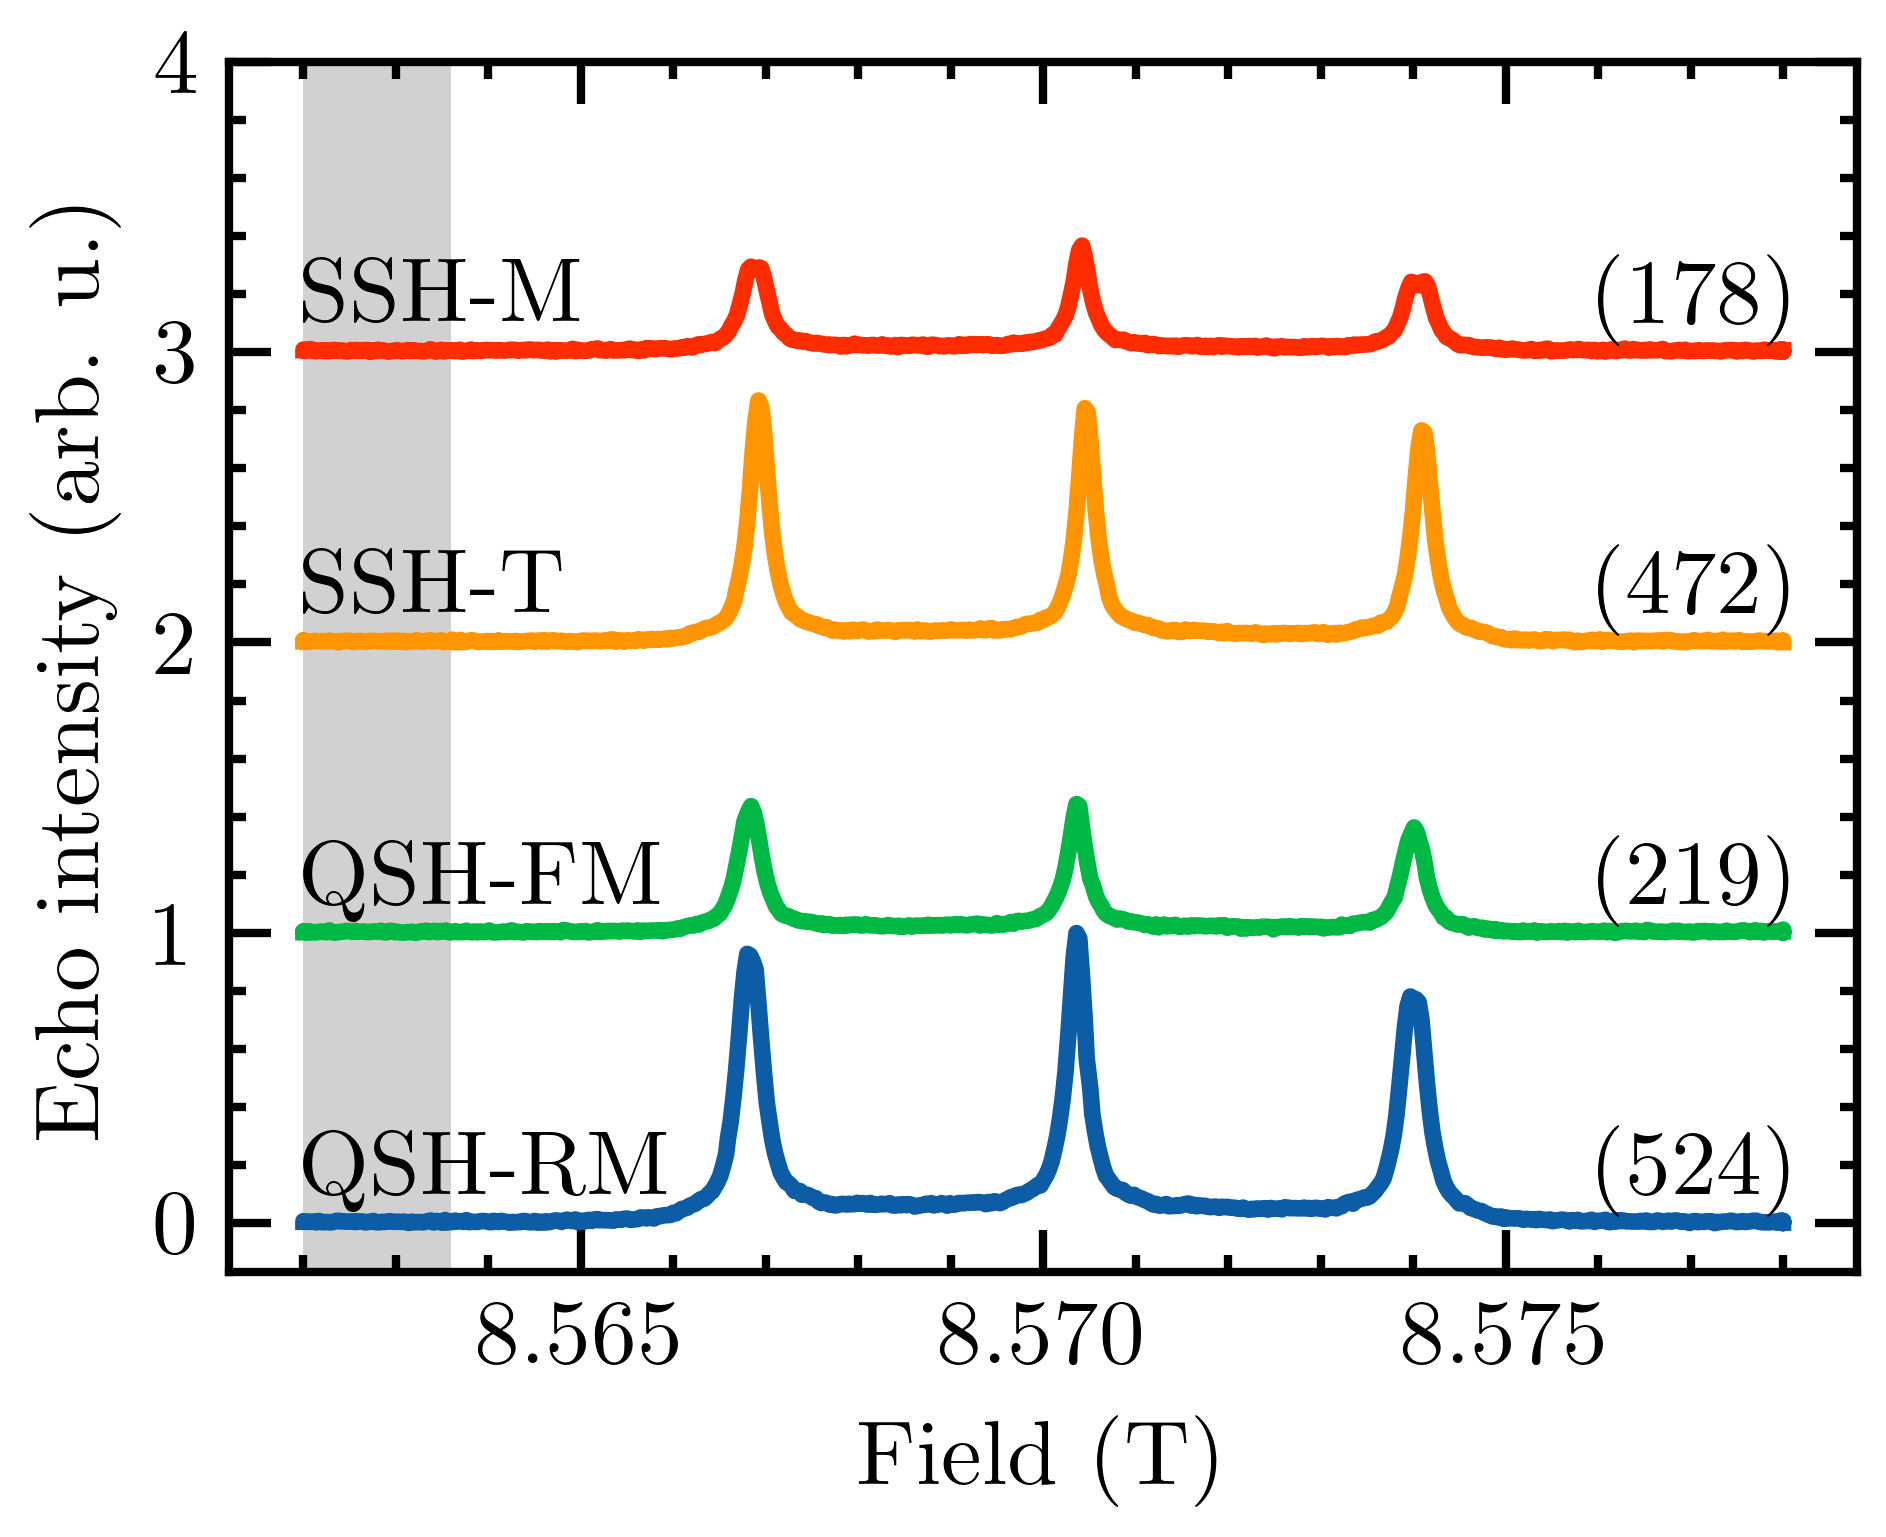
Pulsed EPR was performed at 240 GHz on P1 nitrogen vacancy centers in a diamond crystal using a cw 60 mW Virginia Diodes Inc. source that was pulsed using a fast PIN diode switch (SWM-0JV-1DT-2ATT, American Microwave Corporation, USA). A Hahn echo pulse sequence, consisting of a 600 ns excitation pulse, 1.2 s delay time, and 800 ns refocusing pulse was used to create a spin echo. The pulse sequence was repeated at 1 kHz and averaged over 512 repetitions per field position. Integrated echo intensity was recorded as a function of field and plotted in Fig. 6. The results from each sample holder were quite similar. The SSH-M performed the worst () because its long optical path length and beam divergence cause clipping at the waveguide aperture (see Fig. 4). The SSH-T did not suffer from this clipping, and therefore performed second best (). The QSH-FM () and the QSH-RM () should have performed similarly, as the co-polar background cannot obscure the cross-polar signal after the pulse sequence has occurred. However, optimizing the roof mirror angle for the maximum Hahn echo improved SNR and allowed the QSH-RM to perform the best overall.
III-C Rapid-scan EPR
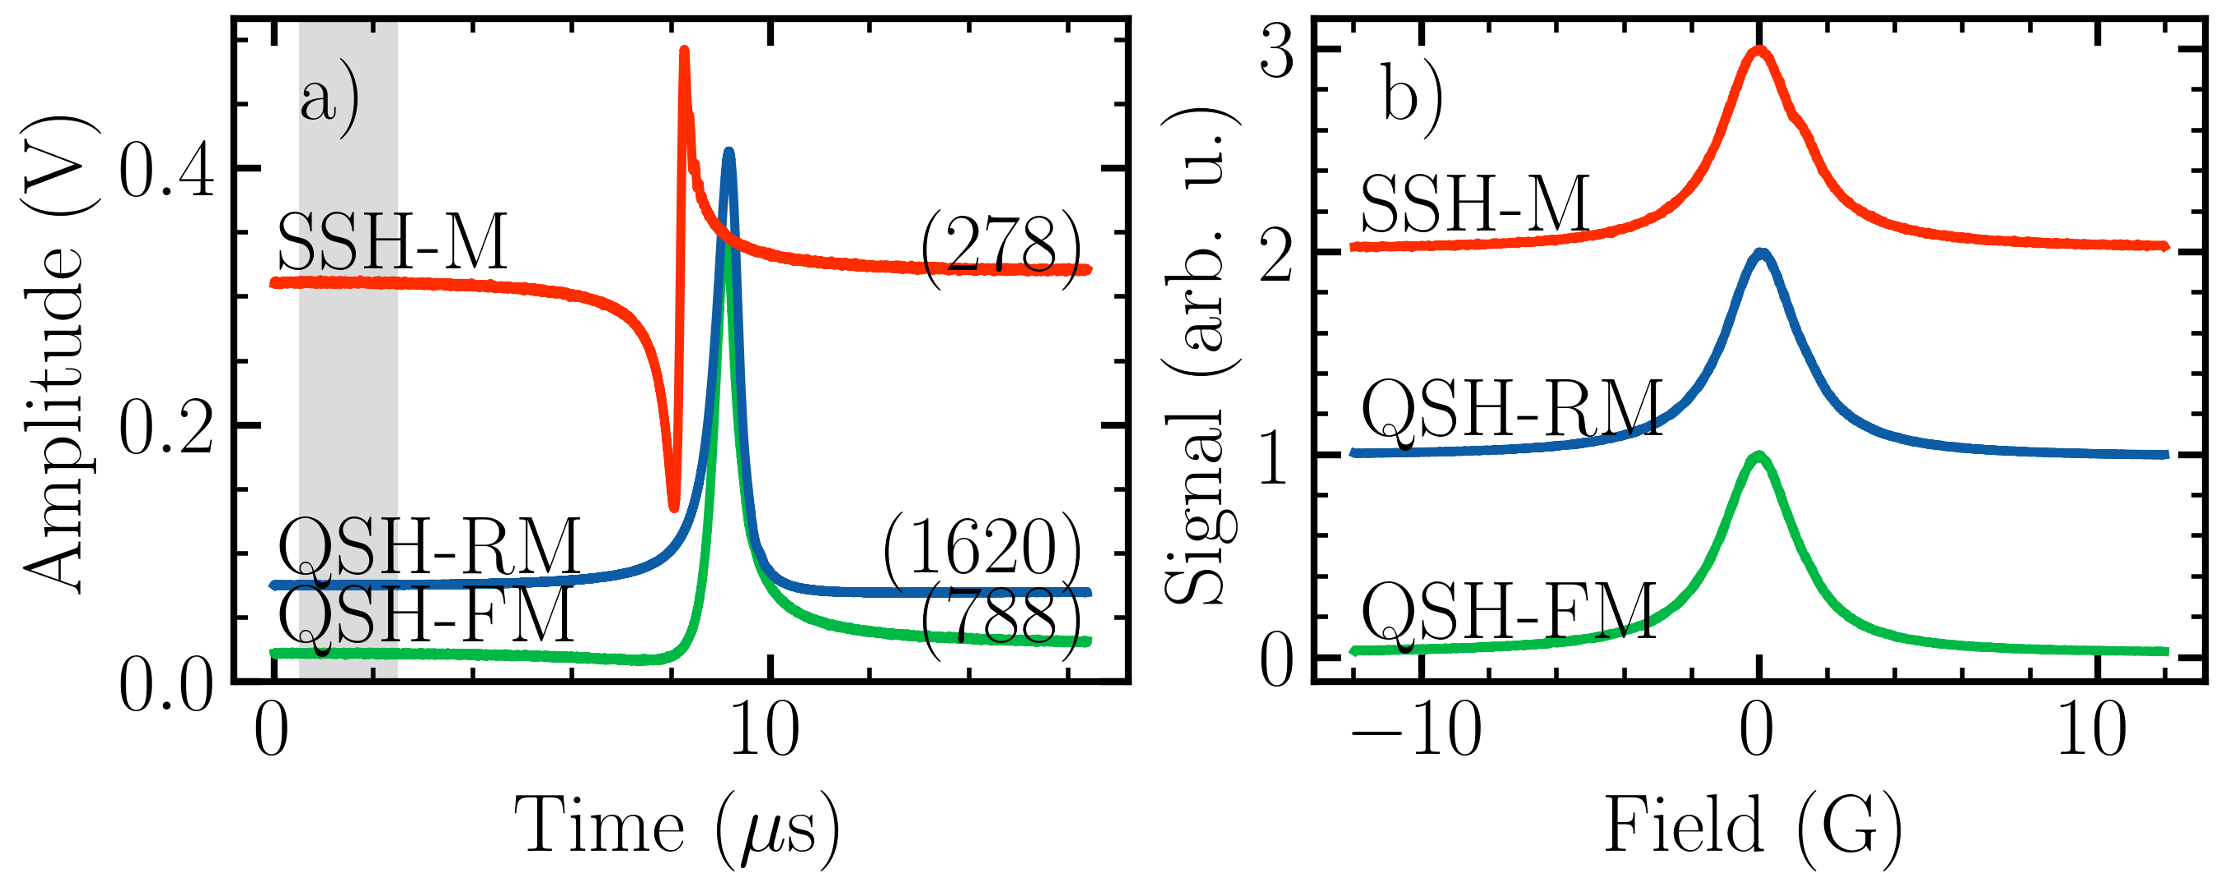
Rapid-scan EPR was performed on a needle of LiPc at 240 GHz in three sample sample holders (SSH-M, QSH-FM, QSH-RM). Rapid-scan SSH-T experiments were not performed because the modulation field strength (approx. 16 G tip-to-trough, see S.I. Fig. LABEL:fig:Modulation) was insufficient to entirely sweep the LiPc resonance. In order to maximize the improvements, in the case of the QSH-FM, the sample position was varied until the signal-to-baseline ratio was maximized. For the QSH-RM, a two-step optimization was performed: first, with the magnetic field tuned to resonance, the sample position was varied until the signal-to-baseline ratio was maximized; next, with the magnetic field off resonance, the rooftop mirror was rotated to minimize the power received by the induction mode detector. This procedure minimized the baseline and maximized the ratio of cross-polar to co-polar signal. The rooftop mirror increased the cross-polar isolation from 30 dB to dB.
As shown in Table I and Fig. 7, the SNR of the QSH represented an improvement over the SSH. In the QSH-FM, the SNR improved by approximately over the SSH (). After replacing the end mirror with a rooftop mirror (QSH-RM) the SNR was improved by an additional (), for a total improvement of ().
IV Discussion
The QSH showed SNR improvements for all three EPR experimental techniques: cw, rapid-scan, and pulsed. In the case of cw and rapid-scan EPR, reducing the baseline is critical for improving the SNR. In this case, the rooftop mirror provides a significant benefit. It is capable of improving co-polar isolation by dB (from 30 dB to dB) and SNR by around 6, when compared to the best possible configuration using the SSH. It is worth noting that the results presented here were established using a rooftop mirror end-milled from an aluminum rod. Precise finishing or gold-coating the rooftop surface may provide improved reflectivity and therefore reduced scattering; this may allow for even greater co-polar isolation and SNR improvements. Additionally, the QSH benefited cw and rapid-scan by allowing the sample to be placed in the middle of the modulation coil where the best possible performance could be achieved.
In pulsed EPR, the signal is usually detected after the excitation is turned off, which makes co-polar leakage a smaller concern than in the othe two modes. Therefore, in this mode, the sample is placed as close as possible to the waveguide to limit losses due to Gaussian beam propagation. Such losses cannot be avoided in the QSH-FM/RM, but they can be partially mitigated by the parabolic focusing mirrors. Nevertheless, even for the Hahn echo experiment presented here, the QSH-RM was able to improve SNR by 15%. In order to achieve this improvement, the polarization of the echo was slightly rotated to better couple with the induction mode quasioptics, and the sample was positioned at a magnetic field maximum.
Future work for the QSH-RM includes improving the reflectivity of the end-milled rooftop mirror, incorporating a fast-loading sample design, and identifying and optimizing a new 3D-printing substrate that is capable of handling liquid nitrogen temperatures for cryogenic experiments. It may also be beneficial to implement a piezo-electric rotator in place of the manual rotation knob in order to optimize sample position and rooftop mirror angle repeatably and automatically. Further, the QSH may provide an avenue to greatly reduce dead-time of pulsed EPR using high power mw sources such as ITST’s free electron laser (FEL).
| SH config. | CW | Pulsed | RS | Ins. loss (dB) |
|---|---|---|---|---|
| Sample | Gd(III) | P1 Dia. | LiPc | – |
| SSH-M | 14 | 178 | 278 | 4.180.2 |
| SSH-T | 53 | 472 | – | 2.670.4 |
| QSH-FM | 37 | 219 | 788 | 1.840.6 |
| QSH-RM | 292 | 524 | 1620 | 1.530.4 |
V Sample details
P1 diamond
The diamond sample was a 5mm-by-5mm-by-1mm type 1b diamond crystal with substitutional nitrogen (“P1”) defects. Estimated P1 concentration is approximately 625 ppm [50]. The crystal was adhered to its mount using Apiezon© vacuum grease (sample mount was a flat mirror in the case of the simple SH, and a 12.7 m piece of Mylar® film in the case of the QSH).
Gadolinium(III) chloride
Gadolinium chloride was bought from Sigma Aldrich and dissolved in D2O with a concentration of 1 mM and then diluted to 100 M. The spectra shown in Fig. 5 were recorded without sample degassing. The capillary rested on its mount and stayed in position due to gravity (sample mount was a flat mirror in the case of SSH, and a 12.7 m piece of Mylar® film in the case of the QSH).
Lithium phthalocyanine (LiPc)
LiPc in micro crystalline form was prepared electrochemically following a procedure described in the literature [53, 54]. A crystal sample was obtained from Mark Tseytlin (West Virginia University). A sharp single needle was adhered to its mount using Apiezon© vacuum grease (sample mount was a flat mirror in the case of the simple SH, and a 12.7 m piece of Mylar® film in the case of the QSH).
VI Conclusion
In this paper, we demonstrated a rapidly prototyped, cost-efficient 3D-printed sample holder that is capable of greatly improving the SNR of cw and rapid-scan EPR by reducing co-polar leakage and optimizing sample position to a antinode. Co-polar isolation was improved by a factor of dB and SNR was improved by approximately 6, representing a 36 reduction in signal acquisition time for comparable SNR. For cw or rapid-scan experiments with low spin concentrations, a reduction in required acquisition time may enable experiments that are otherwise inaccessible.
The sample holder presented here represents an easy-to-implement solution for improving the SNR of variety of homebuilt EPR spectrometer designs through custom-fit modifications of the .stp files included in the S.I. 3D-printed components enable simple incorporation into a variety of induction-mode hfEPR spectrometers and may provide a method to improve SNR in the field.
Acknowledgments
The authors would like to thank Dr. Nikolay Agladze for his thoughtful insight regarding quasioptical design and his assistance with Gaussian beam propagation simulations.
References
- [1] A. J. Weil and J. Bolton, Electron Paramagnetic Resonance: Elementary Theory and Practical Applications, 2nd ed. John Wiley & Sons, 2006.
- [2] J. H. Freed, “Electron Spin Resonance,” Annual Review of Physical Chemistry, vol. 23, no. 1, pp. 265–310, 1972, _eprint: https://doi.org/10.1146/annurev.pc.23.100172.001405. [Online]. Available: https://doi.org/10.1146/annurev.pc.23.100172.001405
- [3] F. J. Owens, “Paramagnetic resonance studies of phase transitions in condensed materials,” Phase Transitions, vol. 5, no. 2, pp. 81–137, Jul. 1985, publisher: Taylor & Francis _eprint: https://doi.org/10.1080/01411598508219149. [Online]. Available: https://doi.org/10.1080/01411598508219149
- [4] M. Farle and K. Baberschke, “Ferromagnetic order and the critical exponent for a Gd monolayer: An electron-spin-resonance study,” Physical Review Letters, vol. 58, no. 5, pp. 511–514, Feb. 1987, publisher: American Physical Society. [Online]. Available: https://link.aps.org/doi/10.1103/PhysRevLett.58.511
- [5] M. Che and E. Giamello, “Chapter 5 Electron Paramagnetic Resonance,” in Studies in Surface Science and Catalysis, ser. Spectroscopic Characterization of Heterogeneous Catalysts, J. L. G. Fierro, Ed. Elsevier, Jan. 1990, vol. 57, pp. B265–B332. [Online]. Available: https://www.sciencedirect.com/science/article/pii/S0167299108615165
- [6] J. H. Freed, “New Technologies in Electron Spin Resonance,” Annual Review of Physical Chemistry, vol. 51, no. 1, pp. 655–689, 2000, _eprint: https://doi.org/10.1146/annurev.physchem.51.1.655. [Online]. Available: https://doi.org/10.1146/annurev.physchem.51.1.655
- [7] B. Gallez, C. Baudelet, and B. F. Jordan, “Assessment of tumor oxygenation by electron paramagnetic resonance: principles and applications,” NMR in Biomedicine, vol. 17, no. 5, pp. 240–262, 2004, _eprint: https://onlinelibrary.wiley.com/doi/pdf/10.1002/nbm.900. [Online]. Available: https://onlinelibrary.wiley.com/doi/abs/10.1002/nbm.900
- [8] L. M. B. Napolitano, O. R. Nascimento, S. Cabaleiro, J. Castro, and R. Calvo, “Isotropic and anisotropic spin-spin interactions and a quantum phase transition in a dinuclear Cu(II) compound,” Physical Review B, vol. 77, no. 21, p. 214423, Jun. 2008, publisher: American Physical Society. [Online]. Available: https://link.aps.org/doi/10.1103/PhysRevB.77.214423
- [9] M. J. Davies, “Detection and characterisation of radicals using electron paramagnetic resonance (EPR) spin trapping and related methods,” Methods, vol. 109, pp. 21–30, Oct. 2016. [Online]. Available: https://www.sciencedirect.com/science/article/pii/S1046202316301438
- [10] K.-u.-R. Naveed, L. Wang, H. Yu, R. Summe Ullah, M. Haroon, S. Fahad, J. Li, T. Elshaarani, R. Ullah Khan, and A. Nazir, “Recent progress in the electron paramagnetic resonance study of polymers,” Polymer Chemistry, vol. 9, no. 24, pp. 3306–3335, 2018, publisher: Royal Society of Chemistry. [Online]. Available: https://pubs.rsc.org/en/content/articlelanding/2018/py/c8py00689j
- [11] S. A. Bonke, T. Risse, A. Schnegg, and A. Brückner, “In situ electron paramagnetic resonance spectroscopy for catalysis,” Nature Reviews Methods Primers, vol. 1, no. 1, pp. 1–20, May 2021, number: 1 Publisher: Nature Publishing Group. [Online]. Available: https://www.nature.com/articles/s43586-021-00031-4
- [12] S. Hill, S. Maccagnano, K. Park, R. M. Achey, J. M. North, and N. S. Dalal, “Detailed single-crystal EPR line shape measurements for the single-molecule magnets Fe8Br and Mn12-acetate,” Physical Review B, vol. 65, no. 22, p. 224410, May 2002, publisher: American Physical Society. [Online]. Available: https://link.aps.org/doi/10.1103/PhysRevB.65.224410
- [13] A. Schnegg, J. Behrends, K. Lips, R. Bittl, and K. Holldack, “Frequency domain Fourier transform THz-EPR on single molecule magnets using coherent synchrotron radiation,” Physical Chemistry Chemical Physics, vol. 11, no. 31, pp. 6820–6825, 2009, publisher: Royal Society of Chemistry. [Online]. Available: https://pubs.rsc.org/en/content/articlelanding/2009/cp/b905745e
- [14] S. Datta, E. Bolin, R. Inglis, C. J. Milios, E. K. Brechin, and S. Hill, “A comparative EPR study of high- and low-spin Mn6 single-molecule magnets,” Polyhedron, vol. 28, no. 9, pp. 1788–1791, Jun. 2009. [Online]. Available: https://www.sciencedirect.com/science/article/pii/S0277538708006785
- [15] S. Ghosh, S. Datta, L. Friend, S. Cardona-Serra, A. Gaita-Ariño, E. Coronado, and S. Hill, “Multi-frequency EPR studies of a mononuclear holmium single-molecule magnet based on the polyoxometalate [Ho(W5O18)2]9-,” Dalton Transactions, vol. 41, no. 44, pp. 13 697–13 704, 2012, publisher: Royal Society of Chemistry. [Online]. Available: https://pubs.rsc.org/en/content/articlelanding/2012/dt/c2dt31674a
- [16] M. S. Fataftah, S. L. Bayliss, D. W. Laorenza, X. Wang, B. T. Phelan, C. B. Wilson, P. J. Mintun, B. D. Kovos, M. R. Wasielewski, S. Han, M. S. Sherwin, D. D. Awschalom, and D. E. Freedman, “Trigonal Bipyramidal V3+ Complex as an Optically Addressable Molecular Qubit Candidate,” Journal of the American Chemical Society, vol. 142, no. 48, pp. 20 400–20 408, Dec. 2020, publisher: American Chemical Society. [Online]. Available: https://doi.org/10.1021/jacs.0c08986
- [17] L. Sun, S. Zhang, S. Chen, B. Yin, Y. Sun, Z. Wang, Z. Ouyang, J. Ren, W. Wang, Q. Wei, G. Xie, and S. Gao, “A two-dimensional cobalt(II) network with a remarkable positive axial anisotropy parameter exhibiting field-induced single-ion magnet behavior,” Journal of Materials Chemistry C, vol. 4, no. 33, pp. 7798–7808, 2016, publisher: Royal Society of Chemistry. [Online]. Available: https://pubs.rsc.org/en/content/articlelanding/2016/tc/c6tc02234k
- [18] S. Realista, A. J. Fitzpatrick, G. Santos, L. P. Ferreira, S. Barroso, L. C. J. Pereira, N. A. G. Bandeira, P. Neugebauer, J. Hrubý, G. G. Morgan, J. v. Slageren, M. J. Calhorda, and P. N. Martinho, “A Mn(III) single ion magnet with tridentate Schiff-base ligands,” Dalton Transactions, vol. 45, no. 31, pp. 12 301–12 307, 2016, publisher: Royal Society of Chemistry. [Online]. Available: https://pubs.rsc.org/en/content/articlelanding/2016/dt/c6dt02538b
- [19] K. S. Pedersen, A.-M. Ariciu, S. McAdams, H. Weihe, J. Bendix, F. Tuna, and S. Piligkos, “Toward Molecular 4f Single-Ion Magnet Qubits,” Journal of the American Chemical Society, vol. 138, no. 18, pp. 5801–5804, May 2016, publisher: American Chemical Society. [Online]. Available: https://doi.org/10.1021/jacs.6b02702
- [20] M. D. Jenkins, Y. Duan, B. Diosdado, J. J. García-Ripoll, A. Gaita-Ariño, C. Giménez-Saiz, P. J. Alonso, E. Coronado, and F. Luis, “Coherent manipulation of three-qubit states in a molecular single-ion magnet,” Physical Review B, vol. 95, no. 6, p. 064423, Feb. 2017, publisher: American Physical Society. [Online]. Available: https://link.aps.org/doi/10.1103/PhysRevB.95.064423
- [21] G. Handzlik, M. Magott, M. Arczyński, A. M. Sheveleva, F. Tuna, S. Baran, and D. Pinkowicz, “Identical anomalous Raman relaxation exponent in a family of single ion magnets: towards reliable Raman relaxation determination?” Dalton Transactions, vol. 49, no. 34, pp. 11 942–11 949, 2020, publisher: Royal Society of Chemistry. [Online]. Available: https://pubs.rsc.org/en/content/articlelanding/2020/dt/d0dt02439b
- [22] E. Coronado, “Molecular magnetism: from chemical design to spin control in molecules, materials and devices,” Nature Reviews Materials, vol. 5, no. 2, pp. 87–104, Feb. 2020, number: 2 Publisher: Nature Publishing Group. [Online]. Available: https://www.nature.com/articles/s41578-019-0146-8
- [23] K. A. Earle, D. E. Budil, and J. H. Freed, “250-GHz EPR of nitroxides in the slow-motional regime: models of rotational diffusion,” The Journal of Physical Chemistry, vol. 97, no. 50, pp. 13 289–13 297, Dec. 1993. [Online]. Available: https://pubs.acs.org/doi/abs/10.1021/j100152a037
- [24] Y. S. Lebedev, “Very-high-field EPR and its applications,” Applied Magnetic Resonance, vol. 7, no. 2, pp. 339–362, Oct. 1994. [Online]. Available: https://doi.org/10.1007/BF03162619
- [25] K. K. Andersson, P. P. Schmidt, B. Katterle, K. R. Strand, A. E. Palmer, S.-K. Lee, E. I. Solomon, A. Gräslund, and A.-L. Barra, “Examples of high-frequency EPR studies in bioinorganic chemistry,” JBIC Journal of Biological Inorganic Chemistry, vol. 8, no. 3, pp. 235–247, Feb. 2003. [Online]. Available: https://doi.org/10.1007/s00775-002-0429-0
- [26] S. Foner, “High-Field Antiferromagnetic Resonance in Cr2o3,” Physical Review, vol. 130, no. 1, pp. 183–197, Apr. 1963, publisher: American Physical Society. [Online]. Available: https://link.aps.org/doi/10.1103/PhysRev.130.183
- [27] J. Li, C. B. Wilson, R. Cheng, M. Lohmann, M. Kavand, W. Yuan, M. Aldosary, N. Agladze, P. Wei, M. S. Sherwin, and J. Shi, “Spin current from sub-terahertz-generated antiferromagnetic magnons,” Nature, vol. 578, no. 7793, pp. 70–74, Feb. 2020, number: 7793 Publisher: Nature Publishing Group. [Online]. Available: https://www.nature.com/articles/s41586-020-1950-4
- [28] S. B. Oseroff, “Magnetic susceptibility and EPR measurements in concentrated spin-glasses: Cd1-xmnxte and cd1-xmnxse,” Physical Review B, vol. 25, no. 11, pp. 6584–6594, Jun. 1982, publisher: American Physical Society. [Online]. Available: https://link.aps.org/doi/10.1103/PhysRevB.25.6584
- [29] H. Martinho, N. O. Moreno, J. A. Sanjurjo, C. Rettori, A. J. García-Adeva, D. L. Huber, S. B. Oseroff, W. Ratcliff, S.-W. Cheong, P. G. Pagliuso, J. L. Sarrao, and G. B. Martins, “Magnetic properties of the frustrated antiferromagnetic spinel ZnCrO and the spin-glass ZnCdCrO (x=0.05,0.10),” Physical Review B, vol. 64, no. 2, p. 024408, Jun. 2001, publisher: American Physical Society. [Online]. Available: https://link.aps.org/doi/10.1103/PhysRevB.64.024408
- [30] B. D. Armstrong, D. T. Edwards, R. J. Wylde, S. A. Walker, and S. Han, “A 200 GHz dynamic nuclear polarization spectrometer,” Physical Chemistry Chemical Physics, vol. 12, no. 22, pp. 5920–5926, 2010, publisher: Royal Society of Chemistry. [Online]. Available: https://pubs.rsc.org/en/content/articlelanding/2010/cp/c002290j
- [31] S. A. Walker, D. T. Edwards, T. A. Siaw, B. D. Armstrong, and S. Han, “Temperature dependence of high field 13C dynamic nuclear polarization processes with trityl radicals below 35 Kelvin,” Physical Chemistry Chemical Physics, vol. 15, no. 36, p. 15106, 2013. [Online]. Available: http://xlink.rsc.org/?DOI=c3cp51628h
- [32] G. R. Eaton and S. S. Eaton, “High-field and high-frequency EPR,” Applied Magnetic Resonance, vol. 16, no. 2, pp. 161–166, Feb. 1999. [Online]. Available: https://doi.org/10.1007/BF03161931
- [33] J. van Tol, L.-C. Brunel, and R. J. Wylde, “A quasioptical transient electron spin resonance spectrometer operating at 120 and 240 GHz,” Review of Scientific Instruments, vol. 76, no. 7, p. 074101, Jul. 2005, publisher: American Institute of Physics. [Online]. Available: https://aip.scitation.org/doi/full/10.1063/1.1942533
- [34] S. Takahashi, L.-C. Brunel, D. T. Edwards, J. van Tol, G. Ramian, S. Han, and M. S. Sherwin, “Pulsed electron paramagnetic resonance spectroscopy powered by a free-electron laser,” Nature, vol. 489, no. 7416, pp. 409–413, Sep. 2012, number: 7416 Publisher: Nature Publishing Group. [Online]. Available: https://www.nature.com/articles/nature11437
- [35] P. Neugebauer, D. Bloos, R. Marx, P. Lutz, M. Kern, D. Aguilà, J. Vaverka, O. Laguta, C. Dietrich, R. Clérac, and J. v. Slageren, “Ultra-broadband EPR spectroscopy in field and frequency domains,” Physical Chemistry Chemical Physics, vol. 20, no. 22, pp. 15 528–15 534, 2018, publisher: Royal Society of Chemistry. [Online]. Available: https://pubs.rsc.org/en/content/articlelanding/2018/cp/c7cp07443c
- [36] A. Sojka, M. Šedivý, O. Laguta, A. Marko, V. T. Santana, and P. Neugebauer, “High-frequency EPR: current state and perspectives,” in Electron Paramagnetic Resonance: Volume 27, V. Chechik, D. M. Murphy, and B. E. Bode, Eds. The Royal Society of Chemistry, Nov. 2020, vol. 27, p. 0. [Online]. Available: https://doi.org/10.1039/9781839162534-00214
- [37] W. Froncisz and J. S. Hyde, “The loop-gap resonator: a new microwave lumped circuit ESR sample structure,” Journal of Magnetic Resonance (1969), vol. 47, no. 3, pp. 515–521, 1982, publisher: Academic Press.
- [38] W. M. Walsh and L. W. Rupp, “Enhanced ESR sensitivity using a dielectric resonator,” Review of Scientific Instruments, vol. 57, no. 9, pp. 2278–2279, Sep. 1986. [Online]. Available: http://aip.scitation.org/doi/10.1063/1.1138697
- [39] R. Tschaggelar, F. D. Breitgoff, O. Oberhänsli, M. Qi, A. Godt, and G. Jeschke, “High-Bandwidth Q-Band EPR Resonators,” Applied Magnetic Resonance, vol. 48, no. 11, pp. 1273–1300, Dec. 2017. [Online]. Available: https://doi.org/10.1007/s00723-017-0956-z
- [40] P. A. S. Cruickshank, D. R. Bolton, D. A. Robertson, R. I. Hunter, R. J. Wylde, and G. M. Smith, “A kilowatt pulsed 94 GHz electron paramagnetic resonance spectrometer with high concentration sensitivity, high instantaneous bandwidth, and low dead time,” Review of Scientific Instruments, vol. 80, no. 10, p. 103102, Oct. 2009, publisher: American Institute of Physics. [Online]. Available: https://aip.scitation.org/doi/abs/10.1063/1.3239402
- [41] E. J. Reijerse, “High-Frequency EPR Instrumentation,” Applied Magnetic Resonance, vol. 37, no. 1, p. 795, Nov. 2009. [Online]. Available: https://doi.org/10.1007/s00723-009-0070-y
- [42] V. Stepanov, F. H. Cho, C. Abeywardana, and S. Takahashi, “High-frequency and high-field optically detected magnetic resonance of nitrogen-vacancy centers in diamond,” Applied Physics Letters, vol. 106, no. 6, p. 063111, Feb. 2015, publisher: American Institute of Physics. [Online]. Available: https://aip.scitation.org/doi/full/10.1063/1.4908528
- [43] A. Sojka, M. Šedivý, O. Laguta, A. Marko, V. T. Santana, and P. Neugebauer, “High-frequency EPR: Current state and perspectives,” Electron Paramagnetic Resonance, vol. 27, pp. 214–252, Nov. 2021, iSBN: 9781839161711 Publisher: Royal Society of Chemistry.
- [44] M. Schubert, S. Knight, S. Richter, P. Kühne, V. Stanishev, A. Ruder, M. Stokey, R. Korlacki, K. Irmscher, P. Neugebauer, and V. Darakchieva, “Terahertz electron paramagnetic resonance generalized spectroscopic ellipsometry: The magnetic response of the nitrogen defect in 4H-SiC,” Applied Physics Letters, vol. 120, no. 10, p. 102101, Mar. 2022, publisher: American Institute of Physics. [Online]. Available: https://aip.scitation.org/doi/full/10.1063/5.0082353
- [45] N. Abhyankar, A. Agrawal, J. Campbell, T. Maly, P. Shrestha, and V. Szalai, “Recent advances in microresonators and supporting instrumentation for electron paramagnetic resonance spectroscopy,” Review of Scientific Instruments, vol. 93, no. 10, p. 101101, Oct. 2022, publisher: American Institute of Physics. [Online]. Available: https://aip.scitation.org/doi/10.1063/5.0097853
- [46] S. S. Eaton, R. W. Quine, M. Tseitlin, D. G. Mitchell, G. A. Rinard, and G. R. Eaton, “Rapid-Scan Electron Paramagnetic Resonance,” in Multifrequency Electron Paramagnetic Resonance. John Wiley & Sons, Ltd, 2014, pp. 3–67. [Online]. Available: https://onlinelibrary.wiley.com/doi/abs/10.1002/9783527672431.ch2
- [47] “Thorlabs - MPD019-M03 Ø1/2” 90° Off-Axis Parabolic Mirror, Unprot. Gold, RFL = 1”.” [Online]. Available: https://www.thorlabs.com/thorproduct.cfm?partnumber=MPD019-M03
- [48] D. T. Edwards, Z. Ma, T. J. Meade, D. Goldfarb, S. Han, and M. S. Sherwin, “Extending the distance range accessed with continuous wave EPR with Gd3+ spin probes at high magnetic fields,” Physical Chemistry Chemical Physics, vol. 15, no. 27, p. 11313, 2013. [Online]. Available: http://xlink.rsc.org/?DOI=c3cp43787f
- [49] P. F. Goldsmith and others, Quasioptical systems. Chapman & Hall New York, NY, USA, 1998.
- [50] C. B. Wilson, “Adventures in High-field Electron Paramagnetic Resonance - ProQuest,” Physics, University of California, Santa Barbara, Santa Barbara, CA, Sep. 2019. [Online]. Available: https://www.proquest.com/openview/7a9f56291f699aaa88219f5f7bb920df/1?pq-origsite=gscholar&cbl=18750&diss=y
- [51] S. Maity, B. D. Price, C. B. Wilson, A. Mukherjee, M. Starck, D. Parker, M. Z. Wilson, J. E. Lovett, S. Han, and M. S. Sherwin, “Triggered Functional Dynamics of AsLOV2 by Time-Resolved Electron Paramagnetic Resonance at High Magnetic Fields,” Angewandte Chemie International Edition, vol. 62, no. 13, p. e202212832, 2023. [Online]. Available: https://onlinelibrary.wiley.com/doi/abs/10.1002/anie.202212832
- [52] M. Tseytlin, “General solution for rapid scan EPR deconvolution problem,” Journal of Magnetic Resonance, vol. 318, p. 106801, Sep. 2020. [Online]. Available: https://www.sciencedirect.com/science/article/pii/S1090780720301191
- [53] P. Turek, J.-J. André, A. Giraudeau, and J. Simon, “Preparation and study of a lithium phthalocyanine radical: optical and magnetic properties,” Chemical Physics Letters, vol. 134, no. 5, pp. 471–476, 1987.
- [54] M. Afeworki, N.-R. Miller, N. Devasahayam, J. Cook, J.-B. Mitchell, S. Subramanian, and M.-C. Krishna, “Preparation and EPR Studies of Lithium Phthalocyanine Radical as an Oxymetric Probe,” Free Radical Biology and Medicine, vol. 25, no. 1, pp. 72–78, 1998.
![[Uncaptioned image]](/html/2305.01820/assets/figures/AS.jpg) |
Antonin Sojka received his Bachelor’s and Master’s degrees from the Brno University of Technology, Czech Republic in 2016 and 2018. During this time, he designs and develop a novel Ultra High Vacuum Scanning Tunneling Microscope for in-situ measurement of molecule deposition of a variety of surfaces. He did his Ph.D. at the Central European Institute of Technology BUT since 2018 under the supervision of Petr Neugebauer in the group Magneto-Optical and Terahertz Spectroscopy (MOTES), where his main research interest is the development of High Field broad frequency ESR for relaxation studies with focused on rapid-scan technique. At the moment he is working on the development of new high-field EPR spectrometer power by FEL at the University of California, Santa Barbara. |
![[Uncaptioned image]](/html/2305.01820/assets/figures/brad_image.jpg) |
Brad D. Price received his BSc in Physics from the University of Northern British Columbia in 2019. He worked on developing techniques for non-destructive analysis of engineered wood products, as well as 3D-printed optics for sub-THz Gaussian-to-flat-top beam shaping under Dr. Matt Reid. He received his MA in Physics from the University of California, Santa Barbara in 2022 for his work on filming triggered functional dynamics of light-activated proteins using high-field EPR under Dr. Mark Sherwin. He is currently continuing his work on protein filming as well as developing high-field EPR instrumentation and techniques, which include free-electron laser and rapid-scan EPR. |
![[Uncaptioned image]](/html/2305.01820/assets/figures/Mark_Sherwin_resized.jpg) |
Mark S. Sherwin received his Ph.D. degree in experimental solid state physics from the University of California (UC), Berkeley, CA, USA, in 1988. He then joined the faculty of the Physics Department at UC Santa Barbara, CA, USA. He is the Director of the Institute for Terahertz Science and Technology at UC Santa Barbara, the home of the UC Santa Barbara Free-Electron Lasers. His research group focuses on driven quantum and biological matter. Current interests include terahertz mixers, the nonlinear response of semiconductors to intense terahertz radiation, high-field pulsed electron paramagnetic resonance, and the triggered functional dynamics of proteins. Dr. Sherwin is a Fellow of the American Physical Society. |