Magnetic inhomogeneities in the quadruple perovskite manganite \ce[Y_2-xMn_x]MnMnMn4O12
Abstract
A combination of competing exchange interactions and substitutional disorder gives rise to magnetic inhomogeneities in the \ce[Y_2-xMn_x]MnMnMn4O12 and quadruple perovskite manganites. Our neutron powder scattering measurements show that both the and samples separate into two distinct magnetic phases; below T1 = 120 10 K the system undergoes a transition from a paramagnetic phase to a phase characterised by short range antiferromagnetic clusters contained in a paramagnetic matrix, and below T2 65 K, the system is composed of well correlated long range collinear ferrimagnetic order, punctuated by short range antiferromagnetic clusters. A sharp increase in the antiferromagnetic phase fraction is observed below 33 K, concomitant with a decrease in the ferrimagnetic phase fraction. Our results demonstrate that the theoretically proposed AFM phase is stabilised in the \ce[Y_2-xMn_x]MnMnMn4O12 manganites in the presence of dominant B-B exchange interactions, as predicted.
Competing exchange interactions and disorder are two parameters that can be tuned to access a wide range of macroscopically distinct magnetic phases. For instance, disordered magnetic phases such as spin glasses arise from the presence of strong quenched disorder and competing exchange interactions. While unordered magnetic systems, such as spin liquids, typically arise from strong competing exchange and occur in the absence of quenched disorder. Competing exchange and disorder also form essential ingredients for realising Griffiths phases [1], which occur in magnetic systems when clusters of magnetic order form that are large enough to produce a singularity in the free energy [2, 3, 4]. Imaging and understanding the mathematical properties of such magnetic phases has shaped our understanding of neural networks [5] and complex matter [6], and continues to play an important role in demonstrating novel forms of complex behaviour [6].
An exemplary family of materials that demonstrate the interplay between disorder and competing exchange are the simple perovskite manganites. In the absence of any substitutional disorder, i.e for A3+MnO3, well ordered antiferromagnetic (AFM) ground state structures are stabilised. The introduction of hole doping, through the substitution of a divalent cation on the A sites, gives rise to an electronic texture that is inhomogeneous on the nanoscale. In general for \ceA(III)_1-xA'(II)_xMnO3 x 0.5, an insulator to metal phase transition is observed below TC, and the system is observed to order ferromagnetically in the metallic phase owing to the double exchange mechanism [7]. Numerous studies have found that there is a finite temperature interval that precedes the phase transition to ferromagnetic (FM) order, where the system is characterised by coexistence of paramagnetic insulating and FM metallic regions, a Griffiths phase [8, 9]. Here, charge doping causes the separation of these systems into the two distinct electronic phases, giving rise to the two magnetic phases and the establishment of a Griffiths phase. Furthermore for certain compositions of the mixed valence manganites [10], such as in \cePr_0.7Ca_0.3MnO3 [11], the randomly dispersed Mn4+ on the B-site sublattice give rise to short range metallic and insulating charge ordered regions below TC, which order ferromagnetically and antiferromagnetically respectively. The localisation of the charge in the insulating regions, and the corresponding orbital order give rise to antiferromagnetism as understood through the context of the Goodenough Kanamori Anderson rules [12]. The coexistence of the two electronically and magnetically ordered phases in the simple perovskite manganites is argued to be directly responsible for establishing colossal magnetoresistance [10, 13, 14, 15, 16], although this has yet to be proven [17, 18].
A similar picture is emerging in the columnar ordered quadruple perovskite manganites; competing exchange interactions and substitutional disorder are giving rise to a number of microscopically distinct magnetic phases. In the A2A'A''B4O12 (B = Mn) manganites the competing B-B and A-B exchange interactions have thus far given rise to well correlated magnetic structures on average. For instance in \ceTm2MnMnMn4O12 and \ceSm2MnMnMn_4-xTi_xO12 a long range ordered collinear ferrimagnetic (FIM) phase was observed [19, 20]. It was suggested that the system ordered on average to favour the exchange interactions of the greatest strength, A-B exchange, while the competing exchange interactions, AFM B-B exchange, manifested as spin fluctuations reducing the measured moment. Similarly in \ce2CuMnMn4O12( = Y or Dy), well correlated magnetic phases were observed, however owing to a reduction in the A-B exchange interactions, B-B exchange was accommodated by spin canting onto the B-site layers [21].
In this paper we show that the introduction of substitutional disorder on the A sites in the presence of the competing exchange interactions causes \ce[Y_2-xMn_x]MnMnMn4O12 and to separate into two distinct magnetic phases; a collinear FIM phase that is favoured by A-B exchange, and an AFM phase favoured by B-B exchange. In analogy to the introduction of charge doping in the simple perovskite manganites, the introduction of spin doping through the substitution of magnetic Mn ions for non magnetic Y3+, gives rise to a spin texture that is inhomogeneous on the nanoscale. In these systems we have observed the formation of short range AFM clusters contained in a paramagnetic matrix between T1 and T2. Below T2, a phase transition to well correlated long range FIM order was observed, which coexists with the short range AFM clusters. A sharp increase in the AFM phase fraction was observed below 33 K, concomitant with a decrease in the FIM phase fraction. We note that characterising such effects of spin doping is of significance, given recent trends to replace established electronic paradigms with spin-only functionality in future spintronic devices.
I Experimental Details
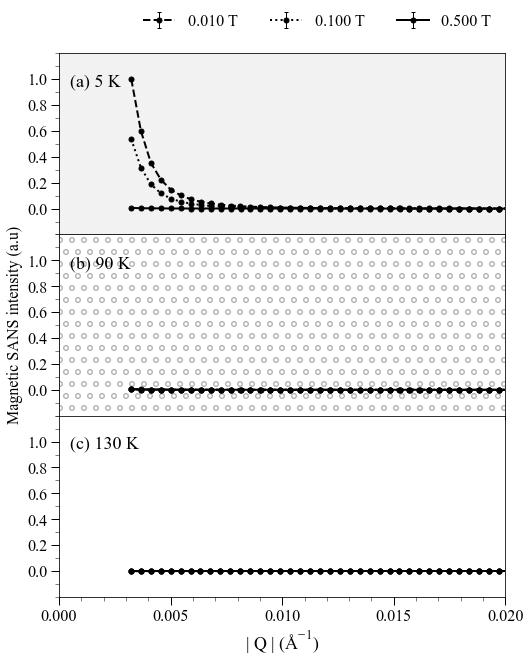
Y_1.840(7)Mn_0.160(8)MnMnMn4O12 () and \ceY_1.768(9)Mn_0.232(9)MnMnMn4O12 () powder samples were made from stoichiometric mixtures of \ceMn2O3 and \ceY2O3 (99.9%) using a high-temperature high-pressure synthesis method as detailed in Ref. [22]. DC magnetization measurements were performed on the samples using a SQUID magnetometer (Quantum Design, MPMS-XL-7T) between 2 and 400 K under both zero-field-cooled (ZFC) and field-cooled on cooling (FCC) conditions. Time of flight neutron powder diffraction (NPD) measurements were performed on 1.93 g of the sample and 1.51 g sample of the sample using the WISH diffractometer at ISIS [23]. Data with high counting statistics were collected at 1.5 K and 85 K for both samples; temperatures representative of each of the magnetically ordered phases. Data with lower counting statistics were collected for both samples on warming between 1.5 K and 85 K in 2 K and 5 K steps, between 90 K and 140 K in 10 K steps, and at 200 K and 250 K. Small angle neutron scattering (SANS) measurements were performed on D33 at the Institute Laue Langevin (ILL). Each of the samples listed above were pressed into a flat disc like pellet, and placed in an aluminium sample mount. Data was collected in a single detector setting for both samples (0.003Å Q 0.1Å-1 Q = 0.0005 Å-1), and at temperatures between 300 K and 5 K. Field dependent SANS measurements were performed on the sample with the magnetic field applied parallel to the incoming neutron beam, and data was collected at 5 K, 90 K and 130 K using fields of 0.01 T, 0.1 T and 0.5 T.
II Results
II.1 Neutron powder diffraction data
| Mode | (001) | {200} | (010) | (100) | (011) | (101) | (110) | (111) | (012) | (102) | (112) | (121) | (211) |
|---|---|---|---|---|---|---|---|---|---|---|---|---|---|
| A-sites | |||||||||||||
| 0 | 2 | 0 | 0 | 2 | 2 | 2 | 0 | 0 | 0 | 2 | 2 | 2 | |
| 2 | 0 | 2 | 2 | 0 | 0 | 0 | 2 | 2 | 2 | 0 | 0 | 0 | |
| B-sites | |||||||||||||
| 0 | 8 | 0 | 0 | 0 | 0 | 0 | 0 | 0 | 0 | 0 | 0 | 0 | |
| 8 | 0 | 0 | 0 | 0 | 0 | 0 | 0 | 0 | 0 | 0 | 0 | 0 | |
| 4 | 4 | 0 | 0 | 0 | 0 | 0 | 0 | 0 | 0 | 0 | 0 | 0 | |
| 0 | 0 | 0 | 0 | 0 | 0 | 8 | 0 | 0 | 0 | 8 | 0 | 0 | |
| 0 | 0 | 0 | 0 | 0 | 0 | 0 | 8 | 0 | 0 | 0 | 0 | 0 | |
| 0 | 0 | 0 | 0 | 0 | 0 | 4 | 4 | 0 | 0 | 4 | 0 | 0 | |
| 0 | 0 | 0 | 8 | 0 | 0 | 0 | 0 | 0 | 8 | 0 | 0 | 0 | |
| 0 | 0 | 0 | 0 | 0 | 8 | 0 | 0 | 0 | 0 | 0 | 8 | 0 | |
| 0 | 0 | 0 | 4 | 0 | 4 | 0 | 0 | 0 | 4 | 0 | 4 | 0 | |
| 0 | 0 | 8 | 0 | 0 | 0 | 0 | 0 | 8 | 0 | 0 | 0 | 0 | |
| 0 | 0 | 0 | 0 | 8 | 0 | 0 | 0 | 0 | 0 | 0 | 0 | 8 | |
| 0 | 0 | 4 | 0 | 4 | 0 | 0 | 0 | 4 | 0 | 0 | 0 | 4 | |
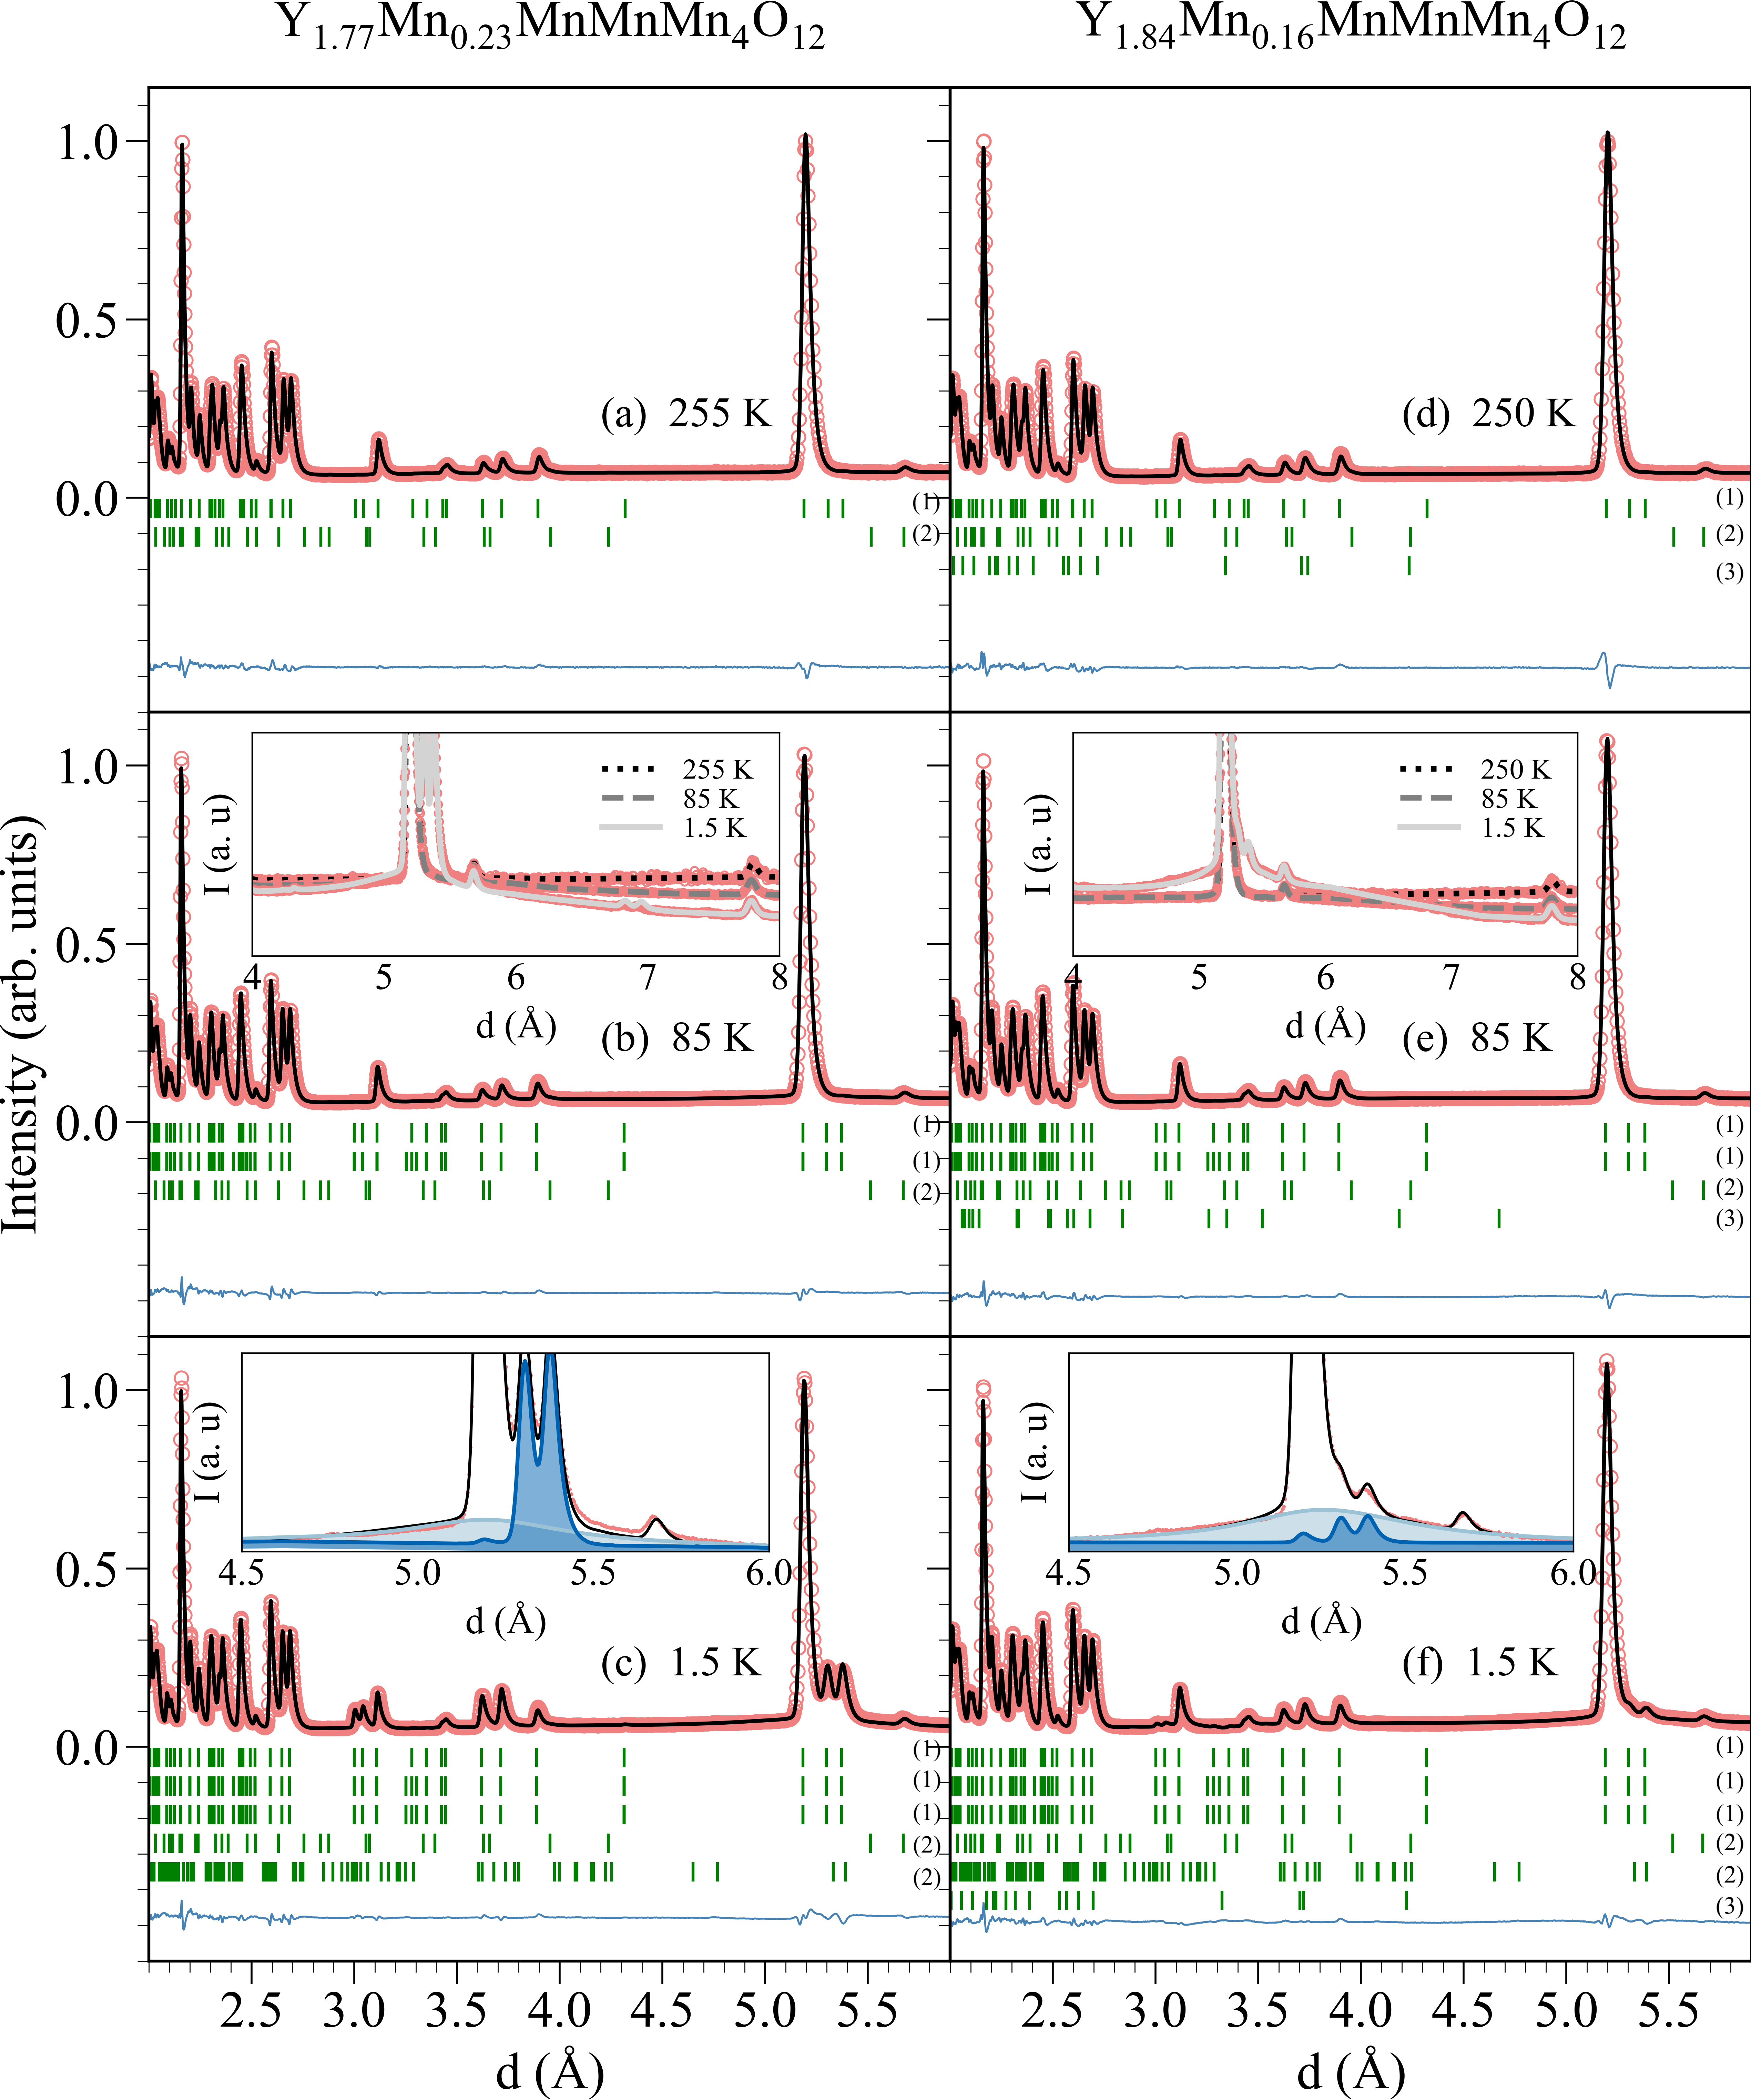
The published crystal structure model [22] was used to refine the NPD data collected in the paramagnetic phase, at 250 K for the sample and 255 K for the sample, as shown in Fig. 1(a) and Fig. 1(b) respectively. The A sites (labelled Y1 and Y2) were predominately occupied by non magnetic Y3+ and a small amount of magnetic Mn ions. The degree of cation disorder on these sites is what differentiates the two samples. As discussed later we show that it has profound implications for tuning exchange interactions, as it in effect leads to spin doping of the A sublattice 111We cannot distinguish as to whether homovalent or heterovalent substitution occurs, i.e. if it is Mn3+ or Mn2+ that substitutes Y3+ on the A sites. Hence it is possible that in addition to spin doping, charge doping may also occur. However as these samples remain insulating [22], in comparison to the simple perovskite mangnaites where charge doping can induce a metal to insulator phase transition, we suggest that the changes we observe to the magnetic properties of these systems can largely be attributed to the effect of changing the spin properties of the A site ions.. The A sites were occupied by Mn3+ in a square planar coordination (labelled Mn1) and the A'sites by Mn2+ in a tetrahedral coordination (labelled Mn2). The two symmetry inequivalent B sites, labelled Mn3 and Mn4, form layers composed of Mn3+ and Mn3.5+ ions respectively, that stack alternately along . The refined stoichiometries of the two \ceY2MnMnMn4O12 samples were \ceY_1.768(9)Mn_0.232(9)MnMnMn4O12 and \ceY_1.840(7)Mn_0.160(8)MnMnMn4O12. Both samples contained a \ceYMn2O5 impurity, with a weight fraction of 1.26 wt. % and 1.32 wt. % respectively. The sample also contained a \ceYMnO3 impurity, with a weight fraction of 0.37 wt.%. An excellent fit was achieved for both samples, , , for at 250 K and , , for at 255 K. The refined crystal structure parameters are given in Table 3 and Table 4 of Sec. IV.1 of the Appendix.
As the temperature was lowered below 200 K, three distinct changes were observed to the NPD pattern of both samples. Firstly, between 200 K and 120 K the paramagnetic background gradually decreased, see inset of Fig. 1(b) and (e), but no additional intensity was observed across the rest of the patterns. Secondly, between 130 K and 110 K broad diffuse intensity started to appear centred about the {110} and {112} families of reflections, inset of Fig. 1(c) and (f), which steadily grew till 33 K, before rapidly increasing till the lowest measured temperatures. It was not possible to pinpoint the exact onset temperature of the broad diffuse magnetic intensity and therefore an approximate value of 120 10 K will be given for T1 in the rest of the paper. Thirdly, below T2, which was 67 K for the sample and 64 K for the sample, well correlated intensity appeared at the (011), (101), (121), (211), (020) and (200) Bragg reflections, Fig. 1. The intensity of these Bragg reflections was significantly higher for the than the sample, and grew till 33 K, before steadily decreasing till the lowest measured temperatures.
The intensity that appeared below T2 was identified to be magnetic in origin as the magnetic susceptibility measured on the sample underwent a rapid increase at T2, indicative of the ordering of a FM or FIM phase. The broad diffuse intensity that was observed to appear below T1 was also identified to have a magnetic origin given that it directly competes with the sharp well correlated magnetic intensity below 33 K. Details of whether a signature of a phase transition at T1 is observed in magnetometry or specific heat capacity is discussed further in Sec. II.3 and Sec. V.4 of the Appendix respectively.
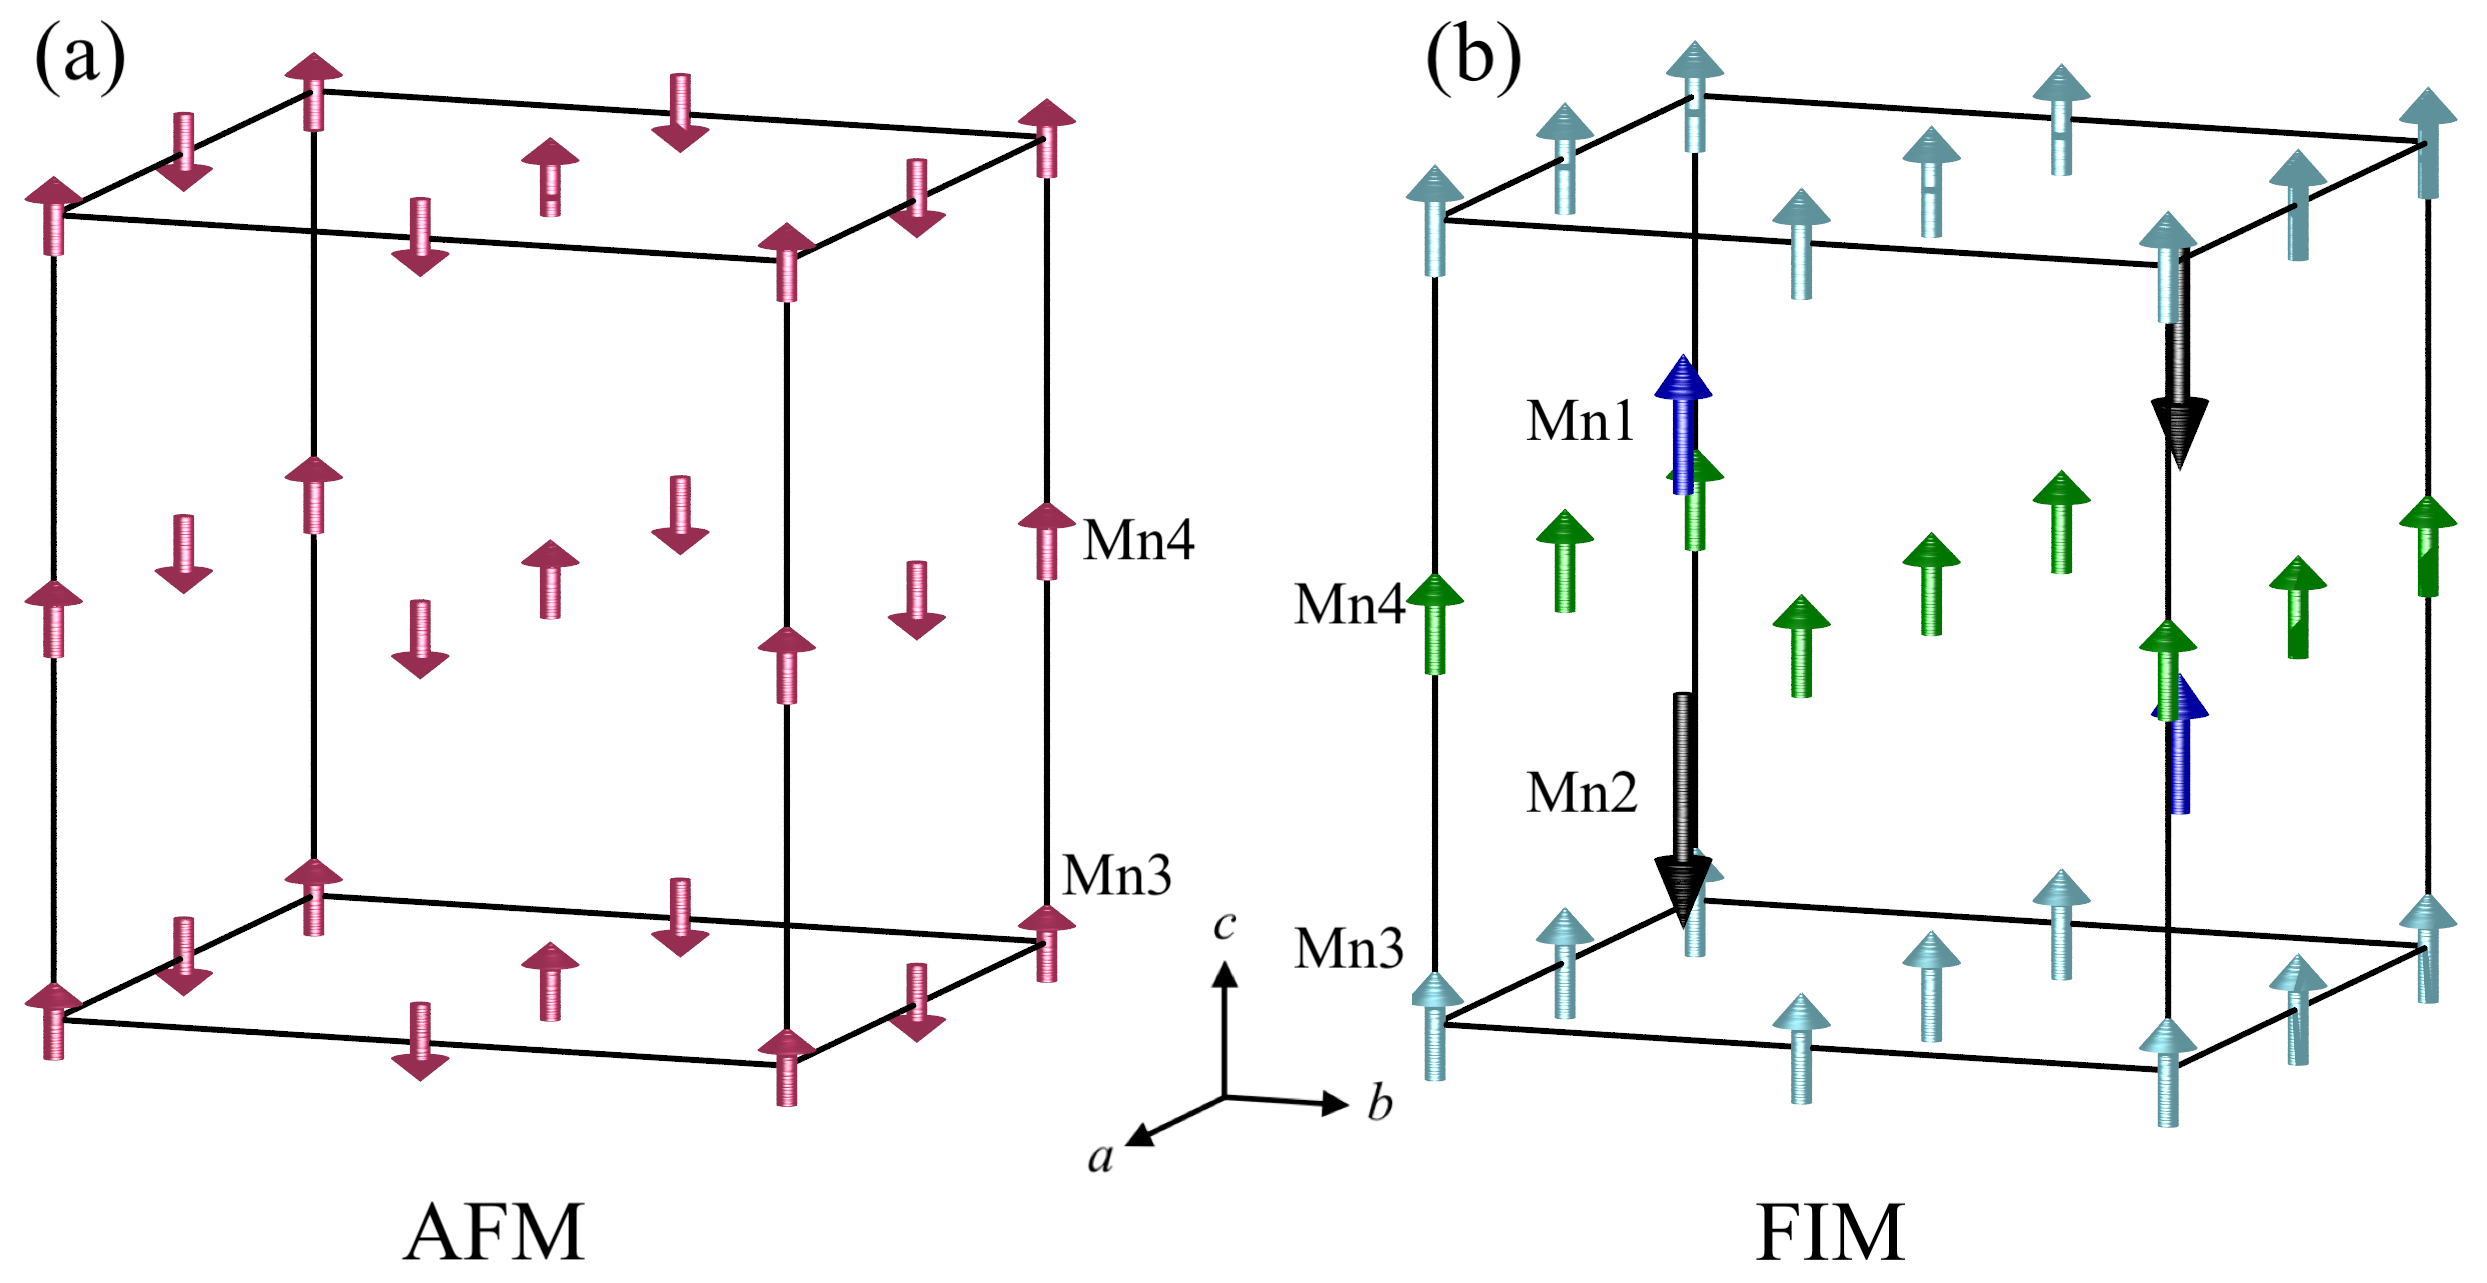
As all the magnetic intensity was observed on top of structural reflections, the magnetic ordering was determined to transform by a -point irreducible representation. The magnetic -point representation decomposes into seven irreducible representations, determined using the isotropy software suite, and which are given in terms of the symmetry-adapted magnetic modes, , , and , defined in the Appendix, Sec. V.2. Structure factors were calculated for each of the symmetry adapted basis modes, Sec. V.3 of the Appendix, and the results are summarised in Table 1 for relevant reflections. These structure factor calculations show that the magnetic intensity observed below T2 on the (020) and (200) reflections can originate from either A or B-site FM modes, Table 1. The observation of equal amounts of magnetic intensity on the (200) and (020), and zero magnetic intensity on the (002) reflections are consistent with the ordering of modes, which transform by the irrep. Magnetic structure models were constructed by taking linear combinations of the symmetry adapted basis functions of the irrep, and refined against the NPD data using the fullprof software suite. The magnetic structure model that gave the best fit to the sharp magnetic Bragg peaks at 40 K, where a smoothly varying background was used to fit the broad diffuse magnetic intensity, was one in which the Mn1, Mn2, Mn3 and Mn4 sublattices order with modes. The Mn2 sublattice moments were oriented antiparallel to the Mn1, Mn3 and Mn4 sublattice moments to give a net collinear FIM structure as shown in Fig. 2; similar to both magnetically ordered phases of \ceTm2MnMnMn4O12 [19] and all three magnetically ordered phases of \ce2CuMnMn4O12 ( = Y or Dy) [21]. This magnetic structure solution is consistent with the rapid increase of the susceptibility measured below T2, as discussed in further detail in Sec. II.3.
The diffuse magnetic intensity centred about the {110} and {112} reflections, observed to appear below T1, could have originated from AFM B-site modes or A-site modes coupled antiferromagnetically, see Table V.1 and Sec. V.3 of the Appendix for further details. As these A and B-site modes originate in different irreps, it is unlikely that both sublattices contributed to the diffuse intensity, and owing to the broadness of the diffuse intensity it was impossible to distinguish which of these two sets of modes contributed to the NPD data. Instead SANS measurements confirmed the absence of any FM ordering between T1 and T2, as detailed in Sec. II.2, confirming that the diffuse intensity originates in AFM modes at the B-sites.
The AFM B-site modes that can scatter at the {110} and {112} reflections are the , and modes 222A single mode, i.e on a single B site layer, could also give rise to scattering on the (110) and (112), however significant intensity is also expected on the (111) reflection which was not observed., as shown in Table 1. Each of these three B-site AFM mode combinations was tested against the NPD data, where the amplitude of the modes on the Mn3 and Mn4 layer were constrained to be the same. The best fit to the diffuse intensity was using a magnetic structure model in which the B-site magnetic structure transforms by an mode ( irrep) to give an AFM structure, shown in Fig. 2.
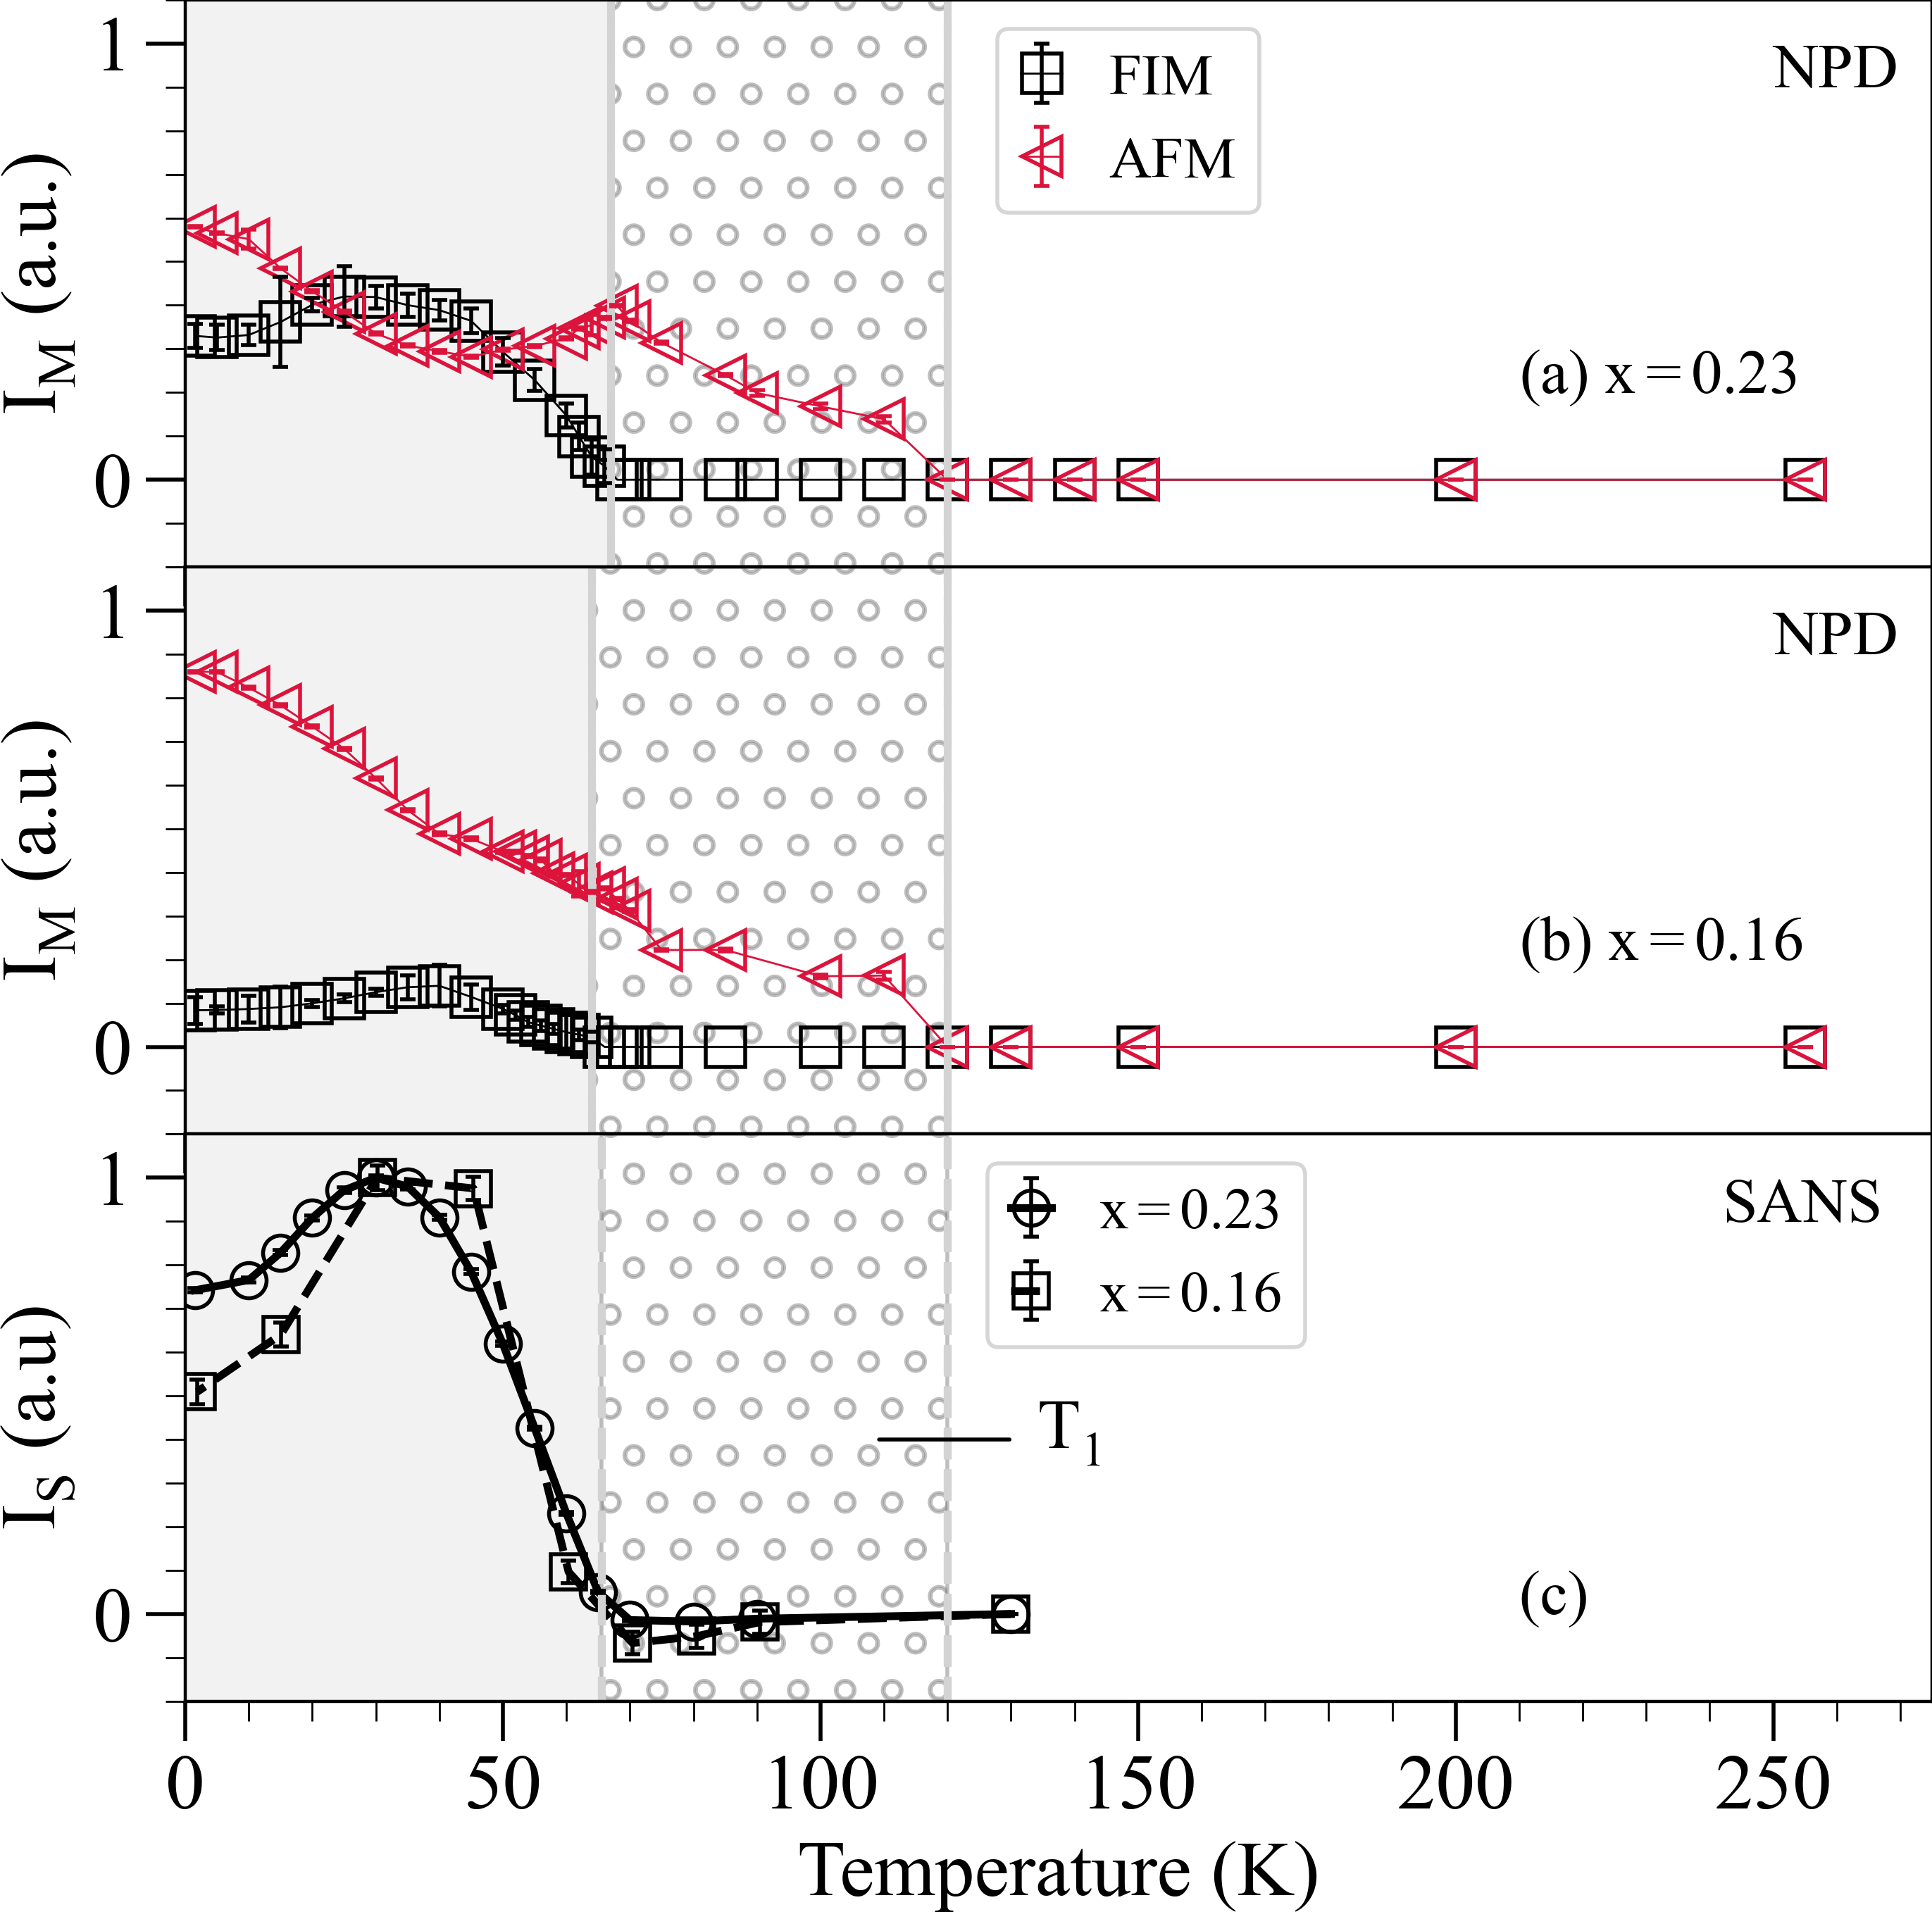
The above magnetic structure models were used to simultaneously fit the NPD data; the AFM structure was used to fit the broad diffuse scattering and the FIM structure to fit the sharp Bragg peaks. Since there is 100% correlation between the moment size and the phase fraction, it was not possible to get these two quantities separately for the AFM and FIM phases without any additional constraints. The unconstrained refinement can only provide information about the moment size scaled by the respective phase fraction. Thus, the integrated intensities of the AFM and FIM magnetic reflections as a function of temperature also represent temperature evaluation of the scaled moments (squared) and not the absolute moment size as in the case of a single magnetic phase. To emphasise this fact, we call these intensities as average magnetic scattering intensities, IM, and their temperature evolution is shown In Fig. 3. In addition to the phase transitions discussed above, one can observe that below 33 K, the average magnetic intensity scattered from the FIM phase begins to decrease, which occurs concomitantly with an increase in the scattered intensity from the AFM phase. By assuming the B-site moments were of the same magnitude in the AFM and FIM phases at 1.5 K, the moment magnitudes of all relevant sublattices and phase fractions of the AFM and FIM phases were refined, as given in Table 2. The model gave a very good fit to the data, for the sample and for the sample at 1.5 K. Note that the larger value of for the sample is owing to the weak intensity that was scattered from the FIM phase. The phase fraction of the FIM phase was larger in the sample compared with sample, consistent with our qualitative observations described above.
| Mn1 | Mn2 | Mn3 | Mn4 | P.F. | |
| FIM | 2.5(2) | -4.0(2) | 1.8(3) | 1.7(3) | 0.4(2) |
| AFM | - | - | 1.8(3) | 1.7(3) | 0.6(2) |
| Mn1 | Mn2 | Mn3 | Mn4 | P.F. | |
| FIM | 2.4(7) | -1.8(7) | 1.6(3) | 1.5(4) | 0.14(6) |
| AFM | - | - | 1.6(3) | 1.5(4) | 0.86(6) |
II.2 Small angle neutron scattering
SANS measurements were performed to determine whether the broad diffuse scattering measured below T1 originated from AFM or FM order. The magnetic scattering length density from SANS is given by the average magnetic moment in a unit cell, which is zero for AFM order, and hence the presence of finite SANS intensity is indicative of FM or FIM ordering.
The transmitted intensity from the full beam and the scattered intensity from an empty sample cell was used to normalise the SANS patterns so that any contributions from the transmitted beam and aluminium sample holder were subtracted away. The SANS pattern collected at room temperature was also subtracted to remove the nuclear contribution to the scattered intensity. Fig. 3(c) shows the variation in the magnetic SANS intensity summed over the collected Q range and plotted as a function of temperature for both samples. No SANS intensity was observed between T1 and T2 of either sample indicating the absence of any FM clusters in this temperature region. Furthermore in the presence of any FM clusters, one would expect the application of a magnetic field to couple to the net magnetisation of the cluster and cause a change to the magnetic SANS intensity, as has been observed in other systems [1]. No change to the SANS intensity was observed between T1 and T2 under applied magnetic fields of upto 0.5 T, as shown in Fig. 5 of the Appendix, confirming the absence of any FM order.
The magnetic SANS intensity that begins to appear below T2 in both samples, Fig. 3(c), reproduces the the observed variation in intensity of the Bragg peaks measured from NPD. Hence, we assign this SANS intensity to the onset of the FIM phase, which is expected to scatter at the (0,0,0) reflection, the tail of which is observed in the SANS data.
II.3 DC susceptibility measurements
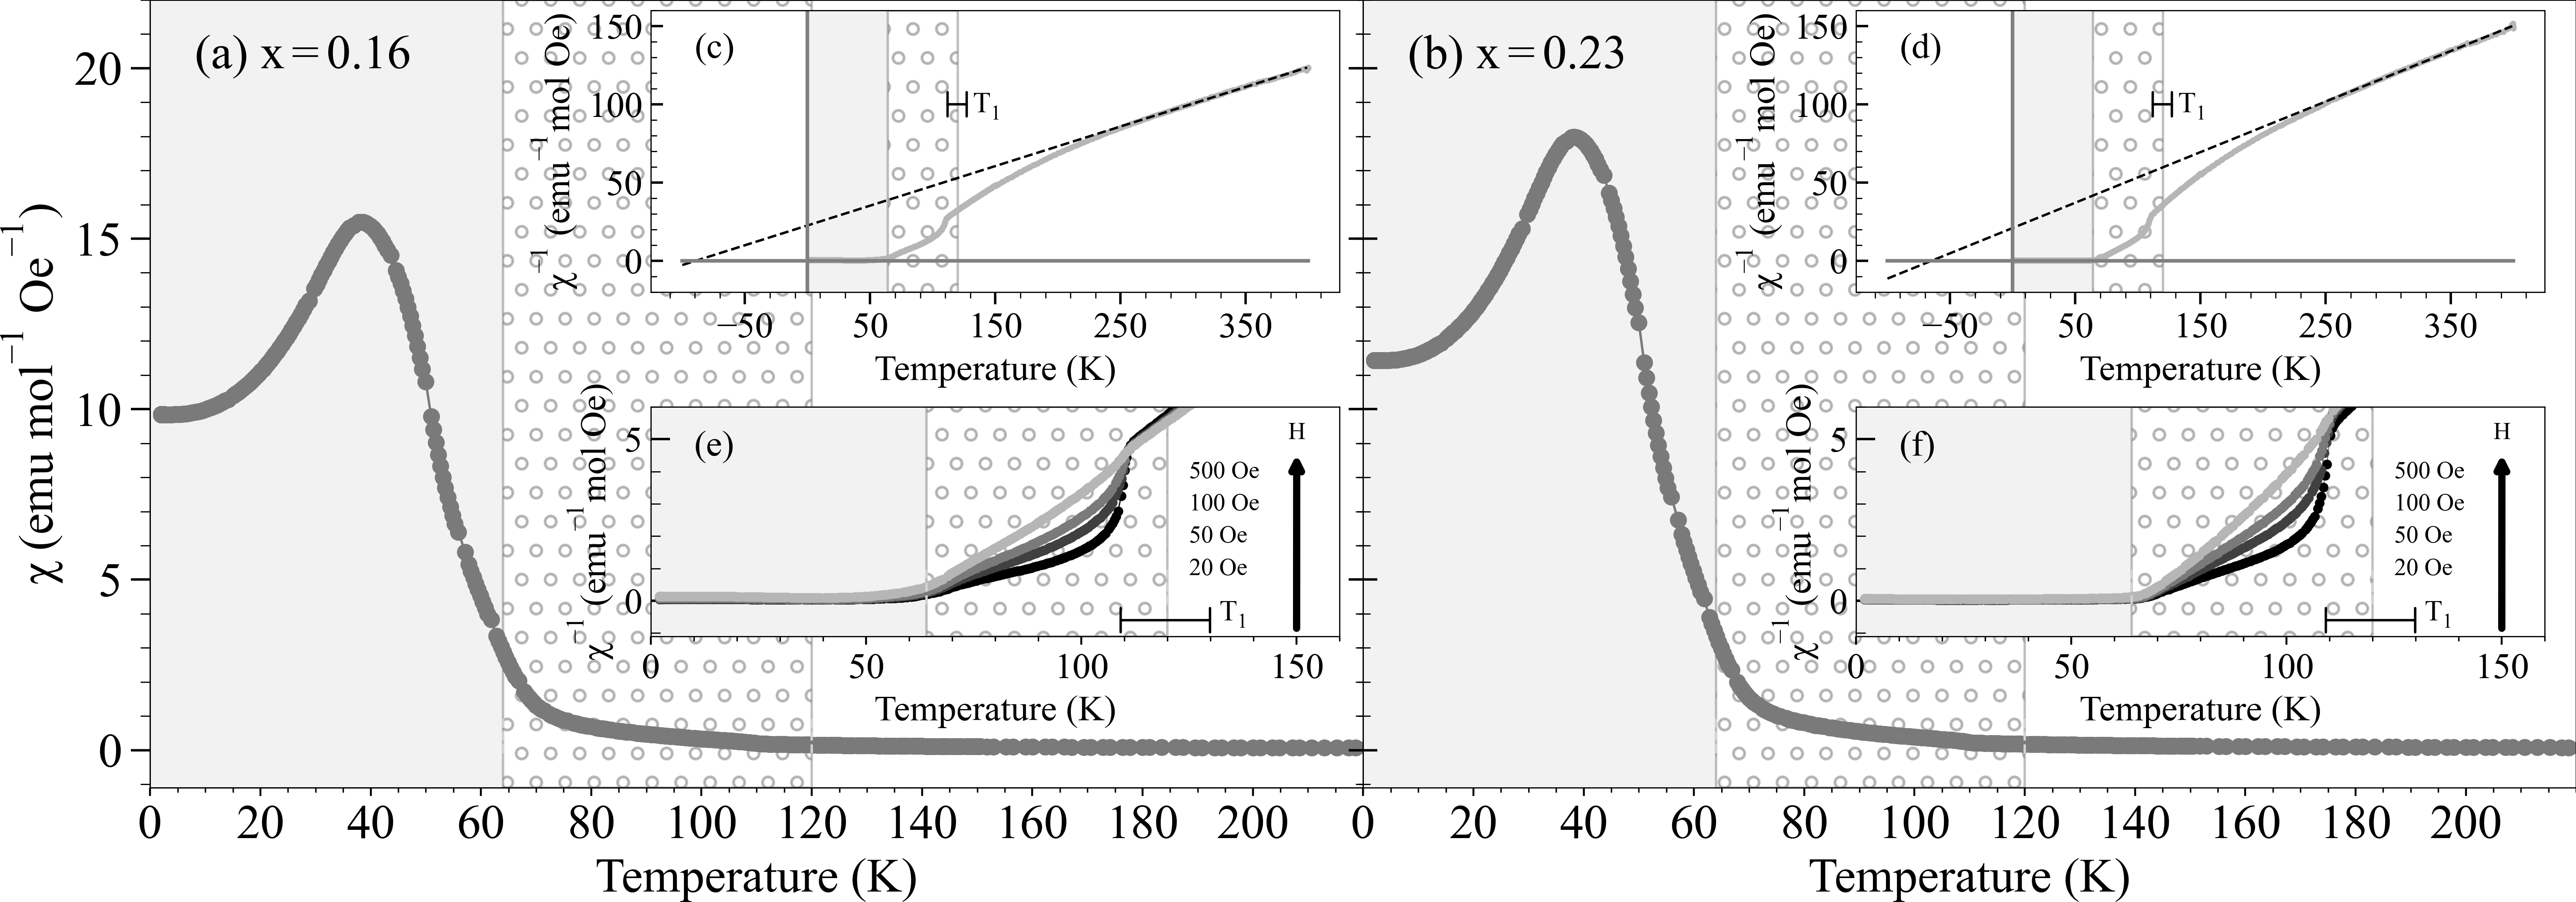
Between 400 K and 250 K the inverse susceptibility follows a Curie Weiss like temperature dependence, as shown in the insets (c) and (d) of Fig. 4, with a Curie Weiss temperature of K for the sample and K for sample. Between 200 K and T1 a departure from Curie Weiss like behaviour was observed, there was a slight curvature to the inverse susceptibility. Taken together with the decrease in the paramagnetic background of the NPD patterns at these temperatures, suggests the onset of short range magnetic correlations.
A downturn in the inverse susceptibility was observed between T2 and 110 K, shown in insets (e) and (f) of Fig. 4, and which is suppressed upon application of a magnetic field. This is widely regarded in the literature to be characteristic of a Griffiths phase consisting of ferromagnetic clusters [16, 1, 26]. However, since our experimental results indicate that only antiferromagnetic clusters are present in this temperature region, which intuitively cannot cause a downturn to the inverse susceptibility, this feature is likely due to the presence of a FM or FIM impurity phase. The high-temperature high-pressure synthesis of the A2A'A''Mn4O12 manganites are susceptible to the formation of impurities, such as the orthorhombic \ceR_0.667Mn_0.333MnO_3 manganites, which have ordering temperatures between 105 and 110 K and are expected to order ferromagnetically or ferrimagnetically [27]. While there are no diffraction peaks in the NPD pattern that would be consistent with a \ceY_0.67Mn_0.33MnO3 impurity, we note that magnetometry measurements can be more sensitive to the presence of such impurities than diffraction. Below T2 the magnetic susceptibility rapidly increases, which is consistent with the onset of the long range FIM ordering.
II.4 Discussion
In the simple perovskite manganites, \ceAMnO3, the magnetic structure immediately below TN is determined by the superexchange interactions between Mn ions at the B-sites; we refer to these as B-B interactions. The Goodenough Kanamori Anderson rules then provide a framework in which one can predict the sign and approximate strength of the B-B exchange, depending upon the orbital configuration of the Mn-O-Mn superexchange pathways. Applying the same rules to the B-B exchange interactions in the columnar ordered quadruple perovskites one predicts an AFM B site structure composed of modes. However, in all previously studied columnar ordered perovskites [19, 21, 20] ferromagnetic modes are found on the B sites, and together with the A sites these materials adopt a ferrimagnetic structure. A key difference between the simple and quadruple perovskites is the presence of magnetic transition metal ions at the A-sites (A' and A'' sites in the perfectly ordered columnar systems), and it was suggested that ferromagnetism at the B-sites in the columnar ordered stystems, is stabilised by A-B exchange interactions dominating B-B interactions. This frustration between A-B and B-B exchange has manifested in reduced ordered moments [20] and large spin canting [21].
Here, in \ce[Y_2-xMn_x]MnMnMn4O12, we have observed the first example of an AFM B-site magnetic structure in the quadruple perovskites, which emerges as a separate, poorly correlated phase that competes with the typical ferrimagnetic long-range order. Note that we can rule out the scenario of spin canting within a single phase as both F and A modes are polarised in the same direction (). The AFM phase appears at a higher temperature than the FIM phase, likely due to the effects of frustration in the FIM case. This is consistent with symmetry; the A-sites do not enter into the irreducible representation by which the B-site modes transform. Hence, for ordering at the B-sites the A-B exchange interactions exactly cancel by symmetry. To the contrary, a net A-B exchange is allowed within the symmetry of the ferrimagnetic phase, which will compete with the B-B interactions.
We propose that the observed phase separation is driven by inhomogeneities in the sample, such that in minority regions B-B exchange wins over A-B interactions allowing B-site AFM clusters to develop. In the sample 11.5(5)% of the Y sites are occupied by Mn, and in the x sample 8.0(4)% of the Y sites are occupied by Mn. This local substitution of non-magnetic Y by magnetic Mn can be considered spin doping of the A-site sublattice, which will tune the competition between A-B and B-B exchange in favour of the FIM structure. Inhomogeneities in the amount of spin doping can then give rise to AFM / FIM phase separation, whereby clusters of antiferromagnetic order form in regions of the crystal where there is minimal substitutional disorder on the A-sites. This scenario naturally explains the larger AFM phase fraction found for (less spin doping) compared to (more spin doping), as shown in Fig. 3.
Finally, we comment on the suppression of the FIM phase in favour of the AFM phase at low temperature, an effect that is enhanced in the lower spin-doped sample. We assume that the changes in average magnetic intensity observed in the NPD experiments reflect a change in phase fraction, as a reduction in the FIM moment on cooling would be unphysical for this insulating system. The observed changes in the average intensity scattered from the AFM / FIM phases, reflective of the changing phase fractions, implies that the average competition between A-B and B-B exchange has been tuned by temperature. The ratio of A-B to B-B exchange will change in line with the changing ratio of the A and B site magnetic moments, such that at a certain temperature, regions of the crystal with a critical concentration of spin doping could switch from being FIM to AFM.
III Conclusions
In conclusion we have found that the \ce[Y_2-xMn_x]MnMnMn4O12 and quadruple perovskite manganites developed short range antiferromagnetic clusters below T1 = 120 10 K. Below T2 65 K the system was composed of well correlated long range collinear ferrimagnetic order, punctuated by short range antiferromagnetic clusters. Furthermore we observed a sharp increase in the antiferromagnetic phase fraction below 33 K, concomitant with a decrease in the ferrimagnetic phase fraction. We propose that substitutional disorder on the A-sites caused an inhomogeneous distribution of exchange interactions across the sample, such that in some regions of the crystal where magnetic Mn replaces non-magnetic Y3+ (increasing A-B exchange) the FIM phase was favoured to grow, while in other regions, where non-magnetic Y3+ is retained on the A-sites (minimising A-B exchange), B-B exchange dominated and the AFM phase was stabilised. Our results show that in the A2A'A''Mn4O12 manganites less than 10% spin doping, introduced through cation disorder on the A sites, can have a profound impact on the magnetic phases stabilised in the presence of competing exchange between multiple magnetic sublattices. In future work one might anticipate forming Griffiths type phases linked to emergent material properties such as colossal magnetoresistance through control of the spin degrees of freedom.
IV Appendix
IV.1 Crystal Structure Parameters
In the sample 13.2(4)% of Y1 sites and 10.0(4)% of Y2 sites were occupied by Mn ions, and in the sample 10.0(4)% of Y1 sites and 6.0(4)% of Y2 sites were occupied by Mn ions. Both samples contained a \ceYMn2O5 impurity, with a weight fraction of 1.26 wt. % and 1.32 wt. % respectively. The sample also contained a \ceYMnO3 impurity, with a weight fraction of 0.37 wt.%. An excellent fit was achieved for both samples, , , for the sample at 250 K and , , for the sample at 255 K. The refined crystal structure parameters for each sample are given in Tables 3 and 4.
| Atom | Site | B.v.s. () | Occ. | ||||
|---|---|---|---|---|---|---|---|
| Y1 | 0.25 | 0.25 | 0.7816(4) | 0.0067(1) | 2.92(5) | 0.217(1) | |
| Y2 | 0.25 | 0.25 | 0.2839(4) | 0.011(2) | 2.88(8) | 0.225(1) | |
| Mn1 | 0.75 | 0.25 | 0.7227(6) | 0.002(1) | 2.70(5) | 0.25 | |
| Mn2 | 0.75 | 0.25 | 0.2393(8) | 0.019(5) | 1.96(6) | 0.25 | |
| Mn3 | 0 | 0 | 0 | 0.002(1) | 3.16(9) | 0.5 | |
| Mn4 | 0 | 0 | 0.5 | 0.09(1) | 3.6(1) | 0.5 | |
| O1 | 0.4349(2) | -0.0682(2) | 0.2673(2) | 0.0111(6) | - | 1.0 | |
| O2 | 0.0568(3) | 0.25 | 0.0422(3) | 0.0105(7) | - | 0.5 | |
| O3 | 0.25 | 0.5296(3) | 0.9220(3) | 0.0087(7) | - | 0.5 | |
| O4 | 0.5417(3) | 0.25 | 0.4159(3) | 0.0109(7) | - | 0.5 | |
| O5 | 0.25 | 0.4338(3) | 0.5403(3) | 0.0095(7) | - | 0.5 |
| Atom | Site | B.v.s. () | Occ. | ||||
|---|---|---|---|---|---|---|---|
| Y1 | 0.25 | 0.25 | 0.7814(4) | 0.0120(9) | 2.91(5) | 0.226(1) | |
| Y2 | 0.25 | 0.25 | 0.284(4) | 0.0081(9) | 2.89(5) | 0.235(1) | |
| Mn1 | 0.75 | 0.25 | 0.7246(7) | 0.004(1) | 2.66(5) | 0.25 | |
| Mn2 | 0.75 | 0.25 | 0.2402(1) | 0.033(2) | 1.93(6) | 0.25 | |
| Mn3 | 0 | 0 | 0 | 0.0076(1) | 3.2(1) | 0.5 | |
| Mn4 | 0 | 0 | 0.5 | 0.0074(1) | 3.5(1) | 0.5 | |
| O1 | 0.4352(2) | -0.0677(2) | 0.2667(2) | 0.0126(6) | - | 1.0 | |
| O2 | 0.0570(3) | 0.25 | 0.0415(3) | 0.0111(7) | - | 0.5 | |
| O3 | 0.25 | 0.5291(3) | 0.9223(3) | 0.0089(8) | - | 0.5 | |
| O4 | 0.5401(3) | 0.25 | 0.4148(3) | 0.0126(8) | - | 0.5 | |
| O5 | 0.25 | 0.4334(3) | 0.5399(3) | 0.0097(7) | - | 0.5 |
V Magnetic Symmetry
V.1 Magnetic Modes
Symmetry-adapted modes that constitute candidate magnetic structures for all ordered phases of \ce[Y_2-xMn_x]MnMnMn4O12 are given below. We define four modes, , , , and , that span the four symmetry equivalent B site Mn ions of a given Mn3 () or Mn4 () layer in a single unit cell (the subscript denotes the direction of the moment component, where , , and ), adopting the same labelling scheme as established for other members of the columnar ordered quadruple perovskites [21]. The magnetic order of a single layer is then described by a linear combination of these modes. For each mode the relative signs of the magnetic moment components on each of the four sites are given in Table 5. We note that under the physical constraint that every symmetry equivalent magnetic ion has the same size magnetic moment, combined modes must have orthogonal magnetic moment components.
| Frac. coords. | ||||
|---|---|---|---|---|
| 0.0, 0,0, | + | + | + | + |
| 0.5, 0.0, | + | - | - | + |
| 0.0, 0.5, | + | - | + | - |
| 0.5, 0.5, | + | + | - | - |
| Frac. coords. | |||
|---|---|---|---|
| , , | + | + | |
| , , | + | - |
| Irrep. | Y1 | Y2 | Mn1 | Mn2 | Mn3 | Mn4 |
|---|---|---|---|---|---|---|
| - | - | - | - | |||
| - | - | |||||
| - | - | |||||
| - | - | |||||
As for the A sites, we define two modes, and , that span the two symmetry equivalent A site ions of a 1, 2, Mn1, or Mn2 sublattice in a single unit cell. The relative signs of the magnetic moment components on each of the two sites are given in Table 6.
V.2 Symmetry Analysis
The NPD experiments described in Section II.1 demonstrate a -point propagation vector for all the magnetically ordered phases of \ce[Y_2-xMn_x]MnMnMn4O12. Symmetry analysis was performed using isodistort [29], taking the structure detailed in Section IV.1 as the parent. The magnetic -representation for the Wyckoff positions describing magnetic sites of the \ce[Y_2-xMn_x]MnMnMn4O12 crystal structure each decompose into seven irreducible representations, listed in Table 7, and described in terms of the symmetry adapted basis modes defined above.
V.3 Structure Factor Calculations
To simplify the structure factor calculations of the A-sites, they are approximated to have a fractional coordinates of exactly 1/4 or 3/4. From these calculations, Eqns. 1 and 2, one can see that the mode has finite intensity for reflections where is even and zero intensity for reflections where is odd. In contrast the mode has finite intensity for reflections where is odd, and zero intensity for reflections where is even. The presence of broad diffuse intensity about the {110} and {112} families of reflections, and the absence of any broad diffuse intensity about the {2,0,0} family is only consistent with the Mn1 and Mn2 sublattices ordering with modes where the Mn1 and Mn2 sublattices are coupled antiferromagnetically. In the FIM phase the Mn1 and Mn2 sublattices do order with modes that are coupled antiferromagnetically, hence it is unlikely that this could be a competing magnetic phase to the FIM order. Furthermore if the broad diffuse intensity originated in A-site modes coupled antiferromagnetically, one may expect that as the long range FIM order develops, the broad diffuse intensity should shift into the sharp magnetic Bragg peaks. However the broad diffuse intensity grows below T2, and at the expense of the sharp magnetic Bragg peaks below 33 K.
A-sites
| (1) |
| (2) |
B-sites
The structure factors equations for each of the symmetry adapted B-site ion basis modes is given by Eqns. 3 - 6. Structure factor equations taking into account two B-site magnetic modes that describe the magnetic structure of the B-sites on the layer (the first mode listed) and the layer (the second mode listed) is given by Eqns. 7-14, where the moment magnitudes across the two sublattices are constrained to be the same, and they are assumed to have the same form factor for simplicity.
| (3) |
| (4) |
| (5) |
| (6) |
| (7) |
| (8) |
| (9) |
| (10) |
| (11) |
| (12) |
| (13) |
| (14) |
V.4 SANS
Magnetic SANS intensity collected under applied magnetic fields of 0.01 T, 0.1 T and 0.5 T at 5 K, 90 K and 130 K for the x sample are show in Fig. 5.
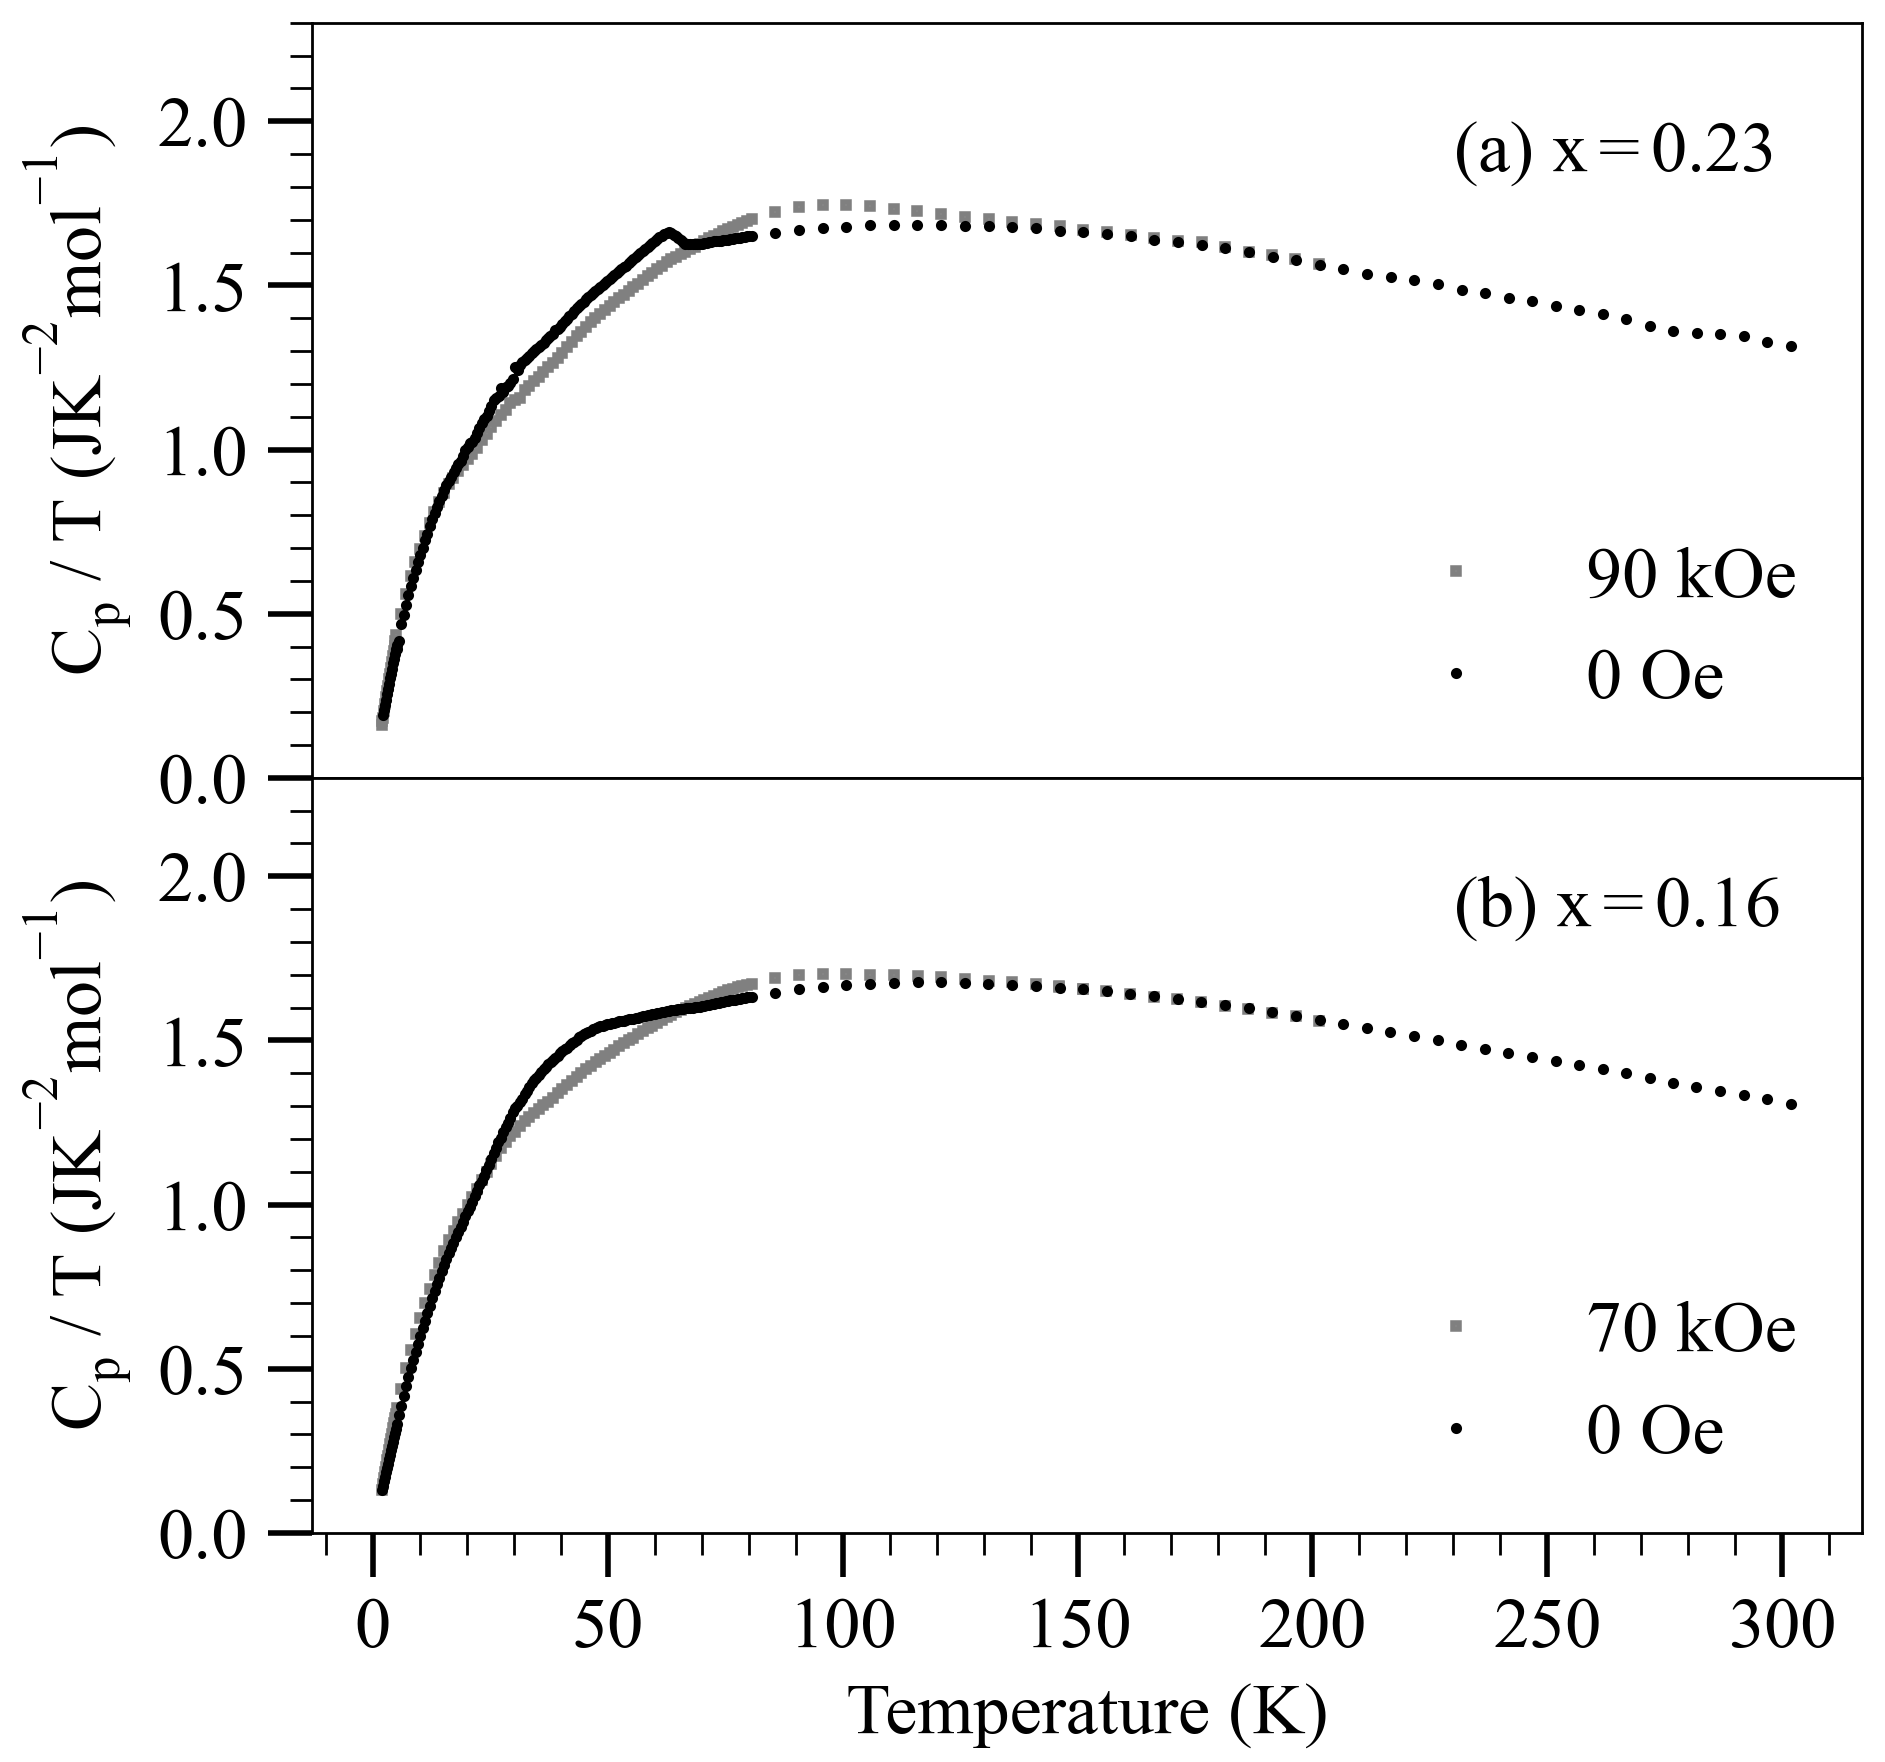
V.5 Specific heat capacity measurements
Specific heat data measured on both samples at two different fields is shown in Fig. 6. Only a single phase transition, characteristic of the ordering of the FIM phase is observed in both samples.
References
- Magen et al. [2006] C. Magen, P. A. Algarabel, L. Morellon, J. P. Araújo, C. Ritter, M. R. Ibarra, A. M. Pereira, and J. B. Sousa, Phys. Rev. Lett. 96, 167201 (2006).
- Griffiths [1969] R. B. Griffiths, Phys. Rev. Lett. 23, 17 (1969).
- Bray and Moore [1982] A. J. Bray and M. A. Moore, Journal of Physics C: Solid State Physics 15, L765 (1982).
- Bray [1987] A. J. Bray, Phys. Rev. Lett. 59, 586 (1987).
- Anderson [1990] P. W. Anderson, Physics Today 43, 9 (1990).
- Dagotto [2005] E. Dagotto, Science 309, 257 (2005).
- Zener [1951] C. Zener, Phys. Rev. 82, 403 (1951).
- Lynn et al. [1996] J. W. Lynn, R. W. Erwin, J. A. Borchers, Q. Huang, A. Santoro, J.-L. Peng, and Z. Y. Li, Phys. Rev. Lett. 76, 4046 (1996).
- De Teresa et al. [1997] J. De Teresa, M. Ibarra, P. Algarabel, C. Ritter, C. Marquina, J. Blasco, J. Garcia, A. del Moral, and Z. Arnold, Nature 386, 256 (1997).
- Uehara et al. [1999] M. Uehara, S. Mori, C. Chen, and S.-W. Cheong, Nature 399, 560 (1999).
- Cox et al. [1998] D. E. Cox, P. G. Radaelli, M. Marezio, and S.-W. Cheong, Phys. Rev. B 57, 3305 (1998).
- Goodenough [1963] J. B. Goodenough, Magnetism and the Chemical Bond, edited by F. A. Cotton (John Wiley & Sons, 1963).
- Merithew et al. [2000] R. D. Merithew, M. B. Weissman, F. M. Hess, P. Spradling, E. R. Nowak, J. O’Donnell, J. N. Eckstein, Y. Tokura, and Y. Tomioka, Phys. Rev. Lett. 84, 3442 (2000).
- Burgy et al. [2001] J. Burgy, M. Mayr, V. Martin-Mayor, A. Moreo, and E. Dagotto, Phys. Rev. Lett. 87, 277202 (2001).
- De Teresa et al. [2002] J. M. De Teresa, M. R. Ibarra, P. Algarabel, L. Morellon, B. García-Landa, C. Marquina, C. Ritter, A. Maignan, C. Martin, B. Raveau, A. Kurbakov, and V. Trounov, Phys. Rev. B 65, 100403 (2002).
- Salamon et al. [2002] M. B. Salamon, P. Lin, and S. H. Chun, Phys. Rev. Lett. 88, 197203 (2002).
- Shenoy et al. [2007] V. B. Shenoy, T. Gupta, H. R. Krishnamurthy, and T. V. Ramakrishnan, Phys. Rev. Lett. 98, 097201 (2007).
- Jiang et al. [2007] W. Jiang, X. Zhou, G. Williams, Y. Mukovskii, and K. Glazyrin, Phys. Rev. Lett. 99, 177203 (2007).
- Vibhakar et al. [2019] A. M. Vibhakar, D. D. Khalyavin, P. Manuel, L. Zhang, K. Yamaura, P. G. Radaelli, A. A. Belik, and R. D. Johnson, Phys. Rev. B 99, 104424 (2019).
- Vibhakar et al. [2020a] A. M. Vibhakar, D. D. Khalyavin, P. Manuel, R. Liu, K. Yamaura, A. A. Belik, and R. D. Johnson, Phys. Rev. B 102, 214428 (2020a).
- Vibhakar et al. [2020b] A. M. Vibhakar, D. D. Khalyavin, P. Manuel, J. Liu, A. A. Belik, and R. D. Johnson, Phys. Rev. Lett. 124, 127201 (2020b).
- Zhang et al. [2017] L. Zhang, Y. Matsushita, K. Yamaura, and A. A. Belik, Inorganic Chemistry 56, 5210 (2017).
- Chapon et al. [2011] L. C. Chapon, P. Manuel, P. G. Radaelli, C. Benson, L. Perrott, S. Ansell, N. J. Rhodes, D. Raspino, D. Duxbury, E. Spill, and J. Norris, Neutron News 22, 22 (2011).
- Note [1] We cannot distinguish as to whether homovalent or heterovalent substitution occurs, i.e. if it is Mn3+ or Mn2+ that substitutes Y3+ on the A sites. Hence it is possible that in addition to spin doping, charge doping may also occur. However as these samples remain insulating [22], in comparison to the simple perovskite mangnaites where charge doping can induce a metal to insulator phase transition, we suggest that the changes we observe to the magnetic properties of these systems can largely be attributed to the effect of changing the spin properties of the A site ions.
- Note [2] A single mode, i.e on a single B site layer, could also give rise to scattering on the (110) and (112), however significant intensity is also expected on the (111) reflection which was not observed.
- Ouyang et al. [2006] Z. W. Ouyang, V. K. Pecharsky, K. A. Gschneidner, D. L. Schlagel, and T. A. Lograsso, Phys. Rev. B 74, 094404 (2006).
- Zhang et al. [2018] L. Zhang, D. Gerlach, A. Dönni, T. Chikyow, Y. Katsuya, M. Tanaka, S. Ueda, K. Yamaura, and A. A. Belik, Inorganic Chemistry 57, 2773 (2018), pMID: 29431431.
- Brese and O’Keeffe [1991] N. E. Brese and M. O’Keeffe, Acta Crystallographica Section B 47, 192 (1991).
- Campbell et al. [2006] B. J. Campbell, H. T. Stokes, D. E. Tanner, and D. M. Hatch, Journal of Applied Crystallography 39, 607 (2006).