A new sample of transient ultraluminous X-ray sources serendipitously discovered by Swift/XRT
Abstract
Ultraluminous X-ray sources (ULXs) are our best laboratories for studying extreme super-Eddington accretion. Most studies of these objects are of relatively persistent sources, however there is growing evidence to suggest a large fraction of these sources are transient. Here we present a sample of five newly reported transient ULXs in the galaxies NGC 4945, NGC 7793 and M81 serendipitously discovered in Swift/XRT observations. Swift monitoring of these sources have provided well sampled lightcurves, allowing for us to model the lightcurves with the disk instability model of Hameury & Lasota (2020) which implies durations of 60–400 days and that the mass accretion rate through the disk is close to or greater than the Eddington rate. Of the three source regions with prior HST imaging, color magnitude diagrams of the potential stellar counterparts show varying ages of the possible stellar counterparts. Our estimation of the rates of these sources in these three galaxies is 0.4–1.3 year-1. We find that while persistent ULXs dominate the high end of galaxy luminosity functions, the number of systems that produce ULX luminosities are likely dominated by transient sources.
1 Introduction
Ultraluminous X-ray sources (ULXs) are powerful X-ray sources found outside the nucleus of galaxies (see Kaaret et al. (2017), Fabrika et al. (2021) and King et al. (2023) for recent reviews). They exhibit luminosities in excess of erg s-1 which is the Eddington limit of the typical 10 black hole found in our Galaxy. First identified in the early 1980s by the Einstein Observatory (Giacconi et al., 1979), the first fully imaging X-ray telescope put into space, they were originally thought to be more massive black holes, potentially intermediate-mass black holes (– , e.g. Colbert & Mushotzky, 1999). However, more recently, consensus has shifted to view these sources as lower-mass super-Eddington accretors (e.g. Middleton et al., 2015). This was famously confirmed for some sources by the detection of pulsations, revealing their central engines to be neutron stars (NSs, e.g. Bachetti et al., 2014; Fürst et al., 2016; Israel et al., 2017b, a) and not black holes at all. NSs have masses of only 1–2 , implying their luminosities when assuming isotropic emission to be 100 s of times the Eddington limit. ULXs are thus our best laboratories for studying extreme super-Eddington accretion.
The vast majority of ULX studies have been on relatively persistent sources, i.e. sources that while some may be highly variable, are consistently active and have been detected by X-ray instruments for decades. Indeed there is evidence to suggest they have been active for much longer from the collisionally ionized bubbles surrounding sources such as Holmberg IX X-1, NGC 1313 X-2, NGC 7793 S26 and NGC 5585 ULX which have estimated dynamical ages of years (Pakull & Mirioni, 2002; Pakull et al., 2010; Moon et al., 2011; Weng et al., 2014; Berghea et al., 2020; Soria et al., 2021). Studies of persistent ULXs have revealed their multicomponent X-ray spectra (e.g. Gladstone et al., 2009; Walton et al., 2018b), coherent pulsations (e.g. Bachetti et al., 2014; Fürst et al., 2016; Israel et al., 2017a, b), ultrafast outflows (e.g. Pinto et al., 2016; Kosec et al., 2018), super-orbital periods (e.g. Walton et al., 2016; Hu et al., 2017; Brightman et al., 2019, 2020), cyclotron lines (Brightman et al., 2018; Walton et al., 2018a), among many other things.
However, in addition to persistent ULXs there are several known transient ULXs. Indeed one of these occurred in our own Galaxy, Swift J0243.6+6124 (Cenko et al., 2017; Wilson-Hodge et al., 2018), and another in the SMC, RX J0209.6-7427 (Chandra et al., 2020; Vasilopoulos et al., 2020). Both of these were found to be powered by NS accretors with a Be star companion. Type I Be X-ray binary outbursts occur when a neutron star, often in a wide eccentric orbit, accretes material as it passes through the decretion disk of its Be star companion (Reig, 2011). Type II outbursts are brighter and often reach the Eddington limit, as was the case with Swift J0243.6+6124 and RX J0209.6-7427. It is not clear if all transient ULXs are Be X-ray binaries, however M51 XT-1 (Brightman et al., 2020) would be a candidate for a non-Be X-ray binary since it peaked at an X-ray luminosity of erg s-1, much greater than seen in Be X-ray binaries.
Transient ULXs are far less well studied than their persistent counterparts, potentially skewing our understanding of super-Eddington accretion and of ULXs in general (Dage et al., 2021). This is mostly due to the lack of wide-field X-ray surveys with the sensitivity to detect these mostly extragalactic sources. eROSITA was launched in 2019 and the data from its all sky surveys will have the potential to change this. Most ULXs known today have been identified serendipitously in pointed imaging X-ray observations by XMM-Newton, Chandra and Swift (e.g. Liu & Mirabel, 2005; Liu & Bregman, 2005; Winter et al., 2006; Swartz et al., 2011; Walton et al., 2011; Earnshaw et al., 2019a; Kovlakas et al., 2020), with the latest catalog of ULX candidates containing 1843 sources (Walton et al., 2021a). However, the relative rates of persistent and transient sources is unknown. A few detailed studies of transient ULXs discovered serendipitously have been presented in the literature (e.g. Strickland et al., 2001; Soria et al., 2007; Middleton et al., 2012; Soria et al., 2012; Middleton et al., 2013; Carpano et al., 2018; Pintore et al., 2018; Liu et al., 2019; van Haaften et al., 2019; Earnshaw et al., 2019b; Brightman et al., 2020; Earnshaw et al., 2020; Walton et al., 2021b; Dage et al., 2021; Robba et al., 2022), however, a systematic search for transient ULXs is lacking.
NASA’s Neil Gehrels Swift Observatory (hereafter Swift, Gehrels et al., 2004) observes 10 s of targets a day, many of which are monitoring observations, with the data being quickly downloaded and made public. This allows for a near real time search for transients, and detailed follow up. We have already reported on the discovery of a tidal disruption event found this way (Brightman et al., 2021), and the Swift team have recently presented the Living Swift-XRT Point Source catalogue (LSXPS) and real-time transient detector (Evans et al., 2022). Here we report on results on transient ULXs from our own systematic search for X-ray transients in Swift/XRT observations.
2 The search for new X-ray transients
Beginning in 2019 October, we have routinely dowloaded a selection of new Swift/XRT observations on a daily basis. Not all observations were downloaded due to time constraints. We searched for sources in these observations using the detect function of the heasoft tool ximage and a signal to noise threshold of 3. The positions of the detected X-ray sources were then cross-correlated with latest versions of the Swift Point Source Catalog (2SXPS, Evans et al., 2020), the Fourth XMM-Newton Serendipitous Source Catalogue (4XMM, Webb et al., 2020), the Chandra Source Catalog (CSC2, Evans et al., 2010) and the Second ROSAT All-Sky Survey Source Catalogue (2RXS, Boller et al., 2016). When the new Swift source was found to have no close counterpart in these catalogs, we first assessed if this is because the source position was not previously observed by an imaging X-ray telescope, or it was a genuine new source. If it appeared to be a new source, we investigated further by using the online tool provided by the University of Leicester111https://www.swift.ac.uk/user_objects/ (Evans et al., 2007, 2009) to determine the best position, and generate a lightcurve and spectrum of the source. All products from this tool are fully calibrated and corrected for effects such as pile-up and the bad columns on the CCD. All spectra were grouped with a minimum of one count per bin using the heasoft v 6.28 tool grppha and fitted in xspec v 12.11.1 (Arnaud, 1996). The C statistic was used for fitting to source spectra with the background subtracted (Cash, 1979). Since the C statistic cannot formally be used when the background is subtracted, xspec uses a modified version of the C statistic known as the W statistic to account for this. We describe the five new sources we found below.
2.1 Swift J130456.1-493158, an X-ray transient in the field of NGC 4945
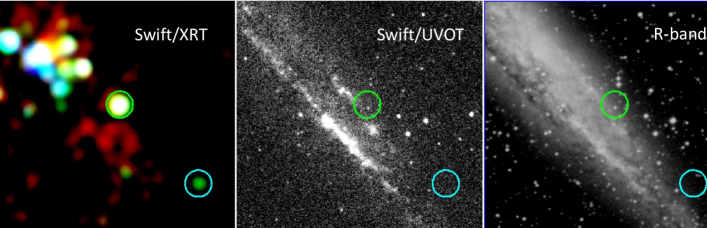
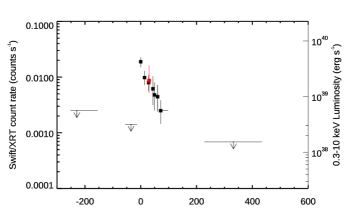
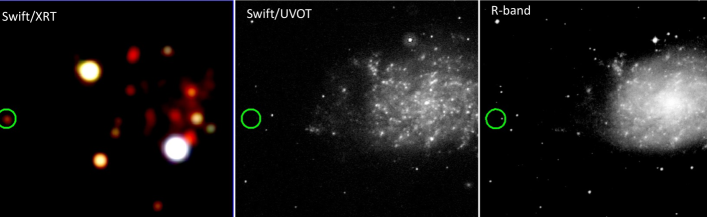
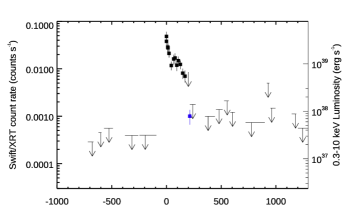
Swift J130456.1-493158 was first detected in a Swift/XRT observation taken on 2021 February 8 (obsID 00013908005). The target of the Swift observation was NGC 4945 X-1 (Brandt et al., 1996), an ultraluminous X-ray source hosted by NGC 4945, a barred spiral galaxy in the constellation Centaurus. The enhanced position given by the online tool was R.A. = 196.23411∘, -49.53306∘(=13h 04m 56.19s, -49∘31′59.0″) with an error radius of 3.2″(90% confidence). The position of Swift J130456.1-493158 appears to place the source in the outskirts of the galaxy (Figure 1). No X-ray source has been reported at this position previously, despite multiple Chandra, XMM-Newton, Suzaku, NuSTAR and Swift observations, the last of which was by Swift only 2 weeks prior to the new X-ray source being detected, as shown in the lightcurve in Figure 2. After the source was initially detected, it declined in brightness from its peak, becoming undetected by Swift/XRT 60 days after its initial detection, even in stacked observations.
We used the online tool to extract the stacked Swift/XRT spectrum of the source from 6 observations during which the source was detected. The total exposure time was 12.9 ks. The online tool fitted the spectrum with an absorbed power-law model, which yielded with 62 DoFs where cm-2 and assuming a Galactic column density of cm-2 (Willingale et al., 2013). The 0.3-10 keV unabsorbed flux from this model was erg cm-2 s-1, which implies a luminosity of erg s-1 at 3.7 Mpc. The count rate to flux conversion factor was erg cm-2 count-1, which we used to determine the luminosity axis in Figure 2.
The deepest upper limit on the flux of Swift J130456.1-493158 prior to its detection is from Chandra observations which have a sensitivity of erg cm-2 s-1 in the 0.5–8 keV band listed in CSC2 (Evans et al., 2010). This is 3 orders of magnitude lower than the flux measured above. The deepest upper limit from XMM-Newton observations is erg cm-2 s-1 in the 0.2–12 keV band listed in XSA.
We also obtained a Chandra DDT observation of the source which took place on 2021 March 10 (obsID 24986), with ACIS-S at the aimpoint in VFAINT mode. The source was well detected with a count rate of counts s-1 in the 10 ks exposure. We extracted the Chandra spectrum with specextract from circular regions, radius 1.5″ for the source and 7.5″ for the background. The spectra were grouped with a minimum of 1 count per bin with the tool grppha.
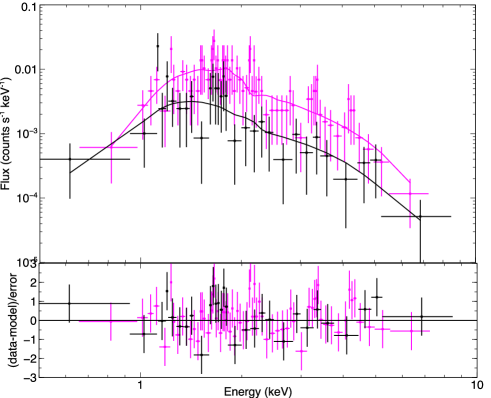
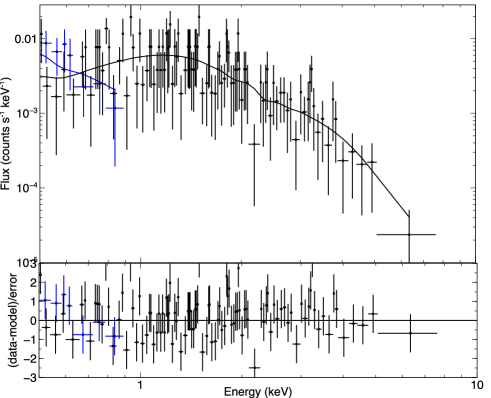
We fitted the Chandra spectrum of the source with the same model used to fit the Swift/XRT spectrum described above. Since we did not find evidence for spectral variability between Swift/XRT and Chandra, we fitted the joint Swift/XRT and Chandra spectrum of the source in xspec, with a constant to account for cross-calibration uncertainties and the flux variability of the source. This yielded for 174 DoFs. The cross-calibration constant for the Swift/XRT spectrum is set to unity, and the constant for the Chandra spectrum is . We find cm-2 and . The log of the 0.3–10 keV unabsorbed flux from this model corresponding to the time of the Chandra observation is , which implies a luminosity of erg s-1 at 3.7 Mpc. The spectrum is shown in Figure 3.
We also trialled a diskbb model in place of the powerlaw one, which produced for 174 DoFs, a slightly worse fit for the same number of DoFs. We find cm-2 and with a normalization, . The normalization is related to the inner disk radius by , where is the inner disk radius in km, is the distance to the source in units of 10 kpc, and is the inclination angle of the disk. Assuming a face-on disk () yields km which is the innermost stable orbit of a 5 black hole. We note that the luminosity estimate would be a factor of 3.5 lower if this model is assumed and integrated over all energies.
We also used the Chandra data to acquire a more precise position of Swift J130456.1-493158. We compiled an X-ray source list of the Chandra observation in the 0.5–8 keV band using wavdetect with default parameters and cross-matched this with a Gaia EDR3 source list of the region (Gaia Collaboration et al., 2018), selecting sources within 1.0″ of each other, which produced four Chandra/Gaia matched sources. We define the astrometric shifts as the mean difference in RA and Dec between these matched sources which is RA″ and Dec″. The corrected position is R.A. = 13h 04m 56.350s (196.23479∘), Decl.=-49∘ 31′ 59.66″ (-49.533239∘, J2000), which lies in the middle of the Swift error circle. The mean residual offset between the corrected Chandra positions and the Gaia positions is 0.53″, which we use as our positional error. There are no sources catalogued at other wavelengths within the Chandra error circle. The closest source is a near-IR source cataloged by the VISTA Hemisphere Survey (VHS, McMahon et al., 2013) and lies 1.68″ from the Chandra position, and is therefore unlikely to be related. Despite numerous HST observations of NGC 4945, none of them covered the region of the source.
We ran the tool uvotsource on the Swift/UVOT images to obtain photometry of the source in the UV bands using a 2″ radius circular region centered on the X-ray position. The source was not detected and we obtained upper limits of , and taken from observations when the X-ray source was bright.
2.2 Swift J130511.5-492933, a second X-ray transient in the field of NGC 4945
This X-ray source was also detected in a Swift/XRT observation of NGC 4945 X-1, and was first detected on 2021 September 24 (obsID 00013908017), 7 months after Swift J130456.1-493158 as described in Section 2.1 above. The astrometrically corrected position given by the online tool from the first 22 obsIDs where the source was detected was 196.2985∘, -49.4928∘ (=13h 05m 11.65s, -49∘ 29′ 34.3″) with an error radius 2.4″ (90% confidence) and we henceforth refer to this source as Swift J130511.5-492933. No X-ray source has previously been reported within the positional error circle of Swift J130511.5-492933. The Swift/XRT lightcurve of the source produced by the online tool is shown in Figure 4, which shows the source declining in brightness until days after its initial detection, after which the source was undetected by Swift/XRT. The XRT, UVOT and -band images are shown in Figure 1 which show that similarly to Swift J130456.1-493158, Swift J130511.5-492933 appears to be in the outskirts of NGC 4945.

We ran the tool uvotsource on the Swift/UVOT images to obtain photometry of the source in the UV and optical bands using a 2″ radius circular region centered on the X-ray position. The source was not detected and we obtained upper limits of , , , , , and , taken from obsID 00015017005 taken when the source was X-ray bright.
As with Swift J130456.1-493158, no source at any wavelength is catalogued within the error region for this X-ray source, and none of the HST observations of NGC 4945 cover the region. Once again the closest source is a mag near-IR source which lies 4.7″ from the astrometrically corrected position of the X-ray source, outside the 90% error circle (2.4″ radius).
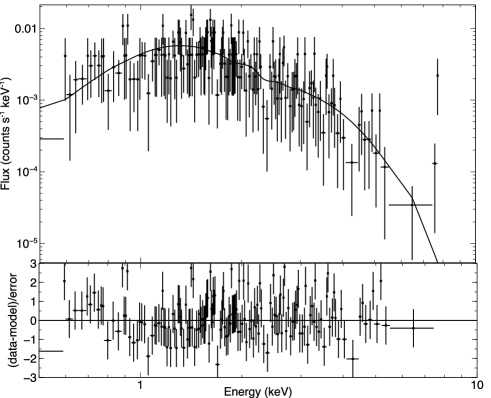
We used the online tool to extract the stacked Swift/XRT spectrum of the source (first 26 observations since detection) with a total exposure time of 45.1 ks. The online tool fitted the spectrum with an absorbed power-law model, which yielded with 252 DoFs where cm-2 and assuming a Galactic column density of cm-2 (Willingale et al., 2013). The 0.3-10 keV unabsorbed flux from this model erg cm-2 s-1, which implies a luminosity of erg s-1 at 3.7 Mpc. The count rate to flux conversion factor was erg cm-2 count-1, which we used to determine the luminosity axis in Figure 4.
Fitting in xspec, we found an improvement in the fit could be found with a multicolor disk component (diskbb) in the place of the power-law component, which yielded =246.11 with 252 DoFs. The best-fit parameters of this model were cm-2, keV, . As for Swift J130456.1-493158, if we assume a face-on disk we find km which is the innermost stable orbit of a 6 black hole. We note that the luminosity estimate would be a factor of 1.9 lower if this model is assumed and integrated over all energies. We plot the spectrum of Swift J130511.5-492933 in Figure 5.
Unfortunately the Chandra observation taken of Swift J130456.1-493158 as described above did not have Swift J130511.5-492933 in the field of view. The deepest upper limit on the flux of Swift J130511.5-492933 prior to its detection with Swift/XRT is from other Chandra observations which have a sensitivity of erg cm-2 s-1 in the 0.5–8 keV band listed in CSC 2.0. This is 3 orders of magnitude lower than the flux measured above. The deepest historical upper limit from XMM-Newton observations is erg cm-2 s-1 in the 0.2–12 keV band listed in XSA.
A 150-ks XMM-Newton observation of NGC 4945 took place on 2022 July 5, 284 days after Swift J130511.5-492933 was detected. The XMM data were reduced using a pipeline that utilizes v19.1.0 of the Science Analysis Software (SAS). The cifbuild command was used to create a CCF corresponding to the observations, and the odfingest command was used to produce a SAS summary file. The data were reduced and MOS and pn event files were created using the emproc and epproc commands, respectively. We first identify periods of high background by creating a lightcurve of the events in the 10–12 keV band, creating good time intervals where the rate was counts s-1 in this band in the pn detector leaving 99 ks for the pn and 101 ks for the MOS. Events were selected with for the pn and for the MOS.
Upon inspection of the images, a faint X-ray enhancement appears at the source location in both the pn and MOS1 data. To test whether this is a detection, spectra were extracted using the specextract command with circular source regions of radii 16″. Local background was accumulated from annuli of the same area just around the source regions. The resulting spectra are heavily background dominated which requires extensive modeling. We therefore calculate an upper limit on the flux of the source by assuming that the spectrum does not change and applying the best-fitting Swift/XRT model of a multicolor disk component (diskbb) with = cm-2, and keV to the source+background spectrum in xspec. This yields an upper limit on the 0.3-10 kev flux of erg cm-2 s-1, which implies a 0.3–10 keV unabsorbed luminosity of , well below the luminosity measured by Swift/XRT only 30 days prior (Figure 4).
2.3 2SXPS J235825.7-323609, an X-ray transient in the field of NGC 7793
This X-ray source was first detected in a Swift/XRT observation taken on 2018 April 28 (obsID 00094097003) and not found in our real time search, rather a search through archival data. The target of the Swift observation was NGC 7793 P13, an ultraluminous X-ray source hosted by NGC 7793 (Read & Pietsch, 1999) known to be a ULX pulsar (Fürst et al., 2016; Israel et al., 2017b). The enhanced XRT position given by the online tool was R.A.=359.60774∘, Decl.=-32.60254∘(=23h 58m 25.86s, -32∘36′09.2″) with an error radius of 2.5″(90% confidence, Figure 6).
The source is listed in the 2SXPS catalogue as 2SXPS J235825.7-323609 with a mean count rate of 5.37 counts s-1, detected in a stack of data over the date range 2010-08-16–2018-07-28. This average count rate was 2 orders of magnitude below the newly detected count rate. We note that this average flux is from a date range that covers periods both when the source was undetected in individual observations and when it was detected in individual observations.
Since this source was first catalogued in 2SXPS, we henceforth refer to it by its catalogued name 2SXPS J235825.7-323609. The lightcurve produced by the online tool is shown in Figure 7. This shows that prior to 2018 April 28, the source was not detected in stacked observations with upper limits consistent with the 2SXPS count rate. The source was not detected in the XRT observation immediately preceding April 28 on April 22. After reaching its peak, the source declined monotonically until it was no longer detected by Swift/XRT 180 days afterwards.
A diskbb model in place of the powerlaw one produced an improvement in the fit of C=-9, where cm-2 and with a normalization, . The normalization corresponds to km which is the innermost stable orbit of a 6 black hole when assuming a face on disk. We note that the luminosity estimate would be a factor of 1.7 lower if this model is assumed and integrated over all energies.
An XMM-Newton observation took place on 2018-11-27, 213 days after the initial detection by Swift/XRT (obsID 0823410301). We filter the data in the same way as described for Swift J130511.5-492933, which results in 17.6 ks of data. A circular region with a radius of 15″ was used to extract the source spectrum, and an annulus with inner radius 25″ and outer radius of 45″ was used to extract the background spectrum. The data were grouped with a minimum of 1 count per bin using grppha. The source was background dominated above 1 keV so we excluded these channels and the resulting average count rate in the 0.2–1 keV band was 2.5 counts s-1.
Due to the narrow bandpass, we fit the XMM-Newton spectrum with the same model as for the Swift spectrum, with all parameters fixed with the exception of the normalization, which yielded with with 54 DoFs. The 0.3–10 keV flux is 4.6 erg cm-2 s-1, which implies a luminosity of 7.9 erg s-1 at 3.8 Mpc (Sabbi et al., 2018). We plot this flux in Figure 7. The source was not detected in an observation only 1 month after the above XMM-Newton observation (obsID 0823410401 on 2018-12-27). The upper limit on the 0.2–10 keV flux is listed as 5.9 erg cm-2 s-1 in 4XMM from this observation, with similar upper limits provided by further observations since then. We show the Swift and XMM-Newton spectra in Figure 8.
The deepest upper limit from XMM-Newton observations prior to the Swift detection is erg cm-2 s-1 in the 0.2–12 keV band listed in XSA. This is 2 orders of magnitude lower than the peak flux measured above.
4XMM DR11 lists the source from obsID 0823410301 as 4XMM J235825.9-323610 at R.A.=23h 58m 25.98s and Decl.=-32∘36′10.5″ with a positional error of 1.0″, which is an improvement on the XRT position.
Fortuitously, HST has observed the region of 2SXPS J235825.7-323609 as part of the GHOSTS survey (Radburn-Smith et al., 2011) with the ACS and F606W and F814W filters. However, no source is listed in the Hubble Source Catalogue (v3) within the XMM-Newton positional error and the closest source lies 2.1″ away.
We ran uvotsource on the mostly -band UVOT data but did not detect the source in any observation to a limiting magnitude of .
2.4 Swift J235749.9-323526, a second X-ray transient in NGC 7793
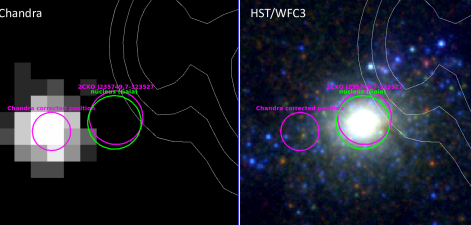
This X-ray source was also detected in a Swift/XRT observation of NGC 7793 P13, and was first detected on 2022 September 25 (obsID 00031791173), 4 years and 5 months after Swift J130511.5-492933 (see Section 2.3 above). The enhanced position given by the online tool from the first 9 obsIDs where the source was detected was 359.458∘, -32.590806∘ (=23h 57m 49.92s, -32∘ 35′ 26.9″) with an error radius 2.5″ (90% confidence) and we henceforth refer to this source as Swift J235749.9-323526 (Figure 9). A faint Chandra source, 2CXO J235749.7-323527, has previously been reported within the positional error circle of Swift J235749.9-323526 with a flux of erg cm-2 s-1 in the 0.5–7 keV band, 3 orders of magnitude lower than the inferred XRT flux, which is also coincident with the Gaia nuclear position of the galaxy (Figure 9). The Swift/XRT lightcurve of the source produced by the online tool is shown in Figure 10, which shows the source declining in brightness from its initial detection. A lightcurve binned by snapshot rather than observation is also shown to highlight some short-term variability seen.
We used the online tool to extract the stacked Swift/XRT spectrum of the source (first 9 observations since detection) with a total exposure time of 14 ks. The online tool fitted the spectrum with an absorbed power-law model, which yielded with 204 DoFs where cm-2 and assuming a Galactic column density of cm-2 (Willingale et al., 2013). The 0.3-10 keV unabsorbed flux from this model erg cm-2 s-1, which implies a luminosity of erg s-1 at 3.8 Mpc. The count rate to flux conversion factor was erg cm-2 count-1, which we used to determine the luminosity axis in Figure 10.
We obtained a NuSTAR DDT observation of Swift J235749.9-323526 which occurred on 2022 October 7 (obsID 90801526002) with an exposure of 53 ks. We used heasoft v6.28, nustardas v2.0.0 and caldb v20211115 to analyze the data. We produced cleaned and calibrated events files using nupipeline with the default settings on mode 1 data only. We used nuproducts to produce spectral data, including source and background spectra, and response files. A circular region with a radius of 40″ was used to extract the source spectra and a radius of 80″ was used to extract the background spectra, taking care to extract the background from the same chip as the source. The source is detected with a count rate of counts s-1 in the 3–10 keV band in each FPM, above which the background dominates the source. We used the absorbed power-law model described above to determine the flux plotted in Figure 10.
We also obtained a Chandra DDT observation of the source which took place on 2022 October 27 (obsID 27481), with ACIS-S at the aimpoint in VFAINT mode. The source was well detected with a count rate of counts s-1 in the 10 ks exposure. We extracted the Chandra spectrum with specextract from a circular region, radius 2.0″ for the source and an annulus radii of 3.1 and 6.2″ for the background. The spectra were grouped with a minimum of 1 count per bin with the tool grppha. Again we used the absorbed power-law model from the Swift data to determine the flux plotted in Figure 10.
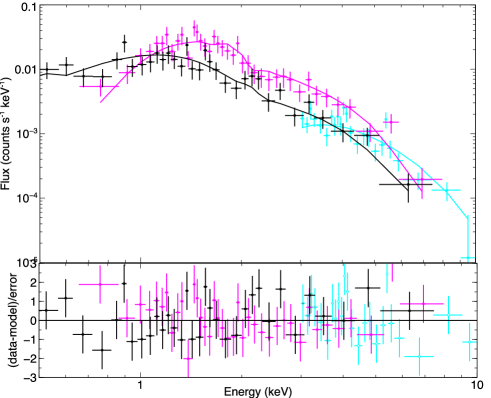
We then fitted the Swift, NuSTAR and Chandra data simultaneously initially with an absorbed power-law model in xspec, with a constant to account for cross-calibration uncertainties and the flux variability of the source. This yielded for 611 DoFs. However, this revealed structure in the data to model residuals indicating that a more complex model was required. We then trialled the addition of a high energy cut off to the power-law model (cutoffpl) which lead to an improved for 610 DoFs. A multicolor disk blackbody model, diskpbb, similarly produced for 610 DoFs, which we select as our best-fit model due to the slightly better fit statistic. The best-fit parameters are intrinsic line-of-sight column density cm-2, inner disk temperature keV, disk temperature index (where -l indicates the lower bound uncertainty reached the lower limit of 0.5 for the parameter) and normalization . the total luminosity of this model is erg s-1. Given the normalization of the diskpbb model and assuming a face-on inclination of the disk (∘), the implied black hole mass is 4 for a non-spinning black hole. The spectra fitted with this model are shown in Figure 11. We also checked for variation of the parameters between observations by untying them in the fit, but did not find any evidence for this.
We also used the Chandra data to acquire a more precise position for Swift J235749.9-323526 in the same way as was done for Swift J130456.1-493158, which produced seven Chandra/Gaia matched sources. The astrometric shifts were RA″ and Dec″. After subtracting these shifts, the corrected position is R.A. = 23h 57m 49.903s (359.45793∘), Decl.=-32∘ 35′ 27.97″ (-32.591104∘, J2000), which lies within the Swift error circle. The mean residual offset between the corrected Chandra positions and the Gaia positions is 0.57″, which we use as our positional error. With this improved positional uncertainty, 2CXO J235749.7-323527 and the nucleus of NGC 7793 are excluded as counterparts to this new X-ray source since they lie 2.0″ away (Figure 9). 2CXO J235749.7-323527 was not detected in this observation, however. Its reported flux was around the limiting flux of the new observation, which is the likely reason for the non-detection. There are also no other sources catalogued at other wavelengths within the Chandra error circle for Swift J235749.9-323526, with the exception of eight Hubble Source Catalog (HSC) v3 sources (Whitmore et al., 2016) which we will discuss in Section 4.1.
Finally, due to the possibility that Swift J235749.9-323526 was a nuclear transient, we obtained radio follow-up of the source with the Very Large Array (VLA). The VLA observations were carried out on 2022 October 27 at X-band (8-12 GHz), in C configuration. The angular resolution was 5.9″″, slightly larger than the nominal one due to the low declination of the source. The field of view included the entire host galaxy structure. We did not detect radio emission at the position of the source obtained by Chandra, resulting in a 3- upper limit of 18 Jy/beam. An emitting region is visible starting 3″ towards west from the transient position ( Fig 9), with an angular size of about 13″ corresponding with optical emission from the nuclear star cluster (e.g. Carson et al., 2015; Mondal et al., 2021).
2.5 Swift J095520.7+690401, an X-ray transient in the field of M81
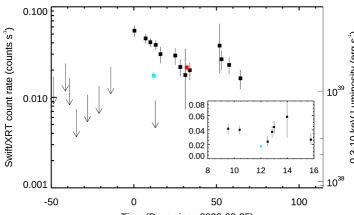
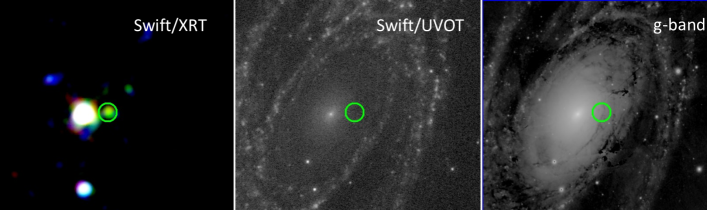
This X-ray source was first detected in a Swift/XRT observation taken on 2022 April 3 (obsID 00096886002). The target of the Swift observation was M81, a Seyfert 2 galaxy. The enhanced position given by the online tool was 148.83625∘, 69.06692∘ (=09h 55m 20.70s, +69∘ 04′ 00.9″), with an error radius of 3.2″(90% confidence) which appeared to place the source within the galaxy 1.1′ from the nucleus (Figure 12). We will henceforth refer to this source as Swift J095520.7+690401. No X-ray source had been reported at this position previously, despite multiple Chandra, XMM-Newton, NuSTAR and Swift observations, the last of which was by Swift 2 days prior to the new X-ray source being detected, albeit in a short (200 s) observation.
Since this source is close to the bright nucleus of M81, we do not use the automated online tool to generate the spectrum and lightcurve as for the other sources. This is to ensure that the nucleus is properly accounted for. We therefore download the observations and extracted events of the source using the heasoft v6.25 tool xselect (Arnaud, 1996). Source events were selected from a circular region with a 25″ radius centered on the above coordinates. Background events were also selected from a circular region with a 25″ radius placed at the same distance from the nucleus as the source in order to sample the PSF at its position. For each source spectrum, we constructed the auxiliary response file (ARF) using xrtmkarf. The relevant response matrix file (RMF) from the CALDB was used. All spectra were grouped with a minimum of 1 count per bin for spectral fitting purposes.
We start by simultaneously fitting the Swift/XRT spectra from the first 15 observations where the source was detected. We fitted the spectra with an absorbed power-law model with a constant applied to account for the variability of the source from observation to observation. This yielded with 94 DoFs where cm-2 and . To produce the lightcurve, we stack the individual observations in time bins of 10 days using the tool addascaspec and again group the stacked spectra with a minimum of 1 count per bin. We then fit these with the above model where and are frozen. We plot the flux and implied luminosity in Figure 13.
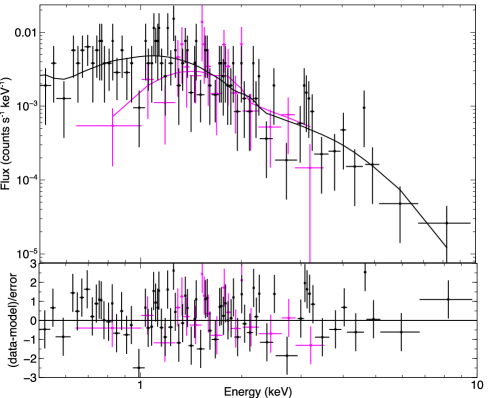
We also obtained a Chandra DDT observation of the source which took place on 2022 June 04 (obsID 24621), with ACIS-S at the aimpoint in FAINT mode. The source was well detected with a count rate of counts s-1 in the 10 ks exposure. We extracted the Chandra spectrum with specextract from a circular region, radius 2.0″ for the source and an annulus radii of 2.5 and 12 ″ for the background. The spectra were grouped with a minimum of 1 count per bin with the tool grppha. We fitted the spectrum with an absorbed power-law model as done for the Swift/XRT data which yielded with 35 DoFs where cm-2 and , consistent with Swift/XRT, albeit with large uncertainties. If we fit the stacked Swift/XRT data and the Chandra data together we find with 128 DoFs where cm-2 and . We show these spectra in Figure 14.
A diskbb model in place of the powerlaw one produced a worsened fit with C=10, where cm-2 and with a normalization, . The normalization corresponds to km which is the innermost stable orbit of a 5 black hole when assuming a face on disk. We note that the luminosity estimate would be a factor of 1.8 lower if this model is assumed and integrated over all energies.
The deepest upper limit on the flux of Swift J095520.7+690401 prior to its detection with Swift/XRT is from Chandra observations which have a sensitivity of erg cm-2 s-1 in the 0.5–8 keV band listed in CSC 2.0. This is 3 orders of magnitude lower than the flux measured above. The deepest upper limit from XMM-Newton observations is erg cm-2 s-1 in the 0.2–12 keV band listed in XSA and is from a slew.
We also used the Chandra data to acquire a more precise position for Swift J095520.7+690401 in the same way as was done for Swift J130456.1-493158 and Swift J235749.9-323526, which produced nine Chandra/Gaia matched sources. The astrometric shifts were RA″ and Dec″. After subtracting these shifts, the corrected position is R.A. = 09h 55m 20.873s (148.83697∘), Decl.=+69∘ 04′ 02.53″ (+69.06737∘, J2000), which lies towards the edge of the Swift error circle. The mean residual offset between the corrected Chandra positions and the Gaia positions is 0.33″, which we use as our positional error. There are no sources catalogued at other wavelengths within the Chandra error circle, with the exception of 3 Hubble Source Catalog (HSC) v3 sources (Whitmore et al., 2016) which we will discuss in Section 4.1.

3 What is the nature of these sources?
3.1 Foreground sources in our Galaxy?
If these transient X-ray sources are within our Galaxy, the implied peak luminosities would be erg s-1 if assuming a distance of 10 kpc. On the timescale-luminosity plot of Polzin et al. (2022) the source types most consistent with this luminosity and timescales of days are classical/dwarf novae, however novae are usually accompanied by optical/UV emission (e.g. Page et al., 2020). This luminosity is comparable to X-ray flares from stars, but the X-ray activity lasted much longer than typical stellar flares which are not normally longer than a few hours (e.g. Pye et al., 2015). Furthermore, the lack of any stellar counterpart at other wavelengths, particularly in the HST observations of 2SXPS J235825.7-323609, make the association with a star in our Galaxy unlikely. These HST observations contained sources down to , which when applying a distance modulus of 15 corresponding to 10 kpc implies . This does not rule out a white dwarf or cool main sequence star, however.
3.2 Sources in the background of these nearby galaxies?
With the exception of Swift J235749.9-323526 and Swift J095520.7+690401, which appear to be in the disks of NGC 7793 and M81 respectively and therefore not likely to be in the background of these galaxies, the other sources may be in the background of the galaxy they appear to be associated with. If so, their timescales and fluxes compare well with tidal disruption events (TDEs, e.g. Auchettl et al., 2017). Assuming a typical TDE X-ray luminosity of erg s-1, this puts the sources at . At this distance, all known TDE host galaxies (e.g. French et al., 2020) have a -band magnitude of 17.5–21.5. The HST observation of 2SXPS J235825.7-323609 would have detected a background galaxy where the (wide band) observations reach . Furthermore, TDEs are usually also bright in the optical/UV, so the lack of a UVOT counterpart also argues against a TDE. Gamma-ray bursts also have much shorter timescales than these X-ray transients, of the order hours (e.g. Tarnopolski, 2015). The after-glows of Gamma-ray bursts are longer, but are usually accompanied by emission at other wavelengths.
4 A new population of transient ULXs
If we can rule out foreground sources in our Galaxy, and background sources, we are left with the conclusion that these X-ray sources are associated with the galaxies close in projected separation to them, i.e. NGC 4945, NGC 7793 and M81. At the distances to these galaxies, all at 3–4 Mpc, their peak luminosities are 2–3 erg s-1. While supernovae can produce these X-ray luminosities on the timescales observed (Chevalier & Fransson, 2017), the lack of optical/UV emission disfavors a supernova origin for these sources. This then makes these sources likely ULXs. While these galaxies are known hosts to other ULXs, these other ULXs are relatively persistent sources, whereas the sources we have identified are transient.
With the exception of 2SXPS J235825.7-323609, all our sources are within the isophotal ellipses of their apparent host galaxies which are traditionally used for the creation of ULX catalogs (e.g. Earnshaw et al., 2019a; Walton et al., 2021a). 2SXPS J235825.7-323609 is 1.7 times further from the center of NGC 7793 than the semi-major axis of that galaxy’s isophotal ellipse and therefore would have been missed by these catalogs.
For Swift J235749.9-323526, the Swift/XRT position was consistent with the nucleus which initially made it a candidate TDE, albeit a low luminosity one. However, the NuSTAR spectrum revealed a turnover in the spectrum of the source that is characteristic of ULXs, and not seen so far in TDEs. Furthermore, the more precise position provided by Chandra ruled out the nucleus, confirming that the source was indeed a ULX.
4.1 A search for the stellar counterparts
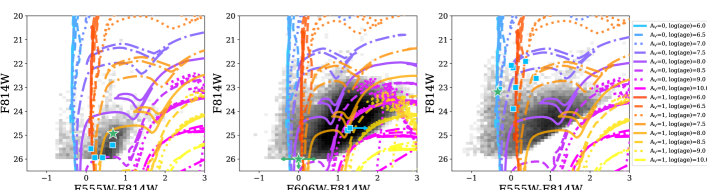
As mentioned in Section 2, HST has observed the regions of 2SXPS J235825.7-323609, Swift J095520.7+690401 and Swift J235749.9-323526. 2SXPS J235825.7-323609, which is in the outskirts of NGC 7793, was observed as part of the GHOSTS survey (Radburn-Smith et al., 2011) with the ACS and F606W and F814W filters. While none of the sources detected in these observations are within the X-ray positional uncertainty region, several are nearby, the properties of which may yield clues as to the environment of the source. The position of the X-ray source is 7.6′ from the center of NGC 7793, which implies a projected distance of 8.4 kpc assuming a distance of 3.8 Mpc to the galaxy (Figure 6). The HST observations were all taken many years before the X-ray transients, so the photometry is unlikely to be contaminated by the accretion disks.
In Figure 15 we present color magnitude diagrams (CMDs) with all stars in the vicinity of the ULX plotted in the black histogram in the background. The green star (or green arrows) on each CMD indicates the star closest to the ULX source position and the blue squares indicate stars within the positional error circle (with the exception of 2SXPS J235825.7-323609 where we show the stars within 10″). Some stars had non-detections in the HST filters we plot here, and these non-detections are indicated with arrows. In the middle panel, we have two stars plotted with non-detections. The green arrows indicate a star that was not detected in either band plotted, and the star plotted with a horizontal arrow was detected in the F814W band, but not the F606W band.
We include isochrones from the Padova stellar models (Marigo et al., 2008; Bressan et al., 2012; Marigo et al., 2017) at different ages, which are listed in the figure legend. The purple lines represent isochrones of various ages with no dust extinction applied (AV=0.0) and the orange lines represent isochrones with 1 magnitude of dust extinction (AV) applied using the reddening coefficients from Schlafly & Finkbeiner (2011) in the HST filters presented in each CMD.
For 2SXPS J235825.7-323609 the closest stars lie on the red giant branch (RGB) of the CMD described in Radburn-Smith et al. (2011). The closest source falls in a region identified by Radburn-Smith et al. (2012) as belonging to old RGB stars with ages of 1–10 Gyr. Our isochrones imply they could be 100–300 Myr or 1–30 Myr with 1 AV of extinction. The case is similar for Swift J095520.7+690401. For Swift J235749.9-323526, the closest star lies on the main sequence with an age of 1–10 Myr. The other stars within the positional error circle may have ages of up to 30 Myr.
4.2 Previous results on transient ULXs
While other transient ULXs have previously been presented in the literature, many, if not all of these sources were discovered serendipitously, and not in real time. As far as we know, this is the first study to carry out a systematic search for transient ULXs outside of our Galaxy in real time, allowing us to conduct a more detailed study with follow up observations, such as with Swift to get well-sampled lightcurves, Chandra to obtain more precise positions, and NuSTAR to obtain a broadband spectrum.
We have reported on two transient ULXs in NGC 4945, however two other transient X-ray sources, Suzaku J1305-4931 and Suzaku J1305-4930, with ULX or close-to-ULX luminosities were reported by Isobe et al. (2008) and Ide et al. (2020) from Suzaku observations of the galaxy. The sources were detected at positions of 13h 05m 05.s5, -49∘ 31″ 39″ and 13h 05m 17s.0, -49∘ 30′ 15″ respectively. Suzaku J1305-4931 was active in 2006 Jan and Suzaku J1305-4930 was active in 2010 July, and lasted less than 6 months. Both Suzaku sources were close to our Swift/XRT sources (′ from either), but closer to the plane of the galaxy.
In addition to 2SXPS J235825.7-323609 and Swift J235749.9-323526 in NGC 7793, Quintin et al. (2021) reported the discovery of another transient ULX in that galaxy found while looking for long-term variability of XMM-Newton sources in the 4XMM-DR9 catalogue. The source, which they name NGC 7793 ULX-4, was active for 8 months from 2012 May–Nov. The ULX had a position of 23h 57m 47s.9 -32∘ 34′ 57″ which is close to the center of the galaxy, ′ from 2SXPS J235825.7-323609 and ″ from Swift J235749.9-323526. They also reported a pulsation signal at 2.52 Hz from the XMM-Newton data making it the second ULX pulsar in that galaxy.
Examples of other transient ULXs presented in the literature are ones in M31 (Middleton et al., 2012, 2013), M51 (Brightman et al., 2020), M83 (Soria et al., 2012), M86 (van Haaften et al., 2019), NGC 55 (Robba et al., 2022), NGC 300 (Carpano et al., 2018), NGC 821 (Dage et al., 2021), NGC 925 (Earnshaw et al., 2020), NGC 1365 (Soria et al., 2007), NGC 3628 (Strickland et al., 2001), NGC 4157 (Dage et al., 2021), NGC 5907 (Pintore et al., 2018), NGC 6946 (Earnshaw et al., 2019b) and NGC 7090 (Liu et al., 2019; Walton et al., 2021b).
One of the best studied transient ULXs is NGC 300 ULX1, which was classified as a supernova imposter in 2010, with an observed X-ray luminosity of 5 erg s-1(Binder et al., 2011). The source was observed at lower fluxes in observations made in 2014 (Binder et al., 2016) but then reached ULX luminosities during observations made in 2016 with erg s-1 during which pulsations were detected (Carpano et al., 2018) identifying it as a ULX pulsar powered by a neutron star. Regular Swift monitoring of the source in 2018 revealed that the source initially persisted at these luminosities but then went into decline. Spectral analysis showed a hard spectrum.
Another source, Swift J0243.6+6124, was an X-ray transient found in our own Galaxy, identified by Swift/BAT (Cenko et al., 2017) and with no previously reported activity. The source reached an X-ray luminosity of erg s-1 in a period of around 30 days, before steadily declining over a period of days (Wilson-Hodge et al., 2018). The detection of pulsations also identified it as a neutron star accretor (Kennea et al., 2017) and Kong et al. (2022) reported the detection of a cyclotron resonance scattering feature at 146 keV with HXMT, allowing for the estimation of the magnetic field strength to be G. The source exhibited re-brightenings in the X-ray after the decline, albeit to peak luminosities around 2 orders of magnitude less than the initial outburst (van den Eijnden et al., 2019). The companion star is a known Be type.
RX J0209.6-7427 is a Be X-ray binary in the SMC and also briefly became ULX pulsar in 2019 (Chandra et al., 2020; Vasilopoulos et al., 2020; Coe et al., 2020). The spin period was 9.3 s and reached a luminosity of 1–2 erg s-1 similar to the super-Eddington outburst of SMC X-3 (Tsygankov et al., 2017). Karino (2022) discussed the possibility that a large number of ULXs are formed of Be HMXBs.
We also note that the peak luminosities of these sources, disk temperatures, and implied inner disk radii are similar to the brightest outbursts from Galactic X-ray binaries such as GRO J1655-40, GX 339-4 and XTE J1550-564 when considering fits with the disk model.
4.3 Are these new transient ULXs also Be X-ray binaries?
As described above, many well known ULX transients are Be X-ray binaries in outburst, therefore it is reasonable to ask if these new systems are also Be XRBs. The peak luminosities of 2–3 erg s-1 are consistent with the type II outbursts from these sources, however Be XRBs typically have longer rise times, up to 50 days from detection to peak, whereas our ULX transients have rise times of 10 days or less where the the lightcurves are well sampled (Reig & Nespoli, 2013). Furthermore, Be stars are young and massive, at odds with the older stellar population that 2SXPS J235825.7-323609 and Swift J095520.7+690401 are found in. For Swift J235749.9-323526, the potential stellar counterparts are young and massive, therefore we cannot rule out a Be star in this case.
4.4 Modeling the lightcurves with a disk-instability model
A model was presented in Hameury & Lasota (2020) to explain the transient ULX phenomenon with a disk instability model previously used to explain dwarf novae and other X-ray transients. There, the super-Eddington outbursts can be explained by thermal-viscous instabilities in large unstable disks with outer radii greater than km. They showed that this model can successfully reproduce the lightcurve of the transient ULX M51 XT-1 presented in Brightman et al. (2020), with derived accretion rates of 6–15 g s-1 depending on the mass of the accretor.
We fit the observed transient ULX lightcurves using these models. Hameury & Lasota (2020) provides analytical formulas that accurately approximate the observable properties of the outbursts. According to this model, the accretion disk in outburst is brought into a fully hot state, then the disk mass decreases until the surface density at the outer edge of the disk becomes inferior to the critical value below which quasi–stationary hot states can no longer exist. This results in a cooling wave, propagating into the disk from its outer edge, bringing the whole disk back into a low state. When the disk is fully in the hot state, it is close to steady state with a mass accretion rate that is constant with radius and larger than the mass transfer rate from the secondary. Hameury & Lasota (2020), following Ritter & King (2001) have shown that during this phase, the accretion rate does not decrease exponentially, but according to:
| (1) |
where is the initial mass accretion rate and is a characteristic timescale which depends on and the disk parameters (size, viscosity):
| (2) |
where is measured in units of g s-1, is the disk size in units of 1012 cm, the accretor mass in solar units and the Shakura-Sunyaev viscosity parameter normalized to 0.2. Therefore, for given binary parameters and disk viscosity, the initial time evolution of the disk depends only on one free parameter, the initial accretion rate. Conversely, the determination of from observations (at time , the mass accretion rate is one tenth of its initial value) enables one to determine the disk size. This phase lasts until the accretion rate falls below the critical rate at which the hot solution can no longer exist at the outer radius. Using Eqs. (1), (2) and the fits for provided by Hameury & Lasota (2020) in their Eq. (9), one finds that the duration of this phase is:
| (3) |
and is followed by a rapid decay phase during which the accretion rate drops steeply; the duration of this final phase is
| (4) |
where is a parameter describing the effect of irradiation on the disk.
The above equations describe the time evolution of the mass accretion rate as a function of only four parameters: the initial (i.e. peak) mass accretion rate, , and to which one could add which enters only via . The parameters and , as defined in Hameury & Lasota (2020), were taken equal to 1.3 and 6.3 respectively, since, as discussed in Hameury & Lasota (2020), these values provide the best agreement between the numerical results and their analytical approximations. accounts for deviations of the opacities from the Kramers’ law and is the ratio between the rate at which the inner, hot disk mass decreases and the accretion rate at the inner edge; it is larger than unity because of the strong mass outflow at the cooling front.
In order to compare the model predictions with observations, one must convert mass accretion rates into luminosities; we used for luminosities larger than the Eddington value, where is a constant which differs from, but is related to the beaming parameter (see King, 2009). This relation differs somewhat from the formula derived by King (2009), valid only for strong beaming; we modified it in order to account for a smooth transition with the case where beaming is negligible, as explained in Hameury & Lasota (2020).
If the final decay is not observed, one cannot determine the viscosity parameter, since the disk radius, which enters Eq. (2), is not known a priori. One can nevertheless obtain upper limits on because the observed duration of the outbursts sets a lower limit on . Moreover, one expects significant degeneracies between , and when the light curve does not deviate much from an exponential (i.e. when never becomes larger than ) which is defined by two parameters only. On the other hand, useful constraints can be obtained when the final decay is observed, and therefore the duration of the hot phase is measured. Because of the rapid drop off during the final decay, one does not expect to get significant constraints from the shape of this phase, but one at least gets a determination of , and some constraint, usually in form of an upper limit, on . This basically sets three strong constraints on four parameters, implying that degeneracies should still exist that preclude the simultaneous determination of and unless observational uncertainties are very low.
| powerlaw model | diskbb model | ||||||||
| Source name | /DOF | /DOF | |||||||
| (days) | (days) | ||||||||
| Swift J130456.1-493158 | 1.4 | 159.8 | 18.67 | 0.90/6 | 78.4 | 8.97 | 0.61/6 | ||
| 10 | 74.9 | 4.23 | 0.86/6 | 96.0 | 0.89 | 0.79/6 | |||
| Swift J130511.5-422933 | 1.4 | 395.2 | 20.89 | 0.37 | 19.06/21 | 309.6 | 14.93 | 0.33 | 15.55/21 |
| 10 | 164.2 | 5.33 | 1.39 | 18.52/21 | 199.3 | 2.20 | 1.06 | 18.51/21 | |
| 2SXPS J235825.7-323609 | 1.4 | 365.0 | 13.75 | 0.35 | 15.78/12 | 271.6 | 10.07 | 0.33 | 12.34/12 |
| 10 | 335.3 | 1.56 | 1.06 | 18.02/12 | 322.9 | 0.96 | 0.90 | 16.63/12 | |
| Swift J235749.9-323526 | 1.4 | 216.4 | 19.49 | 10.71/11 | 184.9 | 15.67 | 9.62/12 | ||
| 10 | 89.4 | 4.72 | 14.72/11 | 102.5 | 2.45 | 14.60/12 | |||
| Swift J095520.7+690401 | 1.4 | 61.6 | 9.98 | 4.59/5 | 65.6 | 4.83 | 5.80/5 | ||
| 10 | 81.2 | 0.90 | 5.36/5 | 81.2 | 0.49 | 5.36/5 | |||
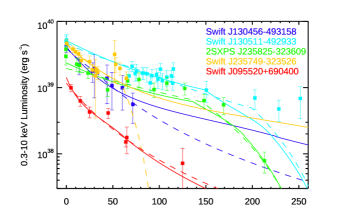
Table 1 shows the results of the fitting procedure, both when using the powerlaw model to convert from count rate to flux, and the diskbb model. As expected, the viscosity parameter can be determined only when the final decay has been observed, i.e. in the case of 2SXPS J235825.7-323609 and Swift J130511.5-422933. In this case, the value of we obtain is large, and typically much larger than the value determined when fitting the light curve of cataclysmic variables (Smak, 1999; Kotko & Lasota, 2012). This should not come as a surprise since Tetarenko et al. (2018b) found that much larger values of , in the range 0.2 – 1 are obtained when considering low-mass X-ray binaries; they attributed this large value of the viscosity parameter to the existence of strong winds in these system that carry away matter and also angular momentum. We take , as in King (2009), but because of the relatively large size of the error bars, the fits are not sensitive to the value of the beaming parameter. For M51 XT-1, with two data points with relatively small error bars, Hameury & Lasota (2020) were able to exclude , but found that gives an acceptable fit.
We also note that, again as expected, the primary mass cannot be determined from fitting the observed light curves. The fits are equally good for neutron star and for 10 M⊙ black hole accretors. The only difference is that the lower , the shorter the duration of the main outburst phase, and long outbursts may require unrealistically low values of in the neutron star case.
The maximum accretion rate is in all cases is close to or larger than the Eddington limit, except in the case of Swift J095520.7+690401 for large primary masses.
The fit quality, as measured by the compared to the number of degrees of freedom is quite good in all cases, except for 2SXPS J235825.7-323609. The reason for this is the existence of a low data point at d, and, to a lesser extent, a slightly steeper final decay than predicted by the model. Although the value is good for Swift J130511.5-422933, the observed drop between d and d is too sharp to be accounted for by the model. The detection at d is somewhat marginal and the estimate of the X-ray luminosity becomes questionable because of uncertainties in the spectral model; it is however unlikely that the current model can reproduce the sharp cutoff observed in this source. This would mean mean that the cooling front propagates faster than expected when the propagation is controlled by irradiation with a constant efficiency. Dropping this hypothesis might solve this problem, at the expense of a new and uncontrolled parameter; given other oversimplifying assumptions of the model, notably about winds, this would be of limited interest. One should note that similar problems are encountered when modeling outbursts of sub-Eddington X-ray transients (Tetarenko et al., 2018a). Although the value is also good for Swift J235749.9-323526, the model does not reproduce what appears to be a plateau or rebrightening at d which is unlikely due to changes in the accretion disk. The short drop at d is also not accounted for by the model, and the NuSTAR data point has not been included in the fit. We show the fits to all sources in Figure 16.
4.5 Implications for the wider ULX population
We summarize the properties of the sources in Table 2. We find that the average cm-2 with a standard deviation of cm-2. The average is 2.3 with a standard deviation of 0.4. This is consistent within the standard deviations of the sample of persistent sources from Gladstone et al. (2009), where the average cm-2 with a standard deviation of cm-2 and the average is 2.3 with a standard deviation of 0.5. Therefore we do not see any significant spectral differences between our transient sources and their persistent counterparts. For Swift J235749.9-323526 where we obtain NuSTAR data to extend the spectral coverage to higher energies, the diskpbb model was preferred over the power-law one, typical of ULX spectra as shown by Walton et al. (2018b). Again, the parameters of this model were consistent with those seen in the persistent sources.
| Source name | Host galaxy | Best position | uncertainty | (peak) | |||
|---|---|---|---|---|---|---|---|
| RA (∘) | Dec (∘) | (″) | (cm-2) | ( erg s-1) | |||
| Swift J130456.1-493158 | NGC 4945 | 196.23479 | -49.53324 | 0.53 | |||
| Swift J130511.5-492933 | NGC 4945 | 196.2985 | -49.4928 | 2.4 | |||
| 2SXPS J235825.7-323609 | NGC 7793 | 359.60828 | -32.60291 | 1.0 | |||
| Swift J235749.9-323526 | NGC 7793 | 359.45793 | -32.59110 | 0.57 | |||
| Swift J095520.7+690401 | M81 | 148.83697 | +69.06737 | 0.33 |
We have found that two of our sources appear to lie in a population of old RGB stars. Interestingly, Wiktorowicz et al. (2017) predicted that the majority of neutron star ULXs have low-mass (1.5 ), red giant donors. According to Wiktorowicz et al. (2017) red-giant donor NS-ULXs form at late times, and start with the primary becoming a Oxygen-Neon white dwarf. When the secondary becomes a red giant and fills its Roche lobe, the primary accretes additional mass and forms a NS due to an accretion induced collapse (AIC). Following this, the RG refills its RL and a short ( Myr) ULX phase occurs. We have not unambiguously identified the donor stars of these sources as red giants, and neither do we know they are neutron stars, but these properties do match well, albeit the timescales are much shorter than suggested by Wiktorowicz et al. (2017).
It has been suggested that fast radio bursts (FRBs) may be associated with ULXs (Sridhar et al., 2021). In this model, the accreting compact object is a black hole or a non-magnetar neutron star as in King (2009). One FRB with an intriguing similarity to our transient ULXs is FRB 20200120E which was found in the outskirts of M81 (Bhardwaj et al., 2021). The FRB was localized to a globular cluster with an old stellar population which challenged the magnetar models that invoke young magnetars formed in a core-collapse supernova but would be consistent with the (Sridhar et al., 2021) scenario. AIC of a white dwarf was also suggested as a possible formation channel (Kirsten et al., 2022). However, to date, no FRB has been reported at the position of a ULX.
In addition to the 5 transient ULXs we have presented here, 3 further transient ULXs were serendipitously discovered in the same galaxies from previous observations implying that the rates of these sources is potentially high. While our sample of 5 sources is small, we next attempt to estimate the rates of transient ULXs in these galaxies, and compare these to their persistent counterparts.
For NGC 4945 we found 2 transient ULXs in searches of observations over 3.0 years from 2019 Dec to 2022 Dec, implying a rate of 0.7 year-1. Using the same technique to identify the transient sources, and in the same period, we found 4 persistent sources classified as ULXs identified in SIMBAD as [CHP2004] J130518.5-492824, [BWC2008] U31, [CHP2004] J130521.2-492741 and [BWC2008] U32.
For NGC 7793 we found 2 transient ULX in searches of observations over 5.0 years from 2017 Dec to 2022 Dec, implying a rate of 0.4 year-1. In the same period, we found 2 persistent sources classified as ULXs, P9 and P13.
For M81 we found 1 transient ULX in searches of observations over 9 months from 2022 Apr to 2022 Dec, implying a rate of 1.3 year-1. In the same period, we found 1 persistent source classified as a ULX, [LB2005] NGC 3031 ULX2.
If we compare the number of transient ULXs in any one snapshot to the number of persistent ULXs, as would be done when computing the X-ray luminosity function of a galaxy (e.g. Lehmer et al., 2019), the persistent sources would dominate the high end. However, if we take the total number of sources that have exceeded erg s-1 over the time period of our searches, the transient ULX numbers roughly equal those of the persistent ones. Further, if we integrate the derived transient ULX rates over the timescales that the persistent source have been detected, several decades, then the transient ULX numbers would dominate the persistent ones. In other words, the number of systems that exhibit ULXs luminosities in each of these galaxies is dominated by transients rather than persistent sources.
Since we have only considered galaxies where a transient ULX has been identified in our searches, we cannot extend this conclusion to all galaxies. The rates are also biased by the Swift targeting and our incomplete search of observations. A more systematic search using eROSITA data could reveal the true rate. However, we note that the 6-month scanning pattern of eROSITA means some of the sources we identified can be missed.
While the duration of the transient sources studied here is well determined, the duration of the persistent sources is not well known. However evidence points to their far longer duration. For example, the collisionally ionized bubbles surrounding Holmberg IX X-1, NGC 1313 X-2, NGC 7793 S26 and NGC 5585 ULX have estimated dynamical ages of years (Pakull & Mirioni, 2002; Pakull et al., 2010; Moon et al., 2011; Weng et al., 2014; Soria et al., 2021).
5 Summary and Conclusions
We have presented results on five newly found X-ray transients in the fields of nearby galaxies identified in a search of Swift/XRT observations. Our results are as follows:
-
•
The timescales (60–400 days), fluxes ( erg cm-2 s-1), and lack of bright optical/UV counterparts argue against foreground sources in our Galaxy such as stars or X-ray binaries, and more distant sources such as tidal disruption events or Gamma-ray bursts.
-
•
These X-ray transients appear to be ultraluminous X-ray sources associated with the nearby galaxies of NGC 4945, NGC 7793 and M81 with peak luminosities of 2–3 erg s-1.
-
•
For 4 out of 5 sources, modeling the lightcurves of these transients with the disk instability model of Hameury & Lasota (2020) implies that the mass accretion rate through the disk is greater than the Eddington rate regardless of whether a 1.4 neutron star or 10 black hole is assumed.
-
•
For the three sources where HST imaging enables a search for a stellar counterpart. We plotted CMDs with stellar isochrones which imply varying ages of the potential stellar counterparts.
-
•
The rate of transient ULXs for these three galaxies is in the range of 0.4–1.3 year-1. While persistent ULXs dominate the high end of galaxy luminosity functions, the number of systems that produce ULX luminosities are likely dominated by transient sources.
-
•
The potential dominance of transient ULXs may imply results on ULXs may be biased by studies of persistent sources.
References
- Arnaud (1996) Arnaud, K. A. 1996, in Astronomical Society of the Pacific Conference Series, Vol. 101, Astronomical Data Analysis Software and Systems V, ed. G. H. Jacoby & J. Barnes, 17–+
- Auchettl et al. (2017) Auchettl, K., Guillochon, J., & Ramirez-Ruiz, E. 2017, ApJ, 838, 149
- Bachetti et al. (2014) Bachetti, M., Harrison, F. A., Walton, D. J., et al. 2014, Nature, 514, 202
- Berghea et al. (2020) Berghea, C. T., Johnson, M. C., Secrest, N. J., et al. 2020, ApJ, 896, 117
- Bhardwaj et al. (2021) Bhardwaj, M., Gaensler, B. M., Kaspi, V. M., et al. 2021, ApJ, 910, L18
- Binder et al. (2011) Binder, B., Williams, B. F., Kong, A. K. H., et al. 2011, ApJ, 739, L51
- Binder et al. (2016) —. 2016, MNRAS, 457, 1636
- Boller et al. (2016) Boller, T., Freyberg, M. J., Trümper, J., et al. 2016, A&A, 588, A103
- Brandt et al. (1996) Brandt, W. N., Iwasawa, K., & Reynolds, C. S. 1996, MNRAS, 281, L41
- Bressan et al. (2012) Bressan, A., Marigo, P., Girardi, L., et al. 2012, MNRAS, 427, 127
- Brightman et al. (2018) Brightman, M., Harrison, F. A., Fürst, F., et al. 2018, Nature Astronomy, 2, 312
- Brightman et al. (2019) Brightman, M., Harrison, F. A., Bachetti, M., et al. 2019, ApJ, 873, 115
- Brightman et al. (2020) Brightman, M., Earnshaw, H., Fürst, F., et al. 2020, ApJ, 895, 127
- Brightman et al. (2021) Brightman, M., Ward, C., Stern, D., et al. 2021, ApJ, 909, 102
- Carpano et al. (2018) Carpano, S., Haberl, F., Maitra, C., & Vasilopoulos, G. 2018, MNRAS, 476, L45
- Carson et al. (2015) Carson, D. J., Barth, A. J., Seth, A. C., et al. 2015, AJ, 149, 170
- Cash (1979) Cash, W. 1979, ApJ, 228, 939
- Cenko et al. (2017) Cenko, S. B., Barthelmy, S. D., D’Avanzo, P., et al. 2017, GRB Coordinates Network, Circular Service, No. 21960, #1-2018 (2017), 21960
- Chandra et al. (2020) Chandra, A. D., Roy, J., Agrawal, P. C., & Choudhury, M. 2020, MNRAS, 495, 2664
- Chevalier & Fransson (2017) Chevalier, R. A., & Fransson, C. 2017, in Handbook of Supernovae, ed. A. W. Alsabti & P. Murdin, 875
- Coe et al. (2020) Coe, M. J., Monageng, I. M., Bartlett, E. S., Buckley, D. A. H., & Udalski, A. 2020, MNRAS, 494, 1424
- Colbert & Mushotzky (1999) Colbert, E. J. M., & Mushotzky, R. F. 1999, ApJ, 519, 89
- Dage et al. (2021) Dage, K. C., Vowell, N., Thygesen, E., et al. 2021, MNRAS, 508, 4008
- Earnshaw et al. (2019a) Earnshaw, H. P., Roberts, T. P., Middleton, M. J., Walton, D. J., & Mateos, S. 2019a, MNRAS, 483, 5554
- Earnshaw et al. (2019b) Earnshaw, H. P., Grefenstette, B. W., Brightman, M., et al. 2019b, ApJ, 881, 38
- Earnshaw et al. (2020) Earnshaw, H. P., Heida, M., Brightman, M., et al. 2020, ApJ, 891, 153
- Evans et al. (2010) Evans, I. N., Primini, F. A., Glotfelty, K. J., et al. 2010, The Astrophysical Journal Supplement Series, 189, 37
- Evans et al. (2022) Evans, P. A., Page, K. L., Beardmore, A. P., et al. 2022, MNRAS, arXiv:2208.14478
- Evans et al. (2007) Evans, P. A., Beardmore, A. P., Page, K. L., et al. 2007, A&A, 469, 379
- Evans et al. (2009) —. 2009, MNRAS, 397, 1177
- Evans et al. (2020) Evans, P. A., Page, K. L., Osborne, J. P., et al. 2020, ApJS, 247, 54
- Fabrika et al. (2021) Fabrika, S. N., Atapin, K. E., Vinokurov, A. S., & Sholukhova, O. N. 2021, Astrophysical Bulletin, 76, 6
- French et al. (2020) French, K. D., Wevers, T., Law-Smith, J., Graur, O., & Zabludoff, A. I. 2020, Space Sci. Rev., 216, 32
- Fruscione et al. (2006) Fruscione, A., McDowell, J. C., Allen, G. E., et al. 2006, in Society of Photo-Optical Instrumentation Engineers (SPIE) Conference Series, Vol. 6270, Society of Photo-Optical Instrumentation Engineers (SPIE) Conference Series, ed. D. R. Silva & R. E. Doxsey, 62701V
- Fürst et al. (2016) Fürst, F., Walton, D. J., Harrison, F. A., et al. 2016, ApJ, 831, L14
- Gaia Collaboration et al. (2018) Gaia Collaboration, Brown, A. G. A., Vallenari, A., et al. 2018, A&A, 616, A1
- Gehrels et al. (2004) Gehrels, N., Chincarini, G., Giommi, P., et al. 2004, ApJ, 611, 1005
- Giacconi et al. (1979) Giacconi, R., Branduardi, G., Briel, U., et al. 1979, ApJ, 230, 540
- Gladstone et al. (2009) Gladstone, J. C., Roberts, T. P., & Done, C. 2009, MNRAS, 397, 1836
- Hameury & Lasota (2020) Hameury, J. M., & Lasota, J. P. 2020, A&A, 643, A171
- Hu et al. (2017) Hu, C.-P., Li, K. L., Kong, A. K. H., Ng, C.-Y., & Chun-Che Lin, L. 2017, ApJ, 835, L9
- Ide et al. (2020) Ide, S., Hayashida, K., Noda, H., et al. 2020, PASJ, 72, 40
- Isobe et al. (2008) Isobe, N., Kubota, A., Makishima, K., et al. 2008, PASJ, 60, S241
- Israel et al. (2017a) Israel, G. L., Belfiore, A., Stella, L., et al. 2017a, Science, 355, 817
- Israel et al. (2017b) Israel, G. L., Papitto, A., Esposito, P., et al. 2017b, MNRAS, 466, L48
- Kaaret et al. (2017) Kaaret, P., Feng, H., & Roberts, T. P. 2017, ARA&A, 55, 303
- Karino (2022) Karino, S. 2022, MNRAS, 514, 191
- Kennea et al. (2017) Kennea, J. A., Lien, A. Y., Krimm, H. A., Cenko, S. B., & Siegel, M. H. 2017, The Astronomer’s Telegram, 10809
- King et al. (2023) King, A., Lasota, J.-P., & Middleton, M. 2023, New A Rev., 96, 101672
- King (2009) King, A. R. 2009, Monthly Notices of the Royal Astronomical Society, 393, L41
- Kirsten et al. (2022) Kirsten, F., Marcote, B., Nimmo, K., et al. 2022, Nature, 602, 585
- Kong et al. (2022) Kong, L.-D., Zhang, S., Zhang, S.-N., et al. 2022, ApJ, 933, L3
- Kosec et al. (2018) Kosec, P., Pinto, C., Walton, D. J., et al. 2018, MNRAS, 479, 3978
- Kotko & Lasota (2012) Kotko, I., & Lasota, J. P. 2012, A&A, 545, A115
- Kovlakas et al. (2020) Kovlakas, K., Zezas, A., Andrews, J. J., et al. 2020, MNRAS, 498, 4790
- Lehmer et al. (2019) Lehmer, B. D., Eufrasio, R. T., Tzanavaris, P., et al. 2019, ApJS, 243, 3
- Liu & Bregman (2005) Liu, J.-F., & Bregman, J. N. 2005, ApJS, 157, 59
- Liu & Mirabel (2005) Liu, Q. Z., & Mirabel, I. F. 2005, A&A, 429, 1125
- Liu et al. (2019) Liu, Z., O’Brien, P. T., Osborne, J. P., Evans, P. A., & Page, K. L. 2019, MNRAS, 486, 5709
- Marigo et al. (2008) Marigo, P., Girardi, L., Bressan, A., et al. 2008, A&A, 482, 883
- Marigo et al. (2017) —. 2017, ApJ, 835, 77
- McMahon et al. (2013) McMahon, R. G., Banerji, M., Gonzalez, E., et al. 2013, The Messenger, 154, 35
- Middleton et al. (2015) Middleton, M. J., Heil, L., Pintore, F., Walton, D. J., & Roberts, T. P. 2015, MNRAS, 447, 3243
- Middleton et al. (2012) Middleton, M. J., Sutton, A. D., Roberts, T. P., Jackson, F. E., & Done, C. 2012, MNRAS, 420, 2969
- Middleton et al. (2013) Middleton, M. J., Miller-Jones, J. C. A., Markoff, S., et al. 2013, Nature, 493, 187
- Mondal et al. (2021) Mondal, C., Subramaniam, A., George, K., et al. 2021, ApJ, 909, 203
- Moon et al. (2011) Moon, D.-S., Harrison, F. A., Cenko, S. B., & Shariff, J. A. 2011, ApJ, 731, L32
- Page et al. (2020) Page, K. L., Beardmore, A. P., & Osborne, J. P. 2020, Advances in Space Research, 66, 1169
- Pakull & Mirioni (2002) Pakull, M. W., & Mirioni, L. 2002, arXiv e-prints, astro
- Pakull et al. (2010) Pakull, M. W., Soria, R., & Motch, C. 2010, Nature, 466, 209
- Pinto et al. (2016) Pinto, C., Middleton, M. J., & Fabian, A. C. 2016, Nature, 533, 64
- Pintore et al. (2018) Pintore, F., Belfiore, A., Novara, G., et al. 2018, MNRAS, 477, L90
- Polzin et al. (2022) Polzin, A., Margutti, R., Coppejans, D., et al. 2022, arXiv e-prints, arXiv:2211.01232
- Pye et al. (2015) Pye, J. P., Rosen, S., Fyfe, D., & Schröder, A. C. 2015, A&A, 581, A28
- Quintin et al. (2021) Quintin, E., Webb, N. A., Gúrpide, A., Bachetti, M., & Fürst, F. 2021, MNRAS, 503, 5485
- Radburn-Smith et al. (2011) Radburn-Smith, D. J., de Jong, R. S., Seth, A. C., et al. 2011, ApJS, 195, 18
- Radburn-Smith et al. (2012) Radburn-Smith, D. J., Roškar, R., Debattista, V. P., et al. 2012, ApJ, 753, 138
- Read & Pietsch (1999) Read, A. M., & Pietsch, W. 1999, A&A, 341, 8
- Reig (2011) Reig, P. 2011, Ap&SS, 332, 1
- Reig & Nespoli (2013) Reig, P., & Nespoli, E. 2013, A&A, 551, A1
- Ritter & King (2001) Ritter, H., & King, A. R. 2001, in Astronomical Society of the Pacific Conference Series, Vol. 229, Evolution of Binary and Multiple Star Systems, ed. P. Podsiadlowski, S. Rappaport, A. R. King, F. D’Antona, & L. Burderi, 423
- Robba et al. (2022) Robba, A., Pinto, C., Pintore, F., et al. 2022, MNRAS, arXiv:2207.09447
- Sabbi et al. (2018) Sabbi, E., Calzetti, D., Ubeda, L., et al. 2018, ApJS, 235, 23
- Schlafly & Finkbeiner (2011) Schlafly, E. F., & Finkbeiner, D. P. 2011, ApJ, 737, 103
- Smak (1999) Smak, J. 1999, Acta Astron., 49, 391
- Soria et al. (2007) Soria, R., Baldi, A., Risaliti, G., et al. 2007, MNRAS, 379, 1313
- Soria et al. (2012) Soria, R., Kuntz, K. D., Winkler, P. F., et al. 2012, ApJ, 750, 152
- Soria et al. (2021) Soria, R., Pakull, M. W., Motch, C., et al. 2021, MNRAS, 501, 1644
- Sridhar et al. (2021) Sridhar, N., Metzger, B. D., Beniamini, P., et al. 2021, ApJ, 917, 13
- Strickland et al. (2001) Strickland, D. K., Colbert, E. J. M., Heckman, T. M., et al. 2001, ApJ, 560, 707
- Swartz et al. (2011) Swartz, D. A., Soria, R., Tennant, A. F., & Yukita, M. 2011, ApJ, 741, 49
- Tarnopolski (2015) Tarnopolski, M. 2015, A&A, 581, A29
- Tetarenko et al. (2018a) Tetarenko, B. E., Dubus, G., Lasota, J. P., Heinke, C. O., & Sivakoff, G. R. 2018a, MNRAS, 480, 2
- Tetarenko et al. (2018b) Tetarenko, B. E., Lasota, J. P., Heinke, C. O., Dubus, G., & Sivakoff, G. R. 2018b, Nature, 554, 69
- Tsygankov et al. (2017) Tsygankov, S. S., Doroshenko, V., Lutovinov, A. A., Mushtukov, A. A., & Poutanen, J. 2017, A&A, 605, A39
- van den Eijnden et al. (2019) van den Eijnden, J., Degenaar, N., Russell, T. D., et al. 2019, MNRAS, 483, 4628
- van Haaften et al. (2019) van Haaften, L. M., Maccarone, T. J., Rhode, K. L., Kundu, A., & Zepf, S. E. 2019, MNRAS, 483, 3566
- Vasilopoulos et al. (2020) Vasilopoulos, G., Ray, P. S., Gendreau, K. C., et al. 2020, MNRAS, 494, 5350
- Walton et al. (2021a) Walton, D. J., Mackenzie, A. D. A., Gully, H., et al. 2021a, MNRAS, arXiv:2110.07625
- Walton et al. (2011) Walton, D. J., Roberts, T. P., Mateos, S., & Heard, V. 2011, MNRAS, 416, 1844
- Walton et al. (2016) Walton, D. J., Fürst, F., Bachetti, M., et al. 2016, ApJ, 827, L13
- Walton et al. (2018a) Walton, D. J., Bachetti, M., Fürst, F., et al. 2018a, ApJ, 857, L3
- Walton et al. (2018b) Walton, D. J., Fürst, F., Heida, M., et al. 2018b, ApJ, 856, 128
- Walton et al. (2021b) Walton, D. J., Heida, M., Bachetti, M., et al. 2021b, MNRAS, 501, 1002
- Webb et al. (2020) Webb, N. A., Coriat, M., Traulsen, I., et al. 2020, A&A, 641, A136
- Weng et al. (2014) Weng, S.-S., Zhang, S.-N., & Zhao, H.-H. 2014, ApJ, 780, 147
- Whitmore et al. (2016) Whitmore, B. C., Allam, S. S., Budavári, T., et al. 2016, AJ, 151, 134
- Wiktorowicz et al. (2017) Wiktorowicz, G., Sobolewska, M., Lasota, J.-P., & Belczynski, K. 2017, ApJ, 846, 17
- Willingale et al. (2013) Willingale, R., Starling, R. L. C., Beardmore, A. P., Tanvir, N. R., & O’Brien, P. T. 2013, MNRAS, 431, 394
- Wilson-Hodge et al. (2018) Wilson-Hodge, C. A., Malacaria, C., Jenke, P. A., et al. 2018, ApJ, 863, 9
- Winter et al. (2006) Winter, L. M., Mushotzky, R. F., & Reynolds, C. S. 2006, ApJ, 649, 730