Influence of the deviation of the matter power spectrum at small scales on the global 21-cm signal at cosmic dawn
Abstract
The matter power spectrum has been strongly constrained by astronomical measurements at large scales, but only weakly at small scales. Compared with the standard scenario, the deviation of the matter power spectrum at small scales has influence on the cosmological structure formation, e.g., the comoving number density of dark matter halos. The thermal history of the intergalactic medium (IGM) can be changed if dark matter is made of weakly interacting massive particles and can annihilate into standard model particles. The changes of the evolution of IGM could leave imprints on the relevant astronomical observations. Taking into account the dark matter annihilation, we investigate the impact of the deviation of matter power spectrum at small scales on the global 21-cm signal. In view of the measurements of the global 21-cm signal by the EDGES experiment, we explore the allowed parameter space of , which describes the degree of deviation, by requiring the differential brightness temperature of the global 21-cm signal at redshift .
I introduction
The standard inflation model has predicted that the primordial power spectrum is in a scale invariant form of Lidsey et al. (1997); Salopek et al. (1989); Joy et al. (2008); Aghanim et al. (2018); Leach (2006). At large scales, , primordial power spectrum has been well constrained by astronomical measurements, e.g., cosmic microwave background (CMB), large-scale structure and Lyman- forest Hlozek et al. (2012a); Bird et al. (2011); Tinker et al. (2012). At small scales, , the constraints are from the studies of, e.g., primordial black holes, ultracompact minihalos, galaxy luminosity functions and Silk damping effects Josan et al. (2009); Dalianis (2019); Yang (2019, 2020); Clark et al. (2016); Bringmann et al. (2012); Yang and Qin (2017); Li et al. (2012); Jeong et al. (2014a); Yoshiura et al. (2020a); Jeong et al. (2014b). The primordial power spectrum results in a matter power spectrum . The astronomical measurements such as CMB have been used to reconstruct the matter power spectrum at large scales Hlozek et al. (2012b). Large-scale 21-cm measurements could be used to probe the matter power spectrum at small scales Muñoz et al. (2020). Any deviation of at small scales can result in the changes of the cosmological structure formation such as the comoving number density of dark matter halos, while no conflict with existing astronomical measurements Villanueva-Domingo and Ichiki (2021); Tashiro and Sugiyama (2013); Natarajan et al. (2015); Yoshiura et al. (2018); Libanore et al. (2022).
The existence of dark matter (DM) has been confirmed by many different astronomical observations. However, the nature of DM still keeps unknown. Different DM models have been proposed and one of the mostly studied is weakly interacting massive particles (WIMPs) Bertone et al. (2005); Jungman et al. (1996). The relevant theory proposes that WIMPs can annihilate into standard model particles such as electrons, positrons and photons. These particles have interactions with that existing in the Universe, resulting in the changes of the thermal history of intergalactic medium (IGM) Yuan et al. (2010); Chen and Kamionkowski (2004); Zhang et al. (2006); Madhavacheril et al. (2014); Yang (2015); Slatyer (2016a); Cheung et al. (2019); Kovetz et al. (2018); Berlin et al. (2018); D’Amico et al. (2018); Yang (2018); Vipp et al. (2021); Galli et al. (2013); Chluba (2010); Cumberbatch et al. (2010); Yang (2016). These changes could leave imprints on different astronomical observations such as the CMB and global 21-cm signal. Furthermore, the properties of DM can be investigated by the relevant astronomical measurements; see, e.g., Refs Yang (2015); Zhang et al. (2006); Madhavacheril et al. (2014); Kovetz et al. (2018); Berlin et al. (2018); D’Amico et al. (2018); Valdes et al. (2007); Valdé s et al. (2012).
As mentioned above, the deviation of the matter power spectrum at small scales can lead to the changes of the comoving number density of DM halos. Taking into account the DM annihilation, it is expected that the deviation can lead to the different thermal history of the IGM and astronomical observations compared with the standard scenario. The authors of Natarajan et al. (2015) have investigated these effects on the CMB observations. In this work, following the methods in Natarajan et al. (2015) we will study the impact of the deviation of matter power spectrum at small scales on the global 21-cm signal in the cosmic dawn.
As an important way to study the early universe, the detection of the global 21-cm signal is very challenging Pritchard and Loeb (2012); Furlanetto et al. (2006). Recently, the Experiment to Detect the Global Epoch of Reionization Signature (EDGES) reported their results of the global 21-cm signal Bowman et al. (2018). They found an absorption signal centered at redshift about twice as large as expected Cohen et al. (2017); Furlanetto et al. (2006); Xu et al. (2021). Note that the results of the EDGES experiment are still controversial and require further verification Bradley et al. (2019); Hills et al. (2018); Singh and Subrahmanyan (2019); Singh et al. (2018). On the other hand, the global 21-cm signal can be used to investigate the properties of DM; see, e.g, Refs Yang (2018); Vipp et al. (2021); Fialkov et al. (2018); Cumberbatch et al. (2010); Fraser et al. (2018); Hektor et al. (2018); Burns et al. (2019); Clark et al. (2018); Kovetz et al. (2018); Hiroshima et al. (2021); Halder and Banerjee (2021); Kovetz et al. (2019); Bhatt et al. (2019); Berlin et al. (2018); Barkana et al. (2018); Jia and Liao (2019); D’Amico et al. (2018); Vipp et al. (2021); Saha and Laha (2022). In this paper, taking into account the DM annihilation and by requiring the differential brightness temperature of the global 21-cm signal, e.g., at redshift , we explore the parameter space of , which characterizes the deviation of the matter power spectrum at small scales. Here we have not included the heating effects from astrophysical processes performed in the standard scenario Minoda et al. (2022); Yoshiura et al. (2020b); Xu et al. (2021); Cen (2017).
This paper is organized as follows. In Sec. II we present the basically related components of the matter power spectrum considered here, and the basic equations for the evolution of the IGM including DM annihilation. In Sec. III, we investigate the impact of the deviation of matter power spectrum at small scales on the global 21-cm signal, and then explore the allowed space of the related parameter. The conclusions are given in Sec. IV. Throughout the paper we will use the cosmological parameters from Planck-2018 results Aghanim et al. (2018).
II The matter power spectrum at small scales and the evolution of IGM
In the standard scenario, the matter power spectrum resulted from the primordial power spectrum is in a form of . Many other inflation models have been proposed and suggested that the primordial power spectrum could be deviated at small scales while being consistent with existing astronomical measurements at large scales. For the most inflation models, the deviation of is suggested in a form of power law growth at small scales; see, e.g., Refs Byrnes et al. (2019); Raveendran et al. (2022); Heydari and Karami (2022); Carrilho et al. (2019); Cole and Silk (2021); Mishra and Sahni (2020); Yi et al. (2021); Gao and Guo (2018); Balaji et al. (2022). In view of these factors, following Ref. Natarajan et al. (2015), we take the parametrized form of the matter power spectrum as follows
| (1) |
where the pivot scale in order to be consistent with the available astronomical observations. The matter power spectrum at redshift can be written as
| (2) |
where is the growth factor Carroll et al. (1992); Green et al. (2005), and is transfer function Bardeen et al. (1986). is a constant normalized as , where is the root mean square mass fluctuation in a sphere of radius . The mass variance is written as follows
| (3) |
where is the window function and we use the form as
| (4) |
Since the changes of investigated here are mainly on small scales, nonlinear effects are very important. There are several ways to deal with nonlinear effects. For the purpose of this work, one way is using the Zeldovich approximation or Lagrangian perturbation theory White (2014); Castorina and White (2019); Porto et al. (2014). Another way is using the Press-Schechter(PS) theory Press and Schechter (1974), which has been proved to be valid and wildly used in literature see, e.g., Refs. White et al. (1993); Percival (2001); Dodelson (2003). The evolution of nonlinear effects will result in the collapse of the regions with large density perturbation. Although on small scales the mass variance calculated using the linear power spectrum is different from that of nonlinear power spectrum, PS theory shows that the collapsed fraction can be obtained using the linear power spectrum. In this work, we will use PS theory to deal with nonlinear effects on small scales. On the other hand, since we mainly focused on the effects of dark matter annihilation within dark matter halos, there is another method of calculating the ’boost factor’(BF) to deal with nonlinear effects. The BF can be obtained by directly integrating the nonlinear matter power spectrum for investigated scales at different redshifts Serpico et al. (2012); Sefusatti et al. (2014); Hiroshima et al. (2021). Essentially, this method is the same as the PS theory.
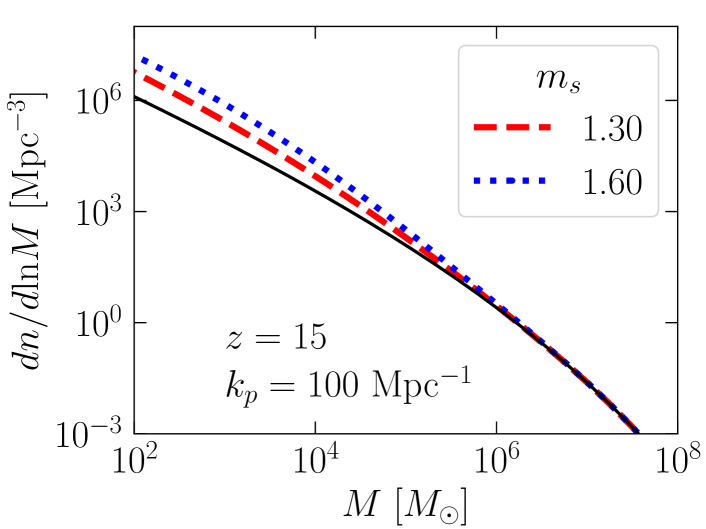
For the Press-Schecter mass function, the comoving number density of DM halos is in a form of W.H.Press and Schechter (1974)
| (5) |
where is the threshold for spherical collapse. In Fig. 1, we plot the comoving number density of DM halos for different values of at redshift for pivot scale . For comparison, we also plot the standard scenario with Aghanim et al. (2018). From this plot, it can be seen that the deviation of the matter power spectrum at small scales results in an increase of the comoving number density of DM halos with small masses. Since we have set the pivot scale , compared with the standard scenario, the significant difference appears for the masses of .
Taking into account the DM annihilation, the energy release rate per unit volume can be written as Natarajan et al. (2015); Chen and Kamionkowski (2004); Zhang et al. (2006); Madhavacheril et al. (2014); D’Amico et al. (2018); Abdo et al. (2010)
| (6) |
where is the thermally averaged cross section of DM annihilation, and is the mass of DM particle. is the density profile of DM halos and we adopt the Navarro-Frenk-White model for our calculations Navarro et al. (1997).
The energy released from DM annihilation can inject into the Universe resulting in the changes of the thermal history of IGM. The evolutions of the ionization fraction and kinetic temperature of the IGM are governed by the following equations Yang (2019, 2015); Chen and Kamionkowski (2004); Zhang et al. (2007):
| (7) |
| (8) |
where is the standard recombination rate, is the ionization rate by standard sources. and are the ionization and heating rate by DM annihilation, which can be written as follows Zhang et al. (2007); Chen and Kamionkowski (2004); Yang (2019); Clark et al. (2018); Yang (2015),
| (9) |
| (10) |
where stands for the baryon number density and . is the fraction of the energy released from DM annihilation injected into the IGM for ionization and heating, respectively. Here we have used the public code ExoCLASS Stöcker et al. (2018), a branch of the public code CLASS Blas et al. (2011), to calculate numerically.
III The impact of the deviation on the global 21-cm signal and corresponding constraints
The quantity associated with the observations describing the global 21-cm signal is the differential brightness temperature . Relative to the CMB background, can be written as follows Cumberbatch et al. (2010); Ciardi and Madau (2003); Yang (2018)
| (11) | |||||
where and are the density parameters of baryonic matter and DM, respectively. is the reduced Hubble constant. is the spin temperature, which is mainly effected by background photons, collisions between the particles and resonant scattering of photons (Wouthuysen-Field effect) Pritchard and Loeb (2012); Furlanetto et al. (2006). Taking into account these factors and with CMB as main background, the spin temperature can be written as follows Yuan et al. (2010); Cumberbatch et al. (2010)
| (12) |
where is related to the Wouthuysen-Field effect and we adopt the formula used in, e.g., Refs. Yuan et al. (2010); Yang (2019); Kuhlen et al. (2006):
| (13) |
where is the Einstein coefficient of hyperfine spontaneous transition. corresponds to the energy changes between triplet and singlet states of neutral hydrogen atom. is the radiative deexcitation rate due to Ly photons Pritchard and Loeb (2012); Furlanetto et al. (2006). The factor involves collisions between hydrogen atoms and other particles Yuan et al. (2010); Yang (2018); Kuhlen et al. (2006); Liszt (2001); Yang (2016),
| (14) |
where are the deexcitation rate due to collisions and the fitted formulas can be found in Refs. Yang (2018, 2016); Kuhlen et al. (2006); Liszt (2001).
In order to explore the conservative allowed space of relevant parameter, following previous works D’Amico et al. (2018); Clark et al. (2018), here we have not included any astrophysical heating source. The main astrophysical source affecting the global 21-cm signal is the Ly photons related to the Wouthuysen-Field effect Furlanetto et al. (2006); Villanueva-Domingo et al. (2020); Clark et al. (2018); Mittal and Kulkarni (2021); Gessey-Jones et al. (2022); Reis et al. (2021); Mirocha et al. (2021); Monsalve et al. (2019). Here we have considered that the Ly photons are mainly from Pop II stars. We take the virial temperature of a halo corresponding to the minimum halo mass. For the star formation efficiency , we have set for our calculations, and we found that larger will slightly increase the amplitude of at redshift . We take the total number of photons from the Pop II stars between the Ly and the Lyman limits as . Based on these choices, we can obtain the global 21-cm signal at redshift with the maximum amplitude allowed within a reasonable range of parameters.
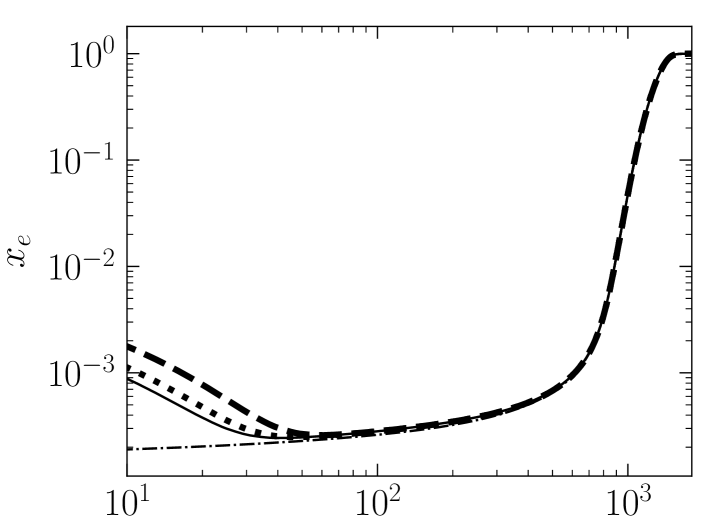
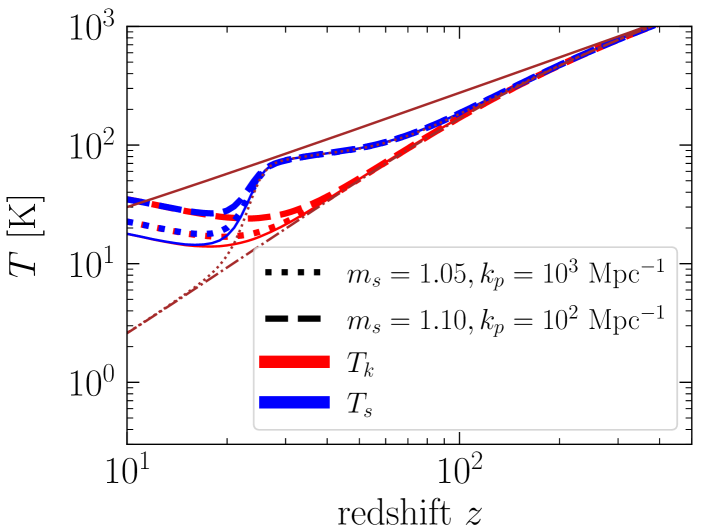
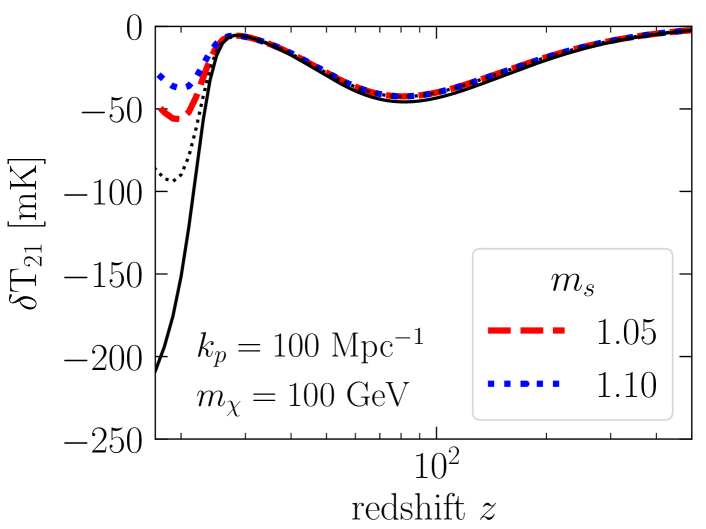
After deriving the energy release rate per unit volume due to DM annihilation as shown in Eq. (6), one can get the changes of , and with redshift using Eqs. (7), (8) and (12). In order to include the effects of DM annihilation, we have modified the public code RECFAST in CAMB111https://camb.info/ to solve the differential equations numerically Yang (2019, 2015); Chen and Kamionkowski (2004); Zhang et al. (2007); Yang (2020); Clark et al. (2018). Then the differential brightness temperature can be obtained with Eq. (11). In Fig. 2, we plot the evolution of , and for different values of and . Compared with the standard scenario (, thin solid lines), the ionization fraction, kinetic temperature and spin temperature are all increased. Here we have set the canonical value of DM annihilation cross section as and channel for our calculations.
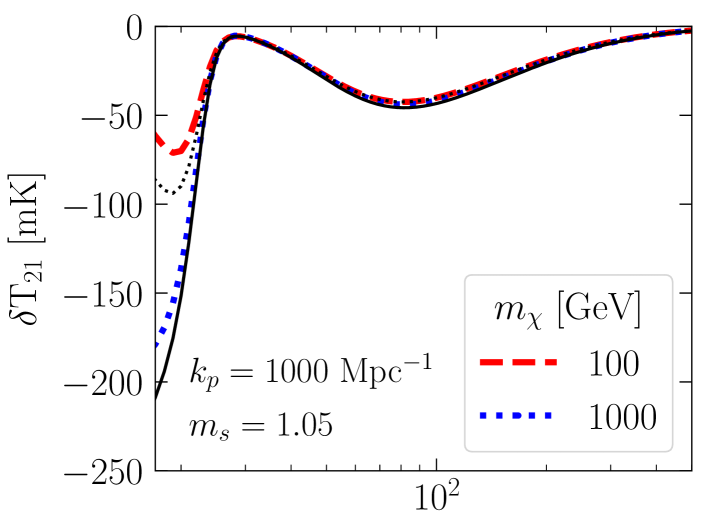
In Fig. 3, the evolution of for different values of , and are shown respectively. For comparison, we also plot the default case with no DM annihilation (thin solid black line) and the standard case with no deviation of the matter power spectrum at small scales (thin dotted black line). For fixed DM mass and power law index of the deviation (top panel in Fig. 3), smaller pivot scale results in an increase of the number density of DM halos at small masses. Therefore, the absorption amplitude of the global 21-cm signal is reduced compared with the standard scenario. For fixed pivot scale and power law index of the deviation (middle panel in Fig. 3), lighter DM corresponds to a larger DM number density. Since the DM annihilation rate is proportional to the squared number density, much more energy is injected into the IGM, causing a reduction of the absorption amplitude of the global 21-cm signal. For fixed pivot scale and DM mass (bottom panel in Fig. 3), larger power low index of the deviation also results in an increase of the number density of DM halos at small masses. Similar to the case of changing pivot scale, the absorption amplitude of the global 21-cm signal is decreased for larger compared with the scenario of no deviation.

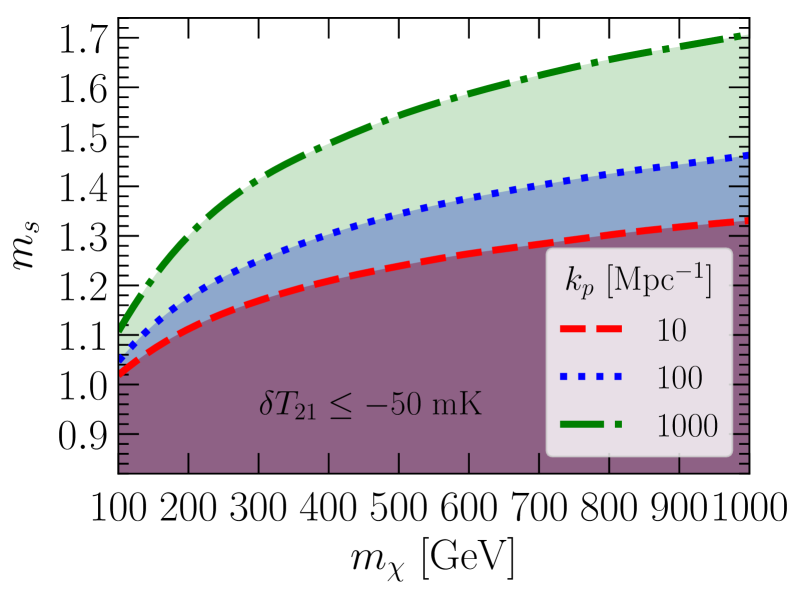
In view of the results of the EDGES experiment, by requiring the differential brightness temperature at redshift , we explore the allowed space of parameter for different pivot scales , which is shown in Fig. 4 . From this plot, it can be seen that smaller DM mass or pivot scale corresponds to a smaller value of . In Ref. Natarajan et al. (2015), the authors derived the upper limits on using the CMB observations. They found that for the parameter , the upper limit is for , and it is roughly weaker than our result for the DM mass range considered here.
Note that here we have not included the standard astrophysical heating sources, e.g., the X-ray from stars, which can also heat the IGM and result in the increase of , and in lower redshifts Pritchard and Loeb (2012); Furlanetto et al. (2006); Yuan et al. (2010). For this case, compared with our results, the amplitude of differential brightness temperature at redshift will become smaller, resulting in a lower allowed value of .
In this work, we have used the canonical value of DM annihilation cross section for our calculations. Many astronomical observations have been used to constrain depending on the DM mass Slatyer (2016b); Kawasaki et al. (2021); Li et al. (2016); Di Mauro and Winkler (2021); Ackermann et al. (2014). The authors of Kawasaki et al. (2021), for instance, have used the Planck-2018 datasets to get the constraints and found for . As shown in Eq. (6), larger value of will result in the larger energy release rate per unit volume, and it is excepted that the final allowed value of will become smaller.
Note that the final allowed space of parameter can be effected by relevant parameters, and these parameters would be degenerate with each other. A complete way to deal with this issue is combining the observed data of the EDGES to obtain the distribution and correlation of parameters by using the MCMC method. We will address this issue in future work. The similar effects can be also caused by the primordial black holes.222Y.Yang et al. in preparation.
IV conclusions
In the standard scenario, the matter power spectrum has a form of . Many relevant theories indicate that the matter power spectrum could be deviated at small scales while being consistent with the available astronomical observations. In this work, we have investigated the impact of this kind of deviation on the global 21-cm signal in the cosmic dawn, taking into account DM annihilation. Specifically, we have adopted a power law growth of the matter power spectrum at small scales, for . The deviation of the matter power spectrum at small scales results in an increase of the comoving number density of DM halos at small masses. The energy release rate per unit volume due to DM annihilation becomes larger compared with the standard scenario, resulting in the changes of the thermal history of IGM and then the evolution of the global 21-cm signal. The absorption amplitude of the global 21-cm signal is reduced for smaller pivot scale or larger power law index . Smaller DM mass can also decrease the absorption amplitude of the global 21-cm signal due to the larger annihilation rate. In view of the results of the EDGES experiment, we have explored the allowed parameter space of the power law index for different pivot scales by requiring the differential brightness temperature . Smaller DM mass or pivot scale results in a lower allowed value of . For a DM mass, e.g., , the largest allowed value is for the pivot scale .
Note that we have considered the global 21-cm signal in the cosmic dawn that can be influenced by many other astrophyscial factors. The global 21-cm signal in the dark ages () can also be effected by the deviation of the matter power spectrum at small scales. Compared with the standard scenario, the global 21-cm signal in the dark ages is very little influenced by the astrophysical processes. Therefore, it is expected that the future detection of the global 21-cm signal (or the 21-cm power spectrum) in the dark ages by, e.g., the radio telescopes on the moon or satellites around a low lunar orbit Burns et al. (2019); Plice et al. (2017); Chen et al. (2019); Burns et al. (2021a); Burns (2020); Burns et al. (2021b), could give better constraints on the deviation of the matter power spectrum at small scales.
V Acknowledgements
The authors would like to thank the anonymous referees for their very helpful comments and suggestions. Y. Yang thank Bin Yue for very useful discussions. Y. Yang is supported by the Shandong Provincial Natural Science Foundation (Grant No. ZR2021MA021). X. Li is supported by the Youth Innovations and Talents Project of Shandong Provincial Colleges and Universities (Grant No. 201909118). G. Li is supported by the Taishan Scholar Project of Shandong Province (Grant No. tsqn202103062).
References
- Lidsey et al. (1997) J. E. Lidsey, A. R. Liddle, E. W. Kolb, E. J. Copeland, T. Barreiro, and M. Abney, “Reconstructing the inflaton potential¯an overview,” Rev. Mod. Phys. 69, 373 (1997).
- Salopek et al. (1989) D. S. Salopek, J. R. Bond, and J. M. Bardeen, “Designing density fluctuation spectra in inflation,” Phys. Rev. D 40, 1753 (1989).
- Joy et al. (2008) M. Joy, V. Sahni, and A. A. Starobinsky, “New universal local feature in the inflationary perturbation spectrum,” Phys. Rev. D 77, 023514 (2008).
- Aghanim et al. (2018) N. Aghanim et al. (Planck), “Planck 2018 results. VI. Cosmological parameters,” (2018), arXiv:1807.06209 [astro-ph.CO] .
- Leach (2006) S. M. Leach, “Measuring the primordial power spectrum: Principal component analysis of the cosmic microwave background,” Mon. Not. Roy. Astron. Soc. 372, 646 (2006), arXiv:astro-ph/0506390 .
- Hlozek et al. (2012a) R. Hlozek, J. Dunkley, G. Addison, J. W. Appel, J. R. Bond, C. S. Carvalho, S. Das, M. J. Devlin, R. Dünner, T. Essinger-Hileman, J. W. Fowler, P. Gallardo, A. Hajian, M. Halpern, M. Hasselfield, M. Hilton, A. D. Hincks, J. P. Hughes, K. D. Irwin, J. Klein, A. Kosowsky, T. A. Marriage, D. Marsden, F. Menanteau, K. Moodley, M. D. Niemack, M. R. Nolta, L. A. Page, L. Parker, B. Partridge, F. Rojas, N. Sehgal, B. Sherwin, J. Sievers, D. N. Spergel, S. T. Staggs, D. S. Swetz, E. R. Switzer, R. Thornton, and E. Wollack, “The atacama cosmology telescope: A measurement of the primordial power spectrum,” The Astrophysical Journal 749, 90 (2012a).
- Bird et al. (2011) S. Bird, H. V. Peiris, M. Viel, and L. Verde, “Minimally parametric power spectrum reconstruction from the lyman forest,” Monthly Notices of the Royal Astronomical Society 413, 1717 (2011).
- Tinker et al. (2012) J. L. Tinker, E. S. Sheldon, R. H. Wechsler, M. R. Becker, E. Rozo, Y. Zu, D. H. Weinberg, I. Zehavi, M. R. Blanton, M. T. Busha, and B. P. Koester, “Cosmological constraints from galaxy clustering and the mass-to-number ratio of galaxy clusters,” The Astrophysical Journal 745, 16 (2012).
- Josan et al. (2009) A. S. Josan, A. M. Green, and K. A. Malik, “Generalised constraints on the curvature perturbation from primordial black holes,” Phys. Rev. D79, 103520 (2009), arXiv:0903.3184 [astro-ph.CO] .
- Dalianis (2019) I. Dalianis, “Constraints on the curvature power spectrum from primordial black hole evaporation,” JCAP 1908, 032 (2019), arXiv:1812.09807 [astro-ph.CO] .
- Yang (2019) Y. Yang, “Constraints on the small scale curvature perturbation using Planck-2015 data,” Mon. Not. Roy. Astron. Soc. 486, 4569 (2019), arXiv:1904.09104 [astro-ph.CO] .
- Yang (2020) Y. Yang, “Constraints on primordial black holes and curvature perturbations from the global 21-cm signal,” Phys. Rev. D 102, 083538 (2020), arXiv:2009.11547 [astro-ph.CO] .
- Clark et al. (2016) H. A. Clark, G. F. Lewis, and P. Scott, “Investigating dark matter substructure with pulsar timing – II. Improved limits on small-scale cosmology,” Mon. Not. Roy. Astron. Soc. 456, 1402 (2016), [Erratum: Mon. Not. Roy. Astron. Soc.464,no.1,955(2017)], arXiv:1509.02941 [astro-ph.CO] .
- Bringmann et al. (2012) T. Bringmann, P. Scott, and Y. Akrami, “Improved constraints on the primordial power spectrum at small scales from ultracompact minihalos,” Phys. Rev. D 85, 125027 (2012).
- Yang and Qin (2017) Y. Yang and Y. Qin, “Tau neutrinos from ultracompact dark matter minihalos and constraints on the primordial curvature perturbations,” Phys. Rev. D 96, 103509 (2017), arXiv:1711.00993 [astro-ph.CO] .
- Li et al. (2012) F. Li, A. L. Erickcek, and N. M. Law, “A new probe of the small-scale primordial power spectrum: Astrometric microlensing by ultracompact minihalos,” Phys. Rev. D 86, 043519 (2012).
- Jeong et al. (2014a) D. Jeong, J. Pradler, J. Chluba, and M. Kamionkowski, “Silk damping at a redshift of a billion: a new limit on small-scale adiabatic perturbations,” Phys. Rev. Lett. 113, 061301 (2014a), arXiv:1403.3697 [astro-ph.CO] .
- Yoshiura et al. (2020a) S. Yoshiura, M. Oguri, K. Takahashi, and T. Takahashi, “Constraints on primordial power spectrum from galaxy luminosity functions,” Phys. Rev. D 102, 083515 (2020a), arXiv:2007.14695 [astro-ph.CO] .
- Jeong et al. (2014b) D. Jeong, J. Pradler, J. Chluba, and M. Kamionkowski, “Silk damping at a redshift of a billion: New limit on small-scale adiabatic perturbations,” Phys. Rev. Lett. 113, 061301 (2014b).
- Hlozek et al. (2012b) R. Hlozek et al., “The Atacama Cosmology Telescope: a measurement of the primordial power spectrum,” Astrophys. J. 749, 90 (2012b), arXiv:1105.4887 [astro-ph.CO] .
- Muñoz et al. (2020) J. B. Muñoz, C. Dvorkin, and F.-Y. Cyr-Racine, “Probing the Small-Scale Matter Power Spectrum with Large-Scale 21-cm Data,” Phys. Rev. D 101, 063526 (2020), arXiv:1911.11144 [astro-ph.CO] .
- Villanueva-Domingo and Ichiki (2021) P. Villanueva-Domingo and K. Ichiki, “21 cm Forest Constraints on Primordial Black Holes,” (2021), 10.1093/pasj/psab119, arXiv:2104.10695 [astro-ph.CO] .
- Tashiro and Sugiyama (2013) H. Tashiro and N. Sugiyama, “The effect of primordial black holes on 21 cm fluctuations,” Mon. Not. Roy. Astron. Soc. 435, 3001 (2013), arXiv:1207.6405 [astro-ph.CO] .
- Natarajan et al. (2015) A. Natarajan, N. Zhu, and N. Yoshida, “Probing the Small Scale Matter Power Spectrum through Dark Matter Annihilation in the Early Universe,” (2015), arXiv:1503.03480 [astro-ph.CO] .
- Yoshiura et al. (2018) S. Yoshiura, K. Takahashi, and T. Takahashi, “Impact of EDGES 21-cm global signal on the primordial power spectrum,” Phys. Rev. D 98, 063529 (2018), arXiv:1805.11806 [astro-ph.CO] .
- Libanore et al. (2022) S. Libanore, C. Unal, D. Sarkar, and E. D. Kovetz, “Unveiling cosmological information on small scales with line intensity mapping,” Phys. Rev. D 106, 123512 (2022), arXiv:2208.01658 [astro-ph.CO] .
- Bertone et al. (2005) G. Bertone, D. Hooper, and J. Silk, “Particle dark matter: Evidence, candidates and constraints,” Phys. Rept. 405, 279 (2005), arXiv:hep-ph/0404175 [hep-ph] .
- Jungman et al. (1996) G. Jungman, M. Kamionkowski, and K. Griest, “Supersymmetric dark matter,” Phys. Rept. 267, 195 (1996), arXiv:hep-ph/9506380 [hep-ph] .
- Yuan et al. (2010) Q. Yuan, B. Yue, X.-J. Bi, X. Chen, and X. Zhang, “Leptonic dark matter annihilation in the evolving universe: constraints and implications,” JCAP 1010, 023 (2010), arXiv:0912.2504 [astro-ph.CO] .
- Chen and Kamionkowski (2004) X. Chen and M. Kamionkowski, “Particle decays during the cosmic dark ages,” Phys. Rev. D 70, 043502 (2004).
- Zhang et al. (2006) L. Zhang, X.-L. Chen, Y.-A. Lei, and Z.-G. Si, “The impacts of dark matter particle annihilation on recombination and the anisotropies of the cosmic microwave background,” Phys. Rev. D 74, 103519 (2006), arXiv:astro-ph/0603425 .
- Madhavacheril et al. (2014) M. S. Madhavacheril, N. Sehgal, and T. R. Slatyer, “Current Dark Matter Annihilation Constraints from CMB and Low-Redshift Data,” Phys. Rev. D89, 103508 (2014), arXiv:1310.3815 [astro-ph.CO] .
- Yang (2015) Y. Yang, “Constraints on the basic parameters of dark matter using the Planck data,” Phys. Rev. D91, 083517 (2015), arXiv:1504.01195 [astro-ph.CO] .
- Slatyer (2016a) T. R. Slatyer, “Indirect Dark Matter Signatures in the Cosmic Dark Ages II. Ionization, Heating and Photon Production from Arbitrary Energy Injections,” Phys. Rev. D93, 023521 (2016a), arXiv:1506.03812 [astro-ph.CO] .
- Cheung et al. (2019) K. Cheung, J.-L. Kuo, K.-W. Ng, and Y.-L. S. Tsai, “The impact of EDGES 21-cm data on dark matter interactions,” Phys. Lett. B 789, 137 (2019), arXiv:1803.09398 [astro-ph.CO] .
- Kovetz et al. (2018) E. D. Kovetz, V. Poulin, V. Gluscevic, K. K. Boddy, R. Barkana, and M. Kamionkowski, “Tighter limits on dark matter explanations of the anomalous EDGES 21 cm signal,” Phys. Rev. D98, 103529 (2018), arXiv:1807.11482 [astro-ph.CO] .
- Berlin et al. (2018) A. Berlin, D. Hooper, G. Krnjaic, and S. D. McDermott, “Severely Constraining Dark Matter Interpretations of the 21-cm Anomaly,” Phys. Rev. Lett. 121, 011102 (2018), arXiv:1803.02804 [hep-ph] .
- D’Amico et al. (2018) G. D’Amico, P. Panci, and A. Strumia, “Bounds on Dark Matter annihilations from 21 cm data,” Phys. Rev. Lett. 121, 011103 (2018), arXiv:1803.03629 [astro-ph.CO] .
- Yang (2018) Y. Yang, “Contributions of dark matter annihilation to the global 21 cm spectrum observed by the EDGES experiment,” Phys. Rev. D98, 103503 (2018), arXiv:1803.05803 [astro-ph.CO] .
- Vipp et al. (2021) V. Vipp, A. Hektor, and G. Hütsi, “Rapid onset of the 21-cm signal suggests a preferred mass range for dark matter particle,” Phys. Rev. D 103, 123002 (2021).
- Galli et al. (2013) S. Galli, T. R. Slatyer, M. Valdes, and F. Iocco, “Systematic uncertainties in constraining dark matter annihilation from the cosmic microwave background,” Phys. Rev. D 88, 063502 (2013).
- Chluba (2010) J. Chluba, “Could the cosmological recombination spectrum help us understand annihilating dark matter?” Monthly Notices of the Royal Astronomical Society 402, 1195 (2010).
- Cumberbatch et al. (2010) D. T. Cumberbatch, M. Lattanzi, J. Silk, M. Lattanzi, and J. Silk, “Signatures of clumpy dark matter in the global 21 cm Background Signal,” Phys. Rev. D82, 103508 (2010), arXiv:0808.0881 [astro-ph] .
- Yang (2016) Y. Yang, “Contributions of dark matter annihilation within ultracompact minihalos to the 21 cm background signal,” Eur. Phys. J. Plus 131, 432 (2016), arXiv:1612.06559 [astro-ph.CO] .
- Valdes et al. (2007) M. Valdes, A. Ferrara, M. Mapelli, and E. Ripamonti, “Constraining DM through 21 cm observations,” Mon. Not. Roy. Astron. Soc. 377, 245 (2007), arXiv:astro-ph/0701301 .
- Valdé s et al. (2012) M. Valdé s, C. Evoli, A. Mesinger, A. Ferrara, and N. Yoshida, “The nature of dark matter from the global high-redshift h i 21 cm signal,” Monthly Notices of the Royal Astronomical Society 429, 1705 (2012).
- Pritchard and Loeb (2012) J. R. Pritchard and A. Loeb, “21-cm cosmology,” Rept. Prog. Phys. 75, 086901 (2012), arXiv:1109.6012 [astro-ph.CO] .
- Furlanetto et al. (2006) S. Furlanetto, S. P. Oh, and F. Briggs, “Cosmology at Low Frequencies: The 21 cm Transition and the High-Redshift Universe,” Phys. Rept. 433, 181 (2006), arXiv:astro-ph/0608032 [astro-ph] .
- Bowman et al. (2018) J. D. Bowman, A. E. E. Rogers, R. A. Monsalve, T. J. Mozdzen, and N. Mahesh, “An absorption profile centred at 78 megahertz in the sky-averaged spectrum,” Nature 555, 67 (2018), arXiv:1810.05912 [astro-ph.CO] .
- Cohen et al. (2017) A. Cohen, A. Fialkov, R. Barkana, and M. Lotem, “Charting the parameter space of the global 21-cm signal,” Monthly Notices of the Royal Astronomical Society 472, 1915 (2017), https://academic.oup.com/mnras/article-pdf/472/2/1915/19917726/stx2065.pdf .
- Xu et al. (2021) Y. Xu, B. Yue, and X. Chen, “Maximum Absorption of the Global 21 cm Spectrum in the Standard Cosmological Model,” Astrophys. J. 923, 98 (2021), arXiv:2102.12865 [astro-ph.CO] .
- Bradley et al. (2019) R. F. Bradley, K. Tauscher, D. Rapetti, and J. O. Burns, “A Ground Plane Artifact that Induces an Absorption Profile in Averaged Spectra from Global 21-cm Measurements - with Possible Application to EDGES,” Astrophys. J. 874, 153 (2019), arXiv:1810.09015 [astro-ph.IM] .
- Hills et al. (2018) R. Hills, G. Kulkarni, P. D. Meerburg, and E. Puchwein, “Concerns about modelling of the EDGES data,” Nature 564, E32 (2018), arXiv:1805.01421 [astro-ph.CO] .
- Singh and Subrahmanyan (2019) S. Singh and R. Subrahmanyan, “The redshifted 21-cm signal in the EDGES low-band spectrum,” (2019), 10.3847/1538-4357/ab2879, arXiv:1903.04540 [astro-ph.CO] .
- Singh et al. (2018) S. Singh et al., “SARAS 2 constraints on global 21-cm signals from the Epoch of Reionization,” Astrophys. J. 858, 54 (2018), arXiv:1711.11281 [astro-ph.CO] .
- Fialkov et al. (2018) A. Fialkov, R. Barkana, and A. Cohen, “Constraining Baryon–Dark Matter Scattering with the Cosmic Dawn 21-cm Signal,” Phys. Rev. Lett. 121, 011101 (2018), arXiv:1802.10577 [astro-ph.CO] .
- Fraser et al. (2018) S. Fraser et al., “The EDGES 21 cm Anomaly and Properties of Dark Matter,” Phys. Lett. B 785, 159 (2018), arXiv:1803.03245 [hep-ph] .
- Hektor et al. (2018) A. Hektor, G. Hütsi, L. Marzola, and V. Vaskonen, “Constraints on ALPs and excited dark matter from the EDGES 21-cm absorption signal,” Phys. Lett. B 785, 429 (2018), arXiv:1805.09319 [hep-ph] .
- Burns et al. (2019) J. O. Burns et al., “Dark Cosmology: Investigating Dark Matter \& Exotic Physics in the Dark Ages using the Redshifted 21-cm Global Spectrum,” (2019), arXiv:1902.06147 [astro-ph.CO] .
- Clark et al. (2018) S. Clark, B. Dutta, Y. Gao, Y.-Z. Ma, and L. E. Strigari, “21 cm limits on decaying dark matter and primordial black holes,” Phys. Rev. D98, 043006 (2018), arXiv:1803.09390 [astro-ph.HE] .
- Hiroshima et al. (2021) N. Hiroshima, K. Kohri, T. Sekiguchi, and R. Takahashi, “Impacts of new small-scale N-body simulations on dark matter annihilations constrained from cosmological 21-cm line observations,” Phys. Rev. D 104, 083547 (2021), arXiv:2103.14810 [astro-ph.CO] .
- Halder and Banerjee (2021) A. Halder and S. Banerjee, “Bounds on abundance of primordial black hole and dark matter from EDGES 21-cm signal,” Phys. Rev. D 103, 063044 (2021), arXiv:2102.00959 [astro-ph.CO] .
- Kovetz et al. (2019) E. D. Kovetz, I. Cholis, and D. E. Kaplan, “Bounds on ultralight hidden-photon dark matter from observation of the 21 cm signal at cosmic dawn,” Phys. Rev. D99, 123511 (2019), arXiv:1809.01139 [astro-ph.CO] .
- Bhatt et al. (2019) J. R. Bhatt, A. K. Mishra, and A. C. Nayak, “Viscous dark matter and 21 cm cosmology,” Phys. Rev. D100, 063539 (2019), arXiv:1901.08451 [astro-ph.CO] .
- Barkana et al. (2018) R. Barkana, N. J. Outmezguine, D. Redigolo, and T. Volansky, “Strong constraints on light dark matter interpretation of the EDGES signal,” Phys. Rev. D98, 103005 (2018), arXiv:1803.03091 [hep-ph] .
- Jia and Liao (2019) L.-B. Jia and X. Liao, “Possible s-wave annihilation for MeV dark matter with the 21-cm absorption,” Phys. Rev. D 100, 035012 (2019), arXiv:1906.00559 [hep-ph] .
- Saha and Laha (2022) A. K. Saha and R. Laha, “Sensitivities on nonspinning and spinning primordial black hole dark matter with global 21-cm troughs,” Phys. Rev. D 105, 103026 (2022), arXiv:2112.10794 [astro-ph.CO] .
- Minoda et al. (2022) T. Minoda, S. Yoshiura, and T. Takahashi, “Probing isocurvature perturbations with 21-cm global signal in the light of HERA result,” Phys. Rev. D 105, 083523 (2022), arXiv:2112.15135 [astro-ph.CO] .
- Yoshiura et al. (2020b) S. Yoshiura, K. Takahashi, and T. Takahashi, “Probing Small Scale Primordial Power Spectrum with 21cm Line Global Signal,” Phys. Rev. D 101, 083520 (2020b), arXiv:1911.07442 [astro-ph.CO] .
- Cen (2017) R. Cen, “Constraint on Matter Power Spectrum on Scales from ,” Astrophys. J. 836, 217 (2017), arXiv:1606.05930 [astro-ph.CO] .
- Byrnes et al. (2019) C. T. Byrnes, P. S. Cole, and S. P. Patil, “Steepest growth of the power spectrum and primordial black holes,” JCAP 06, 028 (2019), arXiv:1811.11158 [astro-ph.CO] .
- Raveendran et al. (2022) R. N. Raveendran, K. Parattu, and L. Sriramkumar, “Enhanced power on small scales and evolution of quantum state of perturbations in single and two field inflationary models,” Gen. Rel. Grav. 54, 91 (2022), arXiv:2206.05760 [astro-ph.CO] .
- Heydari and Karami (2022) S. Heydari and K. Karami, “Primordial black holes ensued from exponential potential and coupling parameter in nonminimal derivative inflation model,” JCAP 03, 033 (2022), arXiv:2111.00494 [gr-qc] .
- Carrilho et al. (2019) P. Carrilho, K. A. Malik, and D. J. Mulryne, “Dissecting the growth of the power spectrum for primordial black holes,” Phys. Rev. D 100, 103529 (2019), arXiv:1907.05237 [astro-ph.CO] .
- Cole and Silk (2021) P. S. Cole and J. Silk, “Small-scale primordial fluctuations in the 21 cm Dark Ages signal,” Mon. Not. Roy. Astron. Soc. 501, 2627 (2021), arXiv:1912.02171 [astro-ph.CO] .
- Mishra and Sahni (2020) S. S. Mishra and V. Sahni, “Primordial Black Holes from a tiny bump/dip in the Inflaton potential,” JCAP 04, 007 (2020), arXiv:1911.00057 [gr-qc] .
- Yi et al. (2021) Z. Yi, Q. Gao, Y. Gong, and Z.-h. Zhu, “Primordial black holes and scalar-induced secondary gravitational waves from inflationary models with a noncanonical kinetic term,” Phys. Rev. D 103, 063534 (2021), arXiv:2011.10606 [astro-ph.CO] .
- Gao and Guo (2018) T.-J. Gao and Z.-K. Guo, “Primordial Black Hole Production in Inflationary Models of Supergravity with a Single Chiral Superfield,” Phys. Rev. D 98, 063526 (2018), arXiv:1806.09320 [hep-ph] .
- Balaji et al. (2022) S. Balaji, H. V. Ragavendra, S. K. Sethi, J. Silk, and L. Sriramkumar, “Observing Nulling of Primordial Correlations via the 21-cm Signal,” Phys. Rev. Lett. 129, 261301 (2022), arXiv:2206.06386 [astro-ph.CO] .
- Carroll et al. (1992) S. M. Carroll, W. H. Press, and E. L. Turner, “The cosmological constant.” Ann. Rev. Astron. Astrophys. 30, 499 (1992).
- Green et al. (2005) A. M. Green, S. Hofmann, and D. J. Schwarz, “The First wimpy halos,” JCAP 08, 003 (2005), arXiv:astro-ph/0503387 .
- Bardeen et al. (1986) J. M. Bardeen, J. R. Bond, N. Kaiser, and A. S. Szalay, “The Statistics of Peaks of Gaussian Random Fields,” Astrophys. J. 304, 15 (1986).
- White (2014) M. White, “The Zel’dovich approximation,” Mon. Not. Roy. Astron. Soc. 439, 3630 (2014), arXiv:1401.5466 [astro-ph.CO] .
- Castorina and White (2019) E. Castorina and M. White, “Measuring the growth of structure with intensity mapping surveys,” Journal of Cosmology and Astroparticle Physics 2019, 025–025 (2019).
- Porto et al. (2014) R. A. Porto, L. Senatore, and M. Zaldarriaga, “The Lagrangian-space Effective Field Theory of Large Scale Structures,” JCAP 05, 022 (2014), arXiv:1311.2168 [astro-ph.CO] .
- Press and Schechter (1974) W. H. Press and P. Schechter, “Formation of Galaxies and Clusters of Galaxies by Self-Similar Gravitational Condensation,” Astrophys. J. 187, 425 (1974).
- White et al. (1993) S. D. M. White, G. Efstathiou, and C. S. Frenk, “The amplitude of mass fluctuations in the Universe,” Monthly Notices of the Royal Astronomical Society 262, 1023 (1993), https://academic.oup.com/mnras/article-pdf/262/4/1023/3671434/mnras262-1023.pdf .
- Percival (2001) W. J. Percival, “The build-up of halos within press-schechter theory,” Mon. Not. Roy. Astron. Soc. 327, 1313 (2001), arXiv:astro-ph/0107437 .
- Dodelson (2003) S. Dodelson, in Modern Cosmology, edited by S. Dodelson (Academic Press, Burlington, 2003) pp. 261–291.
- Serpico et al. (2012) P. D. Serpico, E. Sefusatti, M. Gustafsson, and G. Zaharijas, “Extragalactic gamma-ray signal from Dark Matter annihilation: a power spectrum based computation,” Mon. Not. Roy. Astron. Soc. 421, L87 (2012), arXiv:1109.0095 [astro-ph.CO] .
- Sefusatti et al. (2014) E. Sefusatti, G. Zaharijas, P. D. Serpico, D. Theurel, and M. Gustafsson, “Extragalactic gamma-ray signal from dark matter annihilation: an appraisal,” Mon. Not. Roy. Astron. Soc. 441, 1861 (2014), arXiv:1401.2117 [astro-ph.CO] .
- W.H.Press and Schechter (1974) W.H.Press and P. Schechter, The Astrophysical Journal 187, 425 (1974).
- Abdo et al. (2010) A. A. Abdo et al. (Fermi-LAT), “Constraints on Cosmological Dark Matter Annihilation from the Fermi-LAT Isotropic Diffuse Gamma-Ray Measurement,” JCAP 1004, 014 (2010), arXiv:1002.4415 [astro-ph.CO] .
- Navarro et al. (1997) J. F. Navarro, C. S. Frenk, and S. D. M. White, “A Universal density profile from hierarchical clustering,” Astrophys. J. 490, 493 (1997), arXiv:astro-ph/9611107 .
- Zhang et al. (2007) L. Zhang, X. Chen, M. Kamionkowski, Z.-g. Si, and Z. Zheng, “Constraints on radiative dark-matter decay from the cosmic microwave background,” Phys. Rev. D 76, 061301 (2007).
- Stöcker et al. (2018) P. Stöcker, M. Krämer, J. Lesgourgues, and V. Poulin, “Exotic energy injection with ExoCLASS: Application to the Higgs portal model and evaporating black holes,” JCAP 1803, 018 (2018), arXiv:1801.01871 [astro-ph.CO] .
- Blas et al. (2011) D. Blas, J. Lesgourgues, and T. Tram, “The cosmic linear anisotropy solving system (CLASS). part II: Approximation schemes,” Journal of Cosmology and Astroparticle Physics 2011, 034 (2011).
- Ciardi and Madau (2003) B. Ciardi and P. Madau, “Probing beyond the epoch of hydrogen reionization with 21 centimeter radiation,” Astrophys. J. 596, 1 (2003), arXiv:astro-ph/0303249 [astro-ph] .
- Kuhlen et al. (2006) M. Kuhlen, P. Madau, and R. Montgomery, “The spin temperature and 21cm brightness of the intergalactic medium in the pre-reionization era,” Astrophys. J. 637, L1 (2006), arXiv:astro-ph/0510814 [astro-ph] .
- Liszt (2001) H. Liszt, “The spin temperature of warm interstellar h I,” Astron. Astrophys. 371, 698 (2001), arXiv:astro-ph/0103246 [astro-ph] .
- Villanueva-Domingo et al. (2020) P. Villanueva-Domingo, O. Mena, and J. Miralda-Escudé, “Maximum amplitude of the high-redshift 21-cm absorption feature,” Phys. Rev. D 101, 083502 (2020), arXiv:1912.09488 [astro-ph.CO] .
- Mittal and Kulkarni (2021) S. Mittal and G. Kulkarni, “Ly coupling and heating at cosmic dawn,” Mon. Not. Roy. Astron. Soc. 503, 4264 (2021), arXiv:2009.10746 [astro-ph.CO] .
- Gessey-Jones et al. (2022) T. Gessey-Jones, N. S. Sartorio, A. Fialkov, G. M. Mirouh, M. Magg, R. G. Izzard, E. d. L. Acedo, W. J. Handley, and R. Barkana, “Impact of the primordial stellar initial mass function on the 21-cm signal,” Mon. Not. Roy. Astron. Soc. 516, 841 (2022), arXiv:2202.02099 [astro-ph.CO] .
- Reis et al. (2021) I. Reis, A. Fialkov, and R. Barkana, “The subtlety of Ly photons: changing the expected range of the 21-cm signal,” Mon. Not. Roy. Astron. Soc. 506, 5479 (2021), arXiv:2101.01777 [astro-ph.CO] .
- Mirocha et al. (2021) J. Mirocha, H. Lamarre, and A. Liu, “Systematic uncertainties in models of the cosmic dawn,” Mon. Not. Roy. Astron. Soc. 504, 1555 (2021), arXiv:2012.06588 [astro-ph.CO] .
- Monsalve et al. (2019) R. A. Monsalve, A. Fialkov, J. D. Bowman, A. E. E. Rogers, T. J. Mozdzen, A. Cohen, R. Barkana, and N. Mahesh, “Results from EDGES High-Band: III. New Constraints on Parameters of the Early Universe,” Astrophys. J. 875, 67 (2019), arXiv:1901.10943 [astro-ph.CO] .
- Slatyer (2016b) T. R. Slatyer, “Indirect dark matter signatures in the cosmic dark ages. I. Generalizing the bound on s-wave dark matter annihilation from Planck results,” Phys. Rev. D 93, 023527 (2016b), arXiv:1506.03811 [hep-ph] .
- Kawasaki et al. (2021) M. Kawasaki, H. Nakatsuka, K. Nakayama, and T. Sekiguchi, “Revisiting CMB constraints on dark matter annihilation,” JCAP 12, 015 (2021), arXiv:2105.08334 [astro-ph.CO] .
- Li et al. (2016) Z. Li, X. Huang, Q. Yuan, and Y. Xu, “Constraints on the dark matter annihilation from Fermi-LAT observation of M31,” JCAP 12, 028 (2016), arXiv:1312.7609 [astro-ph.CO] .
- Di Mauro and Winkler (2021) M. Di Mauro and M. W. Winkler, “Multimessenger constraints on the dark matter interpretation of the Fermi-LAT Galactic center excess,” Phys. Rev. D 103, 123005 (2021), arXiv:2101.11027 [astro-ph.HE] .
- Ackermann et al. (2014) M. Ackermann et al. (Fermi-LAT), “Dark Matter Constraints from Observations of 25 Milky Way Satellite Galaxies with the Fermi Large Area Telescope,” Phys. Rev. D 89, 042001 (2014), arXiv:1310.0828 [astro-ph.HE] .
- Plice et al. (2017) L. Plice, K. Galal, and J. O. Burns, “DARE Mission Design: Low RFI Observations from a Low-Altitude Frozen Lunar Orbit,” arXiv e-prints , arXiv:1702.00286 (2017), arXiv:1702.00286 [astro-ph.IM] .
- Chen et al. (2019) X. Chen, J. Burns, L. Koopmans, H. Rothkaehi, J. Silk, J. Wu, A.-J. Boonstra, B. Cecconi, C. H. Chiang, L. Chen, L. Deng, M. Falanga, H. Falcke, Q. Fan, G. Fang, A. Fialkov, L. Gurvits, Y. Ji, J. C. Kasper, K. Li, Y. Mao, B. Mckinley, R. Monsalve, J. B. Peterson, J. Ping, R. Subrahmanyan, H. Vedantham, M. Klein Wolt, F. Wu, Y. Xu, J. Yan, and B. Yue, “Discovering the Sky at the Longest Wavelengths with Small Satellite Constellations,” arXiv e-prints , arXiv:1907.10853 (2019), arXiv:1907.10853 [astro-ph.IM] .
- Burns et al. (2021a) J. Burns et al., “Global 21-cm Cosmology from the Farside of the Moon,” (2021a), arXiv:2103.05085 [astro-ph.CO] .
- Burns (2020) J. O. Burns, “Transformative science from the lunar farside: observations of the dark ages and exoplanetary systems at low radio frequencies,” Philosophical Transactions of the Royal Society A: Mathematical, Physical and Engineering Sciences 379, 20190564 (2020).
- Burns et al. (2021b) J. Burns et al., “A Lunar Farside Low Radio Frequency Array for Dark Ages 21-cm Cosmology,” (2021b), arXiv:2103.08623 [astro-ph.IM] .