Small Planets Around Cool Dwarfs:
Enhanced Formation Efficiency of Super-Earths around M dwarfs
Abstract
Current measurements of planet population as a function of stellar mass show three seemingly contradictory signatures: close-in super-Earths are more prevalent around M dwarfs than FGK dwarfs; inner super-Earths are correlated with outer giants; and outer giants are less common around M dwarfs than FGK dwarfs. Here, we build a simple framework that combines the theory of pebble accretion with the measurements of dust masses in protoplanetary disks to reconcile all three observations. First, we show that cooler stars are more efficient at converting pebbles into planetary cores at short orbital periods. Second, when disks are massive enough to nucleate a heavy core at 5 AU, more than enough dust can drift in to assemble inner planets, establishing the correlation between inner planets and outer giants. Finally, while stars of varying masses are similarly capable of converting pebbles into cores at long orbital periods, hotter stars are much more likely to harbor more massive dust disks so that the giant planet occurrence rate rises around hotter stars. Our results are valid over a wide range of parameter space for a disk accretion rate that follows . We predict a decline in mini-Neptune population (but not necessarily terrestrial planets) around stars lighter than 0.3–0.5. Cold giants (5 AU), if they exist, should remain correlated with inner planets even around lower mass stars.
1 Introduction
Super-Earths and mini-Neptunes are more likely to appear around M dwarfs, with their occurrence rate inside 50–100 days enhanced by factors of 3–10 as compared to those around FGK dwarfs (e.g., Dressing & Charbonneau, 2015; Mulders et al., 2015; Gaidos et al., 2016; Hsu et al., 2020). One way to explain this difference is to consider the lower binarity of M dwarfs compared to their more massive counterparts (e.g., Raghavan et al., 2010) as wide binaries can spuriously amplify the stellar brightness and dilute transit signals. Correcting for the effects of binaries however can only account for roughly half of the measured difference (Moe & Kratter, 2021).
Another difference between planetary systems around M vs. FGK dwarfs is the existence of gas giants. Unlike small planet statistics, gas giant occurrence rate of FGK dwarfs is boosted by factors of 2–3 as compared to M dwarfs (e.g., Clanton & Gaudi, 2014; Fulton et al., 2021). This general trend of gas giant appearing more commonly around more massive stars is corroborated in direct imaging surveys as well with a caveat that those surveys are sensitive to super-Jupiters around young stars (Nielsen et al., 2019). Gas giants, when they exist, are much more likely to appear at intermediate distances 1–10 AU (Fulton et al., 2021). Recently, Mulders et al. (2021) argued that this outer giant acts as a barrier against the radial drift of pebbles which can effectively starve the inner disk from solids and thereby limiting the amount of pebbles available for the formation of planetary cores (see also Lambrechts et al., 2019).
Such hypothesis runs counter to the observations that show a correlation between outer gas giants and inner super-Earths (Zhu & Wu, 2018; Bryan et al., 2019; Herman et al., 2019; Rosenthal et al., 2022).111Recent radial velocity follow-up to Kepler/K2 (Bonomo et al., 2023) and TESS planets (Van Zandt et al., 2023) report that giant planet occurrence rate around stars with inner planets is statistically consistent with that of field stars. Both studies call to attention the need for a larger sample so at present, we conclude that there is either a neutral or positive correlation between outer gas giants and inner super-Earths. In fact, the core assembly process by pebble accretion is notoriously lossy (e.g., Ormel, 2017; Ormel & Liu, 2018), so much so that for every pebble isolation mass 10 that is created at 10 AU, upwards of 100 worth of material can be drifted into the inner orbits while (but not after) the massive core assembles (Lin et al., 2018; Chachan et al., 2022). Furthermore, once the giant forms, the interplay between its secular resonance with planetesimals and aerodynamic drag could spell rapid transport of the latter, enriching the inner region with even more solid material (Best et al., 2023).
In this work, we build a simple framework that combines the theory of pebble accretion with the measured distribution of protoplanetary disk masses to reconcile all three observations: the propensity of cooler stars to harbor more super-Earths; the correlation between inner super-Earths and outer giants; and the tendency for cooler stars to harbor less giants. We lay out the underlying theory in Section 2. Results are presented in Section 3 and we provide a summary and predictions in Section 4.
2 Theory
We begin by defining the efficiency with which a protoplanet accretes pebbles:
| (1) |
where is the accretion rate of pebbles and is the radial drift rate of pebbles at the protoplanet’s location. We assume , where is the cylindrical distance from the star, is the surface density of dust grains of Stokes number St and is their radial velocity (negative sign denotes inward drift),
| (2) |
where the first term accounts for the particles’ coupling to the inward accretion of gas: is the kinematic viscosity of the gas, is the Shakura-Sunyaev parameter, is the sound speed, is the Boltzmann constant, is the local disk temperature, is the mean molecular weight of the gas, is the mass of a hydrogen atom, is the gas disk scale height, is the Keplerian orbital frequency, is the gravitational constant, and is the mass of the central star. The second term of equation 2 accounts for the Nakagawa-Sekiya-Hayashi drift velocity from the gas headwind (Nakagawa et al., 1986): is a measure of the deviation in gas orbital velocity from the Keplerian velocity due to the radial pressure gradient in the gas disk with and is the gas pressure. We limit our analysis to so that within order unity.
Following Lin et al. (2018, see also ), the rate of pebble accretion can be written as
| (3) |
where particles that come within of the protoplanet at speed will be accreted onto the core and is the pebble disk scale height. When , we are in three-dimensional (3D) accretion regime and under the condition that the pebble-protoplanet encounter time is longer than the settling time, the terminal velocity of the pebbles is approximately a quarter of the accretion velocity (Ormel & Klahr, 2010), which allows us to write . The accretion rate in the 3D regime is therefore given by
| (4) |
where is the mass of the protoplanet. When (two-dimensional accretion) and is dominated by the headwind velocity (2D, hw),
| (5) |
where . This condition is satisfied when (see the appendix of Lin et al. 2018; see also Perets & Murray-Clay 2011)
| (6) |
In the same two-dimensional accretion but when is dominated by Keplerian shear (2D, sh),
| (7) |
whose condition is satisfied when (equation A5 of Lin et al. 2018)
| (8) |
The two-dimensional accretion transitions from headwind- to shear-dominated regime when exceeds a transition mass
| (9) |
equivalently,
| (10) |
Combining everything together,
| (11) |
We define a mass averaged efficiency by integrating over a grain size distribution assuming Epstein drag so that and grain mass :
| (12) |
where is the grain size distribution such that for St (turbulent regime) and for St (settling regime) as inferred from Birnstiel et al. (2011).
The upper limit on St is set by fragmentation from turbulent velocity dispersion
| (13) |
where is the collision velocity at which grains fragment. Grains may drift before they reach Stf but this is not the limiting process for the vast majority of our parameter space. This effect only appears for low mass stars at , m/s, and days, where it makes a negligible difference to our results and is therefore left out of subsequent discussion. We integrate over St , where the lower limit of St is chosen to have enough dynamic range while also capturing the case where the radial inflow of particles is dominated by coupling to gas inflow (; see equation 11). Once we obtain , we calculate the dust mass required for a protoplanet to reach the pebble isolation mass
| (14) |
where the initial protoplanet mass is taken to be a lunar mass (; Johansen & Lambrechts 2017). Choosing a stellar mass dependent (e.g., Liu et al., 2020) has a negligible impact on our results (see § 3.1). We limit our integration to as at this point, the planet can perturb the surrounding disk gas to create a pebble trap exterior to its orbit (e.g., Lambrechts et al., 2014) and so pebble accretion halts. We adopt derived by Bitsch et al. (2018), relevant for :
| (15) |
We use the disk temperature profile of Ida et al. (2016), which draws from the more detailed models in Garaud & Lin (2007) and Oka et al. (2011) and agrees with numerical radiative-transfer calculations from D’Alessio et al. (1998), within order unity numerical coefficients. In the viscously heated inner regions of the disk, the temperature is given by
| (16) |
where is the rate of accretion onto the star. Observational constraints of indicate that it increases with :
| (17) |
where the power-law index ranges from 1.5 and 3.1 and is the mass accretion rate onto a solar mass star. We choose which is the measured mean – relationship and we vary between and which captures 30–70 percentile measured accretion rates for a solar mass star (e.g., Manara et al., 2022).
Heating in the outer disk becomes dominated by stellar irradiation. In the limit where the disk is optically thick to stellar radiation and vertically isothermal (e.g., nearly optically thin to internal radiation),
| (18) |
where is the stellar luminosity and –1.9 drawn from MIST models (Dotter, 2016; Choi et al., 2016) for pre-main sequence stars. We adopt for our study. We can now define the disk temperature:
| (19) |
where 2000 K sets the upper limit to the temperature due to the thermostating effect of dust sublimation (D’Alessio et al., 1998).
To evaluate , we need to evaluate a pressure profile where is the disk gas surface density. We adopt the self-similar solution of viscously accreting disk (Lynden-Bell & Pringle, 1974; Hartmann et al., 1998) and . For , so . For , so . When thermostats, and so .
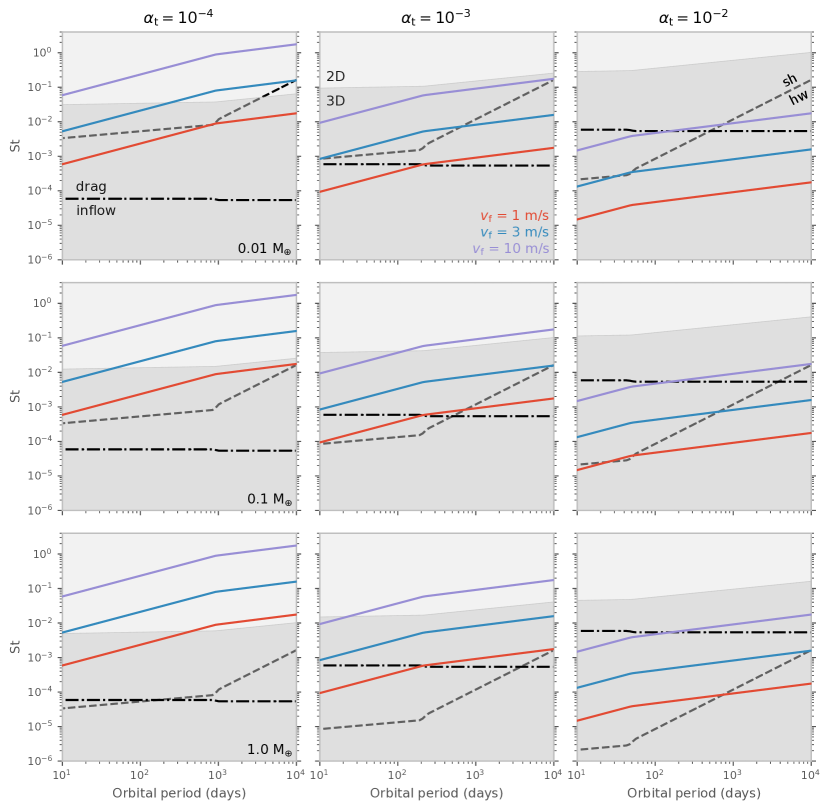
With the disk structure in hand, we illustrate in Figure 1 how the relevant regimes of accretion transition from 3D to 2D and from headwind- to shear-dominated as a function of orbital period, mass of the protoplanet , and . For illustrative purpose, we fix and . We choose to compare the regimes at the fragmentation limit as the grain mass distribution is top-heavy in logarithm of St (see equation 12). First, we see a general broken power-law in all , reflecting a transition from accretion-dominated () to irradiation-dominated () regimes from inner to outer orbits. At fixed , the accretion-dominated regime widens at lower because a fixed disk accretion rate with lower turbulence implies larger which in turn raises the disk optical depth and therefore the midplane temperature. Repeating the calculation at higher stellar masses (not shown), we find the accretion-dominated regime widens to longer orbital periods because of the increase in accretion luminosity; irradiation power also increases with stellar mass but not as steeply.
In terms of the mode of pebble accretion, we see that all the different combinations are possible over a plausible parameter space. First, at low , pebble motions are always dominated by aerodynamic drift rather than the coupling to the viscous gas inflow. As increases however, drops and so the coupling to the gas motion starts to dominate. In general, as the protocore gains mass (and/or at high enough ), pebble accretion becomes more shear-dominated rather than headwind-dominated as the core’s gravity starts to dominate the aerodynamic drag. Larger core mass and smaller imply larger accretion radius but thinner particle disk scale height and so generally favor 2D accretion. In general, by the time the accretion is two-dimensional, we see that the accretion is shear-dominated with the exception of the lowest , lowest and at long orbital periods (see, e.g., top left panel of Figure 1). The range of St, , and for which the 2D accretion headwind regime is relevant is independent of ( yr-1 as the transition from 2D shear to 2D headwind happens in irradiated regions) and although it broadens slightly at lower stellar masses, it still occupies a small part of our parameter space.
3 Results
3.1 Expected Behaviors of Required Dust Mass
Before we present our numerical results, we derive how is expected to scale with and orbital period . We start with :
| (20) |
| (21) |
The 2D headwind regime is applicable only for a small range of St and (see Figure 1) and most of the mass is acquired in 2D shear and 3D accretion regimes. By the time the protocore reaches 2D shear accretion, is large enough for radial drift to be dominated by aerodynamic drag and so from equation 11,
| (22) |
Since , there are three possibilities for 3D accretion:
| (23) |
An examination of Equations 22 and 23 at fixed orbital period shows that accretion efficiency primarily depends on via the disk aspect ratio . At a fixed , is lower around lower mass stars, which implies a higher pebble accretion rate (pebble disk is less puffy) and a pebble drift rate that is either slower for lower (St ) or independent of (St ). Thus, the accretion efficiency is boosted for lower as a result of lower .
The second condition on in Equation 23 only occurs for a narrow range of St and so is not dominant. As a result, we will not consider it for subsequent analytical derivations. Since is more weighted towards larger grains that contain most of the mass, we now substitute St = Stf solely to derive the scaling relationship of with respect to physical parameters. As illustrated in Figure 2, this is an adequate substitution to express the scaling relationships (not the absolute normalization) except near the transition between 3D and 2D accretion—because each makes its transition at a spectrum of orbital periods—and where Stf crosses the turbulent vs. settling regime. We note that we use the full range of St in our numerical calculations.
Substituting St with Stf, using the temperature scaling for viscously-heated regions of the disk (Equation 20, relevant for inner orbits), and writing in terms of and in Equations 22 and 23, we find that
| (24) |
and
| (25) |
The scaling of with respect to flips sign between 2D and 3D accretion because this dependence on the orbital period is primarily set by St rather than the disk aspect ratio in viscously heated regions (St compared to ). In the 2D accretion regime, larger Stf in the outer orbit implies a vigorous radial drift of pebbles, which makes it hard for the protocore to capture them. Under 3D accretion, larger Stf boosts more so than so that rises with . In both cases, drops with for all plausible range of –3.1 because both and decrease with . In particular, note the stronger than inversely linear dependence of on .
Making similar substitutions in Equations 22 and 23 but using the temperature scaling for irradiation dominated regions of the disk (Equation 21), we obtain
| (26) |
and
| (27) |
Both and now fall off with because declines more rapidly with in irradiated regions ( in the irradiation region compared to in the viscous region). We also see the drop with , albeit more weakly compared to viscously-heated region for the entire range of –1.9, due to the weaker dependence of on .
While (and potentially ) also depends on and , we expect its contribution to to be minimal compared to since equation 14 implies in the 3D regime and in the 2D regime, both of which are weak dependencies.
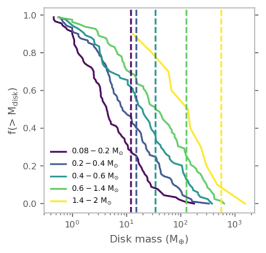
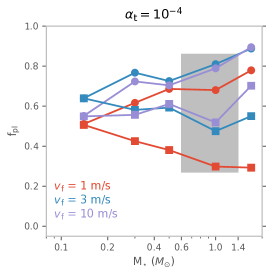
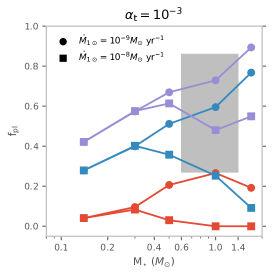
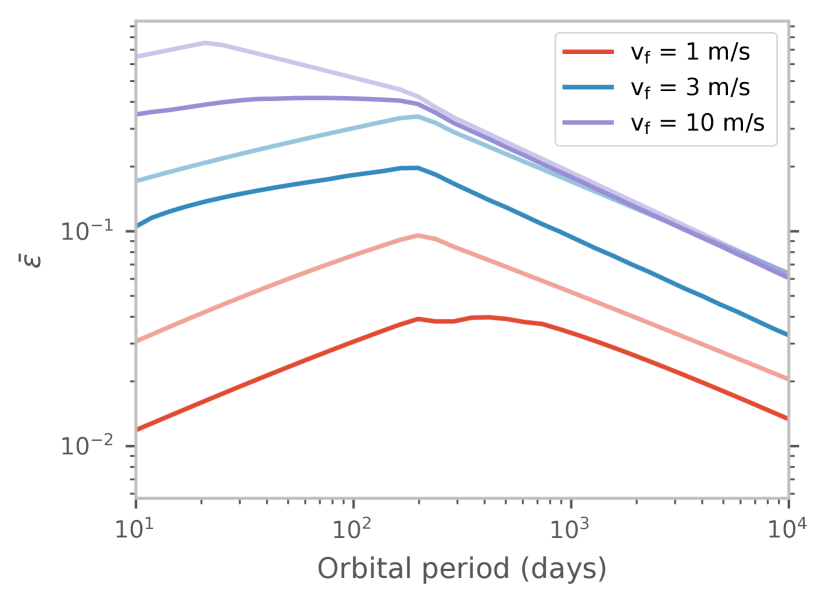
Figure 3 illustrates the overall behavior of as a function of orbital period over a range of , , and . Here, is calculated using the range of grain sizes present in fragmentation-limited regions of protoplanetary disks (St , see discussion around Equations 12-14). Higher implies lower required dust mass to create at a given orbital period so if decreases with , the corresponding rises with . In general, we see rising with in the outer orbit where disk heating is dominated by stellar irradiation (c.f. equation 26) and falling with in the inner orbit where the disk is viscously heated (c.f. equation 25). Exception arises at high and in the inner orbit which is when the accretion turns to 2D (c.f. equation 24). The dips in (for in the range 200-1000 days, m/s, , middle column in Figure 3 and m/s, , right column in Figure 3; for days, m/s, , middle row, bottom panel of Figure 3) manifest due to both turbulent and settling regimes of St coming into effect (c.f. Figure 2). Overall the required dust mass is larger for particles that more easily fragment (lower ) since this limits the maximum St and pebble accretion is slower for smaller St. However, we see an exception at where the required dust mass becomes comparable and slightly larger for m/s compared to 3 m/s in the outer orbit as they are both under 2D accretion which is less efficient at higher St due to strong radial drift past the protocore (c.f. equation 11).
3.2 Fraction of Disks that Can Create Inner Planets
Even though the pebble accretion efficiency is higher for lower mass stars in all the different regimes we study (Equations 2427), the feasibility of forming planetary cores depends on the available pebble mass as well, which generally decreases around lower mass stars. We therefore compare our against the distribution of measured disk masses to compute the fraction of disks that have enough mass to create inner cores , which we directly translate into the fraction of stars that have Kepler planets (e.g., Zhu et al., 2018; Yang et al., 2020), a metric that is distinct from the commonly quoted planet occurrence rate defined as the number of planets per star.
Using the measured disk masses tabulated by Manara et al. (2022), we build a cumulative distribution function (CDF) defined as the fraction of disks with masses greater than a given (Figure 4, left panel). The CDFs are divided into a range of stellar masses with the lower and upper limits of each interval set to (0.08, 0.20, 0.40, 0.60, 1.40, 2.00) , chosen to represent different stellar spectral types. These are evolved disks (1 Myr) but the formation of planetary cores could very well begin earlier (e.g., Najita & Kenyon, 2014; Manara et al., 2018) and so we multiply all disk masses by a factor of 3 so that the (99.7th percentile) value of disk mass in our sample matches the value of Class I disk masses measured by VLA in Tobin et al. (2020). A factor of 3 increase in dust mass between Class II and Class I disks is also in agreement with existing results from comparison of different disk classes in various star forming regions (e.g., Tychoniec et al., 2020). See Appendix A for more details and the effects of our choices on the disk mass CDFs and .
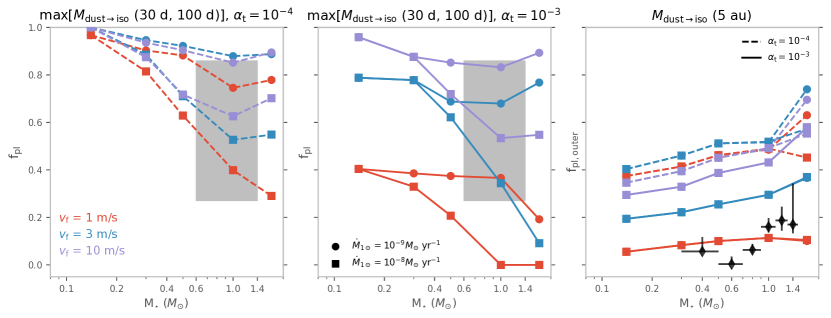
From Figure 3, we first note that at , the required dust mass is often , which is beyond the augmented masses of our disk sample and so we rule out . For the remaining runs, we compute for each stellar mass (taken as the midpoint of our stellar mass intervals) by plugging in the corresponding into the inverse function of the CDF. Given that the pebble accretion efficiency is generally 1–10% (see Figure 3), planetary cores at each location act as inefficient filters of pebbles allowing for the growth of multiple cores. While quantifying the exact multiplicity of cores is beyond the scope of this paper, within our framework, we can state that the region of planet formation is dictated by where the total disk dust mass is above and so a system can potentially nucleate more cores if it contains larger initial dust mass reservoir. We therefore take the larger of the values corresponding to and 100 days in order to capture the dust mass required to populate the inner disk with multiple planetary cores at least down to 30 days. Our qualitative results are not sensitive to the exact choice of this period range. The middle and the right panels of Figure 4 show the resulting vs. for and respectively. At , the fraction of disks that can create inner cores generally rises as stellar mass decreases from to ,222The rise in beyond is likely because of the poorly characterized disk mass CDF for massive stars due to limited sample size. The number of protostars in the different stellar mass bins are 90 (), 89 (), 84 (), 82 (), and 10 ().) reflecting the increase in with smaller for pebble accretion in viscously heated regions in the 3D regime (Equation 25).
The trend tends to reverse at lower because around these lower mass stars, even the inner orbits become irradiation-dominated and is much more weakly dependent on (Equation 27). The corresponding becomes near constant and since the disk mass distribution around lower is more bottom-heavy, decreases. We do not see this overturn in at lower stellar masses when the viscous heating dominates at the relevant orbital periods (e.g., and ). At , often rises with , because of the weak stellar mass dependence of in the 2D accretion regime (, Equation 24) or in the irradiated region (, Equation 27); the resulting is too similar compared to the difference in the disk mass CDFs, and thus rises with stellar mass.
We compare our with the the measured fraction of FGK stars with Kepler planets which ranges from 303% (Zhu et al., 2018) to 7313% (Yang et al., 2020) where the difference arises from different samples of host stars and different models for correcting for intrinsic planet multiplicity and the correlation in periods and radii of adjacent planet pairs (see Yang et al., 2020, their Section 5.1). Under our scheme, all but one model can reproduce the fraction of stars harboring close-in Kepler planets (see Figure 4).
3.3 Connection with Outer Planets
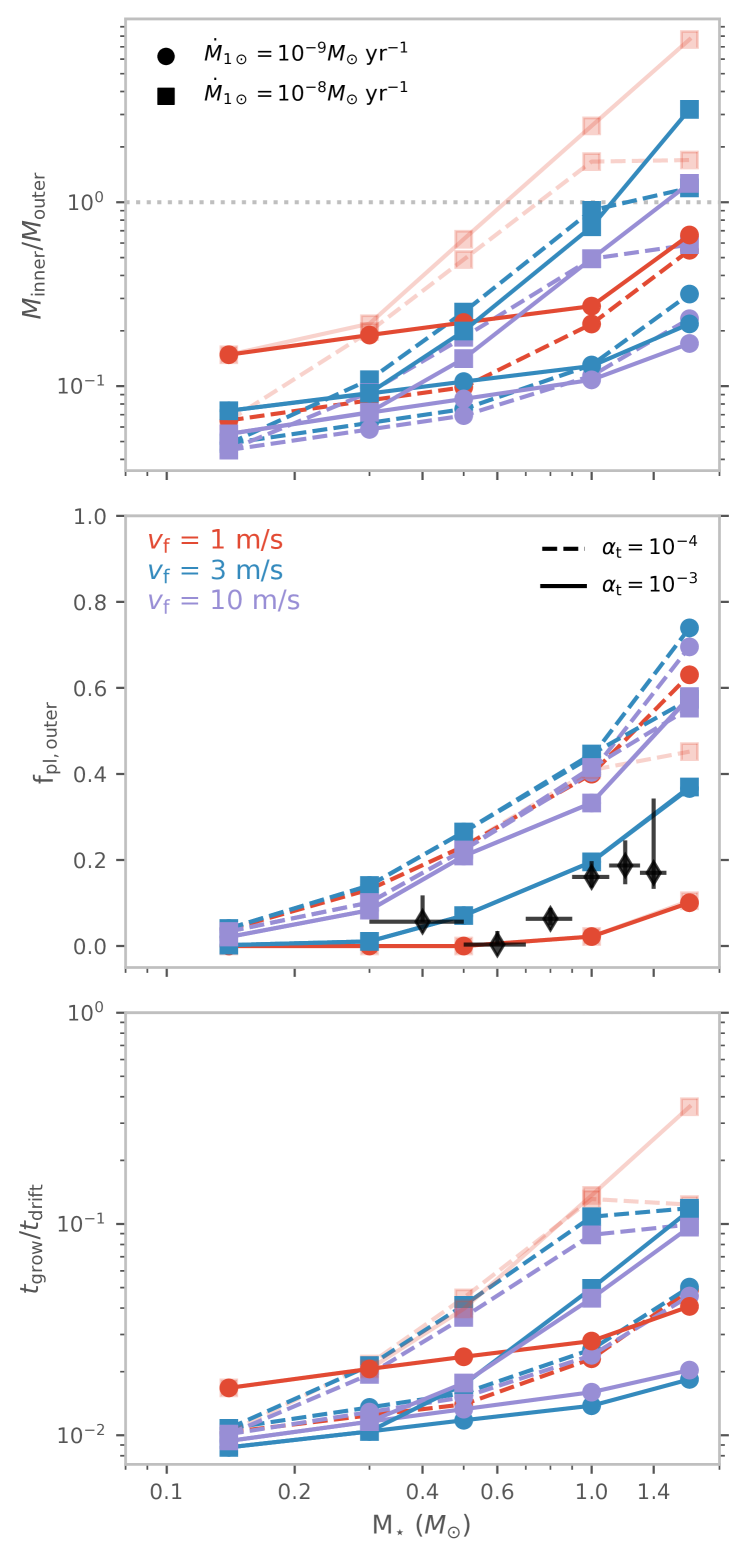
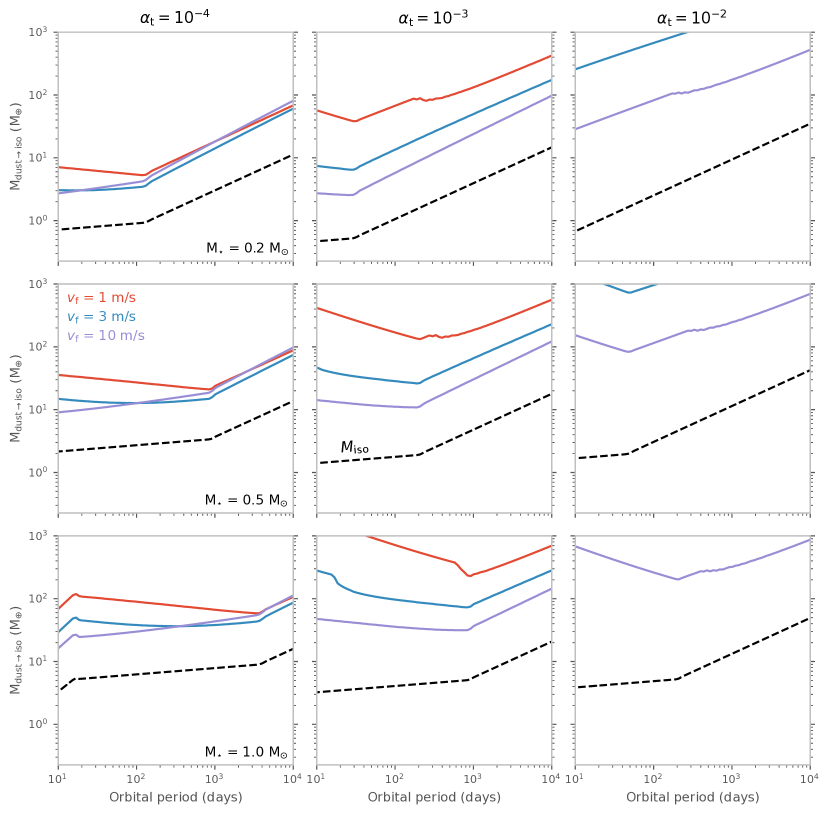
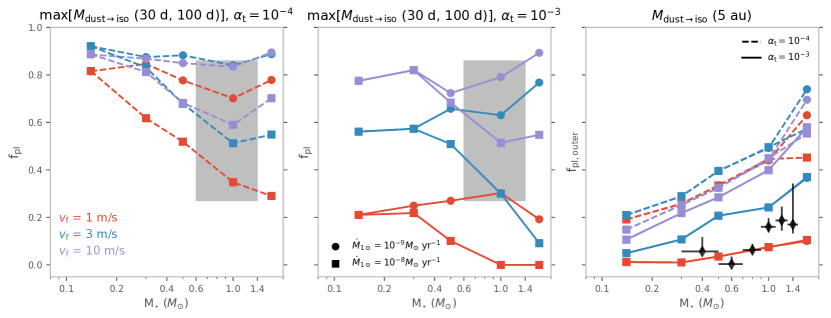
We now compute and the fraction of disks that can create an isolation mass at 5 AU . For our parameters, this isolation mass is always –10 which is large enough to nucleate a gas giant at this distance, with the exact runaway mass subject to local opacity and metal content (e.g., Piso et al., 2015; Lee & Chiang, 2015; Venturini et al., 2015; Chachan et al., 2021). First, we verify that the amount of dust mass required to create this outer core () is larger than that required to create inner cores (, top panel of Figure 5). Since rises with orbital period in irradiated regions (Figure 3), this condition is met by all our models for and by most of them for . When , a disk that has enough dust mass () to create outer giant planet cores will invariably create both inner and outer planets. This is in agreement with the previous results of Lin et al. (2018) and Chachan et al. (2022). The two models for which this is not true for Sun-like stars correspond to pebble accretion happening in the 3D regime in a viscously heated region that is large in extent or for ( & , , m/s; light shade in Figure 5). We note that the formation of outer giant cores at the measured occurrence rate is only feasible for the former of these two models.
Furthermore, we see that rises with (middle panel of Figure 5) in agreement with the observed trends (e.g., Fulton et al., 2021).333We note that our calculation provides the fraction of disks that can form giants whereas Fulton et al. (2021) measures the occurrence rate of giants. While observational measurements of the former are not yet available, the average cold giant multiplicity is estimated to be (Zhu, 2022), suggesting that average systems are expected to harbor single cold giant. It is therefore reasonable to assume that the cold giant planet occurrence rate is not too different from the fraction of stars with cold giant planets. In almost all cases, the accretion is in the 2D, irradiation-dominated regime and although falls with (Equation 26), it is a weak dependence and the distribution of is more top-heavy around more massive stars so that will be larger. Compared to the measured occurrence rate of outer gas giants from Fulton et al. (2021), our tends to be large. We note that we are simply calculating the fraction of disks with enough mass to create an isolation mass by pebble accretion. Accounting for the time required for the completion of pebble accretion and subsequent gas accretion to form planets would likely reduce our given finite disk lifetimes (Mamajek, 2009; Michel et al., 2021) and varying metal content (opacity), thus bringing it into better agreement with the measured occurrence rate of cold Jupiters.
We deduce the effect of filtering by an outer planet proposed by Mulders et al. (2021) by considering the inner disk to be decoupled from the outer disk once the outer planet reaches its isolation mass. Calculating the growth timescale of an inner core () out of the solids that were drifted in (=(5 AU) - (5 AU)) and comparing to the drain out timescale of () at days ( the outer period at which current surveys are sensitive to super-Earths), we find that in all the cases we consider (see bottom panel of Figure 5), suggesting that the inner cores would be formed before all the solids disappear. We verify that filtering is only relevant when is smaller at short orbital periods, and so our result is consistent with the “No Snow Line” curve in Figure 1 of Mulders et al. 2021. While the silicate grains within the iceline are often considered to have lower than the ice-coated grains in the outer orbit (e.g., Pinilla et al., 2016; Drążkowska & Alibert, 2017), recent laboratory and theoretical studies suggest is more uniform (e.g., Musiolik & Wurm, 2019; Kimura et al., 2020).
Considering that both and (top and bottom panels of Figure 5) are lower around lower mass stars, our results suggest that it is easier to form super-Earths interior to cold-giants around lower mass stars. Our calculation therefore predicts that the correlation between the inner super-Earths and outer giants that is observed for FGK stars persists and perhaps even strengthens for M dwarfs.
4 Discussion and Conclusion
By combining the theory of pebble accretion with the measured disk masses, we have demonstrated that the fraction of disks that can create inner planetary cores rises towards lower mass stars down to over a plausible range of and for a typical disk accretion rate of , in agreement with the observed enhancement in the occurrence rate of inner super-Earths around M dwarfs compared to FGK dwarfs (e.g., Dressing & Charbonneau, 2015; Mulders et al., 2015; Hsu et al., 2020). Since core formation by pebble accretion likely happens during the earlier stages of a disk’s lifetime, is a reasonable choice for the accretion rate of a solar mass star. We further showed that disks that have enough mass to create an isolation mass at 5 AU will be able to drift in more than enough solids to the inner disk to create small planets there, explaining the observed correlation between inner super-Earths and outer giants (e.g., Zhu & Wu, 2018; Bryan et al., 2019). Unlike the inner planets, the fraction of disks that can create a large outer planet drops towards lower mass stars, in agreement with the observed reduction of cold Jupiter occurrence rate around cooler stars (e.g., Clanton & Gaudi, 2014; Fulton et al., 2021). Our framework therefore provides a unifying solution that can reconcile all three observations, with a caveat that it is sensitive to the measurements of disk masses. More accurate and complete measurements of disk properties would be welcome to further verify and refine our calculations.
In general, we predict the fraction of disks that can create inner planets up to their isolation masses 1–2 to drop around stars –0.5; it remains possible to create smaller cores. Since this is about the mass below which short-period planets would emerge rocky (Lee & Connors, 2021; Lee et al., 2022), our model expects a fall in the occurrence rate of mini-Neptunes around low mass stars but not necessarily that of terrestrial planets, in line with recent observational evidence (e.g., Brady & Bean, 2022; Ment & Charbonneau, 2023). A caveat to this statement is that we have limited our analysis to pebble accretion which sets the initial mass of planetary cores. A more quantitative verification would require bridging this early stage of core formation to the final mass doubling effected by giant impacts in the late stage of disk evolution (e.g., Lee & Chiang, 2016; Dawson et al., 2016) since how much gas a planet ends up with is primarily determined by its final core mass (e.g., Lee, 2019).
If we consider a warmer giant (3 AU), our framework would expect a weakening of the inner and outer planet correlation as becomes similar between 100 days and 3 AU (and in some cases, the required dust mass to create the inner core can exceed), in qualitative agreement with Rosenthal et al. (2022). A distinct prediction of our calculation is that, as long as colder Juipters exist, their correlation with the inner super-Earths remains and potentially enhances even around M dwarfs.
We close with a comment on the effect of multiple outer giants. In our analysis, we have focused on a single giant, which is consistent with the estimated low average cold giant multiplicity 1.270.12 (Zhu, 2022). The same study reports 8 systems with 2 cold giants; furthermore, our solar system harbors two cold gas giants (Jupiter and Saturn). What is the expected effect of multiple cold giants in the context of our study? Given that the pebble accretion efficiency at the location of these giants is 10%, if , having two giants can inhibit the assembly of isolation mass cores in the inner orbits, at least by pebble accretion. Qualitatively, this is consistent with the isotopic constraints suggesting Earth and Mars are mostly formed out of non-carbonaceous material (i.e., inner disk material) with only a trace amount of carbonaceous chondrites, which would have had to drift in from the outer orbits (e.g., Warren, 2011; Burkhardt et al., 2021). With pebble accretion minimized, the overall growth of planetary cores would also likely slow down, which may help explain why our solar system ended up with only small terrestrial planets rather than super-Earths/mini-Neptunes. In general, depending on , multiple giants can significantly reduce the amount of solid that drift into the inner disk and limit the growth of planetary cores there. So under the framework presented here, we would expect a weakening correlation between multiple cold Jupiters and inner super-Earths/mini-Neptunes. Verifying this preliminary hypothesis by quantifying the effect of cold giant multiplicity is a subject of future work.
acknowledgments
We thank the referee for a speedy and careful report that helped improve our paper. We also thank Madison Brady, Marta Bryan, Eugene Chiang, Paul Dalba, Rebekah Dawson, Beibei Liu, Max Moe, and Gijs Mulders for useful discussions and giving comments on an earlier version of this paper. E.J.L thanks Joanna Drążkowska and Francis Nimmo for useful exchanges on pebble trapping and solar system formation at the 2023 Gordon Research Conference.
Y.C. acknowledges support from the Natural Sciences and Engineering Research Council of Canada (NSERC) through the CITA National Fellowship and the Trottier Space Institute through the TSI Fellowship. E.J.L. gratefully acknowledges support by NSERC, by le Fonds de recherche du Québec – Nature et technologies (FRQNT), by the Trottier Space Institute, and by the William Dawson Scholarship from McGill University.
Appendix A Disk mass CDF
Since we need both disk dust mass and stellar mass for our study, we use Class II disk dust masses compiled by Manara et al. (2022) from measurements of disk masses in different star forming regions from the literature. These disk masses are estimated from ALMA observations assuming that the emission is optically thin, the dust opacity is given by GHz) cm2/g, and a single dust temperature of 20 K. We refer the reader to Manara et al. (2022) for more details. We limit our sample to systems that have both measured disk masses (excluding upper limits) and stellar masses, which gives a sample size of 402.
Since Class II disks are known to already have undergone significant dust evolution and to contain too little mass to form the observed planetary systems (Najita & Kenyon, 2014), we must look to disks at earlier stages in their evolution to obtain a better estimate of the initial dust mass. To do so, we turn to disk dust masses measured for Class I disks in the Orion molecular clouds using VLA (Tobin et al., 2020). The assumption of optically thin emission for calculating disk dust mass is more accurate at longer wavelengths and therefore VLA measurements provide better mass estimates. Restricting our sample to disks that are classified as Class I, have measured disk masses and protostellar luminosities, we end up with a sample size of 58.
However, due to the more limited sensitivity of the VLA observations, their detection limit corresponds to for a star. The shape of the disk mass CDFs for the Class I VLA sample and the Class I ALMA sample therefore cannot be matched through a constant scaling factor as the ALMA sample contains many low mass disks and therefore is significantly more bottom-heavy. Both samples can only be compared for the highest mass disks, where the two samples are more likely to be complete. Therefore, to estimate the multiplicative factor by which we should scale up the Class II disk masses from Manara et al. (2022), we match the (99.7th percentile) values of the disk masses from the two surveys, which gives a factor of . Our result is in agreement with Tychoniec et al. (2020), who found that Class I disks are at least 3 times more massive than Class II disks in various star forming regions.
We have implicitly assumed that the scaling factor for disk masses between the Class I and II stages is the same for the entire range of stellar masses. However, if the relation steepens with time (there is some evidence for this, see Pascucci et al., 2016; Ansdell et al., 2017; Manara et al., 2022), then the multiplicative factor ought to be larger for small . Since Class I disks are enshrouded by protostellar envelopes that contribute to the total luminosities, is typically not known for Class I disks (which is why we use Class II disks to calculate our CDFs). We can crudely relate protostellar luminosities to stellar masses and apply a -dependent multiplicative factor to gauge the effect on our results.
Linear regression on the Class I VLA data from Tobin et al. (2020) yields . If is primarily set by the pre-main sequence protostar’s luminosity (i.e. , as assumed in § 2), then . If is set by accretion luminosity instead, the two limiting power law indices for the relation are (see Dunham et al. 2014 for a review): i) for isothermal core collapse (, Shu 1977) and as for a pre-main sequence star (the radius-mass scaling here is derived assuming a fully convective star), and ii) for competitive accretion (, is the instantaneous mass and is the final mass of the protostar, Bonnell et al. 2001; McKee & Offner 2010) and for if is the size of the protostellar core and assumed independent of . These two limiting cases yield and , both of which are significantly shallower than the relation we get for the Manara et al. (2022) sample. Figure A.1 shows the effect of scaling disk mass in different stellar bins by , where or and correspond to the power law indices characterizing relation for the Tobin et al. (2020) and Manara et al. (2022) samples respectively and is the mid-point of the stellar mass bin. The overall effect is to boost for lower mass stars such that super-Earth occurrence rate rises even more sharply with decreasing . The fraction of disks that form a giant planet core at 5 au still rises with , albeit more gradually. However, the turnover in for is no longer present. Regardless, the sub-Earth isolation mass of cores in the inner disk around the lowest mass stars is small and may not grow into planets detectable as mini-Neptunes. Verifying this statement would require simulating orbital instabilities of systems of these isolation masses, which is a subject of future work.
References
- Ansdell et al. (2017) Ansdell, M., Williams, J. P., Manara, C. F., et al. 2017, AJ, 153, 240, doi: 10.3847/1538-3881/aa69c0
- Best et al. (2023) Best, S., Sefilian, A. A., & Petrovich, C. 2023, arXiv e-prints, arXiv:2304.02045, doi: 10.48550/arXiv.2304.02045
- Birnstiel et al. (2011) Birnstiel, T., Ormel, C. W., & Dullemond, C. P. 2011, A&A, 525, A11, doi: 10.1051/0004-6361/201015228
- Bitsch et al. (2018) Bitsch, B., Morbidelli, A., Johansen, A., et al. 2018, A&A, 612, A30, doi: 10.1051/0004-6361/201731931
- Bonnell et al. (2001) Bonnell, I. A., Bate, M. R., Clarke, C. J., & Pringle, J. E. 2001, MNRAS, 323, 785, doi: 10.1046/j.1365-8711.2001.04270.x
- Bonomo et al. (2023) Bonomo, A. S., Dumusque, X., Massa, A., et al. 2023, arXiv e-prints, arXiv:2304.05773, doi: 10.48550/arXiv.2304.05773
- Brady & Bean (2022) Brady, M. T., & Bean, J. L. 2022, AJ, 163, 255, doi: 10.3847/1538-3881/ac64a0
- Bryan et al. (2019) Bryan, M. L., Knutson, H. A., Lee, E. J., et al. 2019, AJ, 157, 52, doi: 10.3847/1538-3881/aaf57f
- Burkhardt et al. (2021) Burkhardt, C., Spitzer, F., Morbidelli, A., et al. 2021, Science Advances, 7, eabj7601, doi: 10.1126/sciadv.abj7601
- Chachan et al. (2021) Chachan, Y., Lee, E. J., & Knutson, H. A. 2021, ApJ, 919, 63, doi: 10.3847/1538-4357/ac0bb6
- Chachan et al. (2022) Chachan, Y., Dalba, P. A., Knutson, H. A., et al. 2022, ApJ, 926, 62, doi: 10.3847/1538-4357/ac3ed6
- Choi et al. (2016) Choi, J., Dotter, A., Conroy, C., et al. 2016, ApJ, 823, 102, doi: 10.3847/0004-637X/823/2/102
- Clanton & Gaudi (2014) Clanton, C., & Gaudi, B. S. 2014, ApJ, 791, 91, doi: 10.1088/0004-637X/791/2/91
- D’Alessio et al. (1998) D’Alessio, P., Cantö, J., Calvet, N., & Lizano, S. 1998, ApJ, 500, 411, doi: 10.1086/305702
- Dawson et al. (2016) Dawson, R. I., Lee, E. J., & Chiang, E. 2016, ApJ, 822, 54, doi: 10.3847/0004-637X/822/1/54
- Dotter (2016) Dotter, A. 2016, ApJS, 222, 8, doi: 10.3847/0067-0049/222/1/8
- Dressing & Charbonneau (2015) Dressing, C. D., & Charbonneau, D. 2015, ApJ, 807, 45, doi: 10.1088/0004-637X/807/1/45
- Drążkowska & Alibert (2017) Drążkowska, J., & Alibert, Y. 2017, A&A, 608, A92, doi: 10.1051/0004-6361/201731491
- Dunham et al. (2014) Dunham, M. M., Stutz, A. M., Allen, L. E., et al. 2014, in Protostars and Planets VI, ed. H. Beuther, R. S. Klessen, C. P. Dullemond, & T. Henning, 195–218, doi: 10.2458/azu_uapress_9780816531240-ch009
- Fulton et al. (2021) Fulton, B. J., Rosenthal, L. J., Hirsch, L. A., et al. 2021, ApJS, 255, 14, doi: 10.3847/1538-4365/abfcc1
- Gaidos et al. (2016) Gaidos, E., Mann, A. W., Kraus, A. L., & Ireland, M. 2016, MNRAS, 457, 2877, doi: 10.1093/mnras/stw097
- Garaud & Lin (2007) Garaud, P., & Lin, D. N. C. 2007, ApJ, 654, 606, doi: 10.1086/509041
- Hartmann et al. (1998) Hartmann, L., Calvet, N., Gullbring, E., & D’Alessio, P. 1998, ApJ, 495, 385, doi: 10.1086/305277
- Herman et al. (2019) Herman, M. K., Zhu, W., & Wu, Y. 2019, AJ, 157, 248, doi: 10.3847/1538-3881/ab1f70
- Hsu et al. (2020) Hsu, D. C., Ford, E. B., & Terrien, R. 2020, MNRAS, 498, 2249, doi: 10.1093/mnras/staa2391
- Ida et al. (2016) Ida, S., Guillot, T., & Morbidelli, A. 2016, A&A, 591, A72, doi: 10.1051/0004-6361/201628099
- Johansen & Lambrechts (2017) Johansen, A., & Lambrechts, M. 2017, Annual Review of Earth and Planetary Sciences, 45, 359, doi: 10.1146/annurev-earth-063016-020226
- Kimura et al. (2020) Kimura, H., Wada, K., Kobayashi, H., et al. 2020, MNRAS, 498, 1801, doi: 10.1093/mnras/staa2467
- Lambrechts et al. (2014) Lambrechts, M., Johansen, A., & Morbidelli, A. 2014, A&A, 572, A35, doi: 10.1051/0004-6361/201423814
- Lambrechts et al. (2019) Lambrechts, M., Morbidelli, A., Jacobson, S. A., et al. 2019, A&A, 627, A83, doi: 10.1051/0004-6361/201834229
- Lee (2019) Lee, E. J. 2019, ApJ, 878, 36, doi: 10.3847/1538-4357/ab1b40
- Lee & Chiang (2015) Lee, E. J., & Chiang, E. 2015, ApJ, 811, 41, doi: 10.1088/0004-637X/811/1/41
- Lee & Chiang (2016) —. 2016, ApJ, 817, 90, doi: 10.3847/0004-637X/817/2/90
- Lee & Connors (2021) Lee, E. J., & Connors, N. J. 2021, ApJ, 908, 32, doi: 10.3847/1538-4357/abd6c7
- Lee et al. (2022) Lee, E. J., Karalis, A., & Thorngren, D. P. 2022, ApJ, 941, 186, doi: 10.3847/1538-4357/ac9c66
- Lin et al. (2018) Lin, J. W., Lee, E. J., & Chiang, E. 2018, MNRAS, 480, 4338, doi: 10.1093/mnras/sty2159
- Liu et al. (2020) Liu, B., Lambrechts, M., Johansen, A., Pascucci, I., & Henning, T. 2020, A&A, 638, A88, doi: 10.1051/0004-6361/202037720
- Lynden-Bell & Pringle (1974) Lynden-Bell, D., & Pringle, J. E. 1974, MNRAS, 168, 603, doi: 10.1093/mnras/168.3.603
- Mamajek (2009) Mamajek, E. E. 2009, in American Institute of Physics Conference Series, Vol. 1158, Exoplanets and Disks: Their Formation and Diversity, ed. T. Usuda, M. Tamura, & M. Ishii, 3–10, doi: 10.1063/1.3215910
- Manara et al. (2022) Manara, C. F., Ansdell, M., Rosotti, G. P., et al. 2022, arXiv e-prints, arXiv:2203.09930, doi: 10.48550/arXiv.2203.09930
- Manara et al. (2018) Manara, C. F., Morbidelli, A., & Guillot, T. 2018, A&A, 618, L3, doi: 10.1051/0004-6361/201834076
- McKee & Offner (2010) McKee, C. F., & Offner, S. S. R. 2010, ApJ, 716, 167, doi: 10.1088/0004-637X/716/1/167
- Ment & Charbonneau (2023) Ment, K., & Charbonneau, D. 2023, arXiv e-prints, arXiv:2302.04242, doi: 10.48550/arXiv.2302.04242
- Michel et al. (2021) Michel, A., van der Marel, N., & Matthews, B. C. 2021, ApJ, 921, 72, doi: 10.3847/1538-4357/ac1bbb
- Moe & Kratter (2021) Moe, M., & Kratter, K. M. 2021, MNRAS, 507, 3593, doi: 10.1093/mnras/stab2328
- Mulders et al. (2021) Mulders, G. D., Drążkowska, J., van der Marel, N., Ciesla, F. J., & Pascucci, I. 2021, ApJ, 920, L1, doi: 10.3847/2041-8213/ac2947
- Mulders et al. (2015) Mulders, G. D., Pascucci, I., & Apai, D. 2015, ApJ, 798, 112, doi: 10.1088/0004-637X/798/2/112
- Musiolik & Wurm (2019) Musiolik, G., & Wurm, G. 2019, ApJ, 873, 58, doi: 10.3847/1538-4357/ab0428
- Najita & Kenyon (2014) Najita, J. R., & Kenyon, S. J. 2014, MNRAS, 445, 3315, doi: 10.1093/mnras/stu1994
- Nakagawa et al. (1986) Nakagawa, Y., Sekiya, M., & Hayashi, C. 1986, Icarus, 67, 375, doi: 10.1016/0019-1035(86)90121-1
- Nielsen et al. (2019) Nielsen, E. L., De Rosa, R. J., Macintosh, B., et al. 2019, AJ, 158, 13, doi: 10.3847/1538-3881/ab16e9
- Oka et al. (2011) Oka, A., Nakamoto, T., & Ida, S. 2011, ApJ, 738, 141, doi: 10.1088/0004-637X/738/2/141
- Ormel (2017) Ormel, C. W. 2017, in Astrophysics and Space Science Library, Vol. 445, Formation, Evolution, and Dynamics of Young Solar Systems, ed. M. Pessah & O. Gressel, 197, doi: 10.1007/978-3-319-60609-5_7
- Ormel & Klahr (2010) Ormel, C. W., & Klahr, H. H. 2010, A&A, 520, A43, doi: 10.1051/0004-6361/201014903
- Ormel & Liu (2018) Ormel, C. W., & Liu, B. 2018, A&A, 615, A178, doi: 10.1051/0004-6361/201732562
- Pascucci et al. (2016) Pascucci, I., Testi, L., Herczeg, G. J., et al. 2016, ApJ, 831, 125, doi: 10.3847/0004-637X/831/2/125
- Perets & Murray-Clay (2011) Perets, H. B., & Murray-Clay, R. A. 2011, ApJ, 733, 56, doi: 10.1088/0004-637X/733/1/56
- Pinilla et al. (2016) Pinilla, P., Klarmann, L., Birnstiel, T., et al. 2016, A&A, 585, A35, doi: 10.1051/0004-6361/201527131
- Piso et al. (2015) Piso, A.-M. A., Youdin, A. N., & Murray-Clay, R. A. 2015, ApJ, 800, 82, doi: 10.1088/0004-637X/800/2/82
- Raghavan et al. (2010) Raghavan, D., McAlister, H. A., Henry, T. J., et al. 2010, ApJS, 190, 1, doi: 10.1088/0067-0049/190/1/1
- Rosenthal et al. (2022) Rosenthal, L. J., Knutson, H. A., Chachan, Y., et al. 2022, ApJS, 262, 1, doi: 10.3847/1538-4365/ac7230
- Shu (1977) Shu, F. H. 1977, ApJ, 214, 488, doi: 10.1086/155274
- Tobin et al. (2020) Tobin, J. J., Sheehan, P. D., Megeath, S. T., et al. 2020, ApJ, 890, 130, doi: 10.3847/1538-4357/ab6f64
- Tychoniec et al. (2020) Tychoniec, Ł., Manara, C. F., Rosotti, G. P., et al. 2020, A&A, 640, A19, doi: 10.1051/0004-6361/202037851
- Van Zandt et al. (2023) Van Zandt, J., Petigura, E. A., MacDougall, M., et al. 2023, AJ, 165, 60, doi: 10.3847/1538-3881/aca6ef
- Venturini et al. (2015) Venturini, J., Alibert, Y., Benz, W., & Ikoma, M. 2015, A&A, 576, A114, doi: 10.1051/0004-6361/201424008
- Warren (2011) Warren, P. H. 2011, Earth and Planetary Science Letters, 311, 93, doi: 10.1016/j.epsl.2011.08.047
- Yang et al. (2020) Yang, J.-Y., Xie, J.-W., & Zhou, J.-L. 2020, AJ, 159, 164, doi: 10.3847/1538-3881/ab7373
- Zhu (2022) Zhu, W. 2022, AJ, 164, 5, doi: 10.3847/1538-3881/ac6f59
- Zhu et al. (2018) Zhu, W., Petrovich, C., Wu, Y., Dong, S., & Xie, J. 2018, ApJ, 860, 101, doi: 10.3847/1538-4357/aac6d5
- Zhu & Wu (2018) Zhu, W., & Wu, Y. 2018, AJ, 156, 92, doi: 10.3847/1538-3881/aad22a