The role of microscopic friction in statistics and scaling laws of avalanches
Abstract
We investigate statistics and scaling laws of avalanches in two-dimensional frictional particles by numerical simulations. We find that the critical exponent for avalanche size distributions is governed by microscopic friction between the particles in contact, where the exponent is larger and closer to mean-field predictions if the friction coefficient is finite. We reveal that microscopic “slips” between frictional particles induce numerous small avalanches which increase the slope, as well as the power-law exponent, of avalanche size distributions. We also analyze statistics and scaling laws of the avalanche duration and maximum stress drop rates, and examine power spectra of stress drop rates. Our numerical results suggest that the microscopic friction is a key ingredient of mean-field descriptions and plays a crucial role in avalanches observed in real materials.
I Introduction
Amorphous solids, e.g. granular materials and glasses, are ubiquitous in nature and understanding of their mechanical properties is crucial to engineering science Lemaitre and Chaboche (1990). When amorphous solids are continuously sheared, one observes that the system reaches a steady state after the yielding Richard et al. (2020); Ozawa et al. (2020); Singh et al. (2020a); Ozawa et al. (2018), where the increase of stress is (suddenly) truncated by a plastic event such that the stress fluctuates around its mean value. Such a plastic or stress drop event is often called avalanche in the literature Uhl et al. (2015); Nicolas et al. (2018) and its statistical properties have been widely investigated in the context of non-equilibrium phase transition Henkel et al. (2008) such as the self-organized criticality Nagel (1992).
Among many theoretical studies, conventional mean field (MF) descriptions have well explained statistics of avalanches in amorphous solids Fisher et al. (1997); Sethna et al. (2001); Dahmen et al. (2009, 2011). These MF approaches are based on the analogy between avalanche and the depinning transition of elastic faults in heterogeneous media, where interactions between dislocation pairs are considered as long-ranged Fisher et al. (1997); Sethna et al. (2001); Dahmen et al. (2009, 2011). Strikingly, power-law distributions of the size of avalanche, i.e. , are predicted by the MF theories, where the MF prediction, , is confirmed in a broad range of materials, from nanocrystals to earthquakes Friedman et al. (2012); Denisov et al. (2015); Uhl et al. (2015); Geller et al. (2015); Murphy et al. (2019). The MF theories also predict power-law distributions of avalanche duration (i.e. life time of a stress drop event) as , where the theoretical prediction is observed in experiments Sheikh et al. (2016). In addition, the scaling of power spectra of stress drop rates is described as in the MF theories, which is well reproduced by the experiments of bulk metallic glasses Antonaglia et al. (2014) and astrophysical objects Sheikh et al. (2016). Furthermore, scaling laws of the avalanche size , avalanche duration , and maximum stress drop rate are given by and in the MF descriptions, where both well agree with experimental results Sheikh et al. (2016); Antonaglia et al. (2014); Long et al. (2019).
On the other hand, the power-law exponent evaluated by numerical simulations tends to be smaller than the MF prediction (). For instance, an extremely small value for distributions of potential energy drop, i.e. with , was found in molecular dynamics (MD) simulations of two-dimensional foam under shear Durian (1997); Tewari et al. (1999). In addition, for avalanche size distributions was reported by athermal quasi-static (AQS) simulations of two-dimensional soft particles, where interactions between the particles in contact are modeled by a harmonic potential Heussinger et al. (2010). Moreover, the exponent seems to be sensitive to particle properties: Two exponents, and , for are obtained from different types of the Lennard-Jones potentials Zhang et al. (2017), while it can be controlled in the range by the effect of particle inertia Salerno et al. (2012); Salerno and Robbins (2013). These numerical results indicate that the concept of universality class of avalanches Uhl et al. (2015) is violated in the sense that the critical exponent depends on microscopic details.
In addition to the atomistic (MD and AQS) simulations, mesoscopic elastoplastic (EP) models Nicolas et al. (2018) predict the exponent in the range depending on the spatial dimensions Karimi et al. (2017); Talamali et al. (2011); Liu et al. (2016); Lin et al. (2014, 2015); Ferrero and Jagla (2019a, b). Different from the conventional MF approaches, the EP models employ an anisotropic propagator in the governing equation of local stress, where the propagator is long-ranged and obeys quadrupolar symmetry in the shear plane (as Eshelby’s inclusion) Nicolas et al. (2018). Then, on the basis of the analogy between avalanche and the yielding transition, Lin et al. suggested scaling relations, where the exponent is given by the spatial dimension , fractal dimension , and power-law exponent for distributions of local distance to yield stress Lin et al. (2014, 2015). Note that the recent study of discrete dislocation dynamics also pointed out dissimilarities between the MF descriptions (i.e. the analogy to the depinning) and avalanches Ispánovity et al. (2014). Furthermore, recent experiments and simulations of two-dimensional granular materials reported similar power-law distributions of avalanche energy, i.e. and , respectively Barés et al. (2017).
Because of the discrepancy in the MF theories, experiments, atomistic simulations, and mesoscopic models, many factors, e.g. system sizes Zhang et al. (2017); Karmakar et al. (2010a); Lerner et al. (2014), driving rates Liu et al. (2016), and temperature Hentschel et al. (2010); Karmakar et al. (2010b), have been examined by numerical studies of avalanches. However, much less attention has been paid to the effect of microscopic friction, i.e. the dynamical or Coulomb friction between the particles in contact Luding (2005). The microscopic friction is intrinsic to amorphous solids in nature, e.g. granular materials, and thus it is important to clarify how the microscopic friction affects the statistics of avalanches (especially the exponent ) and scaling laws.
In this paper, we numerically investigate statistics and scaling laws of avalanches in two-dimensional frictional particles. By using the frictional contact model Luding (2005), we implement the microscopic friction into MD simulations. We find that the statistics and scaling laws approach the MF predictions if the friction coefficient is finite. Interestingly, the exponent is well described by the scaling relations proposed by Lin et al. Lin et al. (2014, 2015) if the microscopic friction is absent, i.e. if the system is frictionless. However, they do not hold in frictional systems. We show that the drop of tangential stress contributes to the population of small avalanches, which eventually increases the exponent in frictional systems.
II Methods
We study two-dimensional soft athermal particles by MD simulations. To avoid crystallization, we use binary mixtures of particles, where different kinds of particles have the same mass and different diameters (their ratio is ) Saitoh et al. (2019a). The force between the particles in contact is divided into normal and tangential directions Luding (2005): The normal force is modeled by a linear spring-dashpot, where the spring constant and viscosity coefficient are given by and , respectively. The tangential force is also described by the linear spring-dashpot with the same spring constant and viscosity coefficient, i.e. and , respectively. However, it switches to dynamical friction with the friction coefficient if it exceeds a threshold, i.e. if . We adjust the spring constant and viscosity coefficient as the normal restitution coefficient is given by Luding (2005). In addition, we introduce a time unit as .
We randomly distribute the particles in an square periodic box, where the area fraction of the particles is given by . We then apply simple shear deformations to the system under the Lees-Edwards boundary condition Lees and Edwards (1972). In each time step, every particle position is replaced with () and equations of translational and rotational motions are numerically integrated with a small time increment Vågberg et al. (2017). Here, we use for the strain increment.
In the following analyses, we control the parameters, and , and scale every mass, time, and length by , , and the mean particle diameter , respectively. In addition, we only analyze the data in a steady state, where the amount of shear strain exceeds unity .
III Results
In this section, we show our numerical results of stress-strain curves (Sec. III.1) and explain stress drop events (Sec. III.2). We examine the MF predictions of statistics of avalanches (Sec. III.3) and scaling laws of avalanches (Sec. III.4) with the focus on the influence of microscopic friction. Then, we discuss the system size dependence of our results and explain the characteristic exponent for avalanche size distributions (Sec. III.5).
III.1 Stress fluctuations
We measure mechanical responses of the system to the applied strain by the shear stress . Neglecting kinetic contributions to the stress, we calculate the stress tensor according to (), where is the -component of the force between the particles ( and ) in contact and is the -component of the relative position between them. The shear stress is defined as the average of the off-diagonal elements, i.e. . Note that the -component of the force consists of the normal and tangential forces, i.e. and (see Sec. II). Accordingly, the shear stress can be decomposed into two parts as
| (1) |
where and are the normal and tangential parts of the shear stress, respectively 111The stress tensor is decomposed as , where () is the -component of normal (tangential) unit vector. The average of the off-diagonal elements of the first term (on the right-hand-side) is , whereas that of the second term is .. If the system is frictionless (), we find and , whereas in frictional systems (). Because the tangential force does not exceed the threshold , is smaller than as long as , where we confirmed that the mean values in a steady state satisfy the following relation,
| (2) |
To study statistics of avalanches, we carefully look at fluctuations of the stress, i.e. , , and , in a steady state. Figure 1(a) displays the scaled fluctuations,
| (3) | |||||
| (4) | |||||
| (5) |
as functions of the strain in the range . The shape of is quite similar with that of , while the tangential part fluctuates almost independently of the others. As can be seen in a scatter plot of and (Fig. 1(b)), the normal part is strongly correlated with the total shear stress. On the other hand, and are uncorrelated (Fig. 1(c)) such that and are almost independent of each other.
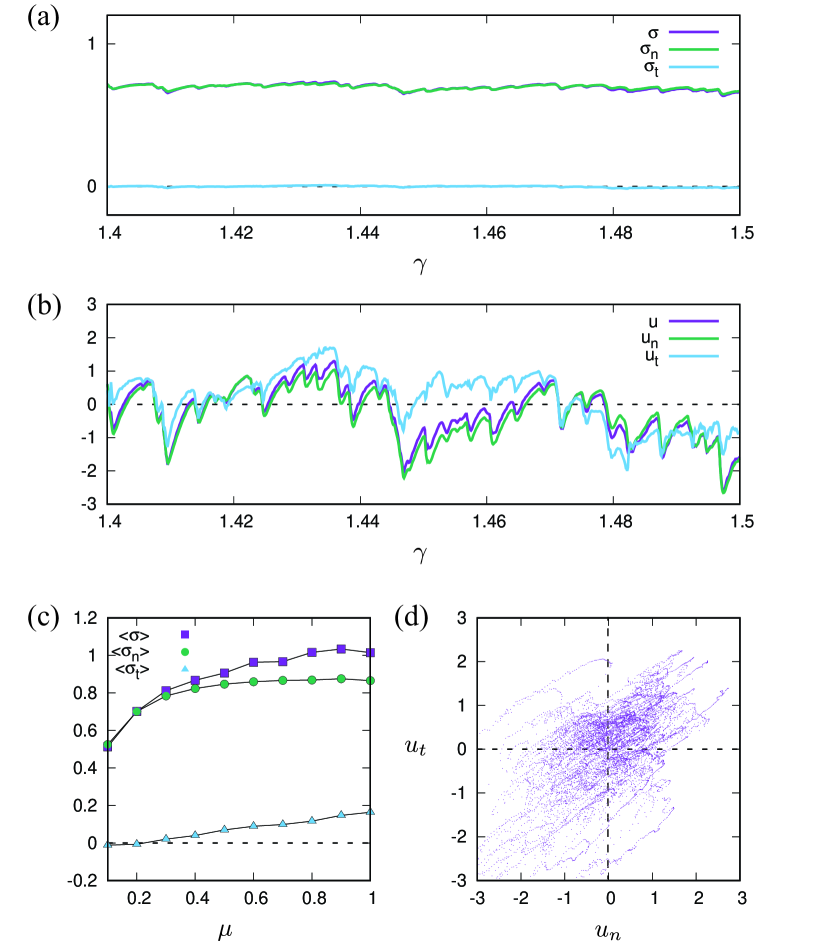
III.2 Stress drop events
As shown in Fig. 1(a), the stress in a steady state fluctuates around its mean value such that numerous stress drop events, or avalanches, can be observed. To quantify such stress drop events, we calculate a stress drop amplitude as , where the shear stress starts decreasing at the strain and stops decreasing at Hatano et al. (2014). Here, is the so-called avalanche duration Dahmen et al. (2009); Long et al. (2019); Sheikh et al. (2016) and the avalanche size is introduced as an extensive quantity, , as usual Salerno et al. (2012); Salerno and Robbins (2013); Karimi et al. (2017); Liu et al. (2016).
The avalanche duration is also defined such that the stress drop rate is negative, i.e. , in the strain range between and Hatano et al. (2014). Therefore, we can extract the maximum stress drop rate during an avalanche Long et al. (2019); Antonaglia et al. (2014) as
| (6) |
We also introduce the avalanche interval such that the stress drop rate is positive, i.e. , in the strain interval between and .
III.3 Statistics of avalanches
To clarify the effects of microscopic friction on statistics of avalanches, we examine the MF predictions of avalanche size distributions (Sec. III.3.1), distributions of the avalanche duration (Sec. III.3.2), and power spectra of stress drop rates (Sec. III.3.3).
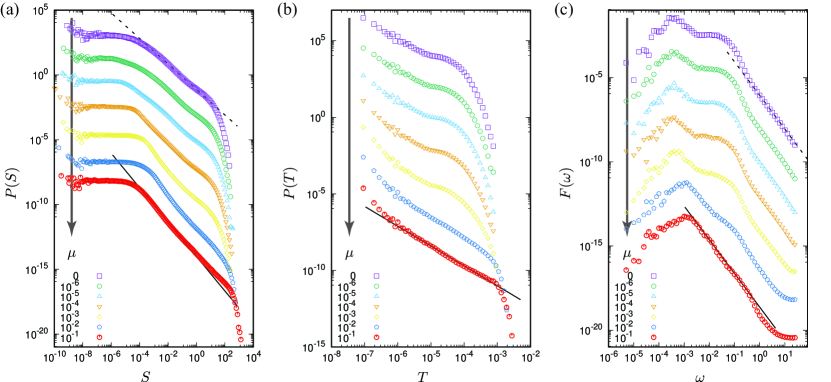
III.3.1 Avalanche size distributions
First, we analyze statistics of avalanche sizes . Figure 2(a) displays probability distribution functions (PDFs) of avalanche sizes, or avalanche size distributions, , where the friction coefficient increases as indicated by the arrow (and listed in the legend). If the avalanche size is not too small (), the avalanche size distributions exhibit the power-law decay,
| (7) |
with the exponent . The power law (Eq. (7)) is followed by a “bump” in large avalanche sizes () due to the particle inertia as reported in Refs. Salerno et al. (2012); Salerno and Robbins (2013); Karimi et al. (2017). Therefore, the scaling regime Sheikh et al. (2016), where the avalanche size distributions exhibit the power law, is in the range in our MD simulations.
The exponent has been extensively studied by the theories Dahmen et al. (2009, 2011); Sethna et al. (2001); Fisher et al. (1997); Dahmen et al. (1998), experiments Long et al. (2019); Sheikh et al. (2016); Antonaglia et al. (2014); Friedman et al. (2012); Denisov et al. (2015), and numerical simulations Durian (1997); Tewari et al. (1999); Heussinger et al. (2010); Zhang et al. (2017); Salerno et al. (2012); Salerno and Robbins (2013); Nicolas et al. (2018) (as reviewed in Sec. I). Here, we estimate by fitting the power law (Eq. (7)) to the data of in the scaling regime, . We find that (dotted line) for frictionless particles (), while (solid line) for the frictional system with . The exponent for the frictionless system agrees with the previous result of soft athermal particles under shear Heussinger et al. (2010). On the other hand, that for the frictional particles is much closer to the MF prediction, i.e. Dahmen et al. (2009, 2011); Fisher et al. (1997); Sheikh et al. (2016); Antonaglia et al. (2014); Friedman et al. (2012); Denisov et al. (2015), and results of EP models, i.e. Lin et al. (2014, 2015). Increasing the friction coefficient from to , we observe that the avalanche size distribution develops a “plateau” in small avalanches, (Fig. 2(a)). Meanwhile, the exponent exhibits a transition from to . Therefore, the microscopic friction strongly affects the statistics of avalanche sizes and seems to play an important role in the MF approach to avalanches Uhl et al. (2015).
III.3.2 Distributions of the avalanche duration
Next, we examine statistics of the avalanche duration . The MF theory predicts that PDFs of the avalanche duration show the power-law decay,
| (8) |
with the exponent Dahmen et al. (2009); Sheikh et al. (2016). Figure 2(b) displays our numerical results of the PDFs, where we increase the friction coefficient as indicated by the arrow (and listed in the legend). In this figure, we can hardly see the power-law behavior of in frictionless particles (). However, increasing , we observe that the PDFs change their shapes and exhibit the power law (solid line) in the case of . We estimate the exponent as by fitting the power law (Eq. (8)) to the data of in the scaling regime, . Note that our exponent, , is smaller than the MF prediction, Dahmen et al. (2009); Sheikh et al. (2016). In addition, the power law (Eq. (8)) is followed by a bump in the large avalanche duration () as in the case of avalanche size distributions (Fig. 2(a)).
III.3.3 Power spectra of stress drop rates
We also examine the power spectrum of stress drop rate , where with the frequency is the Fourier transform of the stress drop rate in a steady state Aharonov and Sparks (1999). Figure 2(c) shows our numerical results of the power spectra, where both the dashed and solid lines represent the MF prediction, i.e.
| (9) |
with the exponent Dahmen et al. (2009, 2011); Sheikh et al. (2016); Antonaglia et al. (2014). Increasing the friction coefficient (as indicated by the arrow and listed in the legend), we observe that the lower bound of the power law (Eq. (9)), i.e. the corner frequency Savage (1972), decreases. For instance, the power-law decay begins around () if (). Therefore, the scaling regime for Eq. (9) shifts to lower frequencies in frictional particles.
III.4 Scaling laws of avalanches
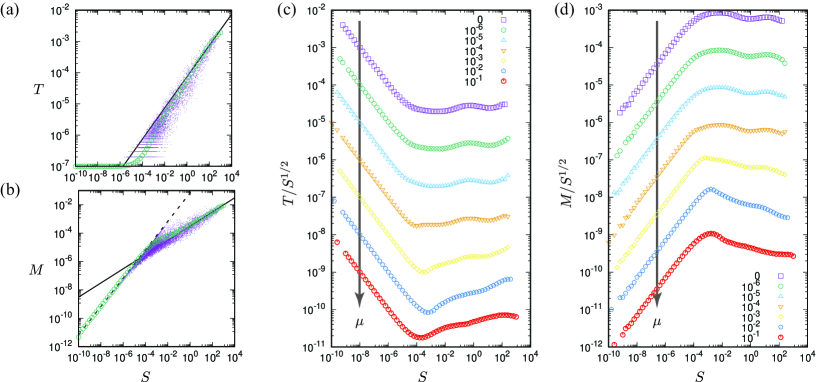
The MF theory also predicts that both the avalanche duration and maximum stress drop rate scale as the square root of the avalanche size , i.e.
| (10) | |||||
| (11) |
The MF predictions (Eqs. (10) and (11)) were confirmed by experiments of bulk metallic glasses and granular materials Long et al. (2019). We also examine Eqs. (10) and (11) with the focus on the influence of microscopic friction. In Figs. 3(a) and (b), we test the scaling laws of and , respectively, for the case of frictional system with . Here, the data of , , and are taken from stress drop events in a steady state and the symbols (circles) are the averages of (a) and (b) in each bin of . The solid lines represent the scaling laws, Eqs. (10) and (11), which well describe our numerical results in the scaling regime, . In Fig. 3(a), the lower bound of the avalanche duration is given by the strain increment, i.e. . If the avalanche duration equals , the maximum stress drop rate is given by (see Eq. (6)) so that is linear in the avalanche size . Therefore, the maximum stress drop rates for small avalanches are bounded by the linear scaling, (dashed line in Fig. 3(b)).
To examine the influence of microscopic friction on the scaling laws (Eqs. (10) and (11)), we plot the ratios, and , i.e. shape indexes Long et al. (2019), in Figs. 3(c) and (d), respectively. In these figures, we vary the friction coefficient from to as indicated by the arrow (and listed in the legend). The ratios are almost flat in the scaling regime () regardless of so that the scaling laws are quite insensitive to the microscopic friction. However, () exhibits a “dip” (“peak”) around when increases. Therefore, the scaling law overestimates (underestimates) () in frictional systems outside of the scaling regime, .
III.5 System size dependence and the exponent for avalanche size distributions
As shown in the previous sections, the most striking difference between frictionless () and frictional () systems is the exponent for the avalanche size distributions . To clarify the origin of this difference, we study the system size dependence of avalanches in frictionless (Sec. III.5.1) and frictional particles (III.5.2).
III.5.1 Frictionless particles
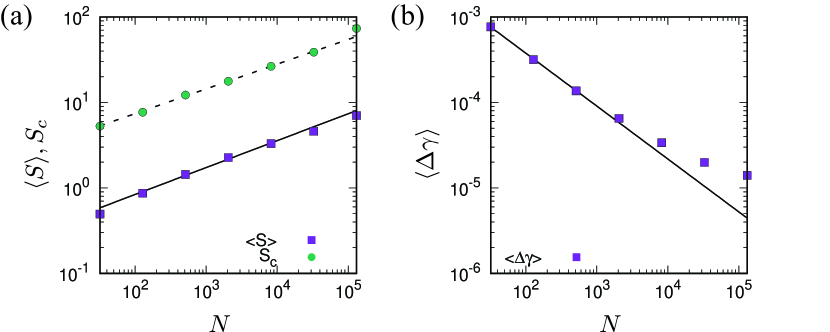
To explain the exponent for the frictionless system (), we demonstrate the finite size scaling of the mean avalanche size and interval , which has been well established by EP models Lin et al. (2014, 2015); Shang et al. (2020). We calculate the mean values, and , by taking the averages of avalanche size and interval over stress drop events in a steady state. Figure 4 displays (a) and (b) in the frictionless system as functions of the system size (the number of particles) , where we confirm the power laws, and (solid lines). The power-law exponents are given by and , which reasonably agree with the scaling relation in Refs. Shang et al. (2020),
| (12) |
We also calculate the cutoff size as Shang et al. (2020)
| (13) |
As shown in Fig. 4(a) (dotted line), the cutoff size exhibits the power law with the spatial dimension and fractal dimension . By using another scaling relation Shang et al. (2020),
| (14) |
we can estimate the exponent from and . We find from Eq. (14) which reasonably agrees with obtained by fitting Eq. (7) to the data of (dotted line in Fig. 2(a)). Therefore, the exponent for avalanche size distributions in the frictionless system can be explained by the finite size scaling of , , and Lin et al. (2014, 2015); Shang et al. (2020).
III.5.2 Frictional particles
The system size dependence of the mean avalanche size and interval in frictional systems is entirely different from that in the frictionless system. In Appendix A, we examine the dependence of the mean values, and , on the system size and friction coefficient . We find that their dependence on is sensitive to so that the scaling relations established for the case of (Eqs. (12) and (14)) are not applicable to frictional particles, (see Appendix A).
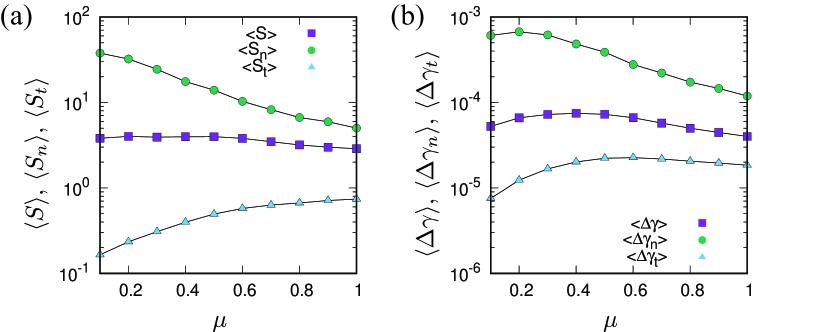
To reveal how the microscopic friction alters the exponent for avalanche size distributions , we analyze normal and tangential contributions to the avalanche size . As shown in Sec. III.1, the shear stress is divided into the normal and tangential parts as and , respectively (Eq. (1)). Accordingly, we distinguish the avalanche size as and , and avalanche interval as and . Figure 5(a) displays the mean avalanche sizes, , , and , as functions of the friction coefficient . As can be seen, the mean avalanche size of normal part is one to two decades larger than that of tangential part, where a relation,
| (15) |
holds regardless of (we use to notice the difference in logscale). In frictional systems, microscopic “slip” between the particles in contact, i.e. the switch from the tangential force to Coulomb friction , is responsible for the avalanche of tangential part . If is small, the frictional particles can easily “slip” so that the energy to be released at a tangential stress drop is small. Thus, the mean avalanche size decreases with the decrease of as shown in Fig. 5(a). On the other hand, the mean size of normal part increases with the decrease of such that the mean avalanche size is quite insensitive to the strength of microscopic friction. In addition, the mean avalanche intervals satisfy
| (16) |
regardless of (Fig. 5(b)). Therefore, microscopic slips which trigger small avalanches of tangential part are more frequent than normal stress drop events. This means that numerous small avalanches happen in frictional systems, which significantly increases the population of small in the avalanche size distribution . Accordingly, the exponent becomes larger (and closer to the MF prediction) than that in the frictionless case.
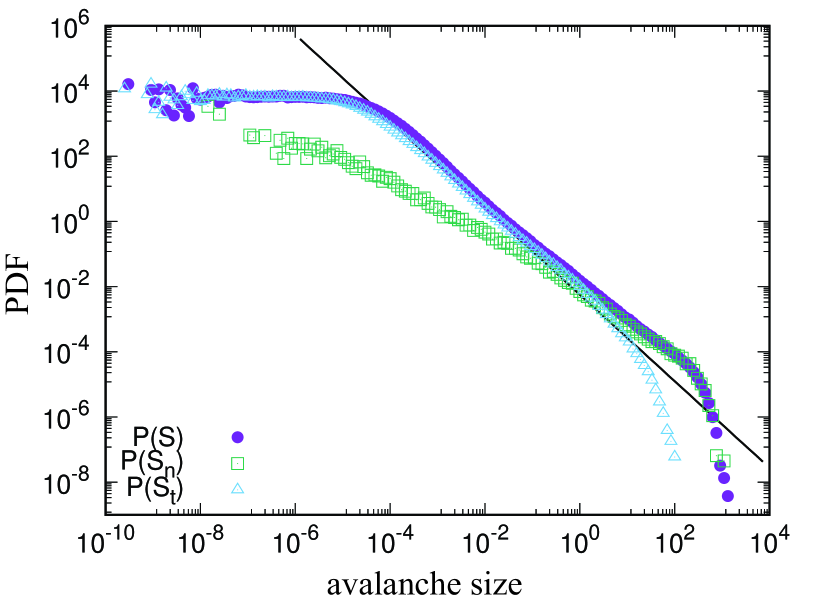
To confirm our interpretation on the exponent for frictional systems, we compare the PDFs of normal and tangential parts, i.e. and , with the avalanche size distribution, . Figure 6 displays the PDFs, , , and , where we use frictional particles with (note that a similar analysis has recently been proposed in Ref. Oyama et al. (2020)). In this figure, both the plateau of in small avalanches () and power-law decay of in the scaling regime () are well represented by the PDF of tangential part , where the solid line is the power-law decay (Eq. (7)) with the exponent as in Fig. 2(a). On the other hand, both the bump of in large avalanches () and tail of correspond to those of the PDF of normal part . Because the normal and tangential parts of the stress are uncorrelated (Sec. III.1), we crudely estimate , where the power-law exponent is solely determined by the PDF of tangential part, i.e. .
IV Discussion
In this study, we have numerically investigated stress drop events, or avalanches, in two-dimensional frictional particles under shear. Our focus was the effect of microscopic friction on statistics (Sec. III.3) and scaling laws of avalanches (Sec. III.4). Based on the MF predictions, we examined the avalanche size distributions , PDFs of the avalanche duration , and power spectra of stress drop rates . We found that the avalanche size distributions exhibit the power law, (Eq. (7)), in the scaling regime , where the power-law exponent for frictional particles, , is larger and closer to the MF prediction () and results of the EP models () than that for frictionless particles, . If the friction coefficient is finite , the PDFs of the avalanche duration also show the power-law decay (Eq. (8)) in the scaling regime though the exponent is smaller than the MF value . On the other hand, we cannot observe the power-law behavior of if the system is frictionless . The MF theory well explains our numerical results of the power spectra, i.e. , regardless of . However, we found that the lower bound of the power law (i.e. the corner frequency) decreases with the increase of such that the scaling regime (for the spectra) shifts to lower frequencies in frictional systems. We also examined the scaling laws of the avalanche duration and maximum stress drop rate, i.e. and (Eqs. (10) and (11)), and found that both are correct in the scaling regime regardless of . The influence of microscopic friction emerges outside of the scaling regime (around ); the small dip and peak appear in the shape indexes, and , respectively. The most striking difference between the frictionless and frictional systems is the different exponents for the avalanche size distributions, . To clarify the origin of the difference, we demonstrated the finite size scaling (Sec. III.5). If the system is frictionless , the exponent is well explained by the scaling relations between the spatial dimension, fractal dimension, and power-law exponents for the mean avalanche size and interval (Eqs. (12) and (14)). However, the scaling relations do not hold in frictional systems and cannot explain the exponent which is closer to the MF prediction. To understand the exponent for frictional systems, we analyzed the avalanches of normal and tangential parts of the shear stress. We found that the tangential part of the stress contributes to small sized avalanches. In addition, the avalanches of tangential part are more frequent than those of normal part. Because the normal and tangential parts are uncorrelated (Sec. III.1), we concluded that numerous small avalanches of the tangential stress increase the slope of the avalanche size distribution, which eventually increases the power-law exponent for frictional particles.
IV.1 The role of microscopic friction in the MF approach to avalanches
From our numerical results, we find that the statistics of avalanches (especially the exponent ) in frictional systems are close to the MF prediction and results of the EP models. Both the MF theory Dahmen et al. (2009, 2011); Sethna et al. (2001); Fisher et al. (1997) and EP models Nicolas et al. (2018); Karimi et al. (2017); Liu et al. (2016) are based on non-local constitutive equations of stress, where the elastic propagator of local deformations is assumed to be long-ranged (though anisotropic quadrupolar symmetry is introduced to that in the EP models). It is known that, if the microscopic friction is present, the system exhibits a sudden increase of stress such as shear jamming Bi et al. (2011) and discontinuous shear thickening Otsuki and Hayakawa (2011); Seto et al. (2013); Grob et al. (2014); Wyart and Cates (2014); Mari et al. (2013); Grob et al. (2016); Saw et al. (2020); Singh et al. (2019, 2020b), where force chains are percolated through the system under shear. The percolated force chains are reminiscent of long-range spatial correlations and analogous to the propagator in the MF theory and EP models. Therefore, we suppose that the microscopic friction is a key ingredient of the MF approach and plays a crucial role in avalanches observed in real materials.
IV.2 Future works
In our MD simulations, we fixed the area fraction of the particles to which is far above the jamming transition density van Hecke (2010); Liu and Nagel (2010); Olsson and Teitel (2007). However, mechanical properties of soft athermal particles drastically change if the system approaches the onset of unjamming, i.e. Tanguy et al. (2002); Leonforte et al. (2004, 2005, 2006); Ellenbroek et al. (2006, 2009). Thus, it is an important next step to study how the avalanche statistics and scaling laws are affected by the proximity to jamming. We also fixed the strain increment to , where the shear rate is given by in our unit. However, it is known that the shape of avalanche size distribution Behringer et al. (2008), as well as the exponent Liu et al. (2016), is sensitive to . Therefore, it is also important to investigate the effects of driving rate White and Dahmen (2003) or time resolution LeBlanc et al. (2016) on our numerical results. We employed the spring-dashpot model for the interaction between the particles in contact (Sec. II) as a canonical model of granular materials Luding (2005). However, interaction forces drastically change the flow behavior of soft athermal particles, e.g. the force law of viscous damping controls the shear thinning/thickening Andreotti et al. (2012) and the flow curves are nonmonotonic if one introduces cohesive forces Irani et al. (2014, 2016). Therefore, it is interesting to examine how the interaction forces alter the avalanche statistics and scaling laws. In addition, we had not analyzed spatial structures of the system such as non-affine displacements of the particles Goldenberg et al. (2007); Tighe et al. (2010); Mandal et al. (2013); Pouliquen (2004); DiDonna and Lubensky (2005); Maloney (2006); Heussinger and Barrat (2009); Hatano (2011); Vågberg et al. (2014); Radjai and Roux (2002); Combe et al. (2015); Saitoh and Mizuno (2016a, b) and spatial correlations of the stress Chattoraj and Lemaître (2013); Lemaître (2014, 2017); Karimi and Maloney (2015). Thus, detailed studies of the link between statistics and spatial structures are left for future. Similarly, anisotropy induced by shear Furukawa et al. (2009); Maloney and Robbins (2009); Chikkadi et al. (2011, 2012); Olsson (2010); Nicolas et al. (2014); Saitoh and Mizuno (2017), e.g. shear-bands, should be examined in future. Moreover, further studies in three dimensions are crucial to practical applications of our results Oyama et al. (2019).
Acknowledgements.
I thank Norihiro Oyama for fruitful discussions and helpful comments on the manuscript. This work was financially supported by JSPS KAKENHI Grant Numbers 18K13464 and 20H01868.*
Appendix A Finite size scaling in frictional systems
In this appendix, we explain how the microscopic friction alters the finite size scaling established for the frictionless system and discuss the frictionless limit.
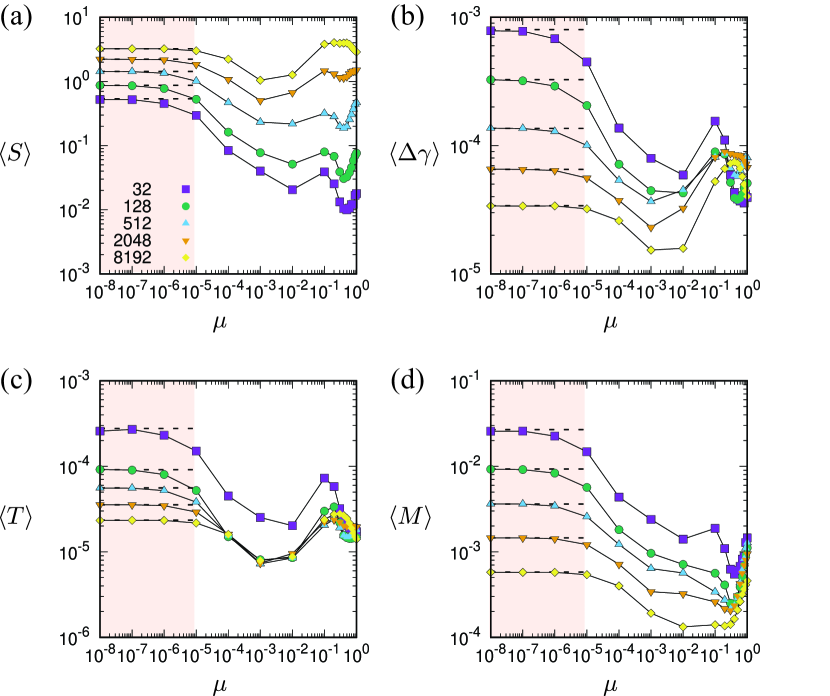
Figure 7 displays (a) the mean avalanche size and (b) mean avalanche interval as functions of the friction coefficient , where we change the system size as listed in the legend of (a). As can be seen, the system size dependence of and is sensitive to so that the scaling relations established for the case of (Eqs. (12) and (14)) are not applicable to . In this figure, we also show (c) the mean avalanche duration and (d) mean maximum stress drop rate as functions of . All the mean values significantly deviate from the frictionless cases (horizontal dashed lines) if the friction coefficient exceeds the critical value . Here, the critical value can be estimated as follows: In each time step, the strain increment is applied to the system, where the tangential displacement between the particles in contact is roughly estimated as with the mean particle diameter . The particles “slip” if the tangential force exceeds the threshold , i.e. if . Since and in our MD simulations, this condition leads to , where the overlap between the particles is roughly Saitoh et al. (2019b). Because the critical value is infinitesimal and particles slip every time step, the system is almost frictionless in the limit, (shaded regions).
References
- Lemaitre and Chaboche (1990) J. Lemaitre and J.-L. Chaboche, Mechanics of Solid Materials (Cambridge University Press, Cambridge, UK, 1990).
- Richard et al. (2020) D. Richard, M. Ozawa, S. Patinet, E. Stanifer, B. Shang, S. A. Ridout, B. Xu, G. Zhang, P. K. Morse, J.-L. Barrat, L. Berthier, M. L. Falk, P. Guan, A. J. Liu, K. Martens, S. Sastry, D. Vandembroucq, E. Lerner, and M. L. Manning, Phys. Rev. Materials 4, 113609 (2020).
- Ozawa et al. (2020) M. Ozawa, L. Berthier, G. Biroli, and G. Tarjus, Phys. Rev. Research 2, 023203 (2020).
- Singh et al. (2020a) M. Singh, M. Ozawa, and L. Berthier, Phys. Rev. Materials 4, 025603 (2020a).
- Ozawa et al. (2018) M. Ozawa, L. Berthier, G. Biroli, A. Rosso, and G. Tarjus, Proc. Natl. Acad. Sci. USA 115, 6656 (2018).
- Uhl et al. (2015) J. T. Uhl, S. Pathak, D. Schorlemmer, X. Liu, R. Swindeman, B. A. W. Brinkman, M. LeBlanc, G. Tsekenis, N. Friedman, R. Behringer, D. Denisov, P. Schall, X. Gu, W. J. Wright, T. Hufnagel, A. Jennings, J. R. Greer, P. K. Liaw, T. Becker, G. Dresen, and K. A. Dahmen, Sci. Rep. 5, 16493 (2015).
- Nicolas et al. (2018) A. Nicolas, E. E. Ferrero, K. Martens, and J.-L. Barrat, Rev. Mod. Phys. 90, 045006 (2018).
- Henkel et al. (2008) M. Henkel, H. Hinrichsen, and S. Lübeck, Non-Equilibrium Phase Transitions, Volume I: Absorbing Phase Transitions (Springer Science+Business Media B.V., Dordrecht, The Netherlands, 2008).
- Nagel (1992) S. R. Nagel, Rev. Mod. Phys. 64, 321 (1992).
- Fisher et al. (1997) D. S. Fisher, K. Dahmen, S. Ramanathan, and Y. Ben-Zion, Phys. Rev. Lett. 78, 4885 (1997).
- Sethna et al. (2001) J. P. Sethna, K. A. Dahmen, and C. R. Myers, Nature 410, 242 (2001).
- Dahmen et al. (2009) K. A. Dahmen, Y. Ben-Zion, and J. T. Uhl, Phys. Rev. Lett. 102, 175501 (2009).
- Dahmen et al. (2011) K. A. Dahmen, Y. Ben-Zion, and J. T. Uhl, Nat. Phys. 7, 554 (2011).
- Friedman et al. (2012) N. Friedman, A. T. Jennings, G. Tsekenis, J.-Y. Kim, M. Tao, J. T. Uhl, J. R. Greer, and K. A. Dahmen, Phys. Rev. Lett. 109, 095507 (2012).
- Denisov et al. (2015) D. V. Denisov, K. A. Lörincz, J. T. Uhl, K. A. Dahmen, and P. Schall, Nature Communications 7, 10641 (2015).
- Geller et al. (2015) D. A. Geller, R. E. Ecke, K. A. Dahmen, and S. Backhaus, Phys. Rev. E 92, 060201(R) (2015).
- Murphy et al. (2019) K. A. Murphy, K. A. Dahmen, and H. M. Jaeger, Phys. Rev. X 9, 011014 (2019).
- Sheikh et al. (2016) M. A. Sheikh, R. L. Weaver, and K. A. Dahmen, Phys. Rev. Lett. 117, 261101 (2016).
- Antonaglia et al. (2014) J. Antonaglia, W. J. Wright, X. Gu, R. R. Byer, T. C. Hufnagel, M. LeBlanc, J. T. Uhl, and K. A. Dahmen, Phys. Rev. Lett. 112, 155501 (2014).
- Long et al. (2019) A. A. Long, D. V. Denisov, P. Schall, T. C. Hufnagel, X. Gu, W. J. Wright, and K. A. Dahmen, Granular Matter 21, 99 (2019).
- Durian (1997) D. J. Durian, Phys. Rev. E 55, 1739 (1997).
- Tewari et al. (1999) S. Tewari, D. Schiemann, D. J. Durian, C. M. Knobler, S. A. Langer, and A. J. Liu, Phys. Rev. E 60, 4385 (1999).
- Heussinger et al. (2010) C. Heussinger, P. Chaudhuri, and J.-L. Barrat, Soft Matter 6, 3050 (2010).
- Zhang et al. (2017) D. Zhang, K. A. Dahmen, and M. Ostoja-Starzewski, Phys. Rev. E 95, 032902 (2017).
- Salerno et al. (2012) K. M. Salerno, C. Maloney, and M. O. Robbins, Phys. Rev. Lett. 109, 105703 (2012).
- Salerno and Robbins (2013) K. M. Salerno and M. O. Robbins, Phys. Rev. E 88, 062206 (2013).
- Karimi et al. (2017) K. Karimi, E. E. Ferrero, and J.-L. Barrat, Phys. Rev. E 95, 013003 (2017).
- Talamali et al. (2011) M. Talamali, V. Petäjä, D. Vandembroucq, and S. Roux, Phys. Rev. E 84, 016115 (2011).
- Liu et al. (2016) C. Liu, E. E. Ferrero, F. Puosi, J.-L. Barrat, and K. Martens, Phys. Rev. Lett. 116, 065501 (2016).
- Lin et al. (2014) J. Lin, E. Lerner, A. Rosso, and M. Wyart, Proc. Natl. Acad. Sci. U.S.A. 111, 14382 (2014).
- Lin et al. (2015) J. Lin, T. Gueudré, A. Rosso, and M. Wyart, Phys. Rev. Lett. 115, 168001 (2015).
- Ferrero and Jagla (2019a) E. E. Ferrero and E. A. Jagla, Phys. Rev. Lett. 123, 218002 (2019a).
- Ferrero and Jagla (2019b) E. E. Ferrero and E. A. Jagla, Soft Matter 15, 9041 (2019b).
- Ispánovity et al. (2014) P. D. Ispánovity, L. Laurson, M. Zaiser, I. Groma, S. Zapperi, and M. J. Alava, Phys. Rev. Lett. 112, 235501 (2014).
- Barés et al. (2017) J. Barés, D. Wang, D. Wang, T. Bertrand, C. S. O’Hern, and R. P. Behringer, Phys. Rev. E 96, 052902 (2017).
- Karmakar et al. (2010a) S. Karmakar, E. Lerner, and I. Procaccia, Phys. Rev. E 82, 055103(R) (2010a).
- Lerner et al. (2014) E. Lerner, N. P. Bailey, and J. C. Dyre, Phys. Rev. E 90, 052304 (2014).
- Hentschel et al. (2010) H. G. E. Hentschel, S. Karmakar, E. Lerner, and I. Procaccia, Phys. Rev. Lett. 104, 025501 (2010).
- Karmakar et al. (2010b) S. Karmakar, E. Lerner, I. Procaccia, and J. Zylberg, Phys. Rev. E 82, 031301 (2010b).
- Luding (2005) S. Luding, J. Phys.: Condens. Matter 17, S2623 (2005).
- Saitoh et al. (2019a) K. Saitoh, N. Oyama, F. Ogushi, and S. Luding, Soft Matter 15, 3487 (2019a).
- Lees and Edwards (1972) A. W. Lees and S. F. Edwards, J. Phys. C: Solid State Phys. 5, 1921 (1972).
- Vågberg et al. (2017) D. Vågberg, P. Olsson, and S. Teitel, Phys. Rev. E 95, 052903 (2017).
- Note (1) The stress tensor is decomposed as , where () is the -component of normal (tangential) unit vector. The average of the off-diagonal elements of the first term (on the right-hand-side) is , whereas that of the second term is .
- Hatano et al. (2014) T. Hatano, C. Narteau, and P. Shebalin, Sci. Rep. 5, 12280 (2014).
- Dahmen et al. (1998) K. Dahmen, D. Ertaş, and Y. Ben-Zion, Phys. Rev. E 58, 1494 (1998).
- Aharonov and Sparks (1999) E. Aharonov and D. Sparks, Phys. Rev. E 60, 6890 (1999).
- Savage (1972) J. C. Savage, J. Geophys. Res. 77, 3788 (1972).
- Shang et al. (2020) B. Shang, P. Guan, and J.-L. Barrat, Proc. Natl. Acad. Sci. U.S.A. 117, 86 (2020).
- Oyama et al. (2020) N. Oyama, H. Mizuno, and A. Ikeda, (2020), arXiv:2009.02635 .
- Bi et al. (2011) D. Bi, J. Zhang, B. Chakraborty, and R. P. Behringer, Nature 480, 355 (2011).
- Otsuki and Hayakawa (2011) M. Otsuki and H. Hayakawa, Phys. Rev. E 83, 051301 (2011).
- Seto et al. (2013) R. Seto, R. Mari, J. F. Morris, and M. M. Denn, Phys. Rev. Lett. 111, 218301 (2013).
- Grob et al. (2014) M. Grob, C. Heussinger, and A. Zippelius, Phys. Rev. E 89, 050201(R) (2014).
- Wyart and Cates (2014) M. Wyart and M. E. Cates, Phys. Rev. Lett. 112, 098302 (2014).
- Mari et al. (2013) R. Mari, R. Seto, J. F. Morris, and M. M. Denn, Phys. Rev. E 91, 052302 (2013).
- Grob et al. (2016) M. Grob, A. Zippelius, and C. Heussinger, Phys. Rev. E 93, 030901(R) (2016).
- Saw et al. (2020) S. Saw, M. Grob, A. Zippelius, and C. Heussinger, Phys. Rev. E 101, 012602 (2020).
- Singh et al. (2019) A. Singh, S. Pednekar, J. Chun, M. M. Denn, and J. F. Morris, Phys. Rev. Lett. 122, 098004 (2019).
- Singh et al. (2020b) A. Singh, C. Ness, R. Seto, J. J. de Pablo, and H. M. Jaeger, Phys. Rev. Lett. 124, 248005 (2020b).
- van Hecke (2010) M. van Hecke, J. Phys.: Condens. Matter 22, 033101 (2010).
- Liu and Nagel (2010) A. J. Liu and S. R. Nagel, Annu. Rev. Condens. Matter Phys. 1, 347 (2010).
- Olsson and Teitel (2007) P. Olsson and S. Teitel, Phys. Rev. Lett. 99, 178001 (2007).
- Tanguy et al. (2002) A. Tanguy, J. P. Wittmer, F. Leonforte, and J.-L. Barrat, Phys. Rev. B 66, 174205 (2002).
- Leonforte et al. (2004) F. Leonforte, A. Tanguy, J. P. Wittmer, and J.-L. Barrat, Phys. Rev. B 70, 014203 (2004).
- Leonforte et al. (2005) F. Leonforte, R. Boissiere, A. Tanguy, J. P. Wittmer, and J.-L. Barrat, Phys. Rev. B 72, 224206 (2005).
- Leonforte et al. (2006) F. Leonforte, A. Tanguy, J. P. Wittmer, and J.-L. Barrat, Phys. Rev. Lett. 97, 055501 (2006).
- Ellenbroek et al. (2006) W. G. Ellenbroek, E. Somfai, M. van Hecke, and W. van Saarloos, Phys. Rev. Lett. 97, 258001 (2006).
- Ellenbroek et al. (2009) W. G. Ellenbroek, M. van Hecke, and W. van Saarloos, Phys. Rev. E 80, 061307 (2009).
- Behringer et al. (2008) R. P. Behringer, D. Bi, B. Chakraborty, S. Henkes, and R. R. Hartley, Phys. Rev. Lett. 101, 268301 (2008).
- White and Dahmen (2003) R. A. White and K. A. Dahmen, Phys. Rev. Lett. 91, 085702 (2003).
- LeBlanc et al. (2016) M. LeBlanc, A. Nawano, W. J. Wright, X. Gu, J. T. Uhl, and K. A. Dahmen, Phys. Rev. E 94, 052135 (2016).
- Andreotti et al. (2012) B. Andreotti, J.-L. Barrat, and C. Heussinger, Phys. Rev. Lett. 109, 105901 (2012).
- Irani et al. (2014) E. Irani, P. Chaudhuri, and C. Heussinger, Phys. Rev. Lett. 112, 188303 (2014).
- Irani et al. (2016) E. Irani, P. Chaudhuri, and C. Heussinger, Phys. Rev. E 94, 052608 (2016).
- Goldenberg et al. (2007) C. Goldenberg, A. Tanguy, and J.-L. Barrat, Euro. Phys. Lett. 80, 16003 (2007).
- Tighe et al. (2010) B. P. Tighe, E. Woldhuis, J. J. C. Remmers, W. van Saarloos, and M. van Hecke, Phys. Rev. Lett. 105, 088303 (2010).
- Mandal et al. (2013) S. Mandal, V. Chikkadi, B. Nienhuis, D. Raabe, P. Schall, and F. Varnik, Phys. Rev. E 88, 022129 (2013).
- Pouliquen (2004) O. Pouliquen, Phys. Rev. Lett. 93, 248001 (2004).
- DiDonna and Lubensky (2005) B. A. DiDonna and T. C. Lubensky, Phys. Rev. E 72, 066619 (2005).
- Maloney (2006) C. E. Maloney, Phys. Rev. Lett. 97, 035503 (2006).
- Heussinger and Barrat (2009) C. Heussinger and J.-L. Barrat, Phys. Rev. Lett. 102, 218303 (2009).
- Hatano (2011) T. Hatano, J. Phys. Conf. Series 319, 012011 (2011).
- Vågberg et al. (2014) D. Vågberg, P. Olsson, and S. Teitel, Phys. Rev. Lett. 113, 148002 (2014).
- Radjai and Roux (2002) F. Radjai and S. Roux, Phys. Rev. Lett. 89, 064302 (2002).
- Combe et al. (2015) G. Combe, V. Richefeu, M. Stasiak, and A. P. F. Atman, Phys. Rev. Lett. 115, 238301 (2015).
- Saitoh and Mizuno (2016a) K. Saitoh and H. Mizuno, Soft Matter 12, 1360 (2016a).
- Saitoh and Mizuno (2016b) K. Saitoh and H. Mizuno, Phys. Rev. E 94, 022908 (2016b).
- Chattoraj and Lemaître (2013) J. Chattoraj and A. Lemaître, Phys. Rev. Lett. 111, 066001 (2013).
- Lemaître (2014) A. Lemaître, Phys. Rev. Lett. 113, 245702 (2014).
- Lemaître (2017) A. Lemaître, Phys. Rev. E 96, 052101 (2017).
- Karimi and Maloney (2015) K. Karimi and C. E. Maloney, Phys. Rev. E 92, 022208 (2015).
- Furukawa et al. (2009) A. Furukawa, K. Kim, S. Saito, and H. Tanaka, Phys. Rev. Lett. 102, 016001 (2009).
- Maloney and Robbins (2009) C. E. Maloney and M. O. Robbins, Phys. Rev. Lett. 102, 225502 (2009).
- Chikkadi et al. (2011) V. Chikkadi, G. Wegdam, D. Bonn, B. Nienhuis, and P. Schall, Phys. Rev. Lett. 107, 198303 (2011).
- Chikkadi et al. (2012) V. Chikkadi, S. Mandal, B. Nienhuis, D. Raabe, F. Varnik, and P. Schall, Euro. Phys. Lett. 100, 56001 (2012).
- Olsson (2010) P. Olsson, Phys. Rev. E 82, 031303 (2010).
- Nicolas et al. (2014) A. Nicolas, J. Rottler, and J.-L. Barrat, Euro. Phys. J. E 37, 50 (2014).
- Saitoh and Mizuno (2017) K. Saitoh and H. Mizuno, Phys. Rev. E 96, 012903 (2017).
- Oyama et al. (2019) N. Oyama, H. Mizuno, and K. Saitoh, Phys. Rev. Lett. 122, 188004 (2019).
- Saitoh et al. (2019b) K. Saitoh, R. K. Shrivastava, and S. Luding, Phys. Rev. E 99, 012906 (2019b).