Enhanced sensitivity and tunability of thermomechanical resonance near the buckling bifurcation
Abstract
The high susceptibility of ultrathin two-dimensional (2D) material resonators to force and temperature makes them ideal systems for sensing applications and exploring thermomechanical coupling. Although the dynamics of these systems at high stress has been thoroughly investigated, their behaviour near the buckling transition has received less attention. Here, we demonstrate that the force sensitivity and frequency tunability of 2D material resonators are significantly enhanced near the buckling bifurcation. This bifurcation is triggered by compressive displacement that we induce via thermal expansion of the devices, while measuring their dynamics via an optomechanical technique. We understand the frequency tuning of the devices through a mechanical buckling model, which allows to extract the central deflection and boundary compressive displacement of the membrane. Surprisingly, we obtain a remarkable enhancement of up to 14 the vibration amplitude attributed to a very low stiffness of the membrane at the buckling transition, as well as a high frequency tunability by temperature of more than 4.02 . The presented results provide insights into the effects of buckling on the dynamics of free-standing 2D materials and thereby open up opportunities for the realization of 2D resonant sensors with buckling-enhanced sensitivity.
keywords:
American Chemical Society, LaTeXDelft University of Technology] Department of Precision and Microsystems Engineering, Delft University of Technology, Lorentzweg 1, 2628 CD Delft, The Netherlands Delft University of Technology] Kavli Institute of Nanoscience, Delft University of Technology, 2628 CJ Delft, The Netherlands Universitat de Valencia] Instituto de Ciencia Molecular (ICMol), Universitat de Valencia, Paterna 46980, Spain Delft University of Technology] Kavli Institute of Nanoscience, Delft University of Technology, 2628 CJ Delft, The Netherlands Delft University of Technology] Department of Precision and Microsystems Engineering, Delft University of Technology, Lorentzweg 1, 2628 CD Delft, The Netherlands \alsoaffiliation[Delft University of Technology] Kavli Institute of Nanoscience, Delft University of Technology, 2628 CJ Delft, The Netherlands Delft University of Technology] Department of Precision and Microsystems Engineering, Delft University of Technology, Lorentzweg 1, 2628 CD Delft, The Netherlands \abbreviationsIR,NMR,UV
1 Keywords
Nanomechanical resonator, buckling bifurcation, frequency tuning, vibration amplitude
2 Introduction
A flat mechanical plate subjected to a sufficiently high in-plane compressive stress becomes unstable, as its out-of-plane stiffness gradually reduces to zero 1. When this happens, the plate experiences a buckling bifurcation. Even the slightest imperfection in the device, like a very small initial deformation, can determine whether the plate buckles up or downward. This high sensitivity to initial conditions offers exciting prospects, both for studying material properties 2, 3, 4 and for realizing new sensing applications 5. Therefore there has been a growing interest for buckling in nano-electromechanical systems (NEMS) and resonators such as phononic waveguides 6, carbon nanotubes 7 and SiNx drumheads 8, showing reversible control of signal transmission, high sensitive switching, as well as remarkable nonlinear effects and high tunability of resonance frequencies. These properties of buckled resonators make them very suitable for applications as actuators, sensors, and energy harvesters 9, 10.
Nanomechanical resonators made of free-standing 2D materials are stiff within the plane, due to their high Young’s modulus, but extremely flexible out-of-plane due to their atomic thickness11, 12, 13. As a result, free-standing 2D materials buckle at relatively low compressive stress values and thereby present an ideal platform for studying the buckling bifurcation in nanoscale systems. In fact, the buckling bifurcation provides a sensitive method to determine the bending rigidity of 2D materials 2, 14. However, most of the work on 2D NEMS resonators has focused on flat 2D mechanical resonators under tensile stress, because these can be more reproducibly fabricated 15, 16. Moreover, the experimental detection of the buckling bifurcation in 2D NEMS remains difficult, as it requires a methodology to induce symmetric in-plane compression in suspended 2D materials while measuring their mechanical motion with high spatial resolution.
In this work, we study the effect of the buckling bifurcation on the dynamics of optothermally driven nanomechanical resonators made of FePS3 membranes. By varying temperature, the membranes expand, causing a compressive displacement that triggers the membranes to deflect out-of-plane. Interestingly, this buckling bifurcation does not only cause a large change in the temperature-dependent resonance frequency, but also gives rise to a significant enhancement of vibration amplitude of the resonators when driven on-resonance. To account for these observations and relate them to the device parameters, we fit a mechanical buckling model to the experiments that quantifies central membrane deflection and boundary compressive displacement of the membrane. Based on the model we attribute the force response to a significantly reduced out-of-plane stiffness at buckling transition. The large frequency tuning and high responsivity to forces of 2D resonators near the buckling bifurcation might be utilized to enhance sensitivity in future designs of 2D NEMS devices like microphones and pressure sensors.
3 Fabrication and methodology
| () | () | () | () | () | |
|---|---|---|---|---|---|
| D1 | 4 | 33.9 | 69.9 | 5.89 | 302.0 |
| D2 | 4 | 33.9 | 70.3 | 5.52 | 303.0 |
| D3 | 3 | 34.5 | 93.1 | 11.18 | 307.5 |
| () | () | () | ||
|---|---|---|---|---|
| D1 | 5.53 | 20.1 | 0.08 | 1.84 |
| D2 | 3.97 | 6.2 | 0.08 | 1.99 |
| D3 | 6.89 | 4.3 | 0.04 | 1.32 |
We fabricated 2D nanomechanical resonators by transferring exfoliated 2D flakes over etched circular cavities with a depth of and varying radius in a Si/SiO2 substrate (Methods). In total, we made three FePS3 devices D1D3. Figure 1a shows a schematic cross-section and a top view (optical microscope) of the fabricated devices D1 and D2 with . Using tapping mode atomic force microscopy (AFM), we measure the height difference between the membrane and the Si/SiO2 substrate. As Fig. 1b shows, we find a membrane thickness of 33.9 for devices D1 and D2. To determine the Young’s modulus of the resonators, we indent the membrane centre by an AFM cantilever while measuring its deflection 17. We fit the applied force versus indentation , as depicted in Fig. 1c (orange points), to a model for point-force loading of a circular plate given by , where is the bending rigidity of the membrane, is Poisson ratio, is the pre-tension in the membrane, and is the built-in strain. From the fit (black line, Fig. 1c) we extract for device D1. The AFM measurements on devices D2 and D3 can be found in SI section 3. The extracted Young’s moduli of all devices are listed in Table 1 and are similar to values reported in the literature 18.
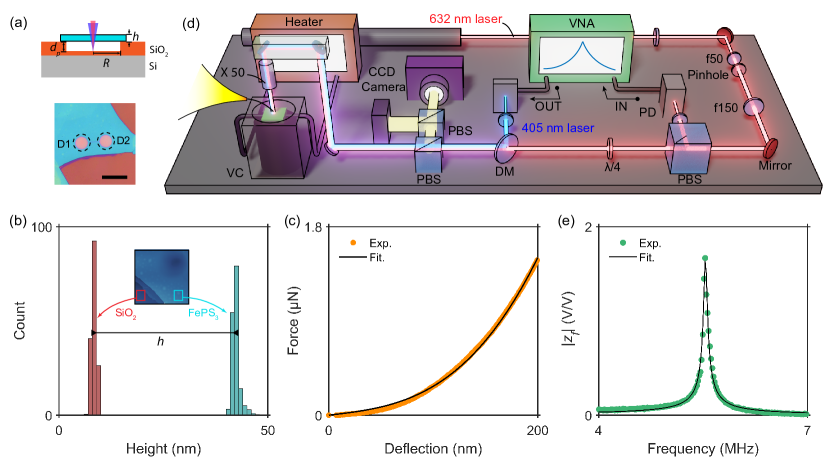
To probe the thermodynamic properties of the fabricated devices, we use a laser interferometer (see Methods)19, 20. As shown in Fig. 1d, we place the samples in a vacuum chamber with a pressure below 10-5 during the measurements. A power-modulated diode laser () photothermally actuates the resonator, while the reflection of a He-Ne laser ( ) from the cavity with the suspended membrane captures its motion. The reflection is measured by a photodetector (PD) and processed by a Vector Network Analyzer (VNA) and then converted to the response amplitude of the resonator in the frequency domain. Figure 1e shows the measured frequency response around the fundamental resonance (green points) and a fit to a harmonic oscillator model (black line), given by , where is resonance frequency, is the vibration amplitude at resonance and is quality factor. Here, we extract , and for device D1. We will now outline how the characteristics of the resonance frequency ( and ) can be used to provide information about the temperature dependent properties of 2D material resonators, in particular near the buckling bifurcation.
4 Results and discussion
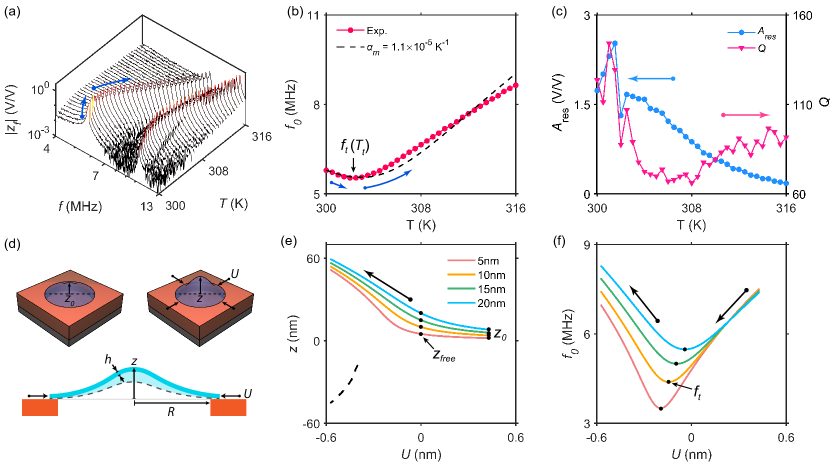
Figure 2a shows the measured as a function of actuation frequency and temperature (in the range from 300 to 316 ) for device D1. Interestingly, the resonance frequencies, including fundamental mode (indicated by the blue arrows) and second mode, first decrease and then increase as temperature increases, with a turning point at temperature (see Fig. 2b). Similarly, the measured vibration amplitude for device D1 also reaches to its maximum at (see Fig. 2c). These behaviors are also experimentally observed in devices D2 and D3 (see SI section 3). We attribute the turning of versus to the mechanical buckling of the nanomechanical resonators under critical compressive loading, which has been reported before in carbon nanotube resonators 7 and arch MEMS devices 21. In fact, the bulk thermal expansion coefficients (TEC), , of the measured FePS3 membranes in this work is much larger than the TEC of the Si/SiO2 substrate. Hence, heating induces compressive displacement in the resonators and buckling is a natural consequence.
Due to the buckling, we cannot use the standard equation for the resonance frequency of a pre-tensioned plate or membrane for further analysis. Therefore, we use a mechanical buckling model for clamped circular plate, as illustrated in Fig. 2d. Using a Galerkin method from literature 22, 23, we obtain an expression of under thermally induced compressive displacement:
| (1) |
where is the in-plane edge displacement of the plate, is the mass density, is the central deflection of the plate, is the central deflection of free plate without loading (when ), and is a fitting constant and equal to 0.52 when (see SI section 1). Both and depend on temperature . The details of derivation of Eq. 1 can be found in SI section 1. In contrast to the standard equation for the resonance frequency of a pre-bending plate 24, we now find that not only the bending rigidity determine , but also the thermally-induced boundary displacement and the center deflection of the membrane.
To find the relation between and , we consider a uniformly-clamped plate as depicted in Fig. 2d. By studying the static state of the plate using Gakerkin method (see more details in SI section 1), we obtain an analytic solution:
| (2) |
Therefore, the change of central deflection of the plate versus as buckling happens can be extracted from Eq. 2. We further use COMSOL simulation method to obtain and as the function of , showing good agreements with the analytical solution obtained from Eqs. 1 and 2 (see Fig. S2). By substituting the parameters , , , and into Eq. 2, we can evaluate as a function of for different . As plotted in Fig. 2e, gradually increases with increasing . The dotted black line in Fig. 2e represents a supercritical bifurcation at the critical buckling load when . This physically indicates an unstable equilibrium that the plate will either buckle up or down when it is slightly perturbed. For nonzero in this work, the 2D membrane always buckles in the direction of its pre-deflection.
In order to investigate the effect of buckling on the resonance frequency , we substitute the relation between and into Eq. 1. This results in a relation between and , as plotted in Fig. 2f. When decreasing the displacement by compression, reduces to a minimal value (the turning point) and then starts to increase. At this turning point, the minimum resonance frequency of the resonator is reached (marked as dots in Fig. 2f). Both the experimental curves in Fig. 2a and the theoretical curves in Fig. 2f clearly show this frequency minimum, which we take as qualitative evidence for the occurrence of buckling in the 2D resonators.
Let us now quantify and as a function of for device D1, using a model that follows the flow chart depicted in Fig. 3a. First, we need to determine the value of in the mechanical buckling model. For this, we use the specific feature in the measured versus data, which is at the turning point (Fig. 2b). Assuming the Young’s modulus of the membrane remains constant within the probed temperature range 25, can be determined by (see derivation in SI section 2). Here, using the parameters in Table 1 and the measured value of , we extract for device D1.
By substituting the obtained into Eqs. 1 and 2, we further extract and as a function of from the measured at each temperature for device D1. In Fig. 3b, we observe that the compressive displacement becomes more than 10 times larger than its initial tensile value (Table 1) by heating the membrane by only 16 . To validate the extracted , we determine the TEC of the membrane. Using the TEC of the substrate , we can use the relation to determine 18. We thus fit this relation to the obtained as shown in Fig. 3c (orange line) and find is approximately , which is in good agreement with values reported in the literature for FePS326, 18. The fitting deviation for in Fig. 2b is thus attributed to the temperature dependence of of FePS3, or the irregular deflection of the membrane as buckling happens.
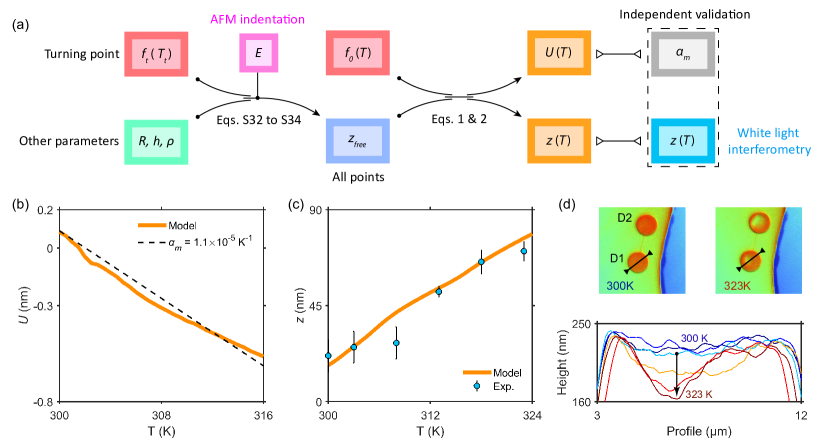
To experimentally validate the extracted from the buckling model in Fig. 3c, we use a white light interferometer to image the surface profile of the suspended FePS3 membranes as a function of temperature. As shown in Fig. 3d, we observe from the height profiles (black arrows, top panel) that the membrane deformation increases as goes up (bottom panel). As a measure for , we take the difference between the maximum and minimum height for two height profiles and take the average value. As plotted in Fig. 3c, the extracted (points) for device D1 quantitatively matches the estimated (orange line), which confirms that device D1 exhibits mechanical buckling. In addition, the total strain in the FePS3 membrane also changes from the initial tensile strain to a strong compressive strain. From the obtained and , we extract the initial strain for device D1 using Eq. S26 and the relation . All obtained for devices D1 to D3 are listed in Table 1.
We now focus on the vibration amplitude of the fundamental mode of the membrane. As shown in Fig. 2c, we observe a remarkable enhancement of up to the vibration amplitude at the turning point . This is attributed to the reduction of out-of-plane stiffness, , of the membrane near the buckling transition. Furthermore, we also find the thermally induced buckling in devices D2 and D3 during optomechanical measurements (see SI section 3). We quantify the frequency turning of these devices with the mechanical buckling model, and extract their , and as listed in Table 1. Similar to what was observed for device D1 (Fig. 2c), for devices D2 and D3 also show more than 14 times enhancements near the buckling transition (Fig. S6). However, although the quality factor reaches to its maximum at turning point for device D1, we observe completely different results of for devices D2 and D3. Since is related to the TEC and thermal properties of 2D materials 27, it is of interest to investigate the -tuning of buckled 2D resonators in future work.
The implications of the observed phenomena extend beyond FePS3 resonators. Even for 2D materials with a negative TEC such as graphene, buckling might occur if it is cooled down and the initial tensile stress is low enough. A key assumption in Eqs. 1 and 2 is a uniform compressive force at the boundary of the membrane and a constant Young’s modulus over the measured temperature range. In reality, inhomogeneities due to uneven adhesion between membrane and substrate could lead to multiple smaller corrugations and wrinkles superimposed in the membrane when buckling occurs. This potential limitation, which we did not observe for the devices studied in this work, deserves future study as the buckled mode shape as well as the Young’s modulus depend on it 28, 29. Possibly, the experimental quantification of the Young’s modulus for each device with AFM, as we did in Fig. 1c, compensates for some of the effects of corrugations and wrinkles on the buckling bifurcation.
Despite the fact that the temperature-dependence of resonance frequency has been investigated in earlier works on 2D membranes 30, 31, 32, mechanical buckling has not been reported yet. It seems that one study on MoS2 resonators might have almost reached the buckling point () at around 373 30. In this work it was relatively straightforward to reach the buckling bifurcation due to the large TECs of the selected 2D materials. It is of interest to speculate on the ultimate limits of buckling induced resonance frequency decrease. As indicated in Fig. 2d, theoretically it might be possible to have the resonance frequency approaching zero for a deflection . However, in practice it will be difficult to reach that point. Nevertheless, by making the membranes flatter and with low pre-stress, the zero resonance frequency might be approached, which allows for an extremely high tunability and therefore a high force, stress and temperature sensitivity of near the minimum . For such flat and low stress membranes, we expect the bending rigidity of 2D materials to dominate the performance and resonance frequency versus temperature curve near the buckling bifurcation point.
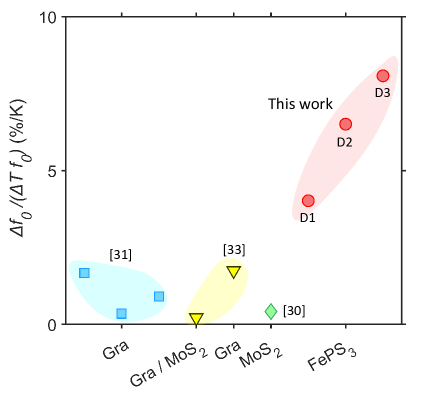
Also from an application perspective, the thermally induced buckling in 2D nanomechanical resonators deserves further exploration. First, the frequency tuning with temperature is considerable. As shown in Fig. 4, we obtain a tunability, , more than 4.02 for device D1, which is at least 2.3 times higher than reported in earlier studies 31, 33, 30. The slope of frequency tuning for device D1 is , which, when considering an accuracy of in determining , results in a temperature resolution of . This value is comparable to state-of-the-art temperature sensors 34 and thus highlights the application buckled 2D resonators as bolometer 35 and NEMS resonant infrared detector 36. Furthermore, precise control over the buckling bifurcation can be obtained by tailoring the initial deflection of the membrane by applying, among others, electrostatic gating on the resonators 12, a gas pressure difference 37, or straining the resonators by MEMS actuators 38.
5 Conclusion
In summary, we reported the experimental observation of thermally-induced buckling in 2D nanomechanical resonators made of suspended FePS3 membranes. Using an optomechanical method, we probed their dynamic responses as a function of temperature. A mechanical buckling model was developed to explain the observed large turning of the resonance frequency with temperature, which allows to determine the boundary compressive displacement and center deflection of the fabricated devices. Using white light interferometer, we independently validated the extracted deflection of the membrane versus temperature from buckling model. We found an enhancement of up to 14 vibration amplitude near buckling bifurcation, which we attributed to the decrease in out-of-plane stiffness of the membrane. The gained insight not only advances the fundamental understanding of buckling bifurcation membranes made of 2D materials, but also enables pathways for buckling-enhanced designs and applications such as temperature detectors, thermoelectric and NEMS devices.
6 Methods
Sample Fabrication. A Si wafer with 285 dry SiO2 is spin coated with positive e-beam resist and exposed by electron-beam lithography. Afterwards, the SiO2 layer without protection is completely etched using CHF3 and Ar plasma in a reactive ion etcher. The edges of cavities are examined to be well-defined by scanning electron microscopy (SEM) and AFM. After resist removal, FePS3 nanoflakes are exfoliated by Scotch tape, and then separately transferred onto the substrate at room temperature through a deterministic dry stamping technique. More details about the fabrication of etched substrate with circular cavities, as well as the Scotch tape transfer method can be found in 13. Detailed descriptions of the FePS3 crystal growth and characterization is reported in earlier work 39. We choose FePS3 flakes due to its large value of TEC, which allows to experimentally observe the buckling phenomenon of 2D resonators within a small range of temperature increase.
Laser Interferometry Setup. We present temperature-dependent optomechanical measurements in a laser interferometry setup 18. The fabricated devices is fixed on a sample holder inside the vacuum chamber. A PID heater and a temperature sensor are connected with the sample holder, which allows to precisely monitor and control the temperature sweeping. A piezo-electric actuator below the sample holder is used to optimize the X-Y position of the sample to maintain both the blue and red laser in the center of the 2D resonators. We use a red and blue laser power of 0.9 and 0.13 respectively. Note we verified that the resonators vibrate in linear regime and the temperature raise due to self-heating is negligible 40. The real picture of experimental setup on the optical table can be found in Fig. S8.
7 Associated content
The Supporting Information is available free of charge at https://xxxxxx.
8 Author information
8.1 Author Contribution
H.L., P.G.S. and G.J.V. conceived the experiments. H.L. and G.B. performed the optomechanical measurements with heating control system. H.L. fabricated and inspected the samples. C.B.C. synthesized and characterized the FePS3 crystals. H.L., G.J.V., P.G.S. and H.S.J.v.d.Z. analyzed and modeled the experimental data. H.S.J.v.d.Z. and P.G.S. supervised the project. The paper was jointly written by all authors with a main contribution from H.L. All authors discussed the results and commented on the paper.
8.2 Notes
The authors declare no competing financial interest.
P.G.S. and G.J.V. acknowledges support by the Dutch 4TU federation for the Plantenna project. H.L. acknowledges the financial support from China Scholarship Council. G.B., H.S.J.v.d.Z., and P.G.S. acknowledge funding from the European Union’s Horizon 2020 research and innovation program under grant agreement no. 881603. C. B. C acknowledges the financial support from the European Union (ERC AdG Mol-2D 788222), the Spanish MICIN (2D-HETEROS PID2020-117152RB-100, co-financed by FEDER, and Excellence Unit “María de Maeztu” CEX2019-000919-M), the Generalitat Valenciana (PROMETEO Program and PO FEDER Program, Ph.D fellowship) and the Advanced Materials program (supported by MCIN with funding from European Union NextGenerationEU (PRTR-C17.I1) and by Generalitat Valenciana). We thank M.H. for checking the model derivations.
References
- Hu and Burgueño 2015 Hu, N.; Burgueño, R. Buckling-induced smart applications: recent advances and trends. Smart Materials and Structures 2015, 24, 063001
- Lindahl et al. 2012 Lindahl, N.; Midtvedt, D.; Svensson, J.; Nerushev, O. A.; Lindvall, N.; Isacsson, A.; Campbell, E. E. Determination of the bending rigidity of graphene via electrostatic actuation of buckled membranes. Nano letters 2012, 12, 3526–3531
- Le Doussal and Radzihovsky 2021 Le Doussal, P.; Radzihovsky, L. Thermal buckling transition of crystalline membranes in a field. Physical Review Letters 2021, 127, 015702
- Chil et al. 2022 Chil, C.; Durinck, J.; Coupeau, C. Buckling of graphene under compressive strain: DFT calculations and second generation REBO potential. Extreme Mechanics Letters 2022, 101845
- El Mansouri et al. 2019 El Mansouri, B.; Middelburg, L. M.; Poelma, R. H.; Zhang, G. Q.; van Zeijl, H. W.; Wei, J.; Jiang, H.; Vogel, J. G.; van Driel, W. D. High-resolution MEMS inertial sensor combining large-displacement buckling behaviour with integrated capacitive readout. Microsystems & nanoengineering 2019, 5, 1–14
- Kim et al. 2021 Kim, S.; Bunyan, J.; Ferrari, P. F.; Kanj, A.; Vakakis, A. F.; Van Der Zande, A. M.; Tawfick, S. Buckling-mediated phase transitions in nano-electromechanical phononic waveguides. Nano letters 2021, 21, 6416–6424
- Rechnitz et al. 2022 Rechnitz, S.; Tabachnik, T.; Shlafman, S.; Shlafman, M.; Yaish, Y. E. DC Signature of Snap-through Bistability in Carbon Nanotube Mechanical Resonators. Nano Letters 2022, 22, 7304–7310
- Kanj et al. 2022 Kanj, A.; Ferrari, P. F.; van der Zande, A. M.; Vakakis, A. F.; Tawfick, S. Ultra-tuning of nonlinear drumhead MEMS resonators by electro-thermoelastic buckling. arXiv preprint arXiv:2210.06982 2022,
- Xia et al. 2020 Xia, J.; Farrell, P. E.; Castro, S. G. Nonlinear bifurcation analysis of stiffener profiles via deflation techniques. Thin-Walled Structures 2020, 149, 106662
- Harne and Wang 2013 Harne, R. L.; Wang, K. A review of the recent research on vibration energy harvesting via bistable systems. Smart materials and structures 2013, 22, 023001
- Xu et al. 2022 Xu, B.; Zhang, P.; Zhu, J.; Liu, Z.; Eichler, A.; Zheng, X.-Q.; Lee, J.; Dash, A.; More, S.; Wu, S., et al. Nanomechanical resonators: toward atomic scale. ACS nano 2022, 16, 15545–15585
- Steeneken et al. 2021 Steeneken, P. G.; Dolleman, R. J.; Davidovikj, D.; Alijani, F.; Van der Zant, H. S. Dynamics of 2D material membranes. 2D Materials 2021, 8, 042001
- Liu et al. 2023 Liu, H.; Basuvalingam, S. B.; Lodha, S.; Bol, A. A.; van der Zant, H. S.; Steeneken, P. G.; Verbiest, G. J. Nanomechanical resonators fabricated by atomic layer deposition on suspended 2D materials. 2D Materials 2023, 10, 045023
- Iguiñiz et al. 2019 Iguiñiz, N.; Frisenda, R.; Bratschitsch, R.; Castellanos-Gomez, A. Revisiting the buckling metrology method to determine the Young’s modulus of 2D materials. Advanced Materials 2019, 31, 1807150
- Kim 2020 Kim, S. Impact of the van der Waals interface on the mechanics of 2D nanoelectromechanical systems. Ph.D. thesis, University of Illinois at Urbana-Champaign, 2020
- Ferrari et al. 2021 Ferrari, P. F.; Kim, S.; Van Der Zande, A. M. Dissipation from interlayer friction in graphene nanoelectromechanical resonators. Nano letters 2021, 21, 8058–8065
- Castellanos-Gomez et al. 2012 Castellanos-Gomez, A.; Poot, M.; Steele, G. A.; Van Der Zant, H. S.; Agraït, N.; Rubio-Bollinger, G. Elastic properties of freely suspended MoS2 nanosheets. Advanced materials 2012, 24, 772–775
- Šiškins et al. 2020 Šiškins, M.; Lee, M.; Mañas-Valero, S.; Coronado, E.; Blanter, Y. M.; van der Zant, H. S.; Steeneken, P. G. Magnetic and electronic phase transitions probed by nanomechanical resonators. Nature communications 2020, 11, 1–7
- Šiškins et al. 2021 Šiškins, M.; Sokolovskaya, E.; Lee, M.; Mañas-Valero, S.; Davidovikj, D.; Van Der Zant, H. S.; Steeneken, P. G. Tunable strong coupling of mechanical resonance between spatially separated FePS3 nanodrums. Nano letters 2021, 22, 36–42
- Liu et al. 2022 Liu, H.; Lee, M.; Šiškins, M.; van der Zant, H.; Steeneken, P.; Verbiest, G. Tension tuning of sound and heat transport in graphene. arXiv preprint arXiv:2204.06877 2022,
- Hajjaj et al. 2020 Hajjaj, A.; Jaber, N.; Ilyas, S.; Alfosail, F.; Younis, M. I. Linear and nonlinear dynamics of micro and nano-resonators: Review of recent advances. International Journal of Non-Linear Mechanics 2020, 119, 103328
- Yamaki et al. 1981 Yamaki, N.; Otomo, K.; Chiba, M. Non-linear vibrations of a clamped circular plate with initial deflection and initial edge displacement, part I: Theory. Journal of sound and vibration 1981, 79, 23–42
- Kim and Dickinson 1986 Kim, C.; Dickinson, S. The flexural vibration of slightly curved slender beams subject to axial end displacement. Journal of sound and vibration 1986, 104, 170–175
- Castellanos-Gomez et al. 2013 Castellanos-Gomez, A.; van Leeuwen, R.; Buscema, M.; van der Zant, H. S.; Steele, G. A.; Venstra, W. J. Single-layer MoS2 mechanical resonators. Advanced Materials 2013, 25, 6719–6723
- Sha et al. 2015 Sha, Z.-D.; Pei, Q.-X.; Ding, Z.; Jiang, J.-W.; Zhang, Y.-W. Mechanical properties and fracture behavior of single-layer phosphorene at finite temperatures. Journal of Physics D: Applied Physics 2015, 48, 395303
- Takano et al. 2004 Takano, Y.; Arai, N.; Arai, A.; Takahashi, Y.; Takase, K.; Sekizawa, K. Magnetic properties and specific heat of MPS3 (M= Mn, Fe, Zn). Journal of Magnetism and Magnetic Materials 2004, 272, E593–E595
- Prabhakar and Vengallatore 2008 Prabhakar, S.; Vengallatore, S. Theory of thermoelastic damping in micromechanical resonators with two-dimensional heat conduction. Journal of Microelectromechanical Systems 2008, 17, 494–502
- Bonilla and Ruiz-Garcia 2016 Bonilla, L.; Ruiz-Garcia, M. Critical radius and temperature for buckling in graphene. Physical Review B 2016, 93, 115407
- Nicholl et al. 2015 Nicholl, R. J.; Conley, H. J.; Lavrik, N. V.; Vlassiouk, I.; Puzyrev, Y. S.; Sreenivas, V. P.; Pantelides, S. T.; Bolotin, K. I. The effect of intrinsic crumpling on the mechanics of free-standing graphene. Nature communications 2015, 6, 1–7
- Wang et al. 2021 Wang, Z.; Yang, R.; Feng, P. X.-L. Thermal hysteresis controlled reconfigurable MoS 2 nanomechanical resonators. Nanoscale 2021, 13, 18089–18095
- Ye et al. 2018 Ye, F.; Lee, J.; Feng, P. X.-L. Electrothermally tunable graphene resonators operating at very high temperature up to 1200 K. Nano Letters 2018, 18, 1678–1685
- Davidovikj et al. 2020 Davidovikj, D.; Groenendijk, D. J.; Monteiro, A. M. R.; Dijkhoff, A.; Afanasiev, D.; Šiškins, M.; Lee, M.; Huang, Y.; van Heumen, E.; van der Zant, H., et al. Ultrathin complex oxide nanomechanical resonators. Communications Physics 2020, 3, 163
- Inoue et al. 2018 Inoue, T.; Mochizuki, Y.; Takei, K.; Arie, T.; Akita, S. Tuning of the temperature dependence of the resonance frequency shift in atomically thin mechanical resonators with van der Waals heterojunctions. 2D Materials 2018, 5, 045022
- 34 Lake Shore Ultra-Low Temperature Rox™. \urlhttps://qd-uki.co.uk/lake-shore/temperature-sensors/ultra-low-temperature-rox/, March 16, 2023
- Blaikie et al. 2019 Blaikie, A.; Miller, D.; Alemán, B. J. A fast and sensitive room-temperature graphene nanomechanical bolometer. Nature communications 2019, 10, 4726
- Qian et al. 2016 Qian, Z.; Hui, Y.; Liu, F.; Kang, S.; Kar, S.; Rinaldi, M. Graphene–aluminum nitride NEMS resonant infrared detector. Microsystems & nanoengineering 2016, 2, 1–7
- Sarafraz et al. 2022 Sarafraz, A.; Givois, A.; Roslon, I.; Liu, H.; Brahmi, H.; Verbiest, G.; Steeneken, P. G.; Alijani, F. Dynamics of pressurized ultra-thin membranes. arXiv preprint arXiv:2212.05464 2022,
- Verbiest et al. 2018 Verbiest, G. J.; Kirchhof, J. N.; Sonntag, J.; Goldsche, M.; Khodkov, T.; Stampfer, C. Detecting ultrasound vibrations with graphene resonators. Nano letters 2018, 18, 5132–5137
- Ramos et al. 2021 Ramos, M.; Carrascoso, F.; Frisenda, R.; Gant, P.; Mañas-Valero, S.; Esteras, D. L.; Baldoví, J. J.; Coronado, E.; Castellanos-Gomez, A.; Calvo, M. R. Ultra-broad spectral photo-response in FePS3 air-stable devices. npj 2D Materials and Applications 2021, 5, 1–9
- Dolleman et al. 2018 Dolleman, R. J.; Lloyd, D.; Lee, M.; Bunch, J. S.; Van Der Zant, H. S.; Steeneken, P. G. Transient thermal characterization of suspended monolayer MoS 2. Physical Review Materials 2018, 2, 114008