Prospects of BRICS currency dominance in international trade
Abstract
During his state visit to China in April 2023, Brazilian President Lula proposed the creation of a trade currency supported by the BRICS countries. Using the United Nations Comtrade database, providing the frame of the world trade network associated to 194 UN countries during the decade 2010 - 2020, we study a mathematical model of influence battle of three currencies, namely, the US dollar, the euro, and such a hypothetical BRICS currency. In this model, a country trade preference for one of the three currencies is determined by a multiplicative factor based on trade flows between countries and their relative weights in the global international trade. The three currency seed groups are formed by 9 eurozone countries for the euro, 5 Anglo-Saxon countries for the US dollar and the 5 BRICS countries for the new proposed currency. The countries belonging to these 3 currency seed groups trade only with their own associated currency whereas the other countries choose their preferred trade currency as a function of the trade relations with their commercial partners. The trade currency preferences of countries are determined on the basis of a Monte Carlo modeling of Ising type interactions in magnetic spin systems commonly used to model opinion formation in social networks. We adapt here these models to the world trade network analysis. The results obtained from our mathematical modeling of the structure of the global trade network show that as early as 2012 about 58 percent of countries would have preferred to trade with the BRICS currency, 23 percent with the euro and 19 percent with the US dollar. Our results announce favorable prospects for a dominance of the BRICS currency in international trade, if only trade relations are taken into account, whereas political and other aspects are neglected.
keywords:
Research
1 Introduction
Starting from the Bretton Woods agreements in 1944, the US dollar (USD) was keeping its dominant position in international trade [1]. Naturally, the United Nations (UN) reports world trade transactions between countries in USD [2]. However, in the last years, a clear tendency emerged to perform trade between certain firms or between certain countries in other currencies than USD. Thus, Saudi Arabia considers using Chinese yuan (CNY) instead of USD for the oil sales to China [3]. There are also other multiple indications that the USD dominance in the world trade is decreasing (see e.g. discussions in [4, 5, 6, 7, 8, 9, 10]). As an example, CNY becomes the most traded foreign currency on the Moscow Exchange and surpasses USD [6, 11]. In addition, recently, Brazil and China have allowed themselves to carry out commercial and financial transactions directly in CNY or in Brazilian reais (BRL) without resorting to a conversion into USD [12].
In such an atmosphere of de-dollarization of international trade, Brazilian President Lula’s call, made during his official visit to China in April 2023, to create a new BRICS currency to end the trade dominance of the dollar has aroused great interest and great concern (see e.g., [13, 14]). Thus, it is timely to ask the question of the impact of the creation of such a new BRICS currency on international trade. Considering this, here we present a mathematical analysis of the possible influence of a new BRICS currency, hereafter referred to as BRI, using international trade data. More precisely, we develop a model to determine the mathematical preference of a given country to trade in a specific currency which may be different from USD. Such a mathematical model is built on the World Trade Network (WTN) which is determined from the UN Comtrade database [2] for the period 2010 - 2020. This database gives the volumes of monetary transactions between all the countries during a given year: The money matrix element gives the total amount of commodities, expressed in USD of a given year, exported from the country to the country . These money matrix elements can be used to construct the Markov chain of trade transactions from which the WTN.
At present the complex network description finds useful applications in various fields of science including social networks, World Wide Web, biological networks, brain networks and others (see e.g. [15]). The complex network properties of the WTN have been studied in [16, 17, 18, 19, 20, 21, 22]. The Google matrix method [23, 24] have been applied to the WTN in [25] with the PageRank [26] construction and in [25, 27] with the use of PageRank and CheiRank vectors which characterize import and export flows, respectively. It was shown that PageRank and CheiRank probabilities obtained from the Google matrix allow to analyze a crisis contagion in the WTN [28].
The analysis of the competition between two or three currencies in the WTN requires the development of a new approach compared to previous WTN studies where all transactions are expressed in USD. In the case of two currencies competition (e.g., USD and CNY), the situation is similar to the problem of spin magnetization, e.g. Ising model, or opinion formation on simple lattices and complex networks. Indeed, in spin lattice systems, e.g., a spin up surrounded by spins down has a tendency to turn down, taking the direction of dominant neighboring spins. A similar situation appears also in the problem of opinion formation on simple lattices or complex networks when there is a competition between two opinions or two votes for two different parties. Various models of opinion formation were proposed and investigated (see e.g. [29, 30, 31, 32, 33, 34, 35, 36]). For directed social networks, it was pointed that PageRank weight of nodes (or voters) can play an important role in an opinion formation process [37, 38].
The opinion formation model approach based on PageRank probabilities of complex network nodes [37, 38] has been extended and applied in [39] in order to analyze the trade preferences of world countries to perform transactions in USD or CNY. A trade currency preference (TCP) for a given country, i.e., whether the country would prefer to trade in one or another currency, is determined by two multiplicative factors, namely, the relative trade volume exchanged with its trade partners and the global weight of these partners in the global WTN. The results obtained in [39] show that starting from 2016, the majority of countries in the world would prefer to trade in CNY and no longer in USD as it was the case before 2016. Of course, these results are based solely on the mathematical analysis of the WTN transactions and do not take into account political relations between countries. Also, according to the results obtained from the two currencies model [39], the eurozone (EU) countries are in 2019 on the brink of a USD-to-CNY transition of their trade currency preference. However, EU countries usually perform their internal trade in euro (EUR) which is also the second most traded currency in the world. Consequently, this matter of fact should be taken into account. Alongside, the hypothetical appearance of a new BRICS currency (BRI) implies that the BRICS countries perform trade between them only in BRI. Thus, we model the situation where the international trade is based on three currencies, namely USD, EUR and BRI. We assume that, similarly to the creation of the euro in the eurozone, the composite BRI currency is based on the currencies of the BRICS countries, i.e., the Brasilian real (BRL), the Russian ruble (RUR), the Indian rupee (INR), the Chinese yuan (CNY), and the South African rand (ZAR).
In our mathematical analysis, we determine a TCP for a given country indicating that this country has a structural advantage to trade with other countries in BRI, EUR, or USD. This characteristic TCP is based on the trade flows between countries obtained from UN Comtrade database [2]. Extending the approach of [39], we assume that the trade between two countries can be performed in one of the three currencies BRI, EUR, and USD. We also define three currency seed groups constituted by countries for which the TCP is always the same. The BRICS group is formed by the BRICS countries, i.e., Brazil, Russia, India, China, and South African. The Anglo-Saxon group is formed by Australia, USA, UK, Canada, and New Zealand. The EU9 group is formed by Austria, Belgium, France, Germany, Italy, Luxemburg, Netherlands, Portugal, and Spain. The choice of the 9 EU countries follows the historical and economical analysis [40] which points out their strong inter-relations. Also, the WTN analysis reported in [41] shows a significant strength of this group in the international trade. The number of inhabitants of the Anglo-Saxon and the EU9 groups are comparable, and millions of inhabitants, respectively, whereas the BRICS group encompasses a significant larger population, billions of inhabitants. Let us note that the countries belonging to these 3 currency seed groups never change their TCP. Countries of the BRICS group always prefer to trade in BRI, those of the Anglo-Saxon group always in USD, and those of the EU9 group always in EUR.
The article is organized as follows: the next section presents our 3 currencies model of trade preference using the WTN description of the international trade flows obtained from the UN Comtrade database [2]. Then, the following sections are devoted to the results and discussions.
2 Model description and data sets
In this study, we propose a mathematical model of currency competition in the context of the World Trade Network. The WTN is a directed network representing trades between world countries and is constructed from the UN Comtrade database [2] which describes imports and exports of about products between the world countries and territories. Here, we consider yearly trades between countries for the period 2010-2020. In the WTN, the link denotes an export from the country to the country and its weight is the corresponding exchanged money volume expressed in USD of the considered year. Hence, we note () the total import (export) volume associated to the country . Also, we note the total money volume exchanged in the WTN.
The proposed competition model of currencies is an extended version of the model of two currencies studied in [39], where only USD and CNY were considered. Such a model is similar to opinion formation models applied on social networks to study voting systems coalition formation, strike phenomena (see [33, 34] for reviews) and on numeric social network such that Twitter [37]. Here, we propose a model which takes account of 3 currencies, namely, USD, EUR, and BRI. The TCP of a given country depends, both, on the TCP of the other countries and on the probability to import and export with its partners. We consider two stochastic matrices, and , encoding import and export trade probabilities between all the countries which constitute the WTN. The matrix element () gives the ability of the country to export to (to import from) the country . Also, we define the global import and export trade ability of a country as and , respectively. The TCP of the country is a ternary variable ¢ which takes the values , , and . The ¢ values of the countries belonging to the EU9 group, the Anglo-Saxon group and the BRICS group are kept fixed all along the simulation. For the rest of the world, the TCPs, i.e., either EUR, USD or BRI, are initially randomly affected to the other countries. Hence, the fraction of the world countries initially possess a TCP ¢ with . This initial preparation constitute the step of the Monte Carlo process. Then, we successively pick at random each one of the countries for which we compute the following three trade currency scores
| (1) |
one for each currency , and BRI. In the above equation the sum runs over all the countries excepting the country for which we compute the quantity , the symbol stands for the TCP of the country , and the Kronecker symbol is equal to if , and otherwise. The denominator ensures that the sum of the trade currency scores is equal to 1, i.e., . The factor encodes the relative commercial strength between the country and its direct partner . The factor encodes the global trade capacity of the commercial partner . Accordingly to the values of the three newly computed quantities, , , and , the country TCP possibly changes as it takes the value ¢ such as is the maximal value of the three. Otherwise stated, the TCP associated to country becomes, e.g., , if and . The step of the Monte-Carlo process ends once all the countries have been successively picked and, consequently, may have changed their TCPs. The following steps of the Monte-Carlo process reproduce the step until a steady state is reached. The average final fraction of countries with a TCP ¢ is obtained from Monte-Carlo simulations. Each one of these simulations starts with a random initial distribution of TCPs, i.e., , , and .
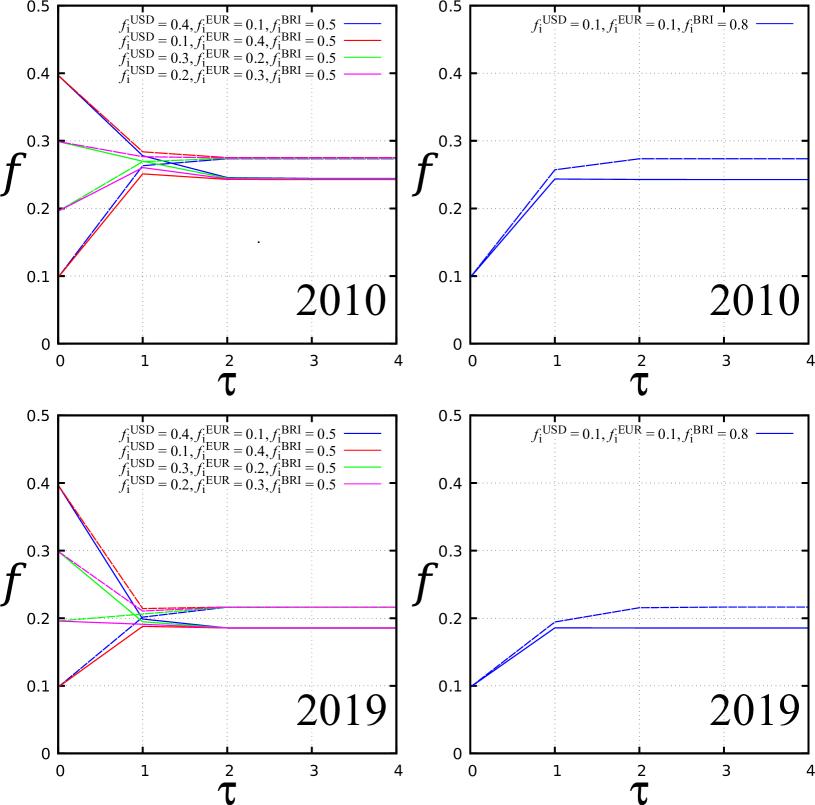
In the appendix, Fig. A1 illustrates the convergence of the simulation. We observe that the fraction of countries with a given TCP converges rapidly after few Monte-Carlo process steps . We checked that whatever are the initial fractions , , and , on average the system reaches always the same steady state characterized by final TCP fractions , , and . As an example, we obtain , , and , in 2010, and , , and , in 2019.
3 Results
Here we present the results obtained from the WTN analysis with the methods described in the previous Section.
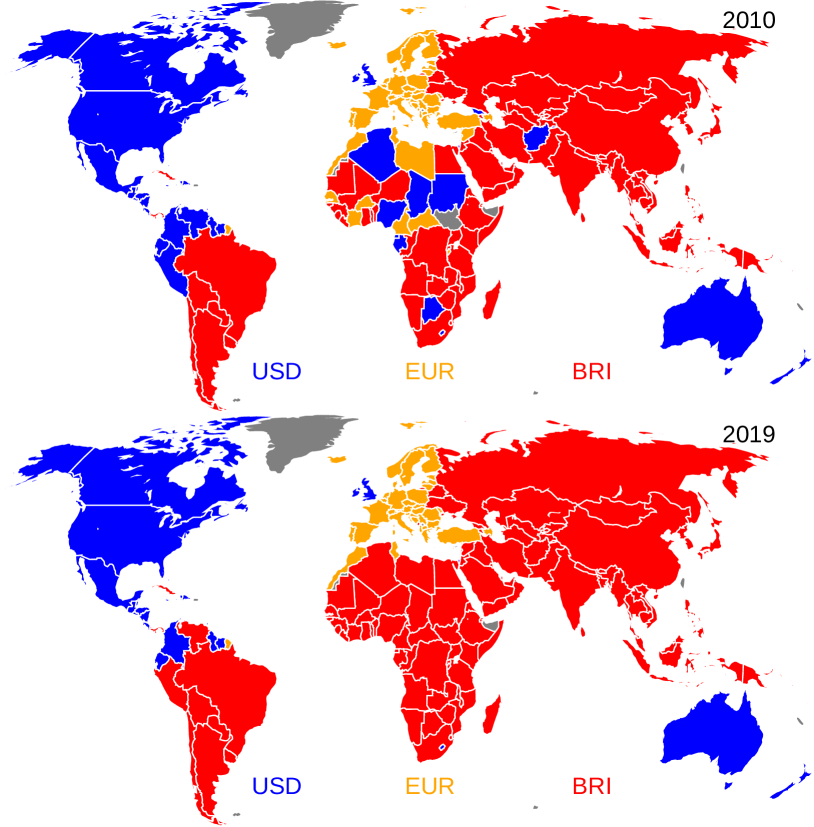
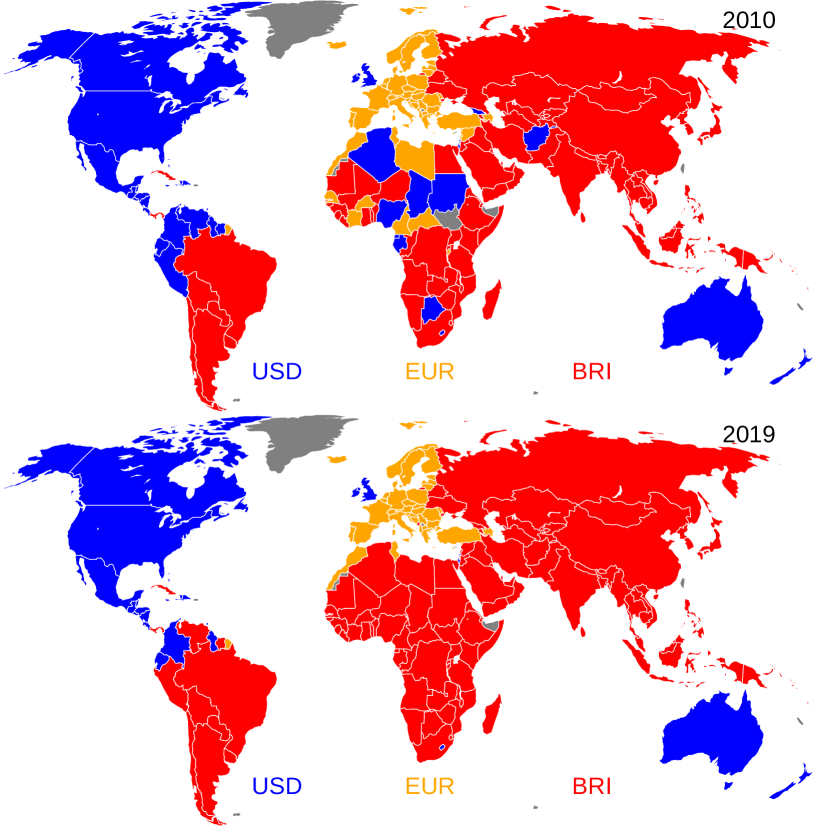
The world map distributions of TCPs, obtained from the Monte Carlo simulations based on the calculation of the trade currency scores (1), are shown in Fig. 1 for years 2010 and 2019. In 2010, the USD TCP is mainly localized in North and Central America (excepting, Cuba and Panama which have a BRI TCP), northern South America, UK, Australia and New Zealand. The EUR TCP is mainly localized in European countries and in countries all around the Mediterranean sea with the exception of Israel and Algeria which have an USD TCP and Egypt which have a BRI TCP. The BRI TCP is located in Asian countries (excepting Afghanistan which have a USD TCP), the countries of the former Soviet Union (excepting Georgia and Azerbaijan which have a USD and EUR TCP, respectively), and the countries of South America (with the exception of the northern countries which have a USD TCP). Apart from the cited exceptions, the distribution of TCPs is quite natural. Indeed, the Americas are divided into a USD block, driven by USA and Canada, and a BRI block driven by Brazil. In Europe, the EUR TCP dominates since the EUR is the official currency of more than 20 countries of the eurozone. Finally, in Asia, the BRI TCP dominates under the influence of China, Russia and India. By contrast, Africa appears fragmented as the 3 TCPs are comparably distributed all over its countries. This image echoes the post-1989 era battle of influence on African affairs of countries such as France, USA, Russia and China. Globally, the countries of the Southern and Eastern Africa have a BRI TCP, whereas the three types of TCP are quite homogeneously distributed in the Northern, Western and Central Africa.
From 2010 to 2019, the EUR group looses 7 countries in Africa but otherwise stays unchanged, and its influence stays focused on the European continent. From 2010 to 2019, the USD group looses its influence completely in Africa (with the exception of the Lesotho) and more mildly in South America where Venezuela and Peru have now a BRI TCP. On the other hand, from 2010 to 2019, the BRI group has spread over almost the entire African continent and has strengthened its influence in northern South America. In 2019, the BRI influence spans mostly over the developing and least developed countries [42] and the USD and EUR influences concern mostly the Western world [43].
By construction, New Zealand and Australia, belonging to the seed countries of the USD group, have always a fixed USD TCP. However, in the 2 currencies model [39], where only USA and China always trade in USD and CNY, respectively, New Zealand and Australia always have a trade preference for CNY instead of USD. We note also close similarities between the EUR group (see Fig. 1) and the swing group observed for 2019 in [39] (see Fig. 4 therein). The swing group in [39] consists in a set of countries which depending on the initial distribution of the TCPs aggregate as a whole to the USD or CNY group. This swing group [39] corresponds to the EUR group presented in Fig. 1 (with the addition of Algeria, Egypt, Ivory Cost, Israel and Jordan).
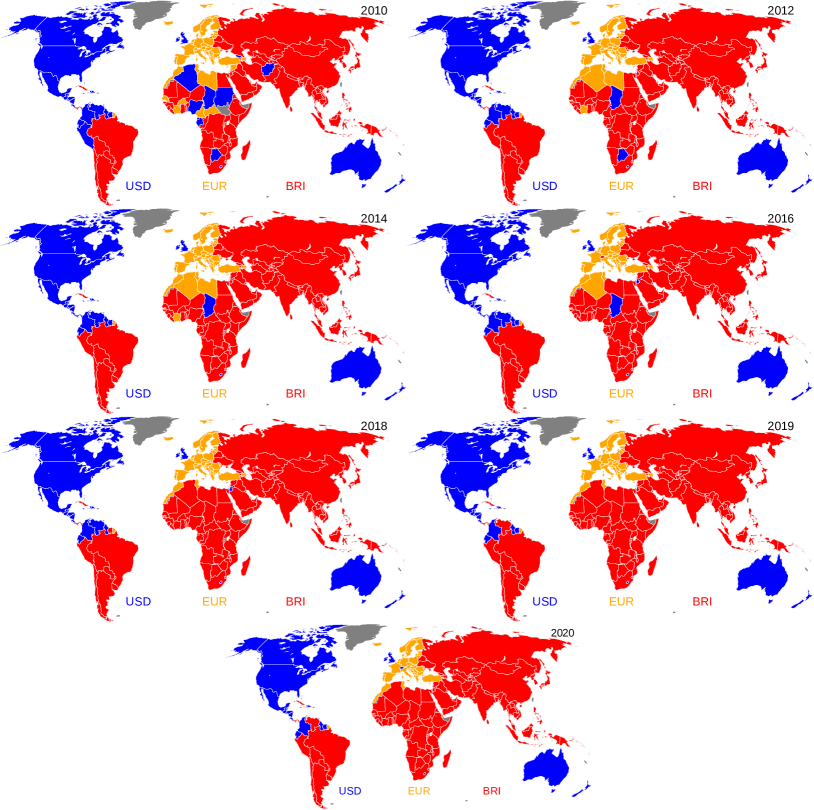
In the appendix, for the sake of completeness, the world distributions of the trade currency preferences for the years 2012, 2014, 2016, 2018 and 2020 are presented in Fig. A2 which shows indeed a progressive expansion of the BRI trade currency preference over the world. Also, Tables A1, A2, and A3 give the countries in the USD, EUR, and BRI groups in 2019.
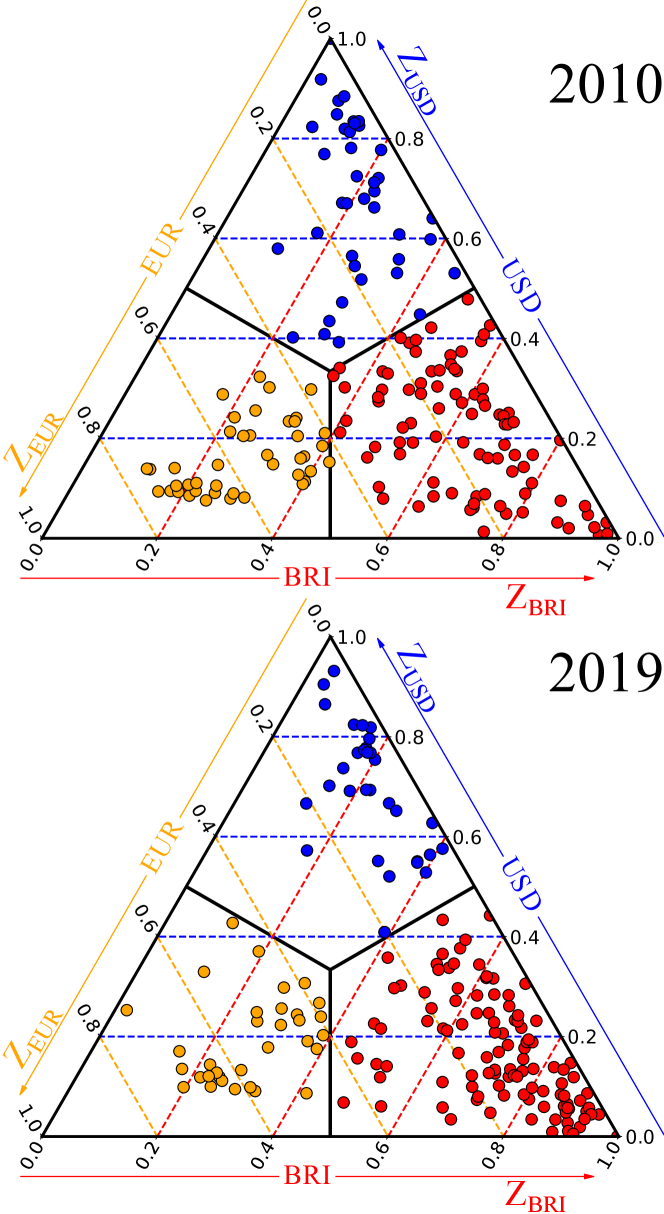
In Fig. 2, the distribution of the countries’ trade currency ternary scores are given for 2010 and 2019. As in Fig. 1, for both years, we observe the BRI group gathers more countries than the EUR and USD groups which have similar sizes (see also Fig. 3 hereafter). From 2010 to 2019, the EUR group is robust with two main clusters: one cluster located in the range , strongly tied to the EUR currency, which mainly gathers Central Europe and Balkan countries, and the other cluster located in the range which mainly corresponds to Nordic countries and Baltic countries with the addition of Poland, Switzerland, Greece, Turkey, Azerbaijan and the African countries which are present in the 2010 world distribution of TCPs (see Fig. 1 top panel). From 2010 to 2019, we observe, on average, a shift of these two clusters towards the BRI group. Moreover, most of the African countries present in the EUR group in 2010 moved to the BRI group in 2019, and, e.g., Switzerland and Turkey are in 2019 located close to the equilibrium point (in the 2020 data, Switzerland has even actually moved into the USD group). Summarizing, a non negligible part of the EUR group countries are on the brink of a transition mainly towards the BRI group. Also during the 2010-2019 period, the countries of the BRI group moved toward larger values of since in 2019 most of the countries are concentrated in the zone. This matter of fact indicates a strong entanglement between economies of the BRI group and, mechanically, a weaker dependence on the countries of the EUR and USD groups. More strikingly, we observe in 2019 that most of the USD and BRI groups countries are located in the zone which suggests that the European countries economies tend to loose their influence on the extra-European economies.
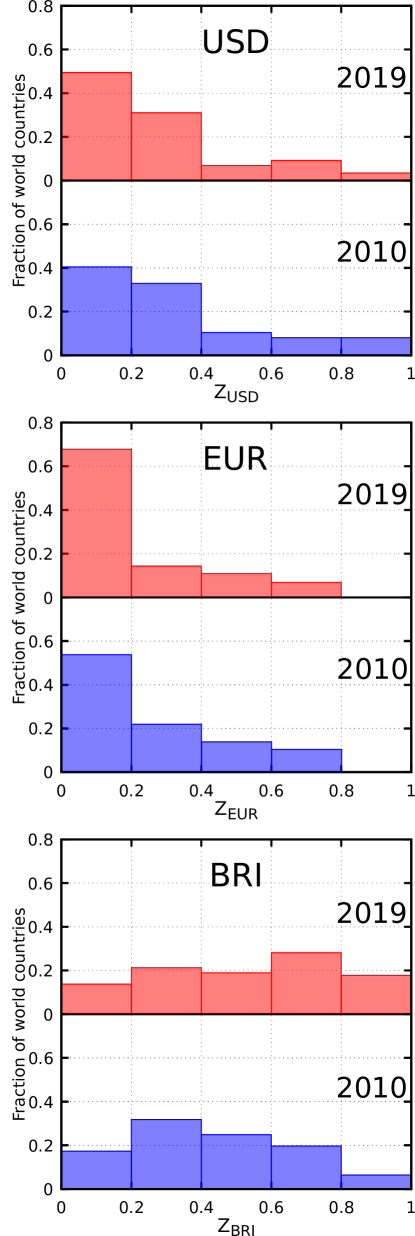
Overall, as shown in Fig. A3 in appendix, the distributions and mainly monotonously decrease with the value of and , respectively. From 2010 to 2019, the lowest range, i.e., , for both distributions, has even increased, and we note that, for both years, no country has a . This fact corroborates the global decline in the influence of the EUR and USD currencies. On the contrary, the distribution is more homogeneous all over the interval with a median which has moved from around in 2010 to around in 2019 indicating an increase of the global influence of the BRI.
We checked that a modification of the centrality metrics, replacing, in the trade currency scores (1), the countries import-export probabilities and by the countries PageRank and CheiRank probabilities obtained from the WTN Google matrix [27, 39], leads practically to the same results (compare Fig. A4 with Fig. 1, the sole differences concern modest size countries, the most visible difference is Suriname which in 2019 has a BRI TCP with the WTN Google matrix and a USD TCP with the present model).
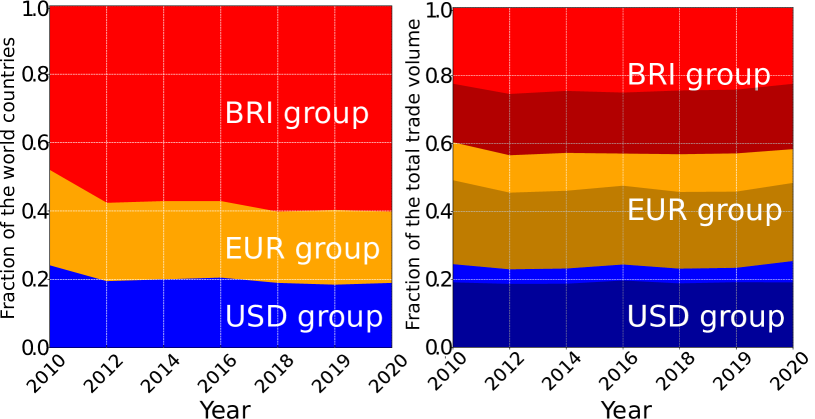
In Fig. 3, we show the evolution of the fractions of countries preferring to trade in USD, EUR, and BRI from 2010 to 2020. In 2020, the BRI group captures 60% of the world countries, the EUR group 21% and the USD group 19%. However, the trade volume of the BRI group countries still remains less than 50% being 42%, with 33% for the EUR group and 25% for the USD group. In fact, the fractions of the international trade volume associated to the USD group and to the EUR group are mainly due to the trade exchanges between developed economies within the Anglo-Saxon group and the EU9 group, respectively (see dark colored bands in Fig. 3 right panel). Also, more than half of the trade volume associated with the BRI group is generated by non-BRICS countries, underlining the fact that the BRI currency is able to influence much more widely than just the BRICS countries, unlike the EUR and USD groups which have little influence beyond their areas of regional and historical influence.
4 Discussion
In this work, we analyzed the competition of three currencies, BRI, EUR and USD, within the international trade. We remind that the BRI currency is supposed to be a new currency pegged to the BRICS countries and proposed recently [13, 14]. For this analysis, we constructed the WTN for years 2010-2020 from the UN Comtrade database [2]. As BRI is supported by BRICS, we assume that a group of Anglo-Saxon countries and the EU9 group support the USD and the EUR currencies, respectively.
Our results obtained from Ising type Monte Carlo extensive numerical simulations show that, the influence of each one of the different currencies is well established in their natural zone of influence. The EUR influence is mainly located in Europe and around the Mediterranean sea. The USD influence concerns the Anglo-Saxon countries (North America, UK, Australia and New Zealand) but also contiguous regions as Central America and the northern of South America. The BRI influence spans over Asia and South America on countries which have strong ties with of Brazilian, Russian, Indian and Chinese economies. While the African continent is fragmented in 2010 between the influence of the three currencies, in 2019 almost all African countries (with the exception of Morocco and Tunisia which have strong historical and economical ties with France) are come under the influence of the BRI. This transition is already well underway in 2012 (see Fig. A2). In 2020, 60% of the countries have a structural trade preference for BRI, 21% for EUR, and 19% for USD. The zone of BRI influence spans from the extended geographical diagonal, from South America to Bering strait and passing by Africa. It encompasses the vast majority of developing and least developed countries. The loss of influence of the USD and the EUR echoes the loss of influence of the economies of the Western world which remain confined to their historical zone of influence. Moreover, some eurozone countries and others geographically close to it, and historically linked to the EUR, are on the verge of falling under the influence of the other two currencies with a strong tropism for the BRI.
Based on the mathematical analysis of the trade currency preference of the countries, taking account of solely the structure of the WTN and disregarding finer geopolitical considerations, our results show that the influence of the BRICS countries on international trade is now significant and opens the way to a possible prospect of domination of a currency supported by the BRICS development bank at the expense of other global currencies such as USD and EUR.
Acknowledgements
We thank the UN Statistics Division to grant us a friendly access to the UN Comtrade database.
Funding
This research has been partially supported by the grant NANOX N∘ ANR-17-EURE-0009 (project MTDINA) in the frame of the Programme des Investissements d’Avenir, France. This research has also been supported by the Programme Investissements d’Avenir ANR-15-IDEX-0003.
Abbreviations
WTN: World trade network; CTP: Currency trade preference; BRICS: Brazil, Russia, India, China, South Africa; UN: United Nations; USD: US Dollar; CNY: Chinese yuan; BRL: Brazilian real; EUR: euro; BRI: BRICS currency; EU: eurozone; RUR: Russian ruble; INR: Indian rupee; ZAR: South African rand.
ISO 3166-1 alpha-2 code for countries:
AF: Afghanistan; AL: Albania; DZ: Algeria; AS: American Samoa; AD: Andorra; AO: Angola; AI: Anguilla; AQ: Antarctica; AG: Antigua and Barbuda; AR: Argentina; AM: Armenia; AW: Aruba; AU: Australia; AT: Austria; AZ: Azerbaijan; BS: The Bahamas; BH: Bahrain; BD: Bangladesh; BB: Barbados; BY: Belarus; BE: Belgium; BZ: Belize; BJ: Benin; BM: Bermuda; BT: Bhutan; BO: Bolivia; BA: Bosnia and Herzegovina; BW: Botswana; BV: Bouvet Island; IO: British Indian Ocean Territory; VG: British Virgin Islands; BR: Brazil; BN: Brunei; BG: Bulgaria; BF: Burkina Faso; BI: Burundi; KH: Cambodia; CM: Cameroon; CA: Canada; CV: Cape Verde; KY: Cayman Islands; CF: Central African Republic; TD: Chad; CL: Chile; CN: China; CX: Christmas Island; CC: Cocos (Keeling) Islands; CO: Colombia; KM: Comoros; CG: Republic of the Congo; CK: Cook Islands; CR: Costa Rica; CI: Ivory Coast; HR: Croatia; CU: Cuba; CY: Cyprus; CZ: Czech Republic; KP: North Korea; CD: Democratic Republic of the Congo; DK: Denmark; DJ: Djibouti; DM: Dominica; DO: Dominican Republic; EC: Ecuador; EG: Egypt; SV: El Salvador; GQ: Equatorial Guinea; ER: Eritrea; EE: Estonia; ET: Ethiopia; FO: Faroe Islands; FK: Falkland Islands; FJ: Fiji; FI: Finland; FR: France; PF: French Polynesia; FM: Micronesia; GA: Gabon; GM: The Gambia; GE: Georgia; DE: Germany; GH: Ghana; GI: Gibraltar; GR: Greece; GL: Greenland; GD: Grenada; GU: Guam; GT: Guatemala; GN: Guinea; GW: Guinea-Bissau; GY: Guyana; HT: Haiti; HM: Heard Island and McDonald Islands; VA: Vatican; HN: Honduras; HU: Hungary; IS: Iceland; IN: India; ID: Indonesia; IR: Iran; IQ: Iraq; IE: Ireland; IL: Israel; IT: Italy; JM: Jamaica; JP: Japan Ryukyu Island; JO: Jordan; KZ: Kazakhstan; KE: Kenya; KI: Kiribati; KW: Kuwait; KG: Kyrgyzstan; LA: Laos; LV: Latvia; LB: Lebanon; LS: Lesotho; LR: Liberia; LY: Libya; LT: Lithuania; LU: Luxembourg; MG: Madagascar; MW: Malawi; MY: Malaysia; MV: Maldives; ML: Mali; MT: Malta; MH: Marshall Islands; MR: Mauritania; MU: Mauritius; YT: Mayotte; MX: Mexico; MN: Mongolia; ME: Montenegro; MS: Montserrat; MA: Morocco; MZ: Mozambique; MM: Myanmar; MP: Northern Mariana Islands; NA: Namibia; NR: Nauru; NP: Nepal; AN: Netherlands Antilles; NL: Netherlands; NC: New Caledonia; NZ: New Zealand; NI: Nicaragua; NE: Niger; NG: Nigeria; NU: Niue; NF: Norfolk Islands; NO: Norway; PS: State of Palestine; OM: Oman; PK: Pakistan; PW: Palau; PA: Panama; PG: Papua New Guinea; PY: Paraguay; PE: Peru; PH: Philippines; PN: Pitcairn; PL: Poland; PT: Portugal; QA: Qatar; KR: South Korea; MD: Moldova; RO: Romania; RU: Russia; RW: Rwanda; SH: Saint Helena; KN: Saint Kitts and Nevis; LC: Saint Lucia; PM: Saint Pierre and Miquelon; VC: Saint Vincent and the Grenadines; WS: Samoa; SM: San Marino; ST: Sao Tome and Principe; SA: Saudi Arabia; SN: Senegal; RS: Serbia; SC: Seychelles; SL: Sierra Leone; SG: Singapore; SK: Slovakia; SI: Slovenia; SB: Solomon Islands; SO: Somalia; ZA: South Africa; GS: South Georgia and the South Sandwich Islands; ES: Spain; LK: Sri Lanka; SD: Sudan; SR: Suriname; SZ: Swaziland; SE: Sweden; CH: Switzerland; SY: Syria; TJ: Tajikistan; MK: Macedonia; TH: Thailand; TL: Timor-Leste; TG: Togo; TK: Tokelau; TO: Tonga; TT: Trinidad and Tobago; TN: Tunisia; TR: Turkey; TM: Turkmenistan; TC: Turks and Caicos Islands; TV: Tuvalu; UG: Uganda; UA: Ukraine; AE: United Arab Emirates; GB: United Kingdom; TZ: Tanzania; UM: United States Minor Outlying Islands; UY: Uruguay; US: United States; UZ: Uzbekistan; VU: Vanuatu; VE: Venezuela; VN: Vietnam; WF: Wallis and Futuna; EH: Western Sahara; YE: Yemen; ZM: Zambia; ZW: Zimbabwe.
Availability of data and materials
The raw data is available from the UN Comtrade database [2]. Additional output data and/or plots of data generated are available upon request.
Competing interests
The authors declare that they have no competing interests.
Authors’ contributions
The authors contributed equally to this work. All authors read and approved the final manuscript.
References
- [1] Wikipedia contributors: Bretton Woods System — Wikipedia, The Free Encyclopedia. [Online; accessed 04.14.2023]. https://en.wikipedia.org/w/index.php?title=Bretton_Woods_system&oldid=1114289262
- [2] United Nations Statistics Division: United Nations Commodity Trade Statistics Database. [Online; accessed 04.14.2023]. http://comtrade.un.org/db/
- [3] Said, S., Kalin, S.: Saudi Arabia Considers Accepting Yuan Instead of Dollars for Chinese Oil Sales. The Wall Street Journal, [Online 03.15.2022; accessed 04.14.2023]. https://www.wsj.com/articles/saudi-arabia-considers-accepting-yuan-instead-of-dollars-for-chinese-oil-sales-11647351541
- [4] Raisinghani, V.: Could China’s Yuan Replace the U.S. Dollar as the World’s Dominant Currency? Financial Post, [Online 09.12.2022; accessed 04.14.2023]. https://financialpost.com/moneywise/could-chinas-yuan-replace-the-u-s-dollar-as-the-worlds-dominant-currency
- [5] Ahmed, S.R.: Can Yuan Replace the ‘mighty’ Dollar? The Business Standard, [Online 09.17.2022; accessed 04.14.2023]. https://www.tbsnews.net/features/panorama/can-yuan-replace-mighty-dollar-reserve-currency-497706
- [6] Global Times writers: Chinese Yuan Becomes Most Traded Foreign Currency on the Moscow Exchange, Surpasses the US Dollar: Report. Global Times, [Online 10.05.2022; accessed 04.14.2023]. https://www.globaltimes.cn/page/202210/1276588.shtml
- [7] Amadeo, K.: How the Yuan Could Become a Global Currency. The balance, [Online 05.15.2022; accessed 04.14.2023]. https://www.thebalancemoney.com/yuan-reserve-currency-to-global-currency-3970465
- [8] Curran, E.: The U.S. Dollar’s Dominance Is Being Stealthily Eroded. Bloomberg, [Online 03.25.2022; accessed 04.14.2023]. https://www.bloomberg.com/news/articles/2022-03-25/the-dollar-s-dominance-is-being-stealthily-eroded-imf-paper
- [9] Liu, Z.Z., Papa, M.: Can BRICS De-dollarize the Global Financial System? Elements in the Economics of Emerging Markets. Cambridge University Press, Cambridge (2022). doi:10.1017/9781009029544
- [10] Nikkei staff writers: Russian Companies Shift to Yuan as Flight from Dollar Accelerates. Nikkei Asia, [Online 09.14.2022; accessed 04.14.2023]. https://asia.nikkei.com/Business/Markets/Currencies/Russian-companies-shift-to-yuan-as-flight-from-dollar-accelerates
- [11] M. Nikoladze and M. Bhusari: Russia and China Have Been Teaming up to Reduce Reliance on the Dollar. Here’s How It’s Going. New Atlanticist, [Online 02.22.2023; accessed 04.14.2023]. https://www.atlanticcouncil.org/blogs/new-atlanticist/russia-and-china-have-been-teaming-up-to-reduce-reliance-on-the-dollar-heres-how-its-going/
- [12] Bradford Betz: Brazil, China Strike Trade Deal Agreement to Ditch US Dollar. FOX Business, [Online 03.29.2023; accessed 04.14.2023]. https://www.foxbusiness.com/markets/brazil-china-strike-trade-deal-agreement-ditch-us-dollar
- [13] J. Leahy and H. Lockett: Brazil’s Lula Calls for End to Dollar Trade Dominance. Financial Times, [Online 04.13.2023; accessed 04.14.2023]. https://www.ft.com/content/669260a5-82a5-4e7a-9bbf-4f41c54a6143
- [14] N. Yeh: Lula Calls for End to Dollar Dominance Ahead of Meeting with Xi Jinping. The China Project, [Online 04.13.2023; accessed 04.14.2023]. https://thechinaproject.com/2023/04/13/lula-called-for-end-to-dollar-dominance-in-shanghai-meets-xi-in-beijing-tomorrow/
- [15] Dorogovtsev, S.: Lectures in Complex Networks. Oxford University Press, Oxford (2010). doi:10.1093/acprof:oso/9780199548927.001.0001
- [16] Serrano, M.A., Boguñá, M., Vespignani, A.: Patterns of dominant flows in the world trade web. Journal of Economic Interaction and Coordination 2, 111–124 (2007). doi:10.1007/s11403-007-0026-y
- [17] Fagiolo, G., Reyes, J., Schiavo, S.: World-trade web: Topological properties, dynamics, and evolution. Phys. Rev. E 79, 036115 (2009). doi:10.1103/PhysRevE.79.036115
- [18] He, J., Deem, M.W.: Structure and Response in the World Trade Network. Phys. Rev. Lett. 105, 198701 (2010). doi:10.1103/PhysRevLett.105.198701
- [19] Fagiolo, G., Reyes, J., Schiavo, S.: The evolution of the world trade web: a weighted-network analysis. Journal of Evolutionary Economics 20(4), 479–514 (2010). doi:10.1007/s00191-009-0160-x
- [20] Barigozzi, M., Fagiolo, G., Garlaschelli, D.: Multinetwork of international trade: A commodity-specific analysis. Phys. Rev. E 81, 046104 (2010). doi:10.1103/PhysRevE.81.046104
- [21] Chakraborty, A., Kichikawa, Y., Iino, T., Iyetomi, H., Inoue, H., Fujiwara, Y., Aoyama, H.: Hierarchical communities in the walnut structure of the japanese production network. PLOS ONE 13(8), 1–25 (2018). doi:10.1371/journal.pone.0202739
- [22] De Benedictis, L., Tajoli, L.: The world trade network. The World Economy 34(8), 1417–1454 (2011). doi:10.1111/j.1467-9701.2011.01360.x. https://onlinelibrary.wiley.com/doi/pdf/10.1111/j.1467-9701.2011.01360.x
- [23] Langville, A.M., Meyer, C.D.: Google’s PageRank and Beyond: the Science of Search Engine Rankings. Princeton University Press, Princeton (2006)
- [24] Ermann, L., Frahm, K.M., Shepelyansky, D.L.: Google matrix analysis of directed networks. Rev. Mod. Phys. 87, 1261–1310 (2015). doi:10.1103/RevModPhys.87.1261
- [25] Ermann, L., Shepelyansky, D.L.: Google matrix of the world trade network. Acta Physica Polonica A 120, 158 (2011). doi:10.12693/APhysPolA.120.A-158
- [26] Brin, S., Page, L.: The anatomy of a large-scale hypertextual Web search engine. Computer Networks and ISDN Systems 30, 107 (1998)
- [27] Coquidé, C., Ermann, L., Lages, J., Shepelyansky, D.L.: Influence of petroleum and gas trade on EU economies from the reduced Google matrix analysis of UN COMTRADE data. Eur. Phys. J. B 92, 71 (2019). doi:10.1140/epjb/e2019-100132-6
- [28] Coquidé, C., Lages, J., Shepelyansky, D.L.: Crisis contagion in the world trade network. Appl Netw Sci 5, 67 (2020). doi:10.1007/s41109-020-00304-z
- [29] Galam, S.: Majority rule, hierarchical structures, and democratic totalitarianism: A statistical approach. Journal of Mathematical Psychology 30(4), 426–434 (1986). doi:10.1016/0022-2496(86)90019-2
- [30] Liggett, T.M.: Stochastic Interacting Systems: Contact, Voter and Exclusion Processes. Grundlehren der mathematischen Wissenschaften. Springer, Berlin (1999). doi:10.1007/978-3-662-03990-8. https://doi.org/10.1007/978-3-662-03990-8
- [31] Galam, S.: Local dynamics vs.ial mechanisms: A unifying frame. Europhys. Lett. 70(6), 705–711 (2005). doi:10.1209/epl/i2004-10526-5
- [32] Watts, D.J., Dodds, P.S.: Influentials, Networks, and Public Opinion Formation. Journal of Consumer Research 34(4), 441–458 (2007). doi:10.1086/518527. https://doi.org/10.1086/518527
- [33] Galam, S.: Sociophysics: a review of galam models. International Journal of Modern Physics C 19(03), 409–440 (2008). doi:10.1142/S0129183108012297. https://doi.org/10.1142/S0129183108012297
- [34] Castellano, C., Fortunato, S., Loreto, V.: Statistical physics of social dynamics. Rev. Mod. Phys. 81, 591–646 (2009). doi:10.1103/RevModPhys.81.591
- [35] Krapivsky, P.L., Redner, S., Ben-Naim, E.: A Kinetic View of Statistical Physics. Cambridge University Press, Cambridge (2010). doi:10.1017/CBO9780511780516
- [36] Schmittmann, B., Mukhopadhyay, A.: Opinion formation on adaptive networks with intensive average degree. Phys. Rev. E 82, 066104 (2010). doi:10.1103/PhysRevE.82.066104
- [37] Kandiah, V., Shepelyansky, D.L.: Pagerank model of opinion formation on social networks. Physica A: Statistical Mechanics and its Applications 391(22), 5779–5793 (2012). doi:10.1016/j.physa.2012.06.047
- [38] Eom, Y.-H., Shepelyansky, D.L.: Opinion formation driven by pagerank node influence on directed networks. Physica A: Statistical Mechanics and its Applications 436, 707–715 (2015). doi:10.1016/j.physa.2015.05.095
- [39] Coquidé, C., Lages, J., Shepelyansky, D.L.: Dollar-yuan battle in the world trade network. Entropy 25(2) (2023). doi:10.3390/e25020373
- [40] Saint-Etienne, C.: Osons l’Europe des Nations. L’Éditions de l’Observatoire, Paris (2018)
- [41] Loye, J., Ermann, L., Shepelyansky, D.L.: World impact of kernel european union 9 countries from google matrix analysis of the world trade network. Applied Network Science 6(1) (2021). doi:10.1007/s41109-021-00380-9
- [42] Wikipedia contributors: Developing Country — Wikipedia, The Free Encyclopedia. [Online; accessed 21-April-2023]. https://en.wikipedia.org/w/index.php?title=Developing_country&oldid=1150364563
- [43] Wikipedia contributors: Western World — Wikipedia, The Free Encyclopedia. [Online; accessed 21-April-2023]. https://en.wikipedia.org/w/index.php?title=Western_world&oldid=1151004097
Appendix
| USD group countries in 2019 | |||||||
|---|---|---|---|---|---|---|---|
| 1. | US | 10. | EC | 19. | GY | 28. | AG |
| 2. | MX | 11. | CR | 20. | BS | 29. | LC |
| 3. | GB | 12. | GT | 21. | HT | 30. | VC |
| 4. | CA | 13. | DO | 22. | FJ | 31. | KN |
| 5. | AU | 14. | HN | 23. | SR | 32. | WS |
| 6. | IE | 15. | SV | 24. | BB | 33. | DM |
| 7. | IL | 16. | NI | 25. | LS | 34. | GD |
| 8. | CO | 17. | TT | 26. | BZ | 35. | NR |
| 9. | NZ | 18. | JM | 27. | CW | 36. | TO |
| EUR group countries in 2019 | |||||||
|---|---|---|---|---|---|---|---|
| 1. | DE | 12. | SE | 23. | MA | 34. | IS |
| 2. | FR | 13. | HU | 24. | LT | 35. | CY |
| 3. | NL | 14. | DK | 25. | RS | 36. | AL |
| 4. | IT | 15. | NO | 26. | HR | 37. | MD |
| 5. | BE | 16. | SK | 27. | LU | 38. | AD |
| 6. | CH | 17. | RO | 28. | EE | 39. | CV |
| 7. | ES | 18. | FI | 29. | TN | 40. | SM |
| 8. | PL | 19. | PT | 30. | LV | 41. | ST |
| 9. | CZ | 20. | SI | 31. | AZ | 42. | PN |
| 10. | TR | 21. | GR | 32. | BA | ||
| 11. | AT | 22. | BG | 33. | MK | ||
| BRI group countries in 2019 | |||||||
|---|---|---|---|---|---|---|---|
| 1. | CN | 30. | PK | 59. | MN | 88. | GA |
| 2. | JP | 31. | OM | 60. | AM | 89. | TJ |
| 3. | KR | 32. | KH | 61. | BN | 90. | SZ |
| 4. | SG | 33. | MM | 62. | CM | 91. | SC |
| 5. | IN | 34. | GH | 63. | VE | 92. | SY |
| 6. | VN | 35. | UZ | 64. | MU | 93. | ME |
| 7. | RU | 36. | LK | 65. | ZW | 94. | NE |
| 8. | AE | 37. | LY | 66. | ET | 95. | SO |
| 9. | MY | 38. | BH | 67. | BF | 96. | SL |
| 10. | TH | 39. | JO | 68. | TG | 97. | KP |
| 11. | BR | 40. | PY | 69. | MR | 98. | GQ |
| 12. | SA | 41. | CI | 70. | AF | 99. | MV |
| 13. | ID | 42. | UY | 71. | KG | 100. | TD |
| 14. | ZA | 43. | MZ | 72. | PG | 101. | BI |
| 15. | PH | 44. | KE | 73. | MG | 102. | BT |
| 16. | CL | 45. | CD | 74. | BJ | 103. | SS |
| 17. | NG | 46. | BO | 75. | GN | 104. | GM |
| 18. | UA | 47. | AO | 76. | ML | 105. | DJ |
| 19. | AR | 48. | ZM | 77. | CU | 106. | SB |
| 20. | IQ | 49. | NA | 78. | YE | 107. | TL |
| 21. | BD | 50. | PA | 79. | UG | 108. | ER |
| 22. | KZ | 51. | MT | 80. | LR | 109. | CF |
| 23. | PE | 52. | LA | 81. | RW | 110. | GW |
| 24. | EG | 53. | SN | 82. | CG | 111. | KM |
| 25. | KW | 54. | TZ | 83. | TM | 112. | VU |
| 26. | DZ | 55. | BW | 84. | MW | 113. | FM |
| 27. | QA | 56. | GE | 85. | MH | 114. | KI |
| 28. | BY | 57. | LB | 86. | PS | 115. | PW |
| 29. | IR | 58. | SD | 87. | NP | 116. | TV |