Geomagnetism and Aeronomy, 2022, Vol. 62, No. 7, pp. 919–923. \ArchiveDOI: 10.1134/S0016793222070076 \Archive \PaperTitle Cyclic Variability in Brightness of the Young Solar Analog BE Ceti \AuthorsN. I. Bondar’1,*, and M. M. Katsova2,** \Keywordsstars: young solar analog — stars: activity — stars: cycle — individual star: BE Cet \Abstract BE Cet is a young solar analog with an age of 0.6 Gyr and a rotation period of 7.655 days. According to chromospheric and photospheric indices, its activity is higher than the solar one. An analysis of photometric data on the time interval between 1977 and 2019 shows the presence of only 6.76 yr cyclic variations in the mean brightness with an amplitude of 0.02 mag. The obtained cycle is 1–2 yr shorter in comparison with the chromospheric cycle determined earlier, whose length was estimated to be 9 or 7.6 yr. Parameters of the cycle, its amplitude and duration change slightly in different epochs. The short-term light variations due to rotational modulation occur with an increase in amplitude up to 0.05 mag near the activity cycle minimum and a decrease in its maximum. Some events of a rapid increase in brightness of 0.2–0.6 mag may be considered as flares. DOI 10.1134/S0016793222070076
1 INTRODUCTION
A study of activity in solar-type stars and its features in objects with an age younger and older than the Sun is important for understanding the evolution of activity and solving some related problems, including the prediction of the level of activity. One of the first stars considered in terms of its physical and photometric parameters as an analog of the Sun is BE Cet (G2.5 V, ). This is a bright star in the solar vicinity located at a distance of 20.4 pc, its age is about 600 Myr (Hardorp, 1978; Cayrel de Strobel et al., 1981; Eggen, 1960; Cutispoto et al., 2003).
The chromospheric activity of the star has been studied since 1966 in the framework of the HK-Project (Baliunas et al., 1995) and is still studied in modern observational surveys of the Mount Wilson (MW) program stars. The value of the -index for BE Cet is 0.35, which is twice higher than that for the Sun. The S-index varies cyclically. Baliunas et al. (1995) found the 9-yr main cycle and also suspected the presence of a long-term trend of 22 yr. Similar results were obtained by Boro Saikia et al. (2018). Analysis of the 36-yr data series performed by Olah et al. (2016) allowed them to determine the presence of the main cycle of 7.6 yr, several short cycles, from 2 to 5 yr, and a long-term trend.
An increase of the S-index is accompanied by a decrease in brightness of BE Cet, that is typical for young stars with a high level of activity. In contrary, the Sun and stars of comparable age demonstrate a correlation between the S-index and the photometric brightness variability (Radick et al., 1998).
A search for the cycles produced by the development of cool spots on the BE Cet surface has been carried out only by Messina and Guinan (2002). The authors constructed a light curve from the photometric data obtained by some observers in 1986–2000 and found a low-amplitude cycle of 6.7 yr, they also did not reveal any other cycles and a long-term trend.
The large series of data on the brightness of the star accumulated in modern photometric catalogs make it possible to continue such studies. This work is aimed to consider the manifestations of activity on the star from the long-term photometric observations, to identify activity cycles, rotational modulation effects, and possible flares. The results of a search for cyclic changes in the light curve combined from the photometric data of 1977–2019 are presented in Section 2, rotational modulation and manifestation of flare activity are considered in Section 3, Section 4 contains conclusions.
2 CYCLIC VARIABILITY OF PHOTOSPHERIC ACTIVITY
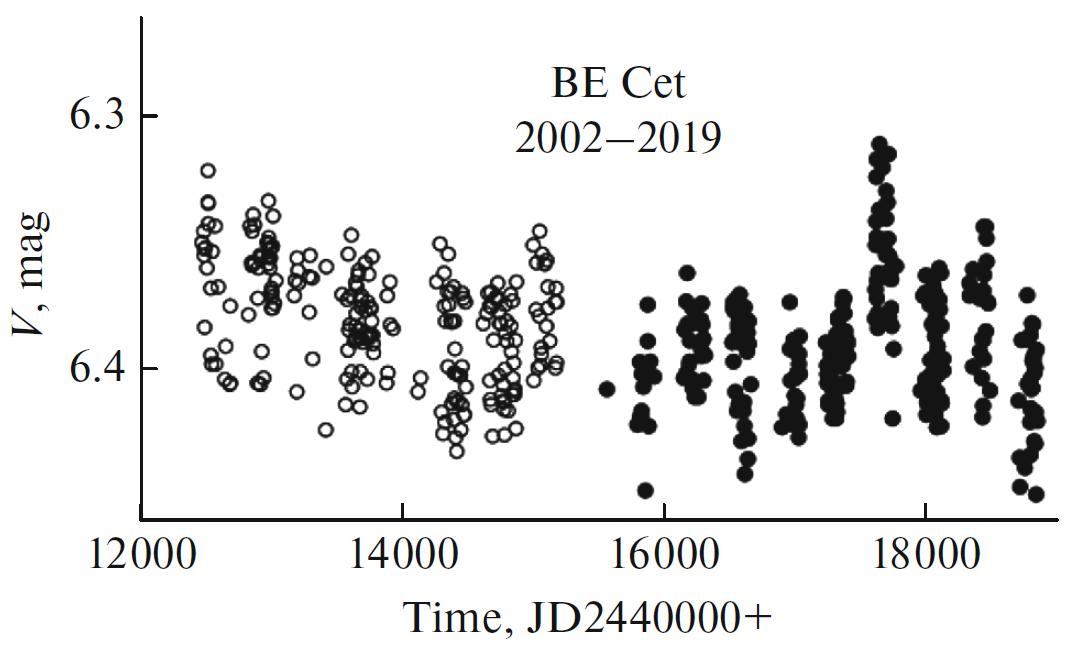
The photometric series considered by Messina and Guinan (2002) covers a 14-yr interval. The conclusions made by the authors about a cycle of 6.7 yr and the absence of the 22-yr trend differ from the results of long-term studies of chromospheric cycles of activity (Baliunas et al., 1995; Boro Saikia et al., 2018; Olah et al., 2016). To clarify whether these differences are due to the duration of the photometric series and to study a stability of the 6.7-yr cycle, we have compiled a new longer and more complete -magnitude dataset on the time interval between 1977 and 2019. We have used the published results and data from the catalogs of wide-field photometric surveys. Data from the All-Sky Automated Survey (ASAS) catalog (Pojmanski, 1997) cover a span of 2002–2009, a sample over 2010–2019 is taken from the Kamogata Wide-field Survey (KWS) catalog [http://kws.cetus-net.org/~maehara/VSdata.py]. The data of both catalogs were refined, rough estimates and measurements with large errors were excluded. The resulting light curve over 2002–2019 consists of several data sets that are separated in time (Fig. 1). Messina and Guinan (2002) provided the mean -values for 24 observational epochs in 1986–2000. We have calculated mean -magnitudes for 29 epochs in 2002–2009 from ASAS and KWS and 3 epochs from the data obtained by Chugainov (1980) in 1977–1978. Some information about the data can be found below in Table 1.
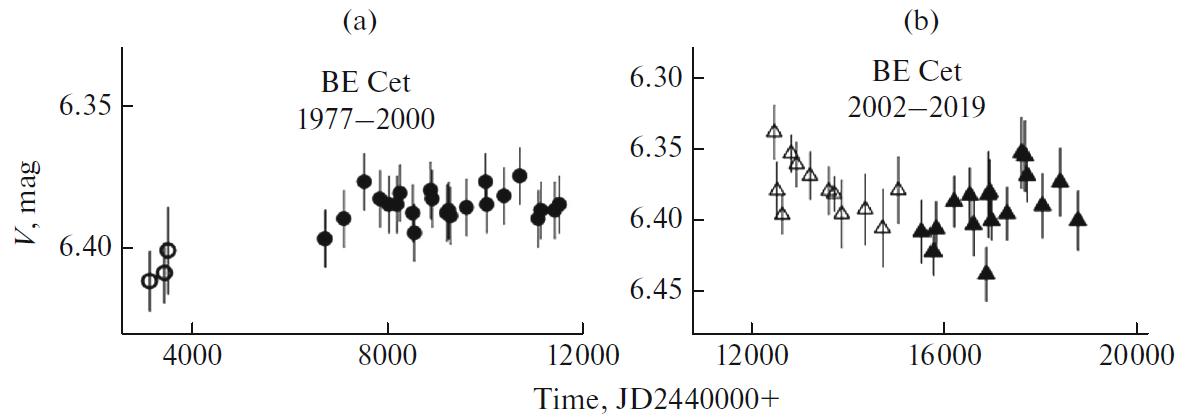
Thus, for further analysis we have obtained 56 values of the seasonal -magnitudes. The standard deviations of photoelectric data are less than 0.01 mag, but wide-field photometry of the stars brighter than 7 mag has large errors caused by saturation. In our case, the standard deviations for reach 0.02 mag, in some epochs increase up to 0.023–0.03 mag. Figure 2 shows changes in brightness of BE Cet from season to season in the years 1977–2000 (Fig. 2a) and 2002–2019 (Fig. 2b). Observations in 1977–1978 performed by Chugainov (1980) are included into consideration to estimate a range of variations in brightness on the long time span.
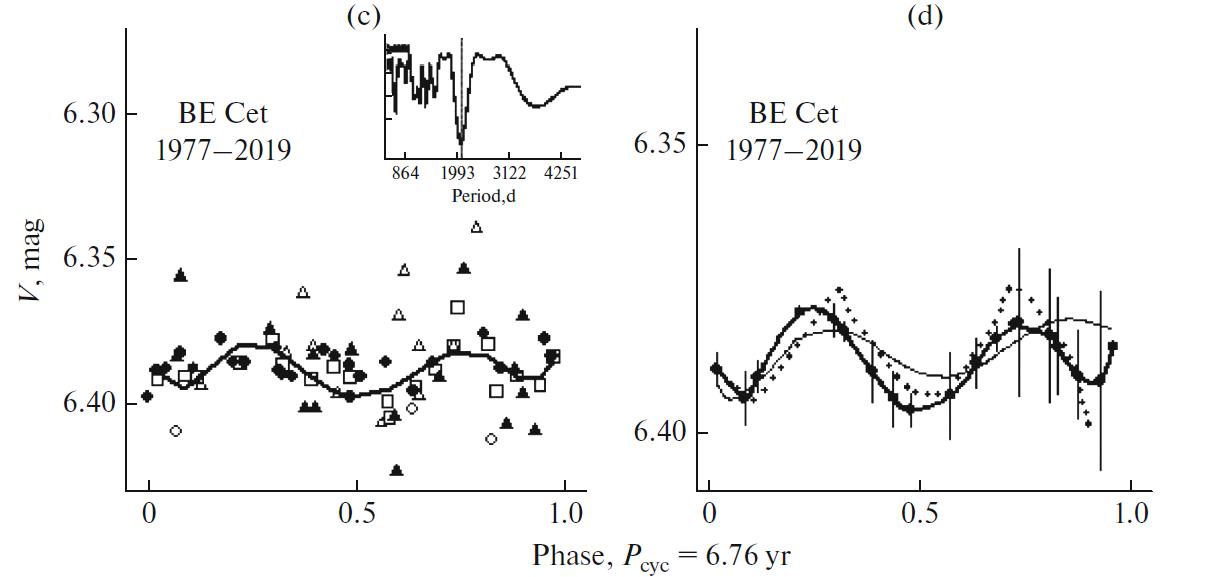
The search for the cycle was carried out for all the data and for the time intervals 1986–2019 and 2002–2019 by the Hartley and Scargle methods using the AVE program (Barbera, 1998). The periodogram in the inset in the Figure 2c shows one significant peak, which corresponds to days or yr with the error . Considering the accuracy of determining the cycle length, its new value does not differ from yr obtained earlier by Messina and Guinan (2002). But the phase and amplitude of the cycle in 1986–2000 some differ from these parameters for the cycle in 2002–2019. The phases are computed with the photometric ephemeris . Figure 2c shows convolutions of all seasonal -magnitudes with the 6.76-yr period and the approximation of data averaged in bins of 0.05 phase by a high-degree polynomial. The data of each time series are indicated by the selected symbols. The cyclic light curves fitted with polynomials clearly shows the phase shift and amplitude differences in different epochs (Fig. 2d). The amplitude of the cycle in 1986–2000 is about 0.02 mag and it slightly increases up to 0.03 mag in 2002–2019. Taking into account that the photometric data over 1977–2000 are more accurate than the catalog data, the problem of stability of the cycle parameters remains topical for further consideration.
3 ROTATIONAL MODULATION AND POSSIBLE FLARES
Low-amplitude periodic variations in brightness of BE Cet with a period of 7.655 d have first been found by Chugainov (1980) from his photoelectric observations in 1977–1978. He explained such changes due to rotational modulation in brightness produced by cool spots on the stellar surface. The results published in the following papers confirm this conclusion. Cutispoto (1991, 1995), Cutispoto at al. (2003) detected the rotational modulation in brightness of this star with an amplitude varying in different epochs from 0.02 to 0.05 mag, sometimes the rotational modulation amplitude did not exceed the observational errors (Stepien and Geyer, 1998).
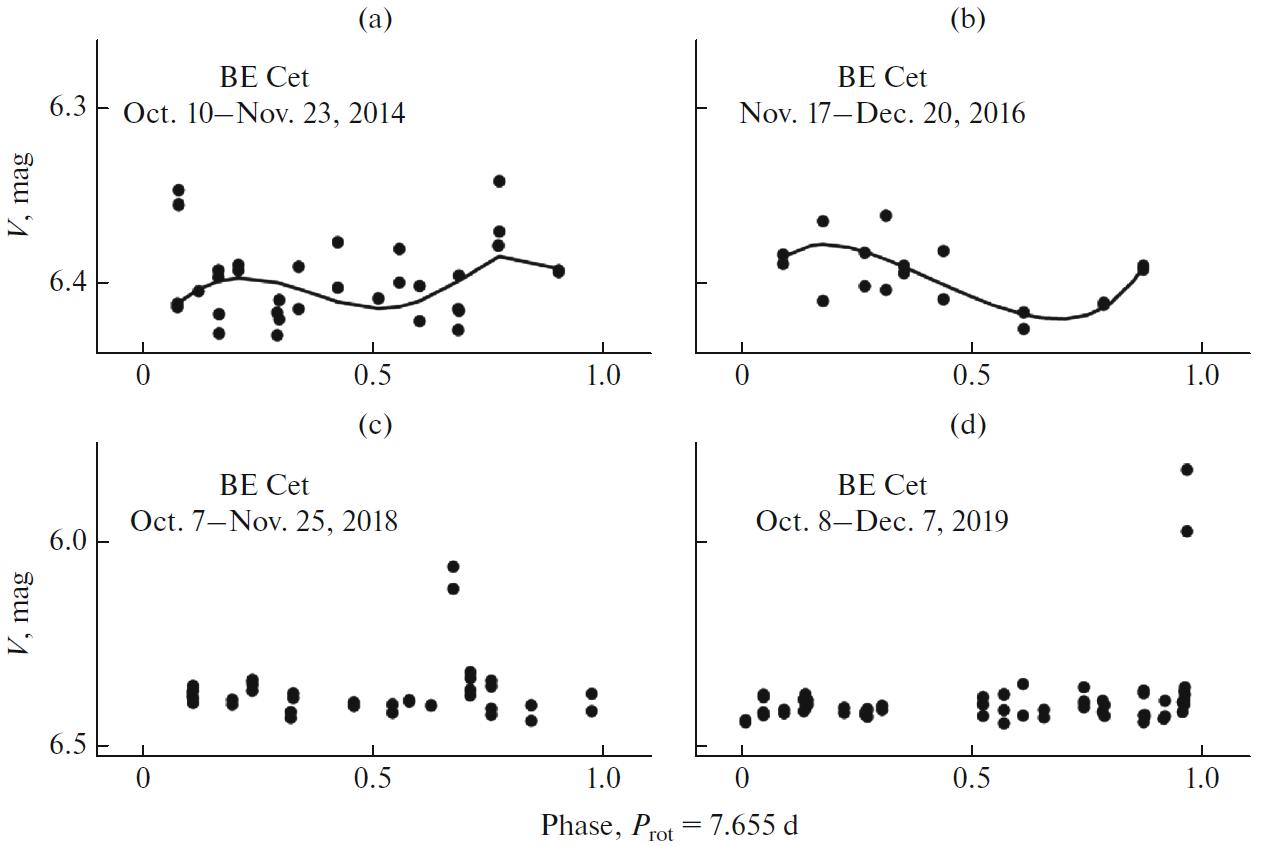
The rotational modulation amplitude is an input parameter for modeling parameters of starspots and their distribution on the surface. We consider the rotational modulation for a series of data from the KWS catalog on the selected time intervals with denser data (Figs. 3a, 3b). Phases are computed with a rotational period of 7.655 days. The light curves are plotted for the intervals near the activity maximum of the star in 2014 and near the brightness maximum (i.e. the minimum of the star activity) in 2016. The rotational modulation amplitude reaches 0.05 mag in epochs near the maximum of brightness, and it decreases up to 0.03 mag at the minimum, which indicates a more uniform distribution of starspots in the epoch close to the maximum activity of the star (Fig. 3b).
Figures 3c, 3d present the series observations for the epochs when the star suddenly becomes brighter by a few tenths of magnitudes. The increasing values of up to 0.2 mag and 0.6 mag were detected from observations in October–December in 2018 and 2019. However, patrol observations allow us only to suppose that these events could be flares, they were detected by a small number of records. As shown by the phase curves, possible flares appear outside the minimum phase, i.e. in the areas distanced from cool spots.
| Source | Time span, yr | Time span JD2440000+ | Number of data () | Number of seasons | Standard deviation | |
|---|---|---|---|---|---|---|
| Chugainov, 1980 | 1977–1978 | 3157–3527 | 50 | 3 | 0.07 | 0.01 |
| Messina et al., 2002 | 1986–2000 | 6741–11552 | 24 | 0.01 | ||
| ASAS | 2002–2009 | 12478–15067 | 230 | 12 | 0.023 | 0.019 |
| KWS | 2010–2019 | 15548–18769 | 276 | 17 | 0.024 | 0.021 |
4 CONCLUSIONS
We have collected all the available photometric data on the time interval 1977–2019, using the published data and obtained from the ASAS and KWS databases to study the photospheric activity of BE Cet produced by starspots. Analysis of the light curve has shown the presence of the 6.76 yr cycle and no manifestation of long-term variability. The amplitude of the cycle is estimated to be 0.02–0.03 mag.
On the entire investigated time interval the peak-to-peak seasonal variations of -magnitudes are in the range of 6.33–6.43 mag, and the yearly mean magnitudes change in the range of 6.35–6.41 or by 0.07 mag. The mean -magnitude on the time span 1986–2000 is 6.38 mag, and on the interval 2002–2019 it is 6.39 mag or remains constant. Our study of photometric behavior of the star has been carried out on a more extended time span than in the research by Messina and Guinan (2002). The obtained results are in good agreement and give reliable evidence for the absence of a long-term trend on the considered time span.
The rotational modulation amplitude varies from season to season and increases in the epochs near the activity cycle minimum (approaching the brightness maximum) up to 0.05 mag.
Surface inhomogeneities on G0–G5 stars are rather difficult to detect by ground-based photometric methods due of their low contrast relative to the surface brightness. BE Cet is the first star of an earlier spectral type than G8, in which BY Dra type variability has been detected (Chugainov, 1980). As follows from our result the star also exhibits flare activity. Patrol observations have detected events of rapid increases in brightness by a few tenths of magnitude, which can be considered as possible optical flares (Bondar’ et al., 2021). We indicated only the events which were confirmed by two or more records. Small number of records and short time of observations about 2 min with a time resolution of 30–35 s are not allow us to determine a duration of flares.
According to the chromospheric activity indices, the star BE Cet, an analog of the young Sun at the age of 600 Myr, belongs to the cool stars with a higher activity level relative to the modern Sun (Radick et al., 2018). The long-term photometric study shows that, unlike the Sun, the duration of the chromospheric activity cycle of the star is 1–2 yr longer than the 6.76 yr cycle caused by the development of starspots.
5 ACKNOWLEDGMENTS
We have used information from the International Variable Star Index (VSX) database supported by AAVSO, Cambridge, Massachusetts, USA, and we are thankful to all the staff providing the replenishment of these databases and access to the All-Sky Automated Survey and the Kamogata–Kiso–Kyoto Wide-Field Survey. The authors would like to thank the referees for useful comments and suggestions.
6 FUNDING
MK acknowledges the support of Ministry of Science and Higher Education of the Russian Federation, grant no. 075-15-2020-780.
7 CONFLICT OF INTEREST
The authors declare that they have no conflicts of interest.
References
- [1] Baliunas, S.L., Donahue, R.A., Soon, W., et al., Chromospheric variations in main-sequence stars. II., Astrophys. J., 1995, vol. 438, pp. 269–287.
- [2] Barbera, R., Analisis de Variabilidad Estelar (AVE code), 1998. http://www.gea.cesca.es.
- [3] Bondar’, N.I., Katsova, M.M. and Shlyapnikov, A.A., Detection of optical flares on the selected G-M dwarfs from long-term photometric series. Geomagn. Aeron., 2021, vol. 61, no. 7, pp. 1069–1074.
- [4] Boro Saikia, S., Marvin, C.J., Jeffers, S.V., et al., Chromospheric activity catalogue of 4454 cool stars. Questioning the active branch of stellar activity cycles, Astron. Astrophys., 2018, vol. 616, p. A108.
- [5] Cayrel de Strobel, G. Knowles, N., Hernandez, G., and Bentolila, C., In search of real solar twins, Astron. Astrophys., 1981, vol. 94, pp. 1–11.
- [6] Chugainov, P.F., New variable star of BY Dra-type: HD 1835, Izv. Krym. Astrofiz. Obs., 1980, vol. 61, pp. 124–126.
- [7] Cutispoto, G., Long-term monitoring of active stars. IV. UBV(RI)c observations obtained at La Silla in December 1989, Astron. Astrophys. Suppl. Ser., 1995, vol. 111, pp. 507–525.
- [8] Cutispoto, G., Long-term monitoring of active stars. VII. UBV(RI)c photometry collected in March 1991, Astron. Astrophys. Suppl. Ser., 1998, vol. 127, pp. 207–215.
- [9] Cutispoto, G., Messina, S., and Rodono, M., Long-term monitoring of active stars. X. Photometry, Astron. Astrophys., 2003, vol. 400, pp. 659–670.
- [10] Eggen, O.J., Stellar groups, VII. The structure of the Hyades group, Mon. Not. R. Astron. Soc., 1960, vol. 120, pp. 540–562.
- [11] Hardorp, J., The Sun among the stars. I. A search for solar spectral analog, Astron. Astrophys., 1978, vol. 63, pp. 383–390.
- [12] Messina, S. and Guinan, E.F., Magnetic activity of six young solar analogues. I. Starspot cycles from longterm photometry, Astron. Astrophys., 2002, vol. 393, pp. 225–237.
- [13] Olah, K., Kovari, Zs., Petrovay, K., et al., Magnetic cycles at different ages of stars, Astron. Astrophys., 2016, vol. 590, p. A133.
- [14] Pojmanski, G., The all sky automated survey, Acta Astron., 1997, vol. 47, pp. 467–481.
- [15] Radick, R.R., Lockwood, G.W., Skiff, B.A., and Baliunas, S.L., Patterns of variation among Sun-like stars, Astrophys. J. Suppl., 1998, vol. 118, pp. 239–258.
- [16] Radick, R.R., Lockwood, G.W., Henry, G.W., et al., Patterns of variation for the Sun and Sun-like stars, Astrophys. J., 2018, vol. 855, p. 75.
- [17] Stepien, K. and Geyer, E., Rotation of solar-like main sequence stars, Astron. Astrophys. Suppl. Ser., 1996, vol. 117, pp. 83–91.