LostPaw: Finding Lost Pets using a Contrastive Learning-based Transformer with Visual Input
Department of Artificial Intelligence
University of Groningen
9747 AG Groningen, The Netherlands
c.a.voinea@student.rug.nl
&
Department of Artificial Intelligence
University of Groningen
9747 AG Groningen, The Netherlands
r.kock@student.rug.nl
&
Department of Artificial Intelligence
University of Groningen
9747 AG Groningen, The Netherlands
m.a.dhali@rug.nl
Abstract
Losing pets can be highly distressing for pet owners, and finding a lost pet is often challenging and time-consuming. An artificial intelligence-based application can significantly improve the speed and accuracy of finding lost pets. In order to facilitate such an application, this study introduces a contrastive neural network model capable of accurately distinguishing between images of pets. The model was trained on a large dataset of dog images and evaluated through 3-fold cross-validation. Following 350 epochs of training, the model achieved a test accuracy of 90%. Furthermore, overfitting was avoided, as the test accuracy closely matched the training accuracy. Our findings suggest that contrastive neural network models hold promise as a tool for locating lost pets. This paper provides the foundation for a potential web application that allows users to upload images of their missing pets, receiving notifications when matching images are found in the application’s image database. This would enable pet owners to quickly and accurately locate lost pets and reunite them with their families.
Keywords contrastive learning neural networks object detection transformers
1 Introduction
Losing a beloved pet can be a traumatic experience for their owners. Pet owners often go to great lengths to find their lost pets. These efforts include posting flyers, searching online, and hiring private investigators. Unfortunately, these methods are often unsuccessful, as it can be difficult to exhaustively search an area, especially when the pets take longer to be found. In addition, one of the challenges of finding lost pets is that they can travel long distances from their homes, especially if they become disoriented or afraid. In many cases, pets that go missing are found a short distance from their homes, often within a few blocks or even just a few houses away. However, it is not uncommon for pets to travel much further, especially if humans or other animals chase them or the smells and sights of new environments attract them. In such cases, owners must overcome additional hurdles to find their pets and thus cannot rely on traditional search methods.
In many situations, owners rely on information from other people who might not have seen the original request for help. Unfortunately, attempts to help in this scenario are often limited, as there are no unified channels that could be accessed both by volunteers and worried owners. In such cases, using artificial intelligence can be especially helpful, as it can analyze images of pets from any location and help identify and reunite them with their owners. However, comparing two images containing pets is not trivial and can most often fool human volunteers.
In recent years, contrastive learning has emerged as a promising solution to the problem of differentiating between two or more input data classes in computer vision (Chen et al., 2020). This approach involves training a machine learning model to identify subtle differences between images by comparing pairs of data samples. This technique has demonstrated notable efficacy in various visual recognition tasks, such as image classification, where models are trained to differentiate between objects or scenes based on visual features.
There are several advantages to using contrastive learning methods. One of the primary benefits is that they allow for the efficient learning of high-dimensional representations of data, as the model is able to learn the relevant features for each class by comparing them to others. Additionally, contrastive learning can be used to understand representations invariant to certain types of transformations, such as rotation or scaling, which can be helpful in tasks such as object recognition. For example, using this approach, a model can be trained on a large dataset of images of various pets by comparing their characteristics to distinguish between them and identify which ones are most likely to be the missing pet. This could save pet owners time and effort in their search for their lost animal and be a valuable tool for animal shelters and other organizations.
A contrastive neural network model leverages latent spaces to analyze and compare pairs of images to identify their similarities and differences. More specifically, by extracting and encoding image features into a high-dimensional space, the model can identify unique patterns and similarities between images, making it possible to distinguish between different breeds and individuals accurately. This technology can potentially revolutionize the way lost pets are found, making it easier for owners to locate their missing companions and reunite with them. Therefore, in this paper, we will delve further into the technical details of such a contrastive neural network model and discuss its potential applications for solving the problem of searching for a lost pet.
2 Related works
Several components are required to create a contrastive learning model capable of differentiating between images of pets. A fundamental part of such a model is a neural network architecture that can learn a robust and effective data representation. In this study, we employed the Vision Transformer model as the foundation of our contrastive learning model. In addition, we used the Detection Transformer model to extract the pets from the images and the AutoAugment feature to augment the images. Finally, to optimize the model, we utilize a contrastive loss function, which allows the model to learn the underlying structure of the data by contrasting similar and dissimilar examples. In the following sections, we provide a more in-depth description of these technologies and their implementation in our contrastive learning transformer model.
2.1 Transformer models
Transformer models are a type of neural network architecture widely successful in various natural language processing tasks and have achieved state-of-the-art results on a large selection of benchmarks (Vaswani et al., 2017). One key feature of transformers is self-attention mechanisms, which allow the model to attend to different parts of the input data at different times while processing it. This allows the model to effectively capture long-range dependencies in the data, which is particularly useful for tasks such as language translation, where the meaning of a word can depend on the context in which it is used.
In addition to self-attention mechanisms, transformers also use multi-headed attention, which allows the model to attend to multiple parts of the input data simultaneously. This allows the model to process the data and improve its performance on tasks such as language translation. Overall, transformers have proven to be a powerful and effective neural network architecture for a wide range of natural language processing tasks and have been applied to a variety of other tasks as well, including image classification and object detection.
2.2 Detection Transformer
The Detection Transformer (DETR) is a set-based object detector that utilizes a Transformer encoder-decoder architecture (Carion et al., 2020). This architecture is designed to be an end-to-end object detector, meaning it can perform object classification and bounding box regression. The model consists of a convolutional neural network backbone, which extracts features from the input image. These features are then flattened and supplemented with a positional encoding before being passed through a Transformer encoder. Finally, the Transformer encoder processes the features and generates a set of feature maps representing the objects in the image.
The output of the Transformer encoder is then passed to a Transformer decoder, which inputs several fixed, learned positional embeddings called object queries. The Transformer decoder attends to the encoder output and generates a set of embeddings, one for each object query. Each embedding is passed through a shared feedforward network that predicts either a detection or a "no object" class. In the case of detection, the model returns the class of the object (e.g., a cat or a dog) and a bounding box that represents where the object is in the image.
2.3 Vision Transformer
Vision Transformer (ViT) is a neural network architecture designed to perform image classification tasks by processing raw pixel values as input rather than using convolutional layers as in traditional image classification models (Dosovitskiy et al., 2021). ViT consists of a series of transformer blocks, each containing a self-attention mechanism. This allows the network to process input tokens in a contextualized manner by weighting the importance of different tokens based on their relationships to other tokens. More specifically, the input tokens are represented by 1616 pixel patches from an image. The transformer blocks are used to process these patches and extract relevant features for image classification. The patches are first embedded into a high-dimensional space using a learned linear transformation and then passed through twelve transformer blocks. Each transformer block takes in a sequence of patches as input and produces a new sequence of patches as output.
As described in the study of Dosovitskiy et al., the output of the transformer blocks is then passed through a linear layer and a softmax function to produce the final class probabilities. ViT is trained using supervised learning, where the ground truth class labels are used to compute the cross-entropy loss and backpropagate the gradients through the model to update the weights. Therefore, it is possible to use a model trained on a classification task to fine-tune ViT for various tasks, such as comparing pairs of images.
2.4 AutoAugment
AutoAugment (Cubuk et al., 2019) is a method for automating the process of data augmentation, which is the practice of applying various transformations to images in a dataset. This step is performed in order to artificially increase the size of the dataset and improve the robustness of machine learning models trained on the given data. AutoAugment formulates the problem of finding the optimal data augmentation policy as a discrete search problem and implements a search algorithm that uses a recurrent neural network as a controller. Given this controller, AutoAugment samples a policy that specifies which image processing operations to use, the probability of using each operation in each batch, and the magnitude of the operations.
The search algorithm is trained using policy gradient methods, which allow the algorithm to update the controller based on the validation accuracy of a neural network trained with the frozen architecture and the sampled policy. As such, various pre-configured AutoAugment policies are available, including various transformation functions that take an image as input and return an altered image. These operations include shear, translation, rotation, and various contrasting colors, brightness, and sharpness adjustments. As such, AutoAugment is an effective way to augment data, which can improve the performance of machine learning models, and is particularly effective for image classification tasks.
2.5 Contrastive loss
Contrastive loss is a loss function commonly used in machine learning models designed for unsupervised learning (Hadsell et al., 2006). It is based on the idea of contrastive learning, where the goal is to learn a representation of the data that captures its underlying structure, such as the relationships between different classes or the differences between similar and dissimilar examples.
Contrastive loss is often used in conjunction with a neural network architecture known as a Siamese network (Koch et al., 2015), a type of network consisting of two or more identical subnetworks that are trained to process different input data. The subnetworks are typically trained using the same weights, which allows them to learn a shared representation of the data. This shared representation is then used to compute the contrastive loss, which is used to update the weights of the network.
As proposed by Hadsell et al., the contrastive loss function can be seen in Equation 1. Here, represents a function that calculates the Euclidean distance between the two vectors representing each pet, and is a contrastive margin that controls how sensitive the model is to marking images as similar. The loss function in this approach minimizes the distance between feature vectors of the same class (i.e., the same pet) while simultaneously maximizing the distance between feature vectors of different classes (i.e., different pets). Furthermore, the loss function ensures that the distance between the feature vectors of dissimilar examples exceeds the margin given by the hyperparameter .
| (1) |
3 Methodology
In this study, we designed a contrastive neural network model to differentiate between pictures of pets. The model was trained on a large dataset of images of various breeds of dogs and was evaluated on a held-out test set of images. The model was implemented using the PyTorch framework Paszke et al. (2017), and we used a combination of supervised learning techniques to train the model. In the following section, we will describe the dataset used for training and evaluation, the model architecture and training procedure, and the evaluation metrics used to assess the model’s performance.
3.1 Dataset
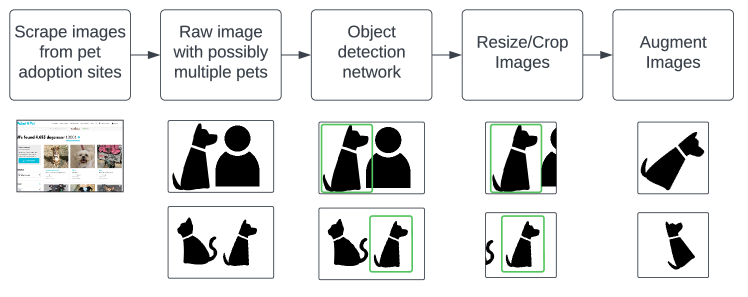
To create the dataset used in this study, we obtained images of pets from adoption websites such as AdoptAPet ado . Each image was fed through the DETR model, and the resulting bounding boxes of pets were used to crop them from the image. For this study, we focused only on images of dogs, resulting in 31 860 pets being stored with an average of 2.47 images per pet (78 702 total images). The cropped images were then resized to fit a square of pixels, and if the image was not wide or tall enough, the missing area was filled with black. Each image was then augmented twice using a pre-trained AutoAugment model, which followed the policies CIFAR10, ImageNet, and SVHN. A test set was created by setting aside images extracted from 3595 pets, with a total of 8854 images. The augmented dataset contained 236 106 train images and 26 562 test images, which were used to train and evaluate the contrastive neural network model developed in this study. For a schematic view of the data pipeline, see Figure 1.
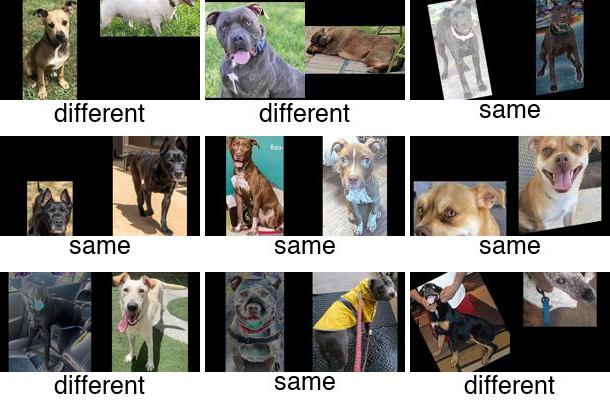
To enable the use of our data for contrastive learning, we needed to further combine the images into pairs, forming a pairwise dataset. Each pair was labeled as either different or same, and contained two images of size . The pairwise dataset was compiled using a random number generator to select labels and images, and a seed value was used to ensure that the dataset is reproducible between runs.
To sample a pair during the dataset generation, we first chose whether the label is same or different based on a similarity probability. A value of 50% was chosen for this probability in order to create an approximately equal number of the same and different pairs. By selecting pairs to be the same or different with equal probability, we ensured that the contrastive ViT model was exposed to a balanced set of training labels. This can help prevent the model from becoming biased towards one type of example or the other and improve the model’s generalization performance on the held-out test set.
Following this, the images for the pair were selected from the cropped image set described earlier. If the label was different, we randomly selected two different pets from the dataset (using the same seed described earlier), and then selected an image for each pet. If the label was same, a random pet was chosen, and the pair of images was made up of two different images of the same pet. Furthermore, as each image in the dataset was augmented twice, we ensure that we never choose two augmentations of the same image. The process of selecting pairs was repeated to generate an extensive set of training pairs for the contrastive ViT model, an example of which can be observed in Figure 2.
As the dataset is dynamically created during the training process, methods to validate a trained model require additional consideration to account for the stochastic nature of the data. In this study, we opt to use -fold cross-validation with the pairwise dataset, where each pair is assigned sequentially to one of distinct folds. Given that one of the folds is used for testing and the remaining ones for training, the model is trained times, with each fold being selected only once for testing. Doing so ensures that the model is not exposed to the same pairs for training and testing. However, since the data is partitioned into folds based on the pairs, there exists a possibility that the same images may be present during training and cross-validation. More specifically, due to the randomized process of selecting a second image, pairs may lead to an image being compared with one that was met before. However, given the great size of the dataset, encountering duplicate pairs is an unlikely outcome during training and cross-validation. Nevertheless, we present additional results on a held-out test set containing completely novel pets to alleviate this issue.
3.2 Model architecture
To develop the contrastive ViT model, we used ViT as the backbone of the model Wu et al. (2020). The output of ViT was flattened, and we appended three fully connected layers to the end of the model, which reduced the size of the output to the desired latent vector size. The last three layers of the contrastive ViT model consisted of two hidden layers and a final output layer. The hidden layers contained twice the number of neurons as the size of the latent space, while the final output layer contained the same number of neurons as the size of the latent space. These layers were used to transform the output of the ViT backbone into a compact representation of the data that captured the underlying structure of the image. The ELU activation function was used between the final layers to allow the propagation of negative values, which might become available during the use of the contrastive loss function. For a graphical overview of the model architecture, see Figure 3.
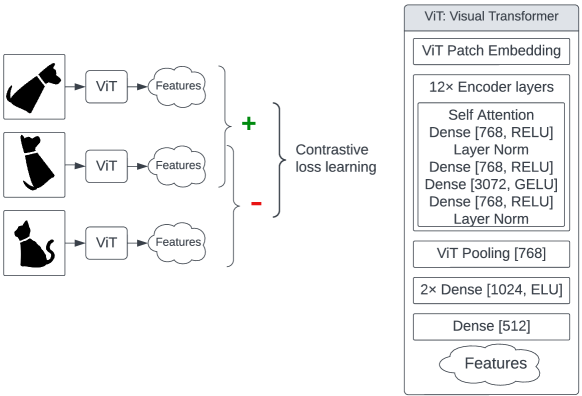
During training, only the last three layers of the model were fine-tuned, while the backbone parameters were kept frozen. While this may lead to limitations in the ability of the model to learn new lower-level features, it results in a more stable training process. Furthermore, this reduces the risk of overfitting the data due to the fewer parameters being optimized. To support our decision to freeze the backbone, we conducted an ablation study where the entire network parameters, including the ViT backbone, were updated during training. The results of this study indicated a significant decrease in performance, which is discussed in detail in the Results section.
The hyperparameters for the contrastive ViT model were chosen through an empirical process of parameter sweeps. This involved training the model with a range of different values for each hyperparameter and then evaluating the model’s performance on a validation set. By comparing the results of the different runs, we were able to identify the values of the hyperparameters that resulted in the best performance. This process allowed us to fine-tune the model and ensure it achieved the best possible performance in differentiating between pictures of pets. Table 1 shows a list of these hyperparameters.
| Name | Value |
|---|---|
| Epochs | 350 |
| Latent Space Size | 512 |
| Batch Size | 8 |
| Batch Count per Epoch | 128 |
| Test Batch Size | 8 |
| Test Batch Count | 128 |
| Optimizer | AdamW |
| Learning Rate | 5.0e-5 |
| Weight Decay | 2.0e-4 |
| Contrastive Margin | 1.66 |
3.3 Evaluation metrics
As we briefly described earlier, we used -fold cross-validation to evaluate the performance of the contrastive learning model. This is a standard method for evaluating machine learning models that help to mitigate the risk of overfitting. In -fold cross-validation, the training data is divided into subsets, or folds, and the model is trained times, each time using subsets for training and the leftover subset for testing. This allows the model to be evaluated on various test sets, which helps provide a more robust estimate of its generalization performance.
In our study, we used for our cross-validation, which resulted in 3 different models being trained and evaluated. We trained the model for a fixed number of epochs for each fold and used the validation set to tune the model’s hyperparameters. Once the model was trained, we evaluated it on the test set and recorded its performance in terms of accuracy, the type I and type II errors, as well as the score. The type I error represents the proportion of false positives, while the type II error represents the probability of false negatives. Using these values, we calculate the precision and recall of our model, which are used to obtain the score value (see Equation 2). The precision and recall values represent the performance of the classification model on the given dataset.
Precision is the proportion of true positive predictions out of all positive predictions made by the model and measures how accurate the model is when it predicts positive instances. A high precision score indicates that it is usually correct when the model predicts a positive instance. Recall, on the other hand, is the proportion of true positive predictions out of all actual positive instances in the dataset, and measures how well the model is able to detect all positive instances in the dataset. A high recall score indicates that the model is able to identify most of the positive instances. Finally, the score, as described in Equation 2, is a harmonic mean of the precision and recall values. It combines precision and recall into a single score that represents the model’s overall performance. By examining these metrics, we were able to get a more detailed understanding of the model’s performance.
| (2) |
After evaluating the model on each of the three folds, we averaged the test metrics to obtain a final score indicating whether our method is overfitting to the provided data. This allowed us to get a more reliable estimate of the model’s generalization performance.
4 Results
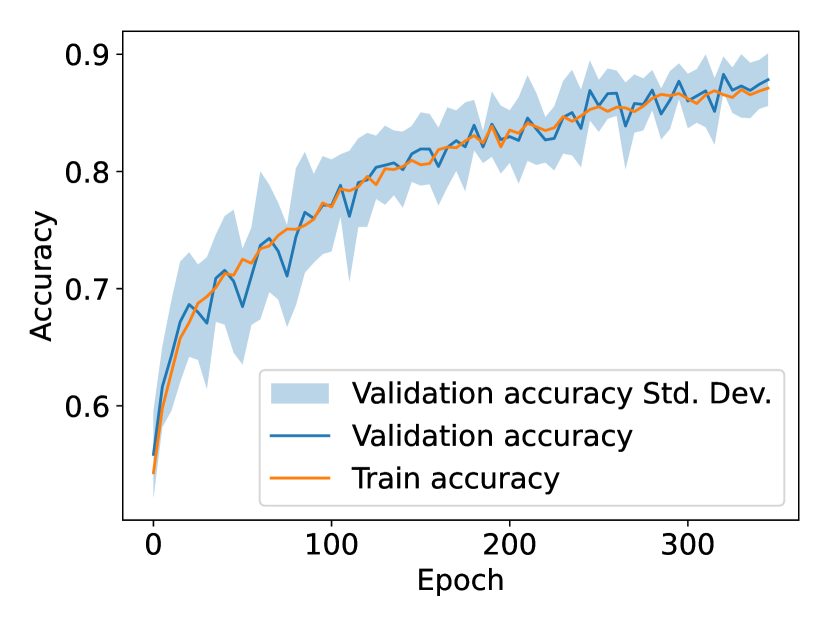
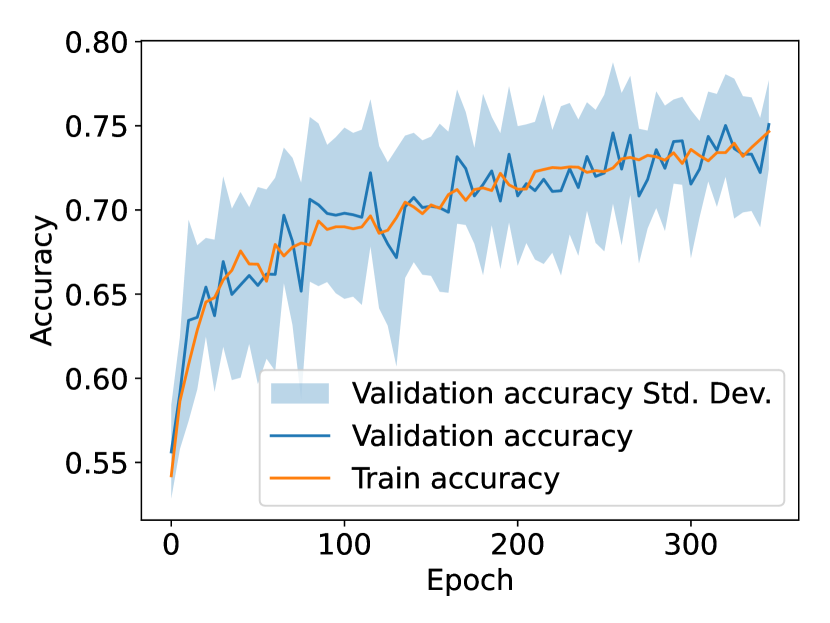
As described earlier, we used 3-fold cross-validation to evaluate the performance of our contrastive learning model. Similarly, a held-out test set was used to assess the model’s generalizability. Throughout 350 epochs, an average score of 88.8% on the cross-validation set was achieved. In addition, the model was trained on a large dataset and did not appear to be overfitting, as the validation accuracy closely followed the training accuracy (see Figure 4(a)).
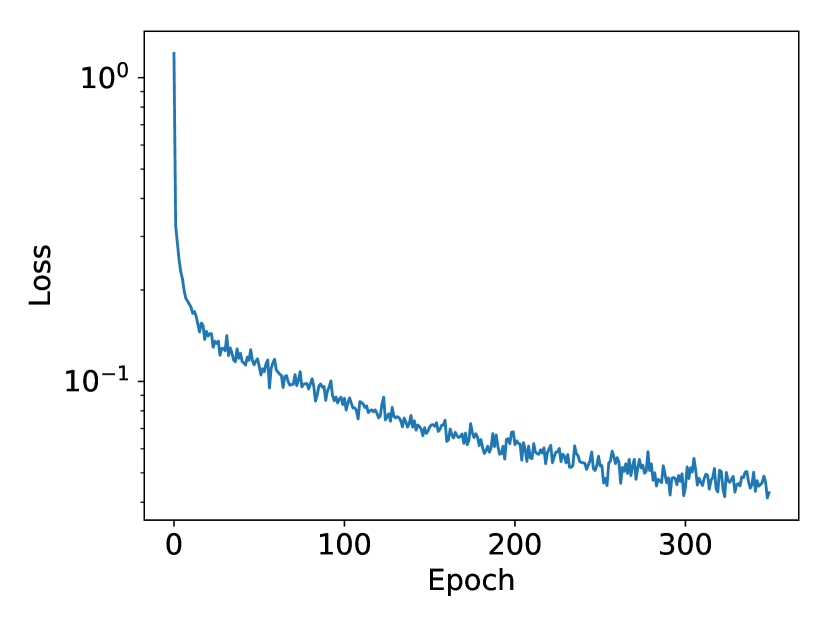
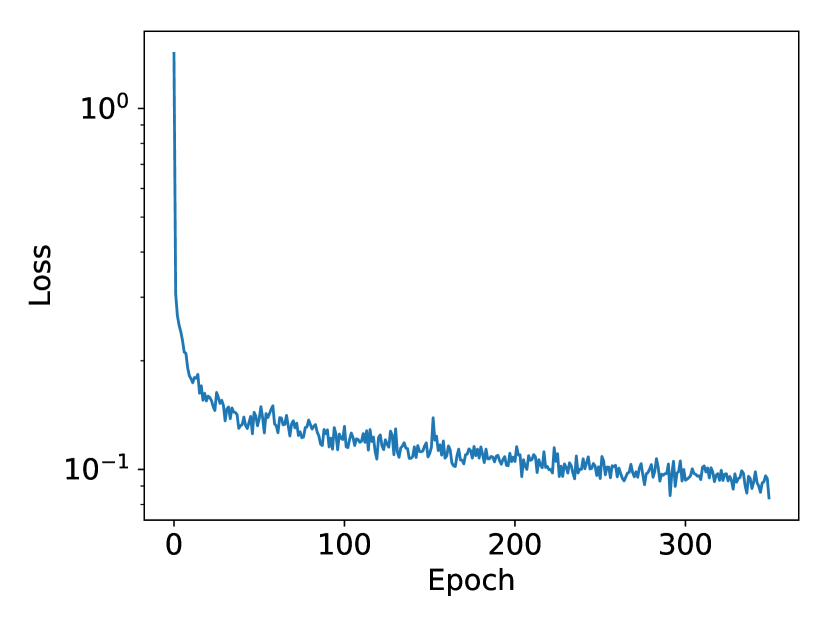
In addition to the accuracy results, we further examined the loss values of the model during training (see Figure 4(b)). We observed that the loss value steadily dropped from a starting value of approximately 1.16 to a final value of approximately 0.04. This trend generally indicates the model is steadily learning a better representation of the data throughout training. Furthermore, the low loss value suggests that the model was able to learn an adequate representation of the data, which could potentially allow the model to make accurate decisions on unseen samples.
When examining the errors of the model (see Figure 5), we observed that the model initially classified every pair of pet images as the same pet. However, over the course of training, the model learned to differentiate between different pets, and the type I error decreased. Furthermore, the type II error was very close to zero for most of the training period. These results suggest that the model could learn a robust and relatively effective representation of the data, which could distinguish between different pets.
| Dataset | ||||
|---|---|---|---|---|
| Metric | Training | Cross-val. | Held-out | Held-out std. |
| Accuracy | 0.8687 | 0.8737 | 0.9028 | 0.0036 |
| Type I error | 0.1309 | 0.1261 | 0.0966 | 0.0036 |
| Type II error | 0.0004 | 0.0002 | 0.0006 | 0.0003 |
| score | 0.8838 | 0.8880 | 0.9108 | 0.0041 |
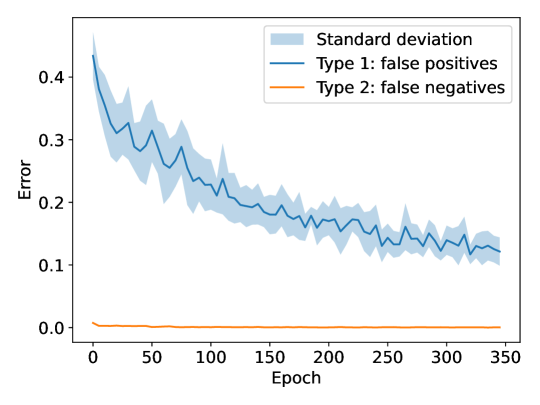
When examining the outcomes of the models on the held-out test set, as illustrated in Table 2, we noted that the average score was 91.1% (SD=0.41%). Similarly, the mean type I error was 9.7%, and the type II error was 0.06%. These outcomes indicate an improvement over the metric values recorded on the train and validation sets. This may be attributed to a variety of reasons, which are discussed in detail in the subsequent section. However, the results still suggest that the model has effectively generalized to new data.
Furthermore, during the ablation study, we observed that a fully-trained contrastive ViT model achieved a cross-validation score of 80.0% and a held-out test set score of 78.6%. This provides strong support for our decision to set the layers of the backbone model as fixed. In particular, the model appears to overfit the data more than it does with frozen layers since the held-out test set performance is inferior to the validation performance. For more results of the ablation study, see Figure 6 in Appendix A.
5 Discussion and conclusions
In this study, we trained a contrastive neural network model to differentiate between pictures of dogs and evaluated its performance on a held-out test set. The results of the 3-fold cross-validation have shown that the contrastive learning model can differentiate between pictures of pets with acceptable accuracy and can generalize to unseen data. In the following section, we will discuss the results of the evaluation in more detail, as well as the potential implications of these results for the use of artificial intelligence in the search for lost pets.
One issue with the results is the comparatively high number of false positives. While this might initially seem like a negative aspect of the model’s performance, it could be beneficial in finding lost pets. Suppose there are only a relatively small number of missing pets in a given area at any given time. In that case, a high rate of false positives may not be a significant issue, as these can easily be dismissed.
Another issue to consider is the use of the AutoAugment feature, which sometimes inverts the color of the pet images. While this could potentially skew the training and testing accuracy, it could also lead to better generalization. By introducing variations in the color of the images, the model may be able to learn more robust features that are less sensitive to changes in the appearance of the images. This could help the model to perform better on real-world data that may contain variations in color and lighting conditions.
A potential issue has been observed in the accuracy metrics of the model, where the cross-validation accuracy and held-out test set accuracy are higher than the training accuracy, which requires further investigation. The higher cross-validation accuracy may be a result of random fluctuations around the true accuracy, as the two accuracies frequently cross each other during training, as depicted in Figure 4(a). The reason for the improvement of over 1% in the performance of the held-out test set compared to the cross-validation set is uncertain. This discrepancy could be attributed to the data distribution or the reduced number of pets in the held-out test set. However, it is worth noting that adequate measures have been taken to eliminate any systematic errors that could have influenced the observed performance gains.
One potential direction for future research would be to expand the network to include other types of pets. This could be done by first using DETR to identify which pet is present in the image (e.g., a cat or a dog). Once the image has been identified as containing a specific pet, it could be passed through a separate fine-tuned model that is specialized in comparing pets within each class. This approach would allow the network to take advantage of the strengths of both the DETR and ViT models and could lead to a more robust model due to having more contrastive data available.
Similarly, while this study focused on a specific dataset of dog images, the contrastive learning approach described in this paper can also be applied to other datasets. By training on a diverse set of images, the model can learn to differentiate between various classes of images, which could be useful in multiple applications beyond pet identification. For example, the contrastive ViT model could be applied to the classification of medical images, the identification of wildlife species, or the comparison of handwriting styles. The potential use cases are numerous, and the results of this study suggest that contrastive learning can be an effective tool for improving the accuracy of image classification models.
References
- Chen et al. (2020) Ting Chen, Simon Kornblith, Mohammad Norouzi, and Geoffrey Hinton. A simple framework for contrastive learning of visual representations. In Hal Daumé III and Aarti Singh, editors, Proceedings of the 37th International Conference on Machine Learning, volume 119 of Proceedings of Machine Learning Research, pages 1597–1607. PMLR, 13–18 Jul 2020. URL https://proceedings.mlr.press/v119/chen20j.html.
- Vaswani et al. (2017) Ashish Vaswani, Noam Shazeer, Niki Parmar, Jakob Uszkoreit, Llion Jones, Aidan N Gomez, Łukasz Kaiser, and Illia Polosukhin. Attention is all you need. Advances in neural information processing systems, 30, 2017.
- Carion et al. (2020) Nicolas Carion, Francisco Massa, Gabriel Synnaeve, Nicolas Usunier, Alexander Kirillov, and Sergey Zagoruyko. End-to-End Object Detection with Transformers. In Andrea Vedaldi, Horst Bischof, Thomas Brox, and Jan-Michael Frahm, editors, Computer Vision – ECCV 2020, Lecture Notes in Computer Science, pages 213–229, Cham, 2020. Springer International Publishing. ISBN 978-3-030-58452-8. doi:10.1007/978-3-030-58452-8_13.
- Dosovitskiy et al. (2021) Alexey Dosovitskiy, Lucas Beyer, Alexander Kolesnikov, Dirk Weissenborn, Xiaohua Zhai, Thomas Unterthiner, Mostafa Dehghani, Matthias Minderer, Georg Heigold, Sylvain Gelly, Jakob Uszkoreit, and Neil Houlsby. An Image is Worth 16x16 Words: Transformers for Image Recognition at Scale, June 2021.
- Cubuk et al. (2019) Ekin D Cubuk, Barret Zoph, Dandelion Mane, Vijay Vasudevan, and Quoc V Le. AutoAugment: Learning Augmentation Strategies from Data. In 2019 IEEE/CVF Conference on Computer Vision and Pattern Recognition (CVPR), pages 113–123. IEEE Computer Society, 2019.
- Hadsell et al. (2006) R. Hadsell, S. Chopra, and Y. LeCun. Dimensionality Reduction by Learning an Invariant Mapping. In 2006 IEEE Computer Society Conference on Computer Vision and Pattern Recognition (CVPR’06), volume 2, pages 1735–1742, June 2006. doi:10.1109/CVPR.2006.100.
- Koch et al. (2015) Gregory Koch, Richard Zemel, Ruslan Salakhutdinov, et al. Siamese neural networks for one-shot image recognition. In ICML deep learning workshop, volume 2. Lille, 2015.
- Paszke et al. (2017) Adam Paszke, Sam Gross, Soumith Chintala, Gregory Chanan, Edward Yang, Zachary DeVito, Zeming Lin, Alban Desmaison, Luca Antiga, and Adam Lerer. Automatic differentiation in PyTorch. 2017.
- (9) AdoptAPet: Search for local pets in need of a home. https://www.adoptapet.com/, last visited: 28 April 2023.
- Wu et al. (2020) Bichen Wu, Chenfeng Xu, Xiaoliang Dai, Alvin Wan, Peizhao Zhang, Zhicheng Yan, Masayoshi Tomizuka, Joseph Gonzalez, Kurt Keutzer, and Peter Vajda. Visual Transformers: Token-based Image Representation and Processing for Computer Vision, 2020.
Appendix A Ablation study results
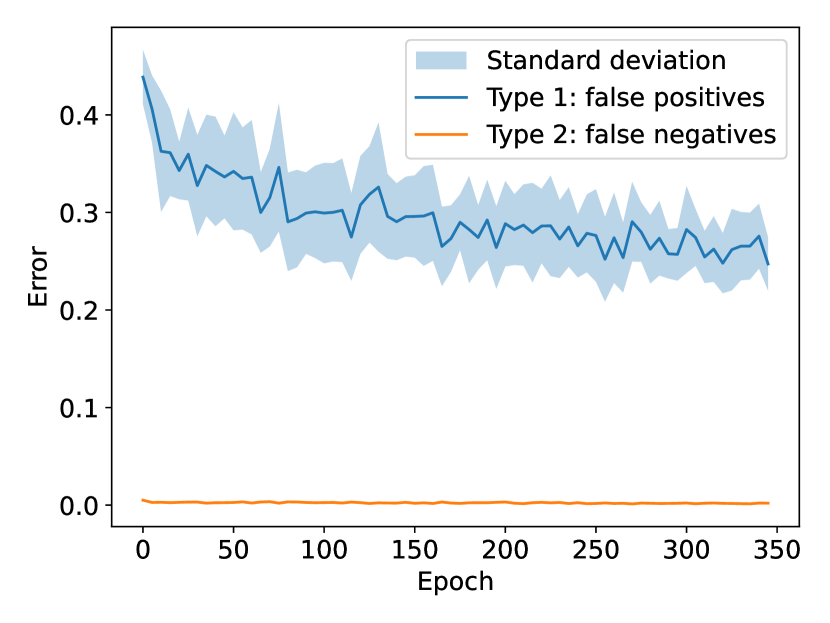
As described in Section 4, an ablation study was performed where the entire ViT model was trained alongside the final layers using the contrastive loss function. Although the results obtained from this experiment were inferior to those obtained with the fixed layers, it is still interesting to examine the model’s performance in more detail.
Comparing these results to those obtained with the fixed layers, we can see that the fully-trained model has a higher type I error rate and a lower score on both the cross-validation and held-out test sets. This indicates that the fully-trained model is overfitting the data to some extent, which is expected given the increased flexibility of the model. Overall, the results of the ablation study support our decision to use a fixed ViT backbone with contrastive learning. This approach appears to be more effective at learning a robust representation of the data and generalizing to new samples, as demonstrated by the superior performance of the fixed layers model on both the cross-validation and held-out test sets.
Appendix B Model demonstration
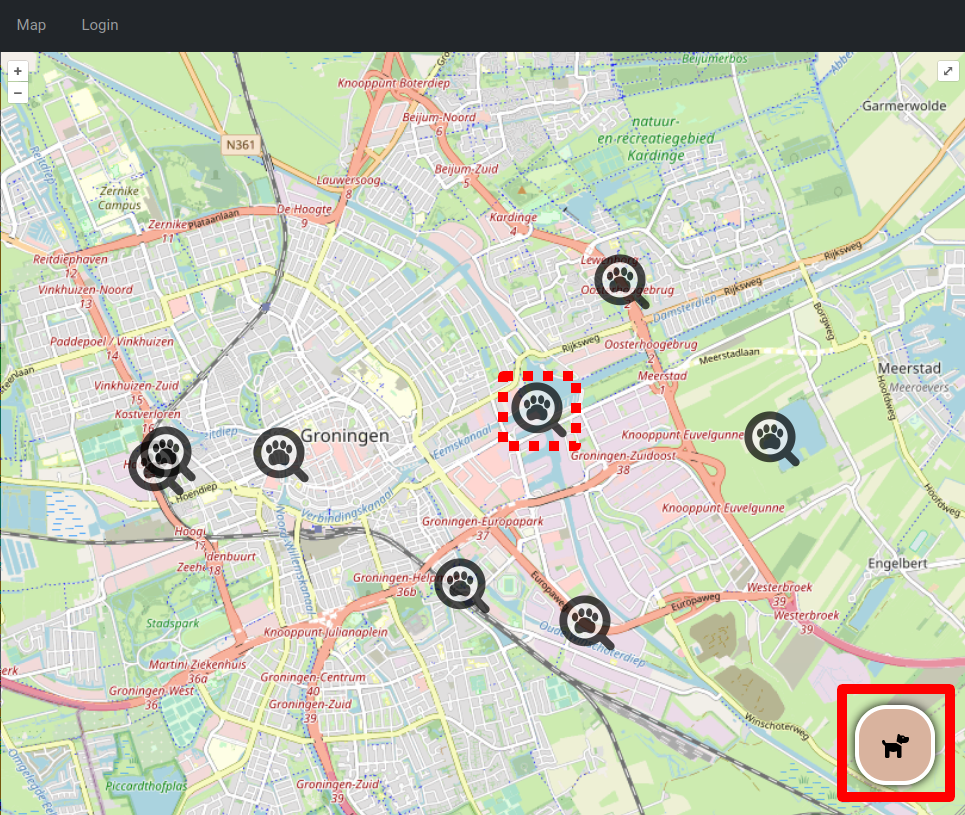
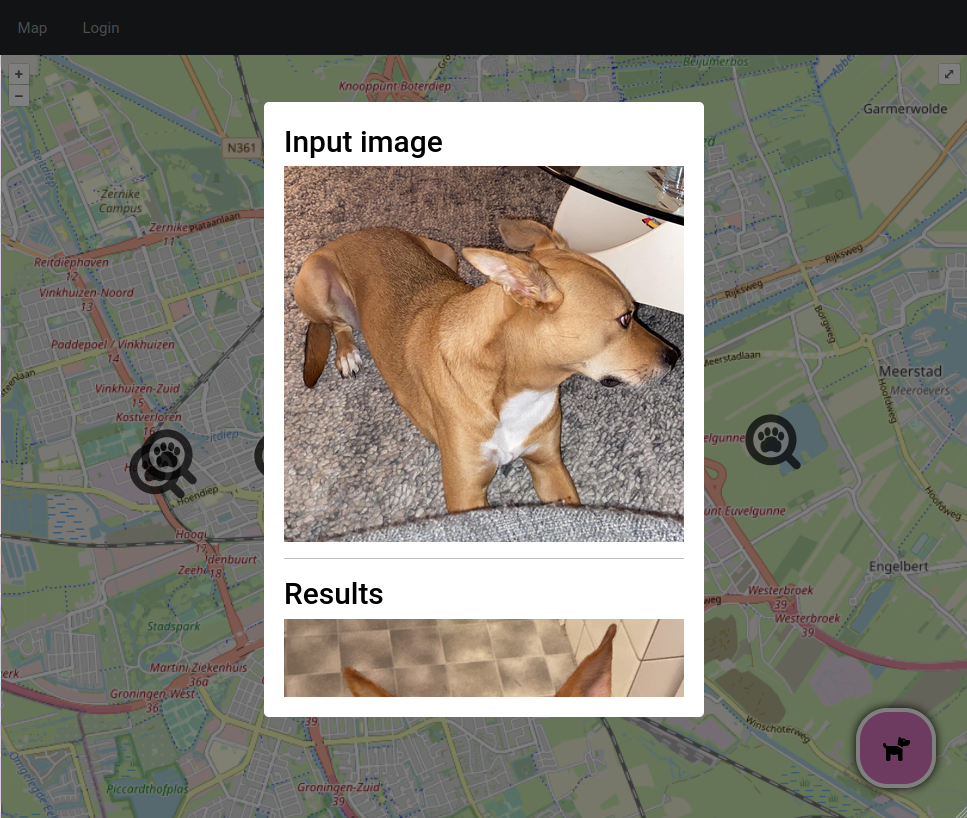
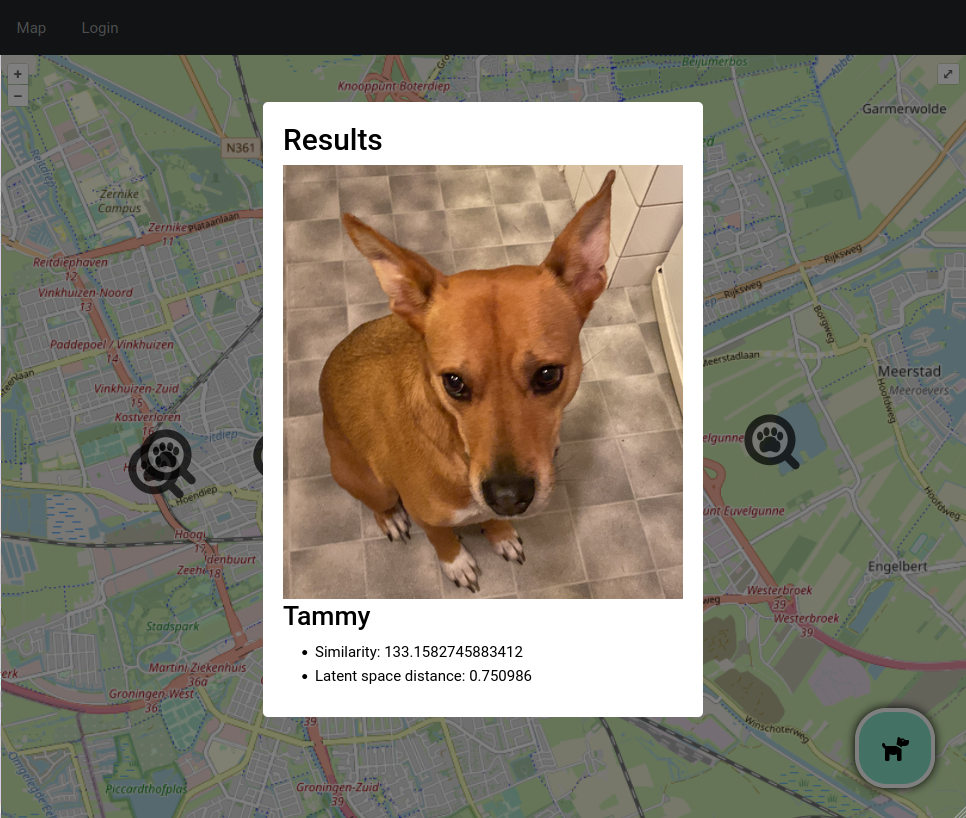
To make the contrastive learning model available to a broader audience, we developed a web application that allows users to upload pictures of dogs and discover whether there are any similar dogs found in the system. The web application is built using a combination of HTML, CSS, and JavaScript and is designed to be easy to use and accessible from any device with a web browser. To use the web application, users need to visit the website and follow the prompts to upload an image of a pet. Once the image has been uploaded, the web application processes the image using the contrastive learning model and returns a list of pets along with their similarity score. For code availability, please follow the following link: https://github.com/vandrw/lostpaw-transformer. We provide screenshots and a description of typical user interaction in Figure 7.
In addition to providing predictions about the similarity of pets, future implementations of such an application can restrict the area of search to a particular area. Similarly, users could search for pets based on their breed, size, or other criteria. Such features can be helpful for users looking to adopt or find a lost pet. Overall, the web application is a convenient and easy-to-use tool that leverages the power of contrastive learning to help users identify and find pets.