Recreational Mobility Prior and During the COVID-19 Pandemic
Abstract
The COVID-19 pandemic and the resulting economic recession negatively affected many people’s physical, social, and psychological health. Parks and green spaces may have ameliorated the negative effects of the pandemic by creating opportunities for outdoor recreation and nature exposure, while other public activities and gatherings were restricted due to the risk of disease transmission. Estimating the frequency of park visitations from aggregated mobility data of all the parks in Washington State (USA), we study trends in park use one year prior to and two years during the COVID-19 pandemic. Our findings indicate that the gravity model is a robust model for the park visitation behavior in different spatial resolutions of city level and state level and different socio-economical classes. Incorporating network structure, our detailed analysis highlights that high-income level residents changed their recreational behavior by visiting their local parks more and a broader recreational options outside of their local census area; whereas the low-income residents changed their visitation behavior by reducing their recreational choices.
Introduction
Parks and recreation systems connect residents and visitors to nature, provide opportunities to stay healthy and improve well-being, and promote social gathering and building communities [1, 2, 3]. The importance and benefits of parks on mental and physical health have been shown in various studies across the world [4, 5, 6, 7]. Having information about park visitation and usage is an important first step for policymakers to be able to address and plan for fair and equitable access to parks [3]. During the COVID-19 pandemic, indoor social gatherings and other recreational activities carried a serious risk of disease transmission in most communities, and therefore many public locations were forced to close as a safety precaution. Meanwhile, parks and green spaces provided comparatively low-risk environments, and anecdotal evidence indicated that park usage increased in 2020 [8, 9, 10]. Several recent studies on the impact of the pandemic on park visitation have concluded different observations. A global analysis of park visitation patterns using data collected primarily from Google’s Community Mobility Reports [11] showed that park visitation has increased since February 2020, compared to visitor numbers prior to the COVID-19 pandemic [8]. Other studies, such as [12] showed a 14% decline in urban park visitation during the pandemic, based on a study of US urban parks using data from SafeGraph [13]. In [8] authors conducted a longitudinal study of Instagram posts from 100K users (1,185 green spaces) in four Asian cities and showed a 5.3% surge during the pandemic. Suse et al.[14] also used Instagram data to show that there are contrasting observations across 4 US metropolitan cities and argued more contextual information is needed to explain the differences. Despite its importance, little attention has been given to understanding and modeling the statistical and structural patterns of park visitations and how these patterns have been changed in regards to seeking nature and recreational opportunities during large societal phenomena such as the COVID-19 pandemic.
In a broader domain of literature, human mobility has been studied in the past decades [15] from various perspectives. Existing large-scale mobility studies have applied state-of-the-art models—such as the gravity law [16, 17], the radiation model [18] and others [19, 20, 21] to seek understanding of city structure [22, 23, 24, 25, 26], epidemics [27, 28, 29], and visitation patterns [30].
In order to improve our understanding of park visitation, here we seek to model park visitations into the underlying statistical and structural patterns of travel distance over a period of two years. To do so, we borrow tenets from mobility literature and apply the state-of-the-art mobility model based on the Gravity Law that has successfully modeled mobility by concentrating on the spatial dependence of population flows. The gravity model has been widely applied in the past with great success in modeling the mobility behavior of people across the city in different contexts such as transportation [16, 31], migration [32] and most recently smart mobility such as dock-less bicycles [33, 34]. In this study, we analyze large-scale longitudinal park visitation data from a year prior to the COVID-19 pandemic and one year during. Our data is based on the aggregated mobility data from mobile phones which captures the visitation count of 3,665 parks and recreational sides of different sizes and functionalities across the state of Washington, USA. Our analysis makes the following actionable insights for researchers and the community of practitioners: On one hand, we show that the statistics of park visitation obey the general gravity model and is robust with variations on population-related parameters (i.e., socio-economic level of visitors), spatial-related parameters (i.e., size of the city) and a temporal-related parameter (i.e., seasons). We also show that the gravity model exhibits different parameters pre and during pandemic for different socio-economic groups of the population. Simply put, our results indicate that park visitation behavior for lower-income level class exhibited the least changes during the pandemic, however, this change is a function of random variation and is not predictable. Furthermore, for the higher income level class we observe more pronounced changes in park visitation behavior during the pandemic which can be explained as the shorter distance visitations have increased at a greater rate. Comparing parks in different spatial city groups indicates that the visitation pattern for parks located in large cities experiences a change opposite to the one that the visitation pattern for parks located in small cities. In larger cities, the behavioral change has focused on a reduction in visitations to further distant parks, and in smaller towns behavior has changed towards an increase in further afield visitations.
Our analysis of modeling park visitation as a network structure shows that the in-degree distribution of parks is power-law, both pre and during the pandemic. Moreover, we find a linear association related to both changes in visitor diversity (in-degree of parks) and the recreational propensity of residents (out-degree of census blocks) due to the pandemic. The higher the socio-economic level of the census block, the less change in their recreational propensity, maintaining a larger set of recreational options throughout the pandemic. Finally, from the park perspective, we observe that the larger parks exhibited a greater positive change in the diversity of visitors, and parks that were more popular (measured as visitor density) prior to the pandemic exhibited a drop in the diversity of visitors during the pandemic.
Gravity Model as the Robust Park Visitation Model in Washington State
We aim to study the park visitation behavior by the examples of parks in Washington State and how it changes during the COVID-19 pandemic. In particular, we want to understand how the pandemic affects the behavior of different socio-economical and spatial groups in terms of park visitation. In doing so, the first step is to find the general pattern that park visitation obeys. The gravity model in its general form asserts that the number of visits from the origin (i) to destination (j), noted as , is proportional to the number of visitors leaving the origin , , the attractiveness of the destination j, , and finally, there is a decreasing function, f(c), in terms of the cost of the visit, c. The gravity model can be formulated as Equation 1.
| (1) |
The gravity model is more general than other state-of-art visitation models, such as the radiation model [18] and the Intervening opportunities model [20] as all these models are special variants of the gravity model by choosing the proper cost function, f(c) [15]. Therefore, we consider park visitation obeys the gravity law and tune the parameters of a general gravity model in a way that fits the park visitation patterns.
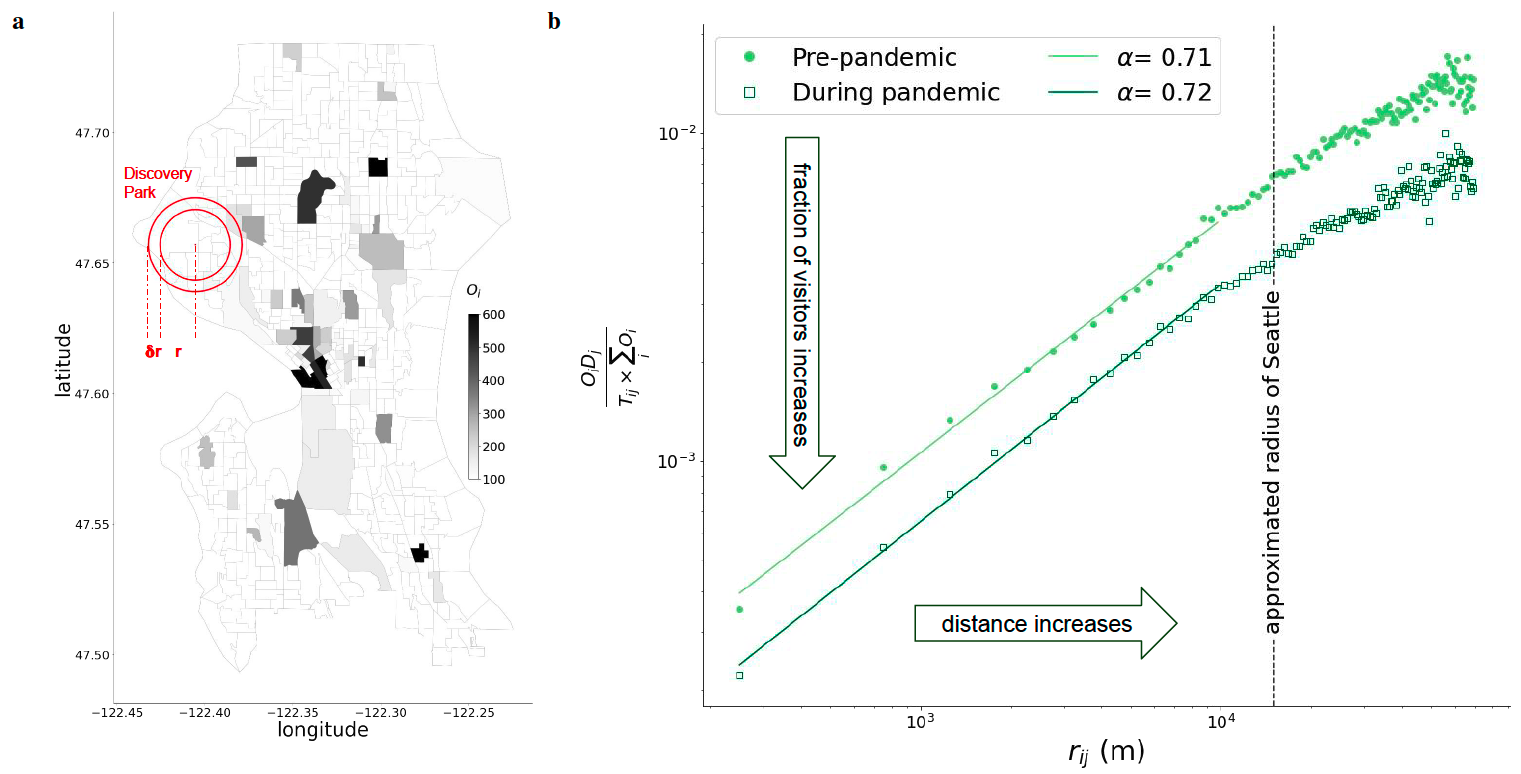
To explore the park visitation patterns, we consider the home census block group (CBG) of a visitor, , as its orientation, and the park it is visiting, , as the destination. The home census block group for a visitor is the CBG the visitor spends most of the nighttime hours there (see Materials and Methods). Our data is spatially aggregated, with the number of visitors originating from the as . In addition, each has number of total visits from origins. Since the number of visits from to the , , depends on the distance between them, we need to calculate the distance between each pair of CBG and park. The distance between and , , is considered as the geodesic distance between the park location and the census block location. In this problem, the gravity law claims that
| (2) |
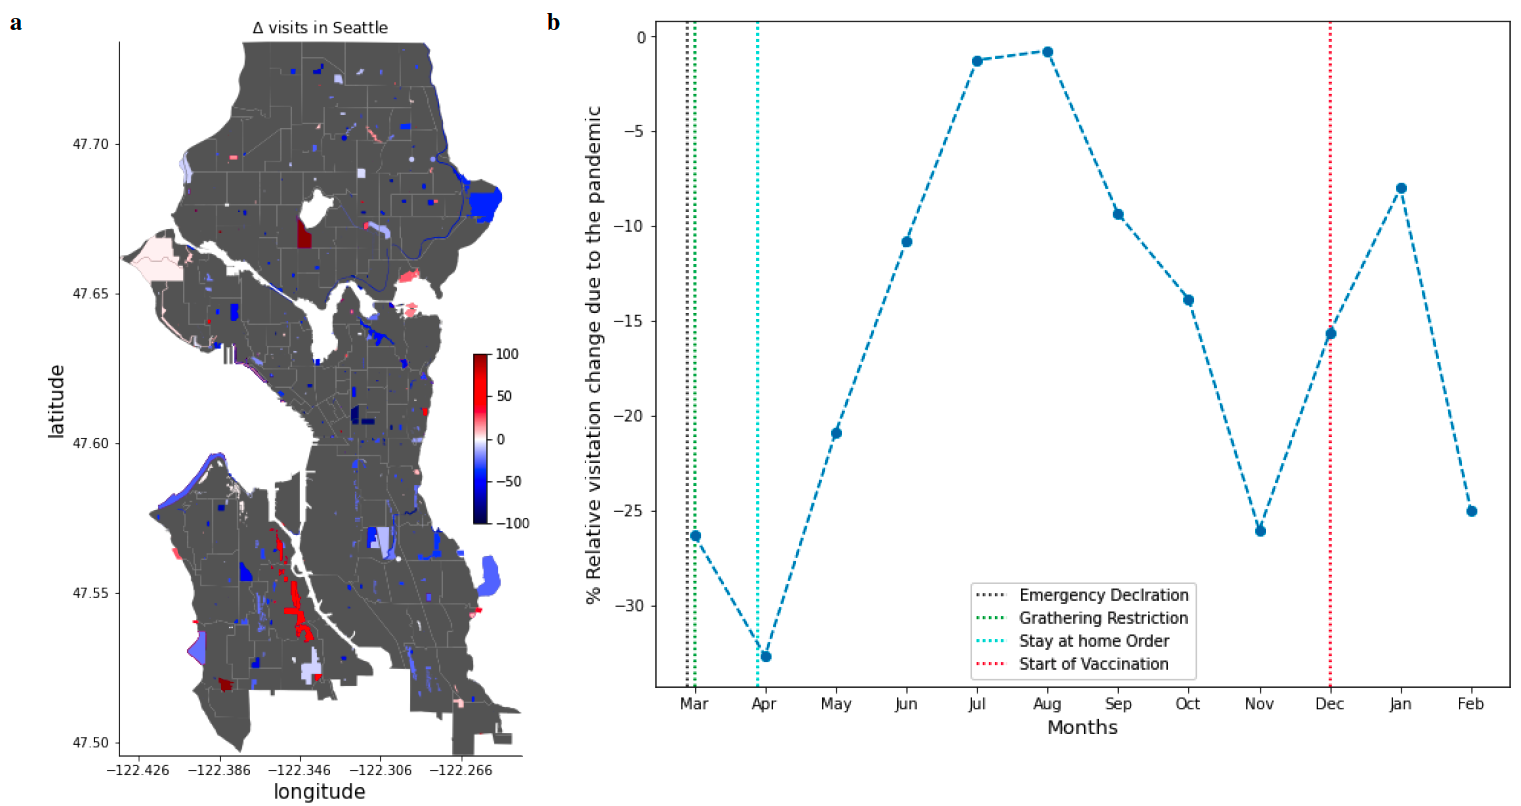
With and chosen in a way that fits the data. We separated our data into two categories pre-pandemic and during-pandemic. The pre-pandemic category starts from March 2019 until March 2020, and the during-pandemic category starts from March 2020 until March 2021. Additionally, the visitation data is spatially aggregated up to the size of census block groups, therefore, we use granulating bins of equal length = 0.5 km to calculate the distance (Figure 1-a). We now show that for both above categories obeys the gravity model in the form of Equation 3.
| (3) |
Figure 1-b shows the gravity model for pre and during-pandemic data. In this plot, the slope of lines represents the parameter , and the y-intercept represents (Equation 2). Put simply, the parameter quantifies the unlikelihood of visiting a distant park. That is the greater the is, the visitation of further-afield parks is unlikely. In both categories, the park visitation obeys the gravity model accurately. Another observation is in regards to the parameter (the slope of the trend) where we can see that does not exhibit any significant change. This observation means that although during the pandemic park visitation has significantly dropped (Supplementary Figure 10), the general trend regarding the traveled distance has remained the same as a whole. As our goal is to study the behavioral changes in park visitation due to COVID-19, we dis-aggregate our data to correspond to different seasons, socio-economic, and spatial groups and analyze if and how selecting a subset of our original data affects the slope of gravity model (). We remark that we do not investigate since it is a normalization parameter so that the sum of the visitors to from all CBGs, , is equal to . Thus in the following sections, we will use filters based on the seasons, the socio-economical vulnerability of visitors, and the spatial scale of cities to understand the differences between various behavior of these groups during the pandemic.
Filtering by Seasonal Patterns
As the literature on park visitation has previously shown [35, 36], there is a large degree of variation in park visitation trends, both the number of visits and spatial behavior of visitors, during warmer and colder seasons. To account for seasonality in park visitation trends we divided our data into two temporal categories corresponding to the warm season when the daily temperature is higher than the average yearly temperature (corresponding to May to October), and cold months with a mean daily temperature lower than average yearly temperature (November to April).
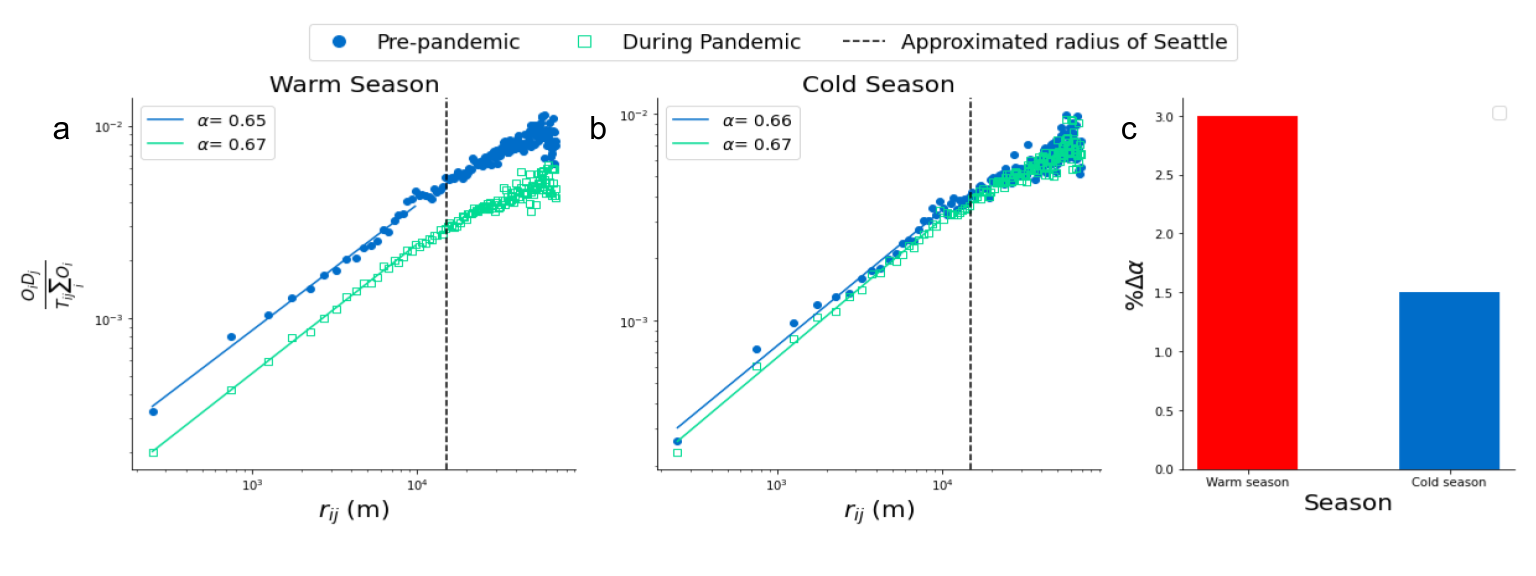
Figure 2 shows that the gravity model accurately describes the park visitation pattern in cold and warm seasons separately. This shows that the gravity model is robust in describing the park visitation pattern after using temporal filters.
We observe no difference in parameter pre- and during the pandemic after using the temporal filter. However, as previously mentioned, the magnitude of park visitation is different in cold versus warm seasons, therefore we will keep the seasonal filter throughout studying the gravity model using socio-economic and spatial filters.
Filtering by Socio-economic Level of Visitors
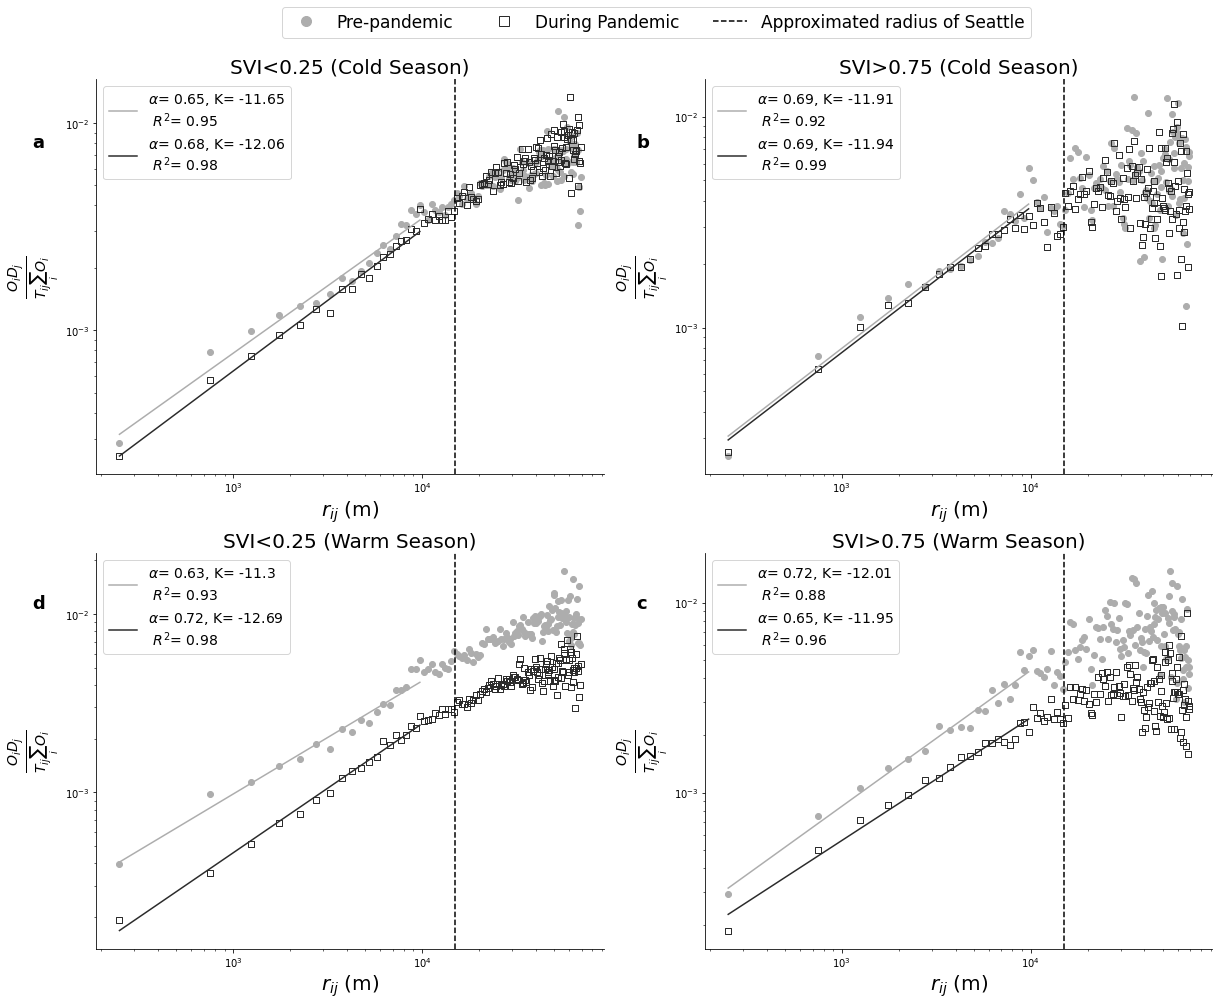
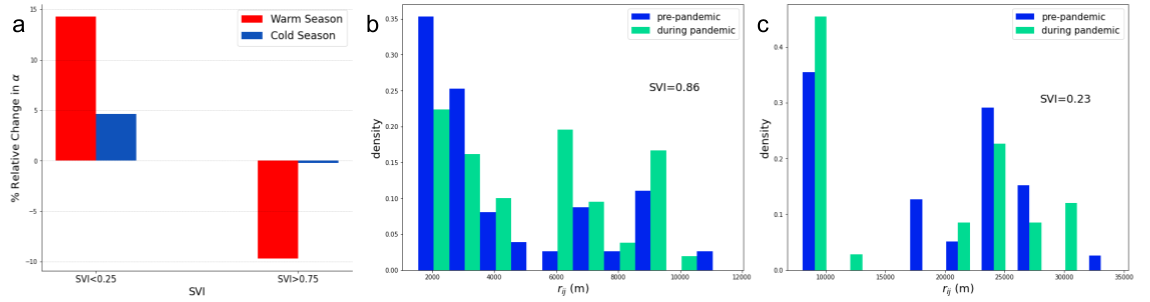
Previous studies have already shown that the decrease in mobility due to the COVID-19 pandemic is related to the socio-economic level of individuals [37, 38, 39, 40]. Besides, parks and green spaces have been disturbed unequally between different socio-economic groups [41, 42]. To indicate the difference in park visitation patterns of different socio-economic levels, we divided visitors into different groups based on their Social Vulnerability Index, and SVI (see Materials and Methods Section) and focused our analysis mainly on these two groups. The first group is the group of visitors with SVI, named as the most vulnerable group, and includes the group of visitors which are the most vulnerable socio-economically speaking. The second group, which includes the group of visitors who are in the least vulnerable group of society, is the group of visitors with SVI. In order to study the effect of the COVID-19 pandemic on park visits of these groups, let us first consider the gravity model for the cold season (shown in Supplementary Figures 11 panels a and b). The cold season of 2020 consists of March and April, which are the very beginning of the pandemic in Washington state. But despite this, we already can see a significant difference between socio-economical groups. Results of fitting parameters for the cold season show that compared to the pre-pandemic situation, the parameter for the least vulnerable group has increased by 4.8%, while this parameter has decreased slightly (less than ) for the most vulnerable group (Figure 3-a).
In the warm seasons, we can see that both the effect of the pandemic and the opposition of the most versus the least vulnerable group becomes more visible, Figure 3-a. In the warm season, the parameter in the least vulnerable group increases by 14.3% (i.e., almost triple the value in the cold season), while in the most vulnerable group, it decreases by 9.7% (although in the cold season, this parameter does not change).
This observation means that while using the socio-economic filter, the effect of the COVID-19 pandemic on the park visitation behavior in the warm season is greater than in the cold season. Moreover, the effect of the pandemic on the behavior of park visitors from the most socio-economic vulnerable group is the opposite of its effect on the behavior of the least vulnerable socio-economic group. While during the pandemic distance starts to play a bigger role as the cost of a visit for the least vulnerable visitors, the most vulnerable visitors exhibit a less association between distance and propensity of park visits.
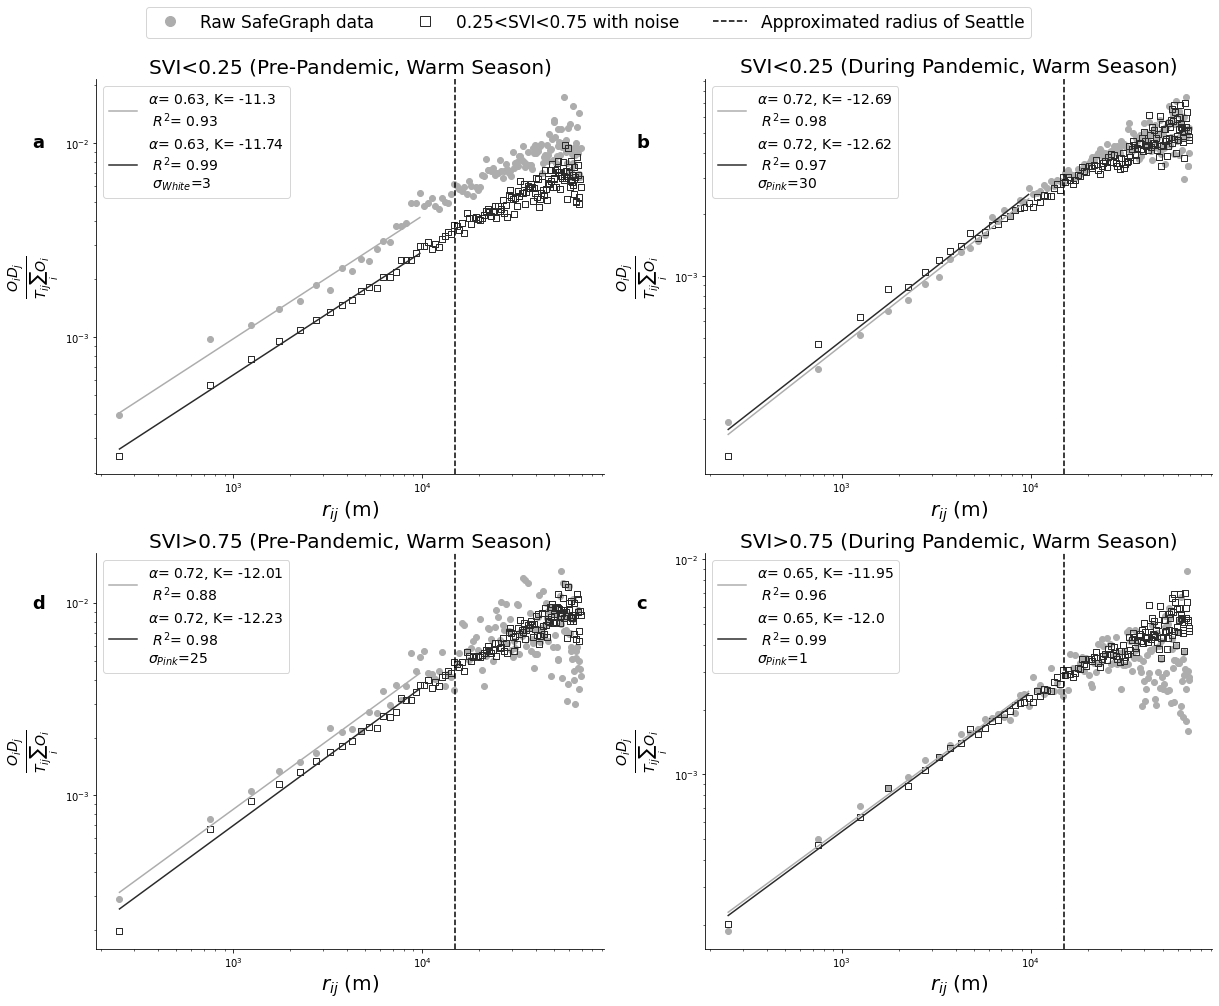
In general, a subset of data, whose selection is not based on a simple random sampling (or sub-sampling), does not necessarily guarantee to represent the original (or same) statistical distribution. In other words, here selecting the visit of the most or the least vulnerable groups does not guarantee to fulfill the gravity model again. Nevertheless, in this section, we observed that the data from these sub-samplings still obey the gravity model, albeit with different values of parameter . As a plausible mechanism to justify the changes in , we described a basic null model (see Materials and Methods). We considered two different random individuals’ changes of behaviors, similar to white and pink noise, and showed how they alter in the gravity model. In summary, adding uncorrelated randomness can lead to a decrease in , and in contrast, adding distance-correlated randomness can lead to an increase in . We went one step further with this null model and observed the following:
Pre-Pandemic: Adding white noise to the fitted gravity model of the middle socio-economic class, we can reproduce the parameter of the pattern for the least vulnerable groups of society. Whereas to reproduce the same distribution, i.e. same parameters, of the most vulnerable group pre-pandemic, we needed to add pink noise to the middle class (Figure 12 in Supplementary). In other words, reaching the behavior of the most vulnerable group from the behavior of the middle class requires random changes that are correlated to the distance.
During Pandemic: We can explain variation in park visitation between the middle class and least/most vulnerable population by the addition of pink noise (Figure 12-b and 12-c in Supplementary). That means that the variation between the middle class and the least/most vulnerable class in visits with longer distances is more. The deviation of the least vulnerable group from the middle class is at its highest during the pandemic (). While the behavior of the least vulnerable group gets farther from the middle class during the pandemic, the behavior in the most vulnerable group gets closer to the middle class during the pandemic. The variation of the most vulnerable class from the middle class is at its highest rate pre-pandemic ().
These observations are self-consistent with the null model’s results that white (pink) noise decreases (increases) the slope of the gravity model. Nevertheless, in order to conclude concretely, a cross-check analysis with individuals’ data is needed, which due to privacy regulations we had no access to.
Filtering Parks by Size of Cities
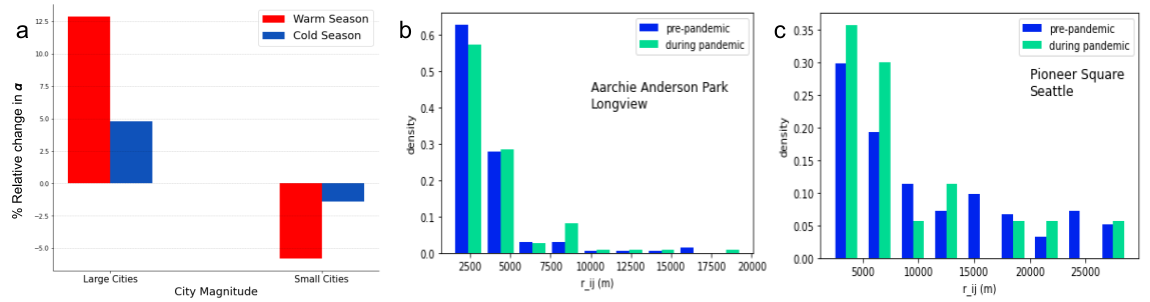
Previous research shows that people living in larger cities commute longer distances in their daily travels [43], and thus spread of COVID-19 has been shown to increase with the size of the city [44]. For these reasons, we investigate the visitation pattern and its changes due to the pandemic for parks located in different city sizes. To do so, we divide parks into two groups based on the population of the city they are located in. The first group includes parks located in the 10 most populated cities in Washington State. These ten cities, Seattle, Spokane, Tacoma, Vancouver, Bellevue, Kent, Everett, Spokane Valley, Renton, and Kirkland, have an overall population of 49.4% of the Washington state population. We refer to this spatial grouping as "large city groups". The second group includes parks located in the remaining Washington state cities. We refer to this group of parks as "small city groups". In studying the behavior of these two groups of parks, We also keep our seasonal pattern filter.
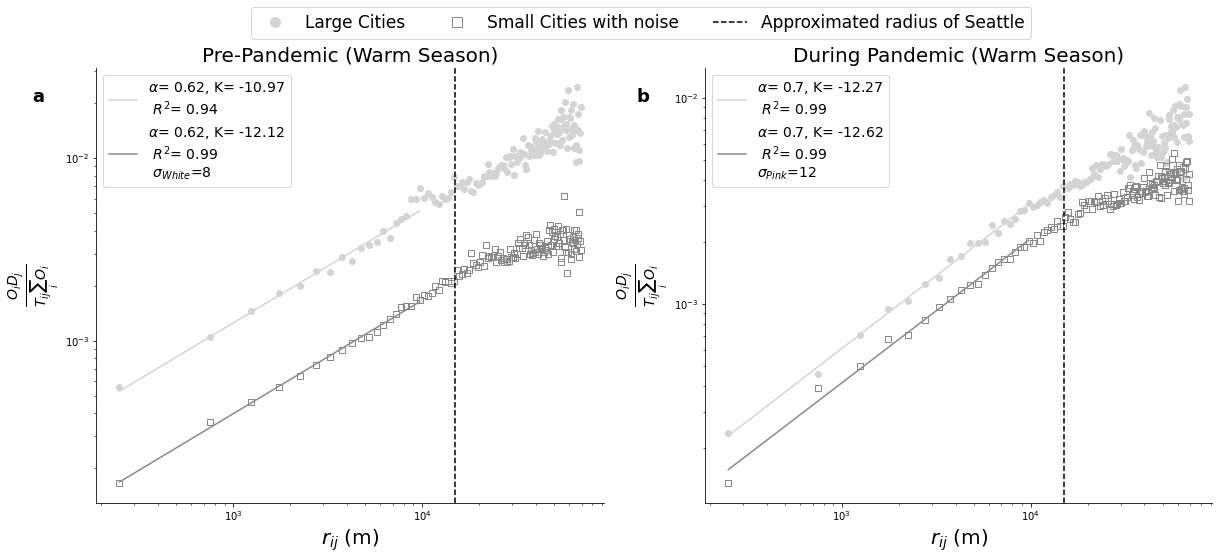
We observe that the park visitation pattern obeys the gravity model for both spatial groups. Figure 4-b shows that the COVID-19 pandemic changes the parameter of the gravity model ( for large cities and for small cities). If we look at the warm season, Figure 4-b, we can see that the COVID-19 pandemic has affected park visitation in both small and large cities more significantly. Furthermore, the effect of the pandemic on small cities is the opposite of the effect on the parks in large cities. It seems like large cities have experienced a 12.5% increase in the parameters, while in small cities, this parameter has decreased -5.4%. This change in the parameters means that for parks in large cities, the pandemic has led to a sharper decline in the number of visitors, and more significantly so with the increasing distance from parks. The number of visitors to parks in small cities decreases slower with the distance from parks compared with the pre-pandemic situation.
Visitation patterns differ by size of the city and by season (Figure 4). One way of studying what deviation from the visitation pattern in small cities develops the pattern that we see in large cities is to add noise to the visitation patterns in small cities. In the pre-pandemic situation, we built the large cities’ pattern by adding white noise to the pattern for small cities (Figure 13 in Supplementary Information). However, in the case of patterns during the pandemic, we added pink noise to the pattern for small cities to rebuild the pattern for large cities (see Figure 13 in Supplementary Information). Referring to the null model hypothesis (see Materials and Methods), this can be interpreted that during the pandemic, the deviation of pattern for large cities from the small cities decreases with the distance, whereas in the case of patterns for pre-pandemic, this deviation does not depend on the distance. This shows that the pandemic causes short-distance transportation to differ more while comparing park visitation in small vs large cities. However, as mentioned above a cross-check with individual traces is needed.
Visitation Network
The results presented so far have focused on the population-level analysis of park visitation data. We have shown that the gravity model holds for park visitation and moreover, it reveals important characteristics related to recreational patterns before and during the pandemic. As the gravity model is primarily based on the distance between the home location of the visitors and parks, changes in its parameters are also a way to quantify the impact of traveled distance on visitation patterns of different groups of people during the pandemic.
However, an alternative way of examining the impact of the pandemic on the recreational visits is to study the visitation patterns independent of the traveled distance and rather focus on the structural patterns pre and during the pandemic. In another word, we seek to understand whether the visits have any predefined structure or happen at random. To answer this question, we adapt network analysis, which represents the visits’ structure, to understand and quantify the difference in the visitation network.
Network analysis has been heavily employed in understanding the diversity of regions and in relation to socio-economic status. Eagle et al. [45] found a strong correlation between the number of each individual’s relationships and the economic development of their community. Chang et al [46] have modeled the spread of the COVID-19 virus using fine-grained dynamic mobility networks. They showed that racial and socio-economic disadvantaged groups visit more crowded places and were not able to reduce their mobility as sharply due to the pandemic, thus they suffered from a higher infection rate. From a policy-making perspective, network analysis can help provide information about the resource allocation of parks and recreational areas. For example, the extent to which a park serves the local residents of the immediate area versus attracting people from all across the region is an important consideration in resource planning, from creating more cycling routes and facilities at a park to planning for alternative public transportation stops and routes. Furthermore, knowing about the visit propensity of people to travel outside of their residential neighborhood can also indicate the need for addressing equity to park access across the population. For instance, Seattle Park and Recreation state their mission on increasing equity in access to parks and distributing resources such that it “takes into account past history and current position, so that future outcomes are fairly distributed” [3]. In this section, we model our data as a visitation network as detailed next.
Inferring Visitation Network: Park visitation network based on the movement of visitors from CBGs to parks can be presented as a directed bipartite network in the form , where: represents CBGs, represents parks, .
We used the same SafeGraph data to build the park visitation network but we remove seasonal and socio-economic filters. In doing so, we connect the to only if (see Materials and Methods). In making the visitation networks, park visitation has been considered from March 2019 till March 2020, a year before the start of the pandemic (pre-pandemic network), and again from March 2020 until March 2021, a year after the start of the pandemic (during the pandemic network). Each CBG is labeled with an SVI of the residential area, the number of residing devices, and its area in square kilometers. Each park is labeled with an SVI related to its location, the total number of visitors, and its area in square kilometers.
Figure 5-a illustrates the schematic presentation of park visitation as a bipartite network in which each CBG is connected to multiple parks with unweighted edges. Each link between the and means that there are at least two visitors who live in and visited . Thus the network analysis focuses on two sides: firstly, the CBGs’ out-degree (Figure 5-b) which presents the recreational propensity of the CBG residents going to parks. Secondly, the parks’ in-degree (Figure 5-c), which presents the diversity of park visitors originating from different census blocks.
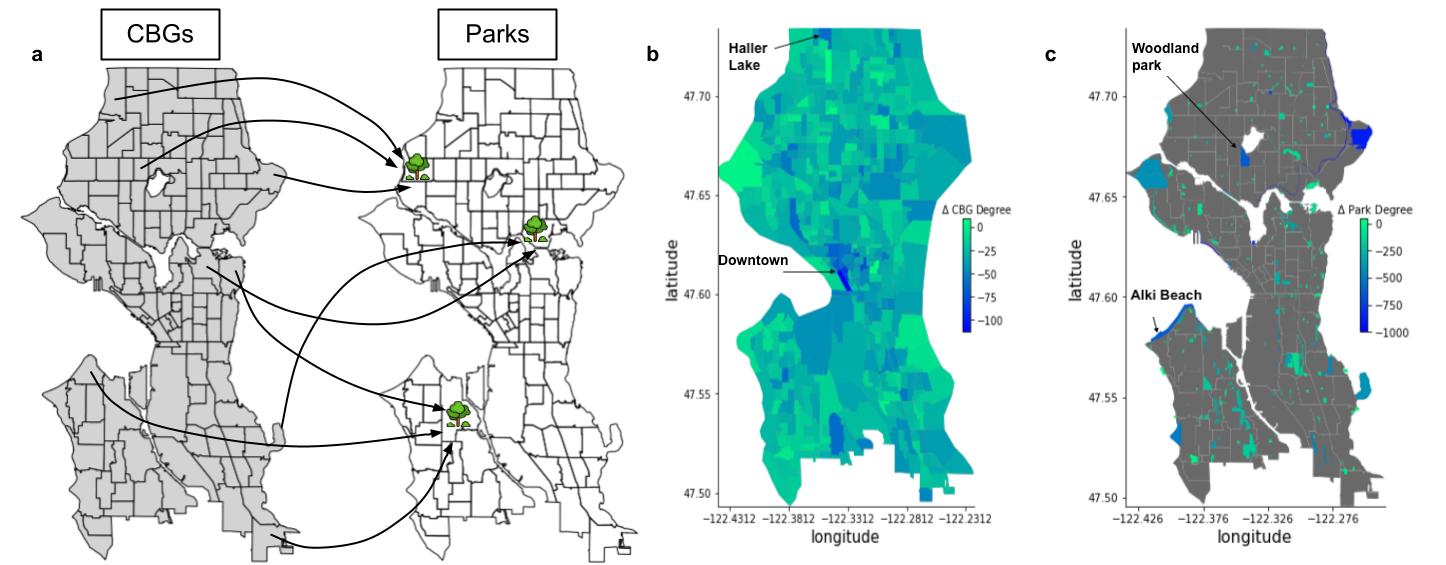
As presented in the heatmaps both diversity and recreational propensity have decreased during the COVID-9 pandemic. Regarding the propensity (Figure 5-b), we can see that some areas (such as Haller Lake and Downtown) exhibit a sharp decline in the magnitude of visits to parks outside of their local area (out-degree edges). As we show next this decline in CBG degree is higher for low-income and highly populated areas in the city. We also observe a great reduction in the diversity of the visitors (incoming edges) to the parks (Figure 5-c). As our analysis will show parks with higher demand face a greater degree of park degree changes. Some of these changes could also be due to other major factors besides the pandemic. For example, the closure of the West Seattle Bridge during 2021-2022 is known to have reduced accessibility to Alki Beach (Figure 5-c), and Woodland Park closure due to homeless encampment.
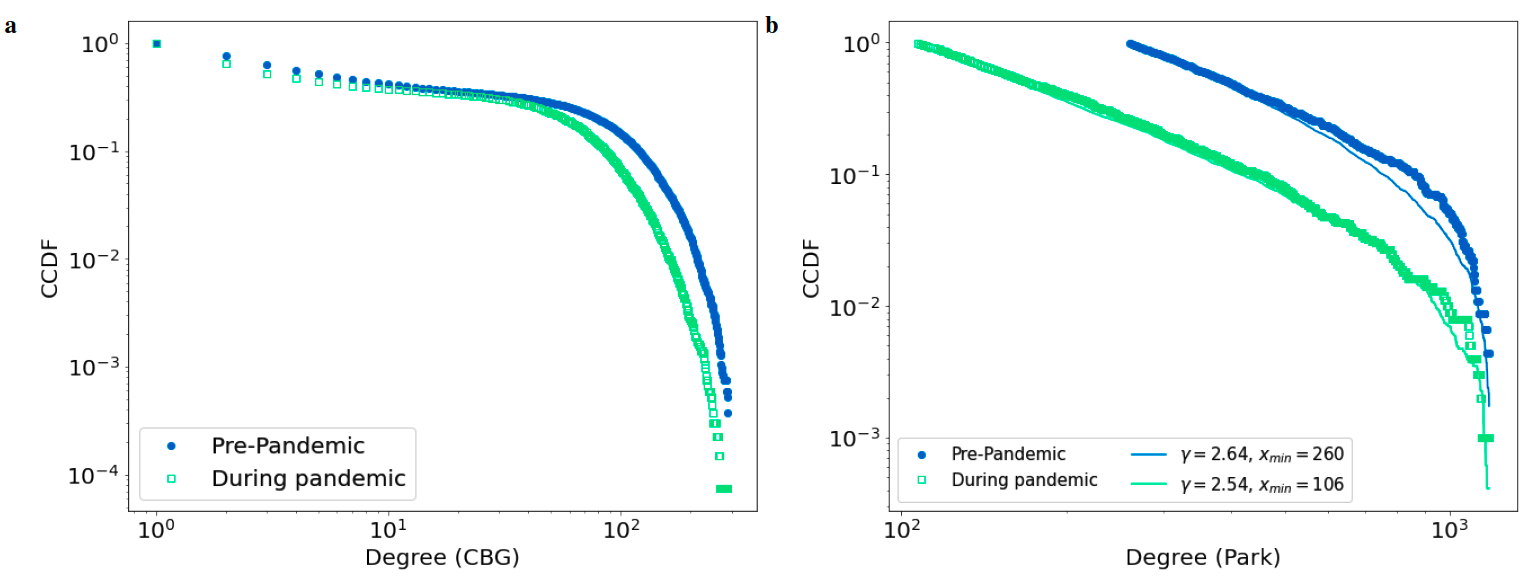
Quantifying Network Properties: Let’s continue with a quantitative analysis of this bipartite network. We first show the Cumulative distribution function (CDF) of the CBG’s out-degree and also the park’s in-degree (Figure 6) and then the changes in the park’s in-degree (Figure 7).
Initially, we look at the out-degree (panel a) and in-degree (panel b) distributions of the park visitation network. We observe that out-degree distribution can be described well neither with normal nor scale-free distributions. Nevertheless, the power-law distributions fit in-degree well as shown in Figure 6-b, but the parameters of the fitted curve, and , change due to the pandemic. The scale-free property applies to the degree of parks in the visitation network.
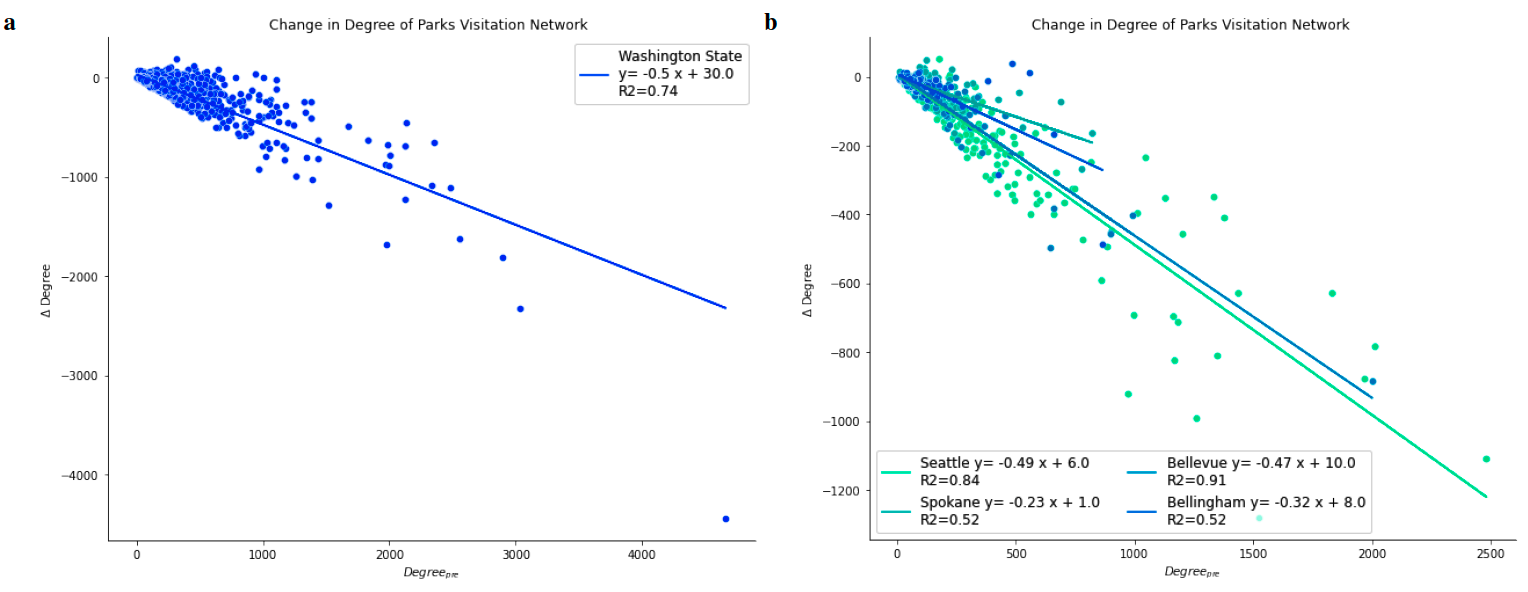
In addition to Figure 5-a which illustrated how the COVID-19 pandemic has changed the degree of parks located in Seattle, in order to see how park degrees relatively changed, we plotted the change in the degree of parks versus the degree of the park in the pre-pandemic network for all the parks in Washington State (Figure 7-a) and four large cities in Washington state separately (Figure 7-b). Figure 7 shows that the degree of parks changes linearly with their degree in the pre-pandemic situation with a negative slope. this means that parks with visitors from a wider range of CBGs experience a bigger decrease in the number of CBGs that visit them. Since the pandemic causes a decrease in the CBG degree (Figure 6-a), therefore it’s reflected in propensity, as well (Figure 5 maps this decrease for Seattle CBGs).
Network Correlation Analysis: Given the park visitation network, now we want to know whether diversity of parks and propensity of CBGs depend on socio-economic status and geometric scale. This question can be answered by measuring the linear correlation between degrees in the visitation network and SVI, Area (park or CBG), and number density (visitors/ residents). The main observations of this analysis are the following:
First examining propensity (Table 1), we observe a strong statistically significant correlation between the CBG degree and SVI. That is the higher the social vulnerability of an area, the residents of that area exhibit a lower propensity in park visitation, both pre () and during the pandemic (). Therefore, residents of the least vulnerable areas (i.e., low SVI) visit a broader range of parks compared to the most vulnerable area (i.e., high SVI). However, there is a high positive correlation between the change in the CBG degree and SVI (). This shows that if the SVI is higher (more vulnerable), then the change in the degree due to the pandemic is also higher. Therefore, the pandemic has a higher effect on the propensity of the most vulnerable CBGs compared to the least vulnerable ones. We also observe that the population density (as measured by devices per area) for different census areas exhibits a negative correlation with the change in park propensity (). Simply put, residents in the denser areas (such as the Downtown area in Figure 5-b consisting of apartment blocks) reduced their choices of recreational visits. We note that this observation could be specific to characteristics of urban design and lifestyle in the United States and more specifically to Washington state where socio-economic status and population density are intertwined.
Second examining diversity (Table 2), indicates contrasting observations regarding the SVI. That is parks in richer areas of Washington State did not exhibit a significant difference in their visitors’ diversity. However, we observe that parks located in higher-density areas have a higher diversity during the pandemic (). Moreover, the change caused by the COVID-19 pandemic in the degree of larger parks (area) is higher compared to smaller ones(). This shows that the increase in diversity of larger parks is higher due to the pandemic. Our results show that interestingly the park area does not have a strong correlation with the degree of the park pre and during the pandemic, the change in diversity is highly correlated with the park area. We also show that the CBG degree is highly correlated with SVI both pre and during the pandemic. This also results in a correlation between the change in CBG degree and the SVI.
| CBG degree | pre-pandemic degree | during pandemic degree | change in degree |
|---|---|---|---|
| residence SVI | -0.93**** | -0.90**** | 0.87**** |
| residence area | -0.19* | 0.07* | 0.18* |
| 0.36* | 0.51* | -0.70*** |
| Park degree | pre-pandemic degree | during pandemic degree | change in degree |
|---|---|---|---|
| park SVI | -0.14* | -0.31* | -0.04* |
| park area | 0.5* | 0.60* | 0.79** |
| 0.67** | 0.94*** | -0.72* |
Concluding Remarks
In summary, we have analyzed the park visits of Washington State pre and during the pandemic from two perspectives: on one side, we showed that visits obey scale-free laws, namely, gravity law and this pattern is robust, even though the slopes change due to different factors. On the other side, we inferred a network of visits, measured some network properties, and showed how the propensity and diversity of the visits were changed and which factors could play a role in it. We also showed that the in-degree and out-degree of recreational visits from neighborhoods followed a power-law distribution. Overall, our results shine a light on practical implications for policymakers and park managers on one hand and raise some theoretical questions on the other hand.
Practical Implications: Putting all the reported observations together, our analysis highlights the following: due to the pandemic the higher income level residents changed their behavior by visiting more local parks and broader recreational options outside of their local census area; whereas the low-income residents changed their visitation behavior greatly by reducing their recreational choices outside of their local area and their traveled distance did not follow a predictable pattern. These behavior changes might be due to the lack of access to specific facilities in parks or the closure of parks in the most vulnerable areas. It could also resonate with the greater work-life balance imposed by the pandemic for only a certain group of the population (i.e., economically resilient). A practical implication of this result is that policymakers can potentially plan alternative recreational activities in areas with low socio-economic levels. Neighborhood programs such as meet-ups, outdoor clubs, etc. that take steps in preventing transmission of the virus but target specifically low-income residents to be more active could help bring equitable recreational access.
We also observed that the recreational behavior in small versus large cities is different, and thus the scale of the city is also another factor that should be accounted for in decision-making. We believe, having access to a more detailed and richer dataset could help to understand the underlying causes of the behavioral shifts we observed in this study. For instance, rich content from social media posts along with qualitative surveys of the park visitors could help us understand more about their decisions of selecting a particular recreational site over other alternatives. Finally, having access to large-scale fine-grain (non-aggregated) mobility data could help us to portray a more accurate picture of recreational choices. We believe in much the same way that technology companies, scientists, and local authorities worked together to create infrastructure for tracking and tracing the spread of the COVID-19 virus, a unified effort that addresses privacy concerns upfront could be mounted to enable advanced modeling of the recreational choices at the individual level.
Prospect Theoretical Outlines: Our work has various important theoretical implications for the research community. First and foremost our study shows that even by only sub-sampling the urban mobility data, namely visits to parks, the gravity law was still well fulfilled. Furthermore, additional sub-sampling, namely three different filters of seasonality, socio-economic and spatial ones showed that gravity law is a robust pattern while only the slope differs for different filters and also pre and during pandemics.
In closing this work creates opportunities to focus future studies on the following: i) confirming the universality of the gravity model when applied to recreational patterns of other cities and countries from different ranges of GDP and cultures. ii) analyzing under which conditions sub-sampling can keep the original scaling law. iii) investigating how to infer the original general law by knowing the sub-sampled statistical law, for instance here by knowing the slope of gravity law for a given filtered data. iv) how to improve null models in order to understand the underlying mechanisms of observed changes.
Finally, our analysis revealed that the degree of parks in the visitation network follows a power-law distribution while also the park visits obey the gravity law. Knowing these two perspectives, a research question arises whether ensemble models generate synthetic park visitation traces. In the same vein, we believe future work will include applying advances of graph-based neural networks [47] to enhance the gravity model as a non-linear model similar to recent efforts by [48] to generate synthetic traces. Such models can be then adjusted for socio-economic variations using the fairness regularizer layer in their architecture to force the model to tune for different socio-economic levels during the training process [49].
Materials and Methods
Data
In this study, we used three different types of data described as follows:
SafeGraph Mobility Data.
SafeGraph is a commercial company that provides Point of Interest (POI) and Location-Based Services (LBS) data in the U.S, Canada, and the United Kingdom [13] The dataset is an aggregated dataset of anonymized location data from numerous mobile applications. SafeGraph captures the movement of people between POIs that have been marked as parks and green spaces in the SafeGraph Core Places API. Unlike location-based social networks, which require active participation on the part of the user to upload and share images, SafeGraph collects its data from users who have installed one of the many affiliated mobile applications on their devices. Users’ locations are recorded even while they are not actively using an application. It is therefore non-participatory and platform-independent. For these reasons, SafeGraph is less sensitive to biases that would result from changes in the popularity of the use of certain applications over time [46, 50, 51]. Furthermore, the validity and viability of SafeGraph data as a proxy of cite visitation in US national parks has been reported recently by [52].
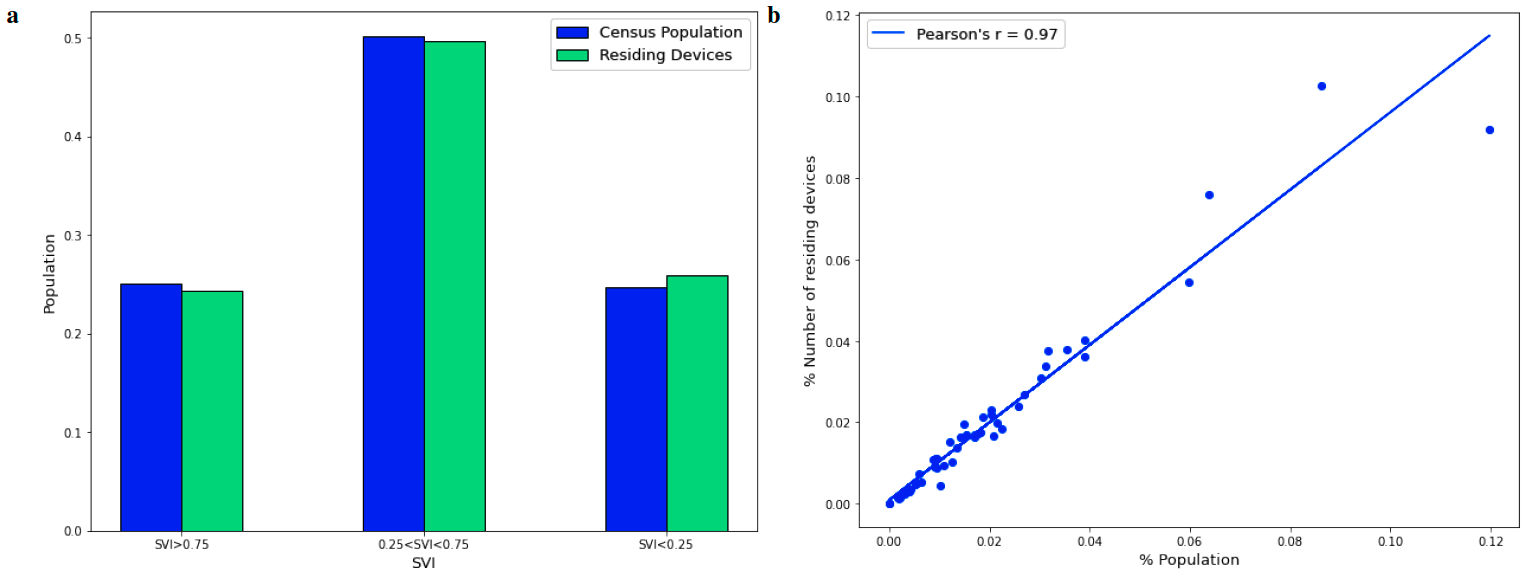
To preserve the privacy of users, SafeGraph data is provided in monthly and spatial aggregates, presenting the number of visitors and their visit characteristics such as aggregated total number of visitors who originated from each census block group (CBG). CBGs are geographical units that typically contain a population of between 600 and 3,000 people. This rich aggregated information allows us to analyze changes in visitation patterns and visitor characteristics independent and de-coupled from online behavior. Figure 8-b shows the correlation of population with the number of devices SafeGraph has collected data from for each state. We can see that sampling from the population is correlated with the population in each state with Pearson’s r equal to 0.97.
We collected all the data associated with Parks and Green Natural areas of Washington state under a research license provided by SafeGraph. We used SafeGraph weekly pattern data from November 2018 till February 2021 for 3665 parks in Washington state and 220426 census block groups (U.S.). The population of devices in each CBG , , is given as number_devices_residing in this data. SafeGraph defines the home of visitors as the CBG that the visitor has spent most of their time during nighttime hours (between 6 pm and 7 am) in a 6-week period. The number of visitors for each park j, , is given by raw_visit_counts, and the number of visitors from CBG to the park j, is given by the visitor_home_cbgs in SafeGraph weekly pattern data. Note that SafeGraph reports the between an origin and a destination, if the at least is equal to two, and if , SafeGraph reports as four.
We applied the following steps in processing Safegraph data for our Gravity model. i) we aggregated distances between origins and destinations using meter bins. ii) In filtering the seasonal and yearly patterns using monthly patterns, we only kept parks whose data was available for each month in a desired season/year.
Social Vulnerability Index Data.
Social Vulnerability Index (SVI) developed by the Centers for Disease Control and Prevention is a metric that captures the resilience of each community at the census tract level. This index combines 15 U.S. census variables grouped into four themes: socioeconomic status, household composition, race/ethnicity/language, and housing/transportation, in order to rank census tracts by their relative vulnerability to hazardous events. Each of these themes has its own percentile ranking where greater percentile values represent greater vulnerability. In this study, we used the first theme that corresponds to socioeconomic status to understand the shift in visitors’ socio-economic background pre and during the pandemic. Figure 8-a shows the distribution of different socio-economic groups in the Washington population and in the sample from SafeGraph. As shown in this bar plot, the distribution in the Washington population is the same as the distribution in the SafeGraph sampling.
Census Data.
We obtained US population data from the 2019 American Community Survey (ACS) product of the U.S. Census Bureau, provided by SafeGraph’s Open Census Data. We computed a CBG’s population density by dividing the 2019 population estimate by the land area of the CBG as reported by CBG geographic data of SafeGraph’s Open Census Data. SafeGraph "uses the cartographic boundary files, which define simplified shapes of geographic entities designed for plotting, provided by the U.S. census."
White and Pink Noise (Null Model)
In order to understand better the changes of slops in the gravity model, let’s go one step further with a null model. Thus we assume that the individuals’ change behaviors have been random and see how the slop would change, as shown in Figure. 9. Given a fixed gravity model with , we add two types of noises to the flow, in the model: namely white and pink.
Firstly we consider white noise with the simplest representation of it. The term “white” refers to independent and identically distributed random variables which are added to our model as follows:
| (4) |
where is the noise level.
Secondly, we assume even though the change of behaviors has been random but was correlated to the distance. Thus we can consider bigger fluctuations for shorter distances which obey a power-law function. We refer to this noise as “pink” noise. The noise is produced as follows:
| (5) |
where is the noise level and id the distance between CBG and a park.
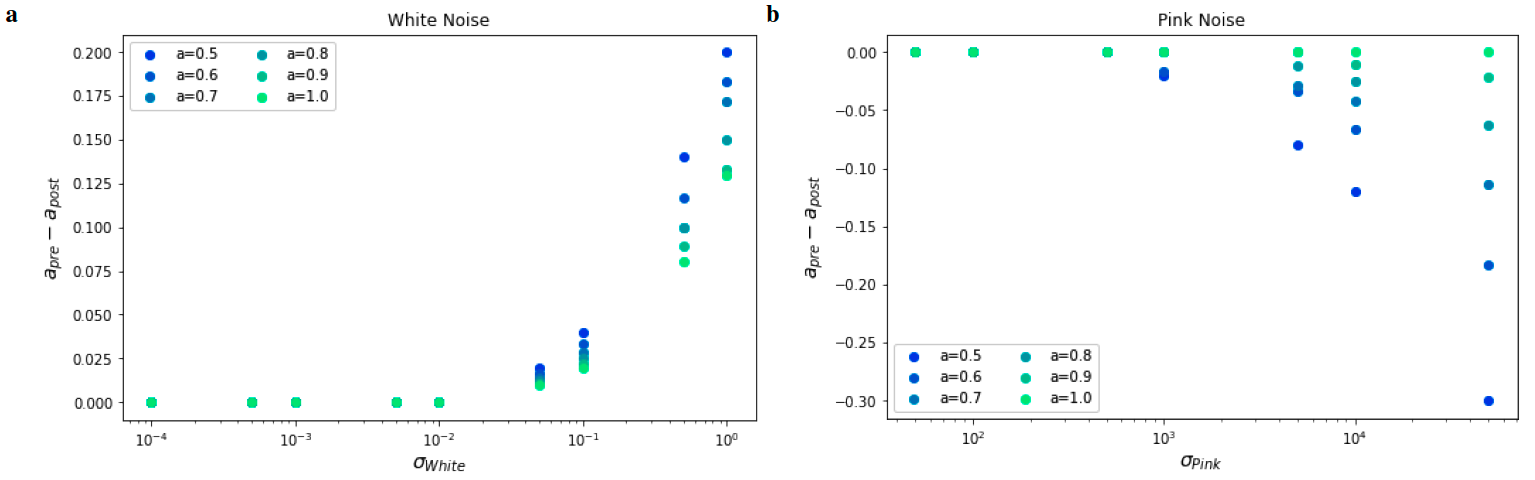
Figure 9 shows that white noise (panel a) decreases , while pink noise (panel b) increases the slope. Also the smaller the is or the bigger the noise level, , is, the bigger the change of the slop would be.
Data availability
Aggregated mobile phone data that was used in this study are freely available to researchers, non-profit organizations, and governments through the SafeGraph COVID-19 Data Consortium (https://www.safegraph.com/covid-19-data-consortium).
Code availability
The code to replicate this research can be requested from the corresponding author.
References
- [1] Keeler, B. L. et al. Social-ecological and technological factors moderate the value of urban nature. \JournalTitleNature Sustainability 2, 29–38 (2019).
- [2] Stodolska, M. Recreation for all: Providing leisure and recreation services in multi-ethnic communities. \JournalTitleWorld Leisure Journal 57, 89–103 (2015).
- [3] Parks, S. & Rec. A strategic plan for seattle parks and recreation 2020-2032.
- [4] Russell, R. et al. Humans and nature: how knowing and experiencing nature affect well-being. \JournalTitleAnnual Review of Environment and Resources 38, 473–502 (2013).
- [5] Soga, M., Evans, M. J., Tsuchiya, K. & Fukano, Y. A room with a green view: the importance of nearby nature for mental health during the covid-19 pandemic. \JournalTitleEcological Applications 31, e2248 (2021).
- [6] Remme, R. P. et al. An ecosystem service perspective on urban nature, physical activity, and health. \JournalTitleProceedings of the National Academy of Sciences 118 (2021).
- [7] Keniger, L. E., Gaston, K. J., Irvine, K. N. & Fuller, R. A. What are the benefits of interacting with nature? \JournalTitleInternational Journal of Environmental Research and Public Health 10, 913–935 (2013).
- [8] Geng, D. C., Innes, J., Wu, W. & Wang, G. Impacts of covid-19 pandemic on urban park visitation: a global analysis. \JournalTitleJournal of Forestry Research 32, 553–567 (2021).
- [9] Lu, Y., Zhao, J., Wu, X. & Lo, S. M. Escaping to nature during a pandemic: a natural experiment in asian cities during the covid-19 pandemic with big social media data. \JournalTitleScience of the Total Environment 777, 146092 (2021).
- [10] Rice, W. L. et al. Changes in recreational behaviors of outdoor enthusiasts during the covid-19 pandemic: analysis across urban and rural communities. \JournalTitleJournal of Urban Ecology 6, juaa020 (2020).
- [11] Covid-19 community mobility report (2020).
- [12] Jay, J., Heykoop, F., Hwang, L., de Jong, J. & Kondo, M. Effects of the covid-19 pandemic on park use in us cities. \JournalTitlemedRxiv (2021).
- [13] Graph, S. Safegraph 2021. https://www.safegraph.com (2021).
- [14] Suse, S., Mashhadi, A. & Wood, S. A. Effects of the covid-19 pandemic on park visitation measured by social media. In Companion Publication of the 2021 Conference on Computer Supported Cooperative Work and Social Computing, 179–182 (2021).
- [15] Barbosa, H. et al. Human mobility: Models and applications. \JournalTitlePhysics Reports 734, 1–74 (2018).
- [16] Zipf, G. K. The p 1 p 2/d hypothesis: on the intercity movement of persons. \JournalTitleAmerican sociological review 11, 677–686 (1946).
- [17] Erlander, S. & Stewart, N. F. The gravity model in transportation analysis: theory and extensions, vol. 3 (Vsp, 1990).
- [18] Simini, F., González, M. C., Maritan, A. & Barabási, A.-L. A universal model for mobility and migration patterns. \JournalTitleNature 484, 96–100 (2012).
- [19] Noulas, A., Scellato, S., Lambiotte, R., Pontil, M. & Mascolo, C. A tale of many cities: universal patterns in human urban mobility. \JournalTitlePloS one 7, e37027 (2012).
- [20] Stouffer, S. A. Intervening opportunities: a theory relating mobility and distance. \JournalTitleAmerican sociological review 5, 845–867 (1940).
- [21] Song, C., Koren, T., Wang, P. & Barabási, A.-L. Modelling the scaling properties of human mobility. \JournalTitleNature physics 6, 818–823 (2010).
- [22] Anas, A., Arnott, R. & Small, K. A. Urban spatial structure. \JournalTitleJournal of economic literature 36, 1426–1464 (1998).
- [23] Bassolas, A. et al. Hierarchical organization of urban mobility and its connection with city livability. \JournalTitleNature communications 10, 1–10 (2019).
- [24] Barlacchi, G. et al. A multi-source dataset of urban life in the city of milan and the province of trentino. \JournalTitleScientific data 2, 1–15 (2015).
- [25] Louail, T. et al. Uncovering the spatial structure of mobility networks. \JournalTitleNature communications 6, 1–8 (2015).
- [26] Henderson, V. & Thisse, J.-F. Handbook of regional and urban economics: cities and geography, vol. 4 (Elsevier, 2004).
- [27] Chang, J., Rosenn, I., Backstrom, L. & Marlow, C. epluribus: Ethnicity on social networks. In Fourth International AAAI Conference on Weblogs and Social Media (2010).
- [28] Eubank, S. et al. Modelling disease outbreaks in realistic urban social networks. \JournalTitleNature 429, 180–184 (2004).
- [29] Wesolowski, A. et al. Quantifying the impact of human mobility on malaria. \JournalTitleScience 338, 267–270 (2012).
- [30] Schläpfer, M. et al. The universal visitation law of human mobility. \JournalTitleNature 593, 522–527 (2021).
- [31] Jung, W.-S., Wang, F. & Stanley, H. E. Gravity model in the korean highway. \JournalTitleEPL (Europhysics Letters) 81, 48005 (2008).
- [32] Park, H. J., Jo, W. S., Lee, S. H. & Kim, B. J. Generalized gravity model for human migration. \JournalTitleNew Journal of Physics 20, 093018 (2018).
- [33] Li, R. et al. Gravity model in dockless bike-sharing systems within cities. \JournalTitlePhysical Review E 103, 012312 (2021).
- [34] Yu, S., Liu, G. & Yin, C. Understanding spatial-temporal travel demand of free-floating bike sharing connecting with metro stations. \JournalTitleSustainable Cities and Society 74, 103162 (2021).
- [35] Hewer, M., Scott, D. & Fenech, A. Seasonal weather sensitivity, temperature thresholds, and climate change impacts for park visitation. \JournalTitleTourism Geographies 18, 297–321 (2016).
- [36] Wilkins, E. J., Howe, P. D. & Smith, J. W. Social media reveal ecoregional variation in how weather influences visitor behavior in us national park service units. \JournalTitleScientific reports 11, 1–12 (2021).
- [37] Gozzi, N. et al. Estimating the effect of social inequalities on the mitigation of covid-19 across communities in santiago de chile. \JournalTitleNature communications 12, 1–9 (2021).
- [38] Wright, A. L., Sonin, K., Driscoll, J. & Wilson, J. Poverty and economic dislocation reduce compliance with covid-19 shelter-in-place protocols. \JournalTitleJournal of Economic Behavior & Organization 180, 544–554 (2020).
- [39] Fraiberger, S. P. et al. Uncovering socioeconomic gaps in mobility reduction during the covid-19 pandemic using location data. \JournalTitlearXiv preprint arXiv:2006.15195 (2020).
- [40] Weill, J. A., Stigler, M., Deschenes, O. & Springborn, M. R. Social distancing responses to covid-19 emergency declarations strongly differentiated by income. \JournalTitleProceedings of the National Academy of Sciences 117, 19658–19660 (2020).
- [41] Wen, M., Zhang, X., Harris, C. D., Holt, J. B. & Croft, J. B. Spatial disparities in the distribution of parks and green spaces in the usa. \JournalTitleAnnals of Behavioral Medicine 45, S18–S27 (2013).
- [42] Mitchell, R., Astell-Burt, T. & Richardson, E. A. A comparison of green space indicators for epidemiological research. \JournalTitleJ Epidemiol Community Health 65, 853–858 (2011).
- [43] Kang, C., Ma, X., Tong, D. & Liu, Y. Intra-urban human mobility patterns: An urban morphology perspective. \JournalTitlePhysica A: Statistical Mechanics and its Applications 391, 1702–1717 (2012).
- [44] Stier, A. J., Berman, M. G. & Bettencourt, L. Covid-19 attack rate increases with city size. \JournalTitlearXiv preprint arXiv:2003.10376 (2020).
- [45] Eagle, N., Macy, M. & Claxton, R. Network diversity and economic development. \JournalTitleScience 328, 1029–1031 (2010).
- [46] Chang, S. et al. Mobility network models of covid-19 explain inequities and inform reopening. \JournalTitleNature 589, 82–87 (2021).
- [47] Zhou, J. et al. Graph neural networks: A review of methods and applications. \JournalTitleAI Open 1, 57–81 (2020).
- [48] Simini, F., Barlacchi, G., Luca, M. & Pappalardo, L. A deep gravity model for mobility flows generation. \JournalTitleNature communications 12, 1–13 (2021).
- [49] Yan, A. & Howe, B. Fairness-aware demand prediction for new mobility. In Proceedings of the AAAI Conference on Artificial Intelligence, vol. 34, 1079–1087 (2020).
- [50] Gao, S., Rao, J., Kang, Y., Liang, Y. & Kruse, J. Mapping county-level mobility pattern changes in the united states in response to covid-19. \JournalTitleSIGSpatial Special 12, 16–26 (2020).
- [51] Kang, Y. et al. Multiscale dynamic human mobility flow dataset in the us during the covid-19 epidemic. \JournalTitleScientific data 7, 1–13 (2020).
- [52] Liang, Y. et al. Assessing the validity of mobile device data for estimating visitor demographics and visitation patterns in yellowstone national park. \JournalTitleJournal of Environmental Management 317, 115410 (2022).
Supplementary Information