The survey of planetary nebulae in Andromeda (M 31) VI. Kinematics of M 31 inner-halo substructures and comparison with major-merger simulation predictions
Abstract
M 31 has experienced a recent tumultuous merger history as evidenced from the many substructures that are still present in its inner halo, particularly the G1-Clump, NE- and W- shelves, and the Giant Stream (GS). We present planetary nebulae (PNe) line-of-sight velocity (LOSV) measurements covering the entire spatial extent of these four substructures. We further use predictions for the satellite and host stellar particle phase space distributions for a major merger (mass ratio = 1:4) simulation to help interpret the data. The measured PN LOSVs for the two shelves and GS are consistent with those from red giant branch stars. Their projected radius vs. LOSV phase space, links the formation of these substructures in a single unique event, consistent with a major merger. We find the G1-clump to be dynamically cold compared to the M 31 disc ( km s-1), consistent with pre-merger disc material. Such a structure can not form in a minor merger (mass ratio 1:20), and is therefore a smoking gun for the recent major merger event in M 31. The simulation also predicts the formation of a predominantly in-situ halo from splashed-out pre-merger disc material, in qualitative agreement with observations of a metal-rich inner halo in M 31. Juxtaposed with previous results for its discs, we conclude that M 31 has had a recent (2.5–4 Gyr ago) ‘wet’ major merger with the satellite falling along the GS, heating the pre-merger disc to form the M 31 thicker disc, rebuilding the M 31 thin disc, and creating the aforementioned inner-halo substructures.
keywords:
Galaxies: individual (M 31) – Galaxies: evolution – Galaxies: structure – planetary nebulae: general1 Introduction
At a distance of kpc (Conn et al., 2016), Andromeda (M 31; V km s-1; Watkins et al. 2013) is the nearest giant spiral galaxy to our Milky Way (MW), with its halo covering over 100 sq. deg. on the sky. Photometric surveys (e.g. PAndAS; McConnachie et al., 2009, 2018) measuring the projected number density and photometric metallicity of resolved red giant branch (RGB) stars have revealed several faint and diffuse substructures in the M 31 halo. The most striking features in the inner halo include the Giant Stream (GS; a long trail of stars to the south-east of the M 31 disc spanning over 20 sq. deg. on the sky; see Ibata et al. 2001), the NE- and W-shelves (shell-like overdensities to the north-east and south-west of the M 31 disc; see Ferguson et al. 2002 and Fardal et al. 2007 respectively) and the G1-Clump (a distinct clump of stars at the southern tip of the M 31 disc; see Ferguson et al. 2002). Such substructures are fossil records of hierarchical mass accretion in galaxies and their kinematic properties can shed light on the mass, orbital parameters and other associated properties of the accreted satellites (Johnston et al., 2008).
However, owing to the proximity of M 31 and large angular extent of these substructures on the sky, spectroscopic observations of absorption lines in their RGB stars and subsequent line-of-sight velocity (LOSV) measurement have until recently been limited to small fields within the substructures, through pencil-beam spectroscopic surveys (e.g. Guhathakurta et al., 2005). Such surveys have been extensively carried out in the GS (Ibata et al., 2004; Guhathakurta et al., 2005; Gilbert et al., 2009). The presence of two kinematic components (each having km s-1 but offset by 100 km s-1) in small Keck/DEIMOS fields in the GS was first revealed by Gilbert et al. (2009). Escala et al. (2022) measured the LOSVs of RGB stars in the NE-Shelf and found a ’wedge’ pattern of the NE-Shelf RGB stars in their projected radial distance from galaxy center vs. LOSV phase space (hereafter Rproj vs. VLOS diagram). The recent spectroscopic survey of RGB stars in M 31 with the DESI multi-object spectroscopy instrument (Dey et al., 2023) also identifies the same pattern in the NE- and W-shelves as well as the two kinematic components in the GS but out to larger distance from the M 31 center. Reitzel et al. (2004) obtained LOSV velocities of RGBs in the vicinity of the G1-clump but attributed their obtained measurements to the outer disc members of M 31, rather than to the main G1-clump substructure, though an association of the clump with the nearby G1 globular cluster was ruled out. The general properties of LOSV measurements for the RGB stars in the M 31 substructures are discussed in detail in Ferguson & Mackey (2016).
Dynamical simulations aiming to uncover the origin of these substructures, and thereby the recent merger history of M 31, have primarily been constrained by observed photometric properties (metallicity and surface brightness; see McConnachie et al. 2018 for details) while comparing with specific predictions only when pencil beam spectroscopic measurements were available. Ibata et al. (2004) first constrained the orbit of the GS, suggesting that the progenitor of the stream passed very close to the M 31 disc, causing its demise as a coherent structure and producing a fan of stars polluting the inner halo. N-body simulations of a ‘dry’ merger along the GS placed the mass of the infalling satellite at M⊙ (similar to the mass of the Large Magellanic Cloud; Fardal et al., 2006; Fardal et al., 2013) with the satellite also producing the NE- and W- shelves as projected shells of disrupted satellite material following the merger (Fardal et al., 2007; Fardal et al., 2012). The three dimensional shells which arise from the simulations of such an accretion event reproduce the LOSVs of planetary nebulae (PNe) in the M31 disc which are classified as outliers by Merrett et al. (2003). Fardal et al. (2013) further find that the satellite would have fallen in Myr ago with a total mass M⊙, including dark matter (DM). Given the lack of star-formation burst in the GS or elsewhere in M 31 at this time (Bernard et al., 2012, 2015; Williams et al., 2017), they posited that this would have been a gas-poor merger event.
While there is an overall similarity in the Rproj vs. VLOS diagram for the observed NE-Shelf RGB stars in Escala et al. (2022) with that predicted by Fardal et al. (2013), these N-body simulations predict a single rather cold component ( km s-1) for GS in this Rproj vs. VLOS diagram. This simulated property of the GS is in tension with the presence of two kinematic components found instead in the GS by Gilbert et al. (2009). Another discrepancy is associated with the G1-clump, which is not predicted as a substructure in these simulations.
Hammer et al. (2018) have proposed a gas-rich major merger (mass ratio 1:4) 2–3 Gyr ago in M 31 where a satellite infalls along the GS, forms the two shelves in multiple pericenter passages, while also forming the G1-clump from perturbed disc material as well as forming a counter giant stream (CGS) substructure on the side of the M 31 disc opposite to the GS. Their simulation is consistent with the two kinematic components identified by Gilbert et al. (2009) in the GS and they predict a broad LOSV distribution for the complete GS region due to the debris left by the satellite in multiple pericenter passages. In this scenario, the pre-merger M 31 disc would be dynamically heated to form a thick disc while the merger would be accompanied by star-formation with the bulk of the cold gas rebuilding the thin disc in M 31. Any minor mergers (satellite–to–M31 mass ratio 1:10) would not have any measurable impact on the M 31 disc kinematics (E.g. Hopkins et al., 2009; Martig et al., 2014).
We thus turn to assess the observed effects of the recent merger on the M 31 disc. In Bhattacharya et al. (2019b), we utilised observations of PNe in the M 31 disc to identify the kinematically distinct thin and thicker discs in M 31, traced by younger ( Gyr old) high-extinction PNe and older ( Gyr old) low-extinction PNe respectively. The thin and thicker discs, at the position of the solar neighbourhood in M 31, were found to respectively have velocity dispersions almost twice ( km s-1) and thrice ( km s-1) that of the MW population of the same age (also consistent with Dorman et al. 2015 for the thick disc RGB stars; km/s). Such a dynamically hot thick disc can only be produced in a major merger event (Hopkins et al., 2009). The resulting age-velocity dispersion relation from PNe in the M 31 disc suggests a merger mass ratio 1:5.
The kinematically distinct discs are also chemically distinct (Bhattacharya et al., 2022), with the thicker disc having flat radial oxygen and argon abundance gradients, typical of discs that have experienced a recent major merger (E.g. Zinchenko et al., 2015), and the thin disc having steeper gradients consistent with that of the MW thin disc, taking the difference in disc scale lengths into account. Arnaboldi et al. (2022) found that the [Ar/H] vs [O/Ar] plane for emission line nebulae is analogous to the [Fe/H] vs [/Fe] plane for stars, constraining the chemical enrichment and star formation history of the parent stellar population. They showed that the older M 31 thicker disc PNe show monotonic chemical enrichment with an extended star formation history up to super-solar values. By contrast, the younger M 31 PN progenitors are formed from accreted metal-poor gas mixed with the relatively metal-rich pre-merger M 31 inter-stellar medium (ISM).
The major merger in M 31 would thus have been one with a gas-rich satellite, i.e. it would have been a ‘wet merger’. This is also consistent with the observations of 2 Gyr old burst of star-formation measured from deep Hubble Space Telescope (HST) photometry in the M 31 disc (Williams et al., 2017), and also in small fields in several inner-halo substructures (Bernard et al., 2015) as well as in the outer warp region in the disc (Bernard et al., 2012). A recent major merger scenario is also consistent with the observation of a metal-rich inner halo in M 31 (D’Souza & Bell, 2018a, b; Escala et al., 2023) as well as with the two kinematically distinct globular cluster populations found in the M 31 outer halo (Mackey et al., 2019). The merging satellite would have been massive enough to perturb the pre-merger disc to form the M 31 thicker disc while the thin disc was re-formed afterwards from gas brought in by the satellite mixed with that already present in the pre-merger M 31 disc. However, the formation of inner-halo substructures in the same wet-merger event has not yet been clearly established.
There is therefore the opportunity to set constraints on the merger history of M 31, by comparing predictions from major merger simulations with LOSV measurements at the different locations in the M 31 inner halo substructures with substantial spatial coverage. LOSV measurements over the entire spatial scale spanned by each of the M 31 inner halo substructures are thus required. This allows us to compare their observed position-velocity phase space properties with the predictions from simulations by Hammer et al. (2018) so as to investigate their formation in the same major-merger event that formed the thin and thicker discs of M 31.
PNe, the emission-line nebulae in the late stages of stellar evolution, are established discrete tracers of the stellar population properties such as light, kinematics and chemistry in a number of galaxies of different morphological types (e.g. Aniyan et al., 2018; Hartke et al., 2022). PNe evolve from stars with initial masses between 0.8 and 8 M⊙, thus covering a wide range of parent stellar population ages ( Gyr to Myr old). However, owing to the short visibility lifetime of PNe, only some stars in a stellar population are in the PN phase at any point in time. The number of identified PNe in any galaxy is linked to the total luminosity of the parent stellar population via a specific frequency that is related to the galaxy morphological type (Buzzoni et al., 2006). Thus PN LOSV measurements are simply a discrete sampling of stellar LOSV measurements in any galaxy, consistent with similar measurements from resolved stellar populations (E.g. Bhattacharya et al., 2019b) and integral-field spectroscopy (E.g. Pulsoni et al., 2018; Aniyan et al., 2021). The kinematic properties of the entire parent stellar population in a galaxy is effectively sampled by PNe even if multiple overlapping populations of different ages and kinematics are present (E.g. Aniyan et al., 2018).
PN LOSV measurements are obtained from bright emission lines, which at the distances of M 31 can be carried out in reasonable allocation of telescope time with current instrumentation (Merrett et al., 2006; Bhattacharya et al., 2022). Despite the large spatial extent of M 31 and its inner halo substructures, PN LOSV measurements can be carried out to effectively sample LOSVs from entire substructure regions. The PN kinematics smooth over field-to-field fluctuations that affect pencil-beam RGB LOSV measurements. Furthermore, the MW halo is effectively transparent in the narrow-band [O iii] 5007 Å filter that is used for imaging PNe in M 31.
In this paper, we present in Section 2, the first LOSV measurements of PNe co-spatial with the entire observed range of M 31 inner-halo substructures in M 31, namely G1-Clump, W-Shelf, NE-Shelf and GS. We also present the LOSV of the PNe in the spatial region where the CGS is predicted by Hammer et al. (2018). For the G1-clump, this is the first set of LOSV measurements over the entire spatial coverage of this substructure from any tracer. We compare the observed LOSVs for each substructure with that of simulated analogues in the highest resolution major-merger (mass-ratio 1:4) simulation by Hammer et al. (2018). We compare the measured LOSV distribution and position-velocity plots in Section 3. We discuss our results, comparing also with other simulation predictions, in Section 4. We conclude in Section 5.
2 Data and sample selection
2.1 Observations
The PNe were first identified in a 54 sq. deg imaging survey of M 31 with MegaCam at the CFHT (central 16 sq. deg.– Bhattacharya et al. 2019a; outer fields – Bhattacharya et al. 2021; see also Bhattacharya 2020). Spectroscopic observations of a complete subsample of these PN candidates were carried out with the Hectospec multifibre positioner and spectrograph on the Multiple Mirror Telescope (MMT; Fabricant et al., 2005). Details of the spectroscopic observations and data reduction are discussed in Bhattacharya et al. (2022). Combined with the re-analysis of Hectospec spectra of archival PNe studied by Sanders et al. (2012), we measure the LOSV (VLOS) of 1251 unique PNe (termed the PN_M31_LOSV sample in Bhattacharya et al. 2022 and plotted in Figure 1) from the strongest emission-lines with an uncertainty of 3 km s-1. Only PN with confirmed detection of the [O iii] 4959/5007 Å emission lines are considered in this work.
Sl. No. RA [J2000] DEC [J2000] m5007 VLOS Subs deg deg mag km s-1 4040 8.7133009 39.9081349 20.85 -489 G1 4055 8.8975791 40.0276394 24.08 -406 G1 4372 8.7881072 39.4735326 21.61 -461 G1 4378 8.6723442 39.5793943 23.9 -469 G1 4380 9.0525232 39.5948767 21.27 -445 G1 4381 8.7473006 39.5985174 22.76 -469 G1 4387 8.4966837 39.7048166 22.25 -489 G1 4409 8.7355548 39.4036082 25.77 -500 G1 4414 8.807157 39.957371 25.37 -505 G1 4643 8.6981518 39.6033913 20.71 -467 G1 4660 8.5407341 39.8254211 23.92 -460 G1 1145 9.3681118 42.1826747 22.85 -237 WS 1162 9.2896012 42.2549368 23.29 -221 WS 1241 9.2808607 42.0545865 22.17 -325 WS 1243 8.6005598 42.0871777 22.36 -321 WS 1247 8.9614551 42.3511456 21.35 -303 WS 3542 8.4065861 41.2020724 24.5 -324 WS 3555 8.998651 41.6796182 22.46 -201 WS pn1022 9.113125 42.1060828 21.35 -15 WS pn1031 9.4765417 42.2470283 23.23 -334 WS 322 13.1282865 42.4818166 24.22 -322 NES 373 13.2746797 42.7025819 21.21 -243 NES 1268 12.3680211 40.9982886 21.43 -258 NES 1291 12.1182029 41.2237641 22.13 -285 NES 1301 12.1552798 41.288377 23.06 -165 NES 1306 12.6611455 41.3044376 20.86 -211 NES 1667 11.819722 41.1784581 25.15 -311 NES 1803 11.9689563 41.3185024 25.69 -118 NES 4314 12.8776729 42.1161212 21.26 -266 NES 4315 13.3335287 42.3056055 22.27 -288 NES 4899 13.048083 42.7969448 23.09 -279 NES PNHK133 12.10325 41.1364175 19.99 -356 NES 4169 11.8471063 38.8649003 24.57 -336 GS 4173 11.4665266 38.9510126 24.44 -203 GS 4177 11.3043703 39.0187884 25.97 -342 GS 4178 11.0967258 39.0844815 25.28 -450 GS 4180 11.0388529 39.1048582 26.1 -219 GS 4181 11.7784703 39.1867887 22.46 -449 GS 4182 11.4938274 39.2236968 21.68 -313 GS 4184 10.711797 39.2753675 26.07 -388 GS 4186 11.6045208 39.3359147 26.08 -133 GS 4187 11.5262993 39.3408018 22.83 -380 GS 4194 10.9626204 39.4210327 24.26 -264 GS 4200 10.9822732 39.5134996 25.85 -366 GS 4209 10.9064413 39.6348832 22.97 -488 GS 4210 11.3110249 39.6547866 25.81 -178 GS 4295 12.0958552 38.3689975 24.53 -400 GS 4482 11.3915279 38.2884832 25.07 -245 GS 1163 10.568631 42.2663786 23.33 -309 CGS 1179 10.5702728 42.3418162 23.64 -225 CGS 1190 10.5618461 42.3994257 21.45 -183 CGS 1206 10.5518751 42.5260999 22.01 -303 CGS 1208 10.5638166 42.5355199 25.19 -202 CGS 1223 10.3699999 42.7097802 22.74 -281 CGS pn1028111This PN was not observed by Megacam at the CFHT as it lay on a chip-gap. Hence no m5007 value is reported here. It was observed spectroscopically by Sanders et al. (2012). 9.838166667 42.42119611 – -332 CGS pn3008 9.881625 42.19908528 23.2464 -344 CGS pn3010 10.14729167 42.17555611 22.16 -143 CGS
Substructure NPN <VLOS,PN> <VLOS,sim> <VLOS,host> <VLOS,sat> Rproj,offset fhost km s-1 km s-1 km s-1 km s-1 km s-1 km s-1 km s-1 km s-1 kpc G1-Clump 11 3.51 0.89 W-Shelf 9 1.06 0.63 NE-Shelf 12 0 0.73 GS 16 7.47 0.28 CGS 16 0 0.7
2.2 Substructures in M 31 and their PN sub-samples
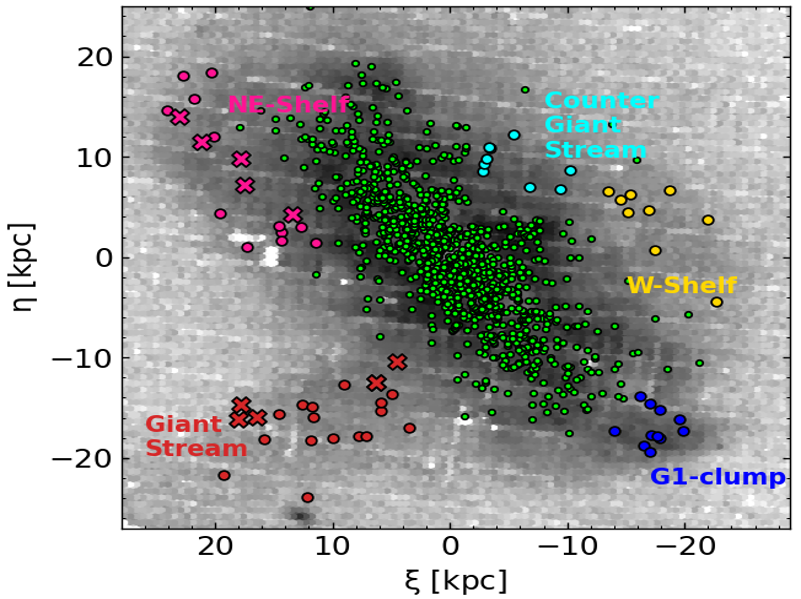
Figure 1 shows the map of RGB stars in the M 31 disc and inner halo from PAndAS (McConnachie et al., 2018). The prominent substructures appear as overdensities in Figure 1 and are marked in different colours (GS – red; NE-Shelf – pink; G1-Clump – dark blue; W-Shelf – yellow). As in Bhattacharya et al. (2021), the PNe co-spatial within a given substructure are considered to belong to that substructure (also coloured accordingly) and used for subsequent analysis. We further mark the expected position of the counter-giant stream (CGS; cyan), a substructure predicted by the simulations of Hammer et al. (2018) but not observed in the map of RGB stars from PAndAS (discussed further in Section 3.1).
In Table 1, we present the VLOS of the PNe in each of the substructures. We note that in Bhattacharya et al. (2021), we identified a larger number of fainter PNe in these substructures from photometry but the LOSV measurements were only possible for a brighter magnitude-limited sub-sample of the PNe. Additionally, Figure 1 shows the position of Keck/Deimos fields where RGB star LOSVs were measured for the NE-Shelf and GS by Escala et al. (2022) and Gilbert et al. (2009) respectively. The detailed comparison of the kinematics of the major merger simulations with the RGB observations of (Dey et al., 2023) will be addressed in a forthcoming publication.
2.3 Observed line-of-sight velocity distribution in M 31 substructures
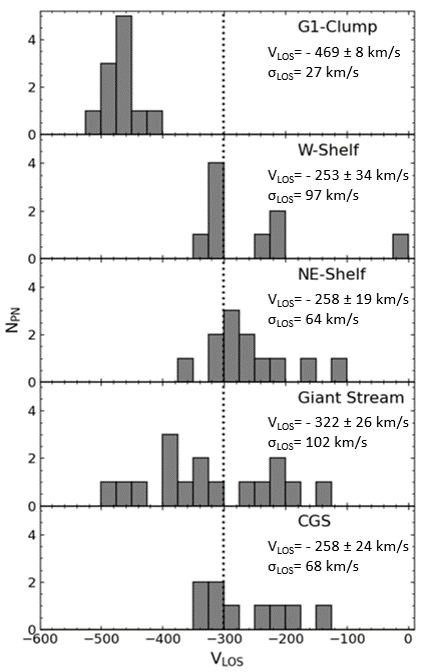
The number of PNe co-spatial with each substructure, their mean LOSV (VLOS,PN) and their LOSV dispersion (), are noted in Table 2. Figure 2 shows the LOSV distributions of PNe in the five substructure regions. We discuss each of them as follows:
-
•
G1-Clump: It has a narrow LOSV distribution, i.e, it is observed to be a relatively dynamically cold substructure having km s-1 and V km s-1. While this is the first dedicated LOSV measurement of the stellar population of the G1-Clump, we can retrospectively see that the RGB LOSV measurements from Reitzel et al. (2004) in the vicinity of the G1-clump, then attributed to the M 31 outer disc by those authors, was plausibly a measurement of RGBs in the G1-clump (they do not provide the RGB positions and individual velocities to allow a direct comparison) with their V km s-1 and km s-1, remarkably consistent with the values measured here.
-
•
W-Shelf: Given the faint nature of this substructure only 9 PNe with LOSV measurements are available. They distribute around two distinct LOSV values of km s-1 and km s-1 with 5 and 3 PNe respectively (see Figure 4), and one additional PN at km s-1. No RGBs spectra are available co-spatial with the W-shelf222Pencil-beam spectroscopy of RGB stars in the W-shelf were attempted by Fardal et al. (2013) but their fields were along the M 31 minor axis, offset from the highest density of the W-shelf where we sample our PNe and close to the region at the boundary of the W-Shelf and CGS. Though some W-shelf stars would be present in these fields, they are more dominated by M 31 disc and halo stars with possible contribution from CGS stars. Hence we do not compare the PN LOSV properties with that of these RGBs.. The Rproj vs. VLOS diagram properties of the PNe and RGB from the DESI survey (Dey et al., 2023) in the W-shelf are discussed in Section 3.3.
-
•
NE-Shelf: The PNe in the NE-Shelf have km s-1 and V km s-1. Their LOSV distribution is also broad though narrower than the GS. All NE-shelf RGBs studied by Escala et al. (2022) have km s-1 and V km s-1. The Rproj vs. VLOS diagram properties of the PNe and RGB in the NE-shelf are discussed in detail in Section 3.3.
-
•
GS: The GS PNe have a broad LOSV distribution with km s-1 and V km s-1. The two components in the GS, as identified by Gilbert et al. (2009) having 20 km s-1 but offset by 100 km s-1 with VLOS,RGB varying with distance from M 31 center (see additional discussion in Section 3.3), are not readily identifiable in the PN LOSV distribution (possibly given our lower number statistics). If taken together, all GS RGBs studied by Gilbert et al. (2009) have km s-1 and V km s-1. The lower mean LOSV of the RGB compared to the PN is because the RGB measurements in the GS are much closer to the M 31 disc than the PNe (see Section 3.3). Note that the two kinematic components are also identified by DESI (Dey et al., 2023) at larger distances (also discussed further in Section 3.3).
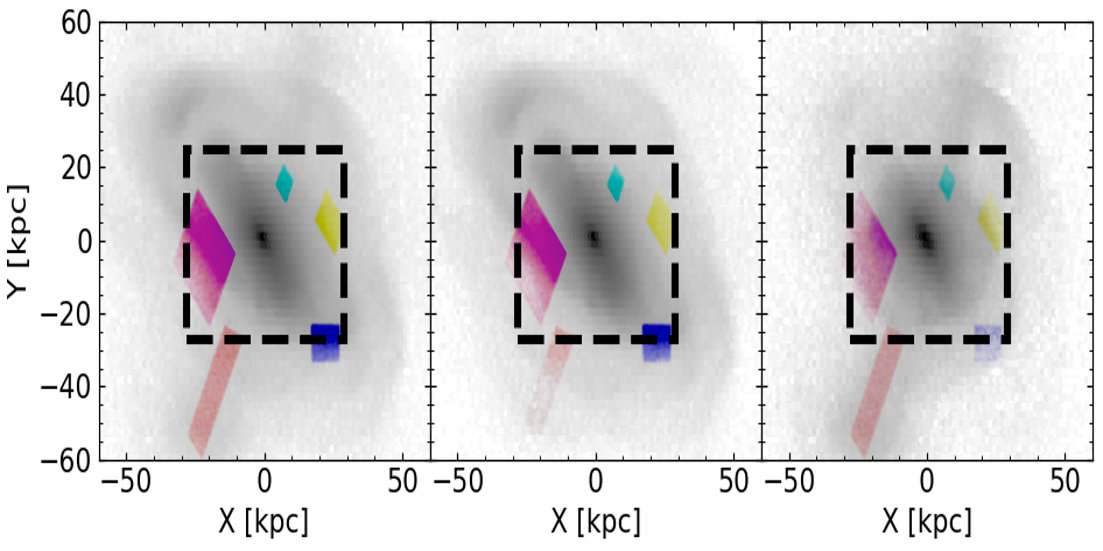
Figure 3: For the major merger model in M 31, we show the number density map of [left] all simulated particles, [middle] only host particles and [right] only satellite particles, accounting for the inclination of M 31. Particles in the five substructure analogous regions are marked with different colours, corresponding to that in Figure 1, i.e., NE-Shelf – pink, GS – red, G1-clump – blue, W-Shelf – yellow, and CGS – cyan . The dashed black box corresponds to the size of the M 31 field shown in Figure 1. -
•
CGS: This substructure is predicted to form by Hammer et al. (2018) but not observed as an overdensity of RGB stars (McConnachie et al., 2018). The surface brightness of this substructure is predicted to vary with time (see Section 3.1 for details). Thus despite the non-observation of an RGB overdensity, the substructure may possibly be observed in the kinematic phase space. The PNe here are selected around the identified expected position of the CGS and have km s-1 and V km s-1.
3 Kinematics of simulated substructures in a major-merger scenario
In this section, we utilise the major-merger simulations from Hammer et al. (2018) to help with the interpretation of the new LOSV data obtained for PNe and for the RGBs which became available in the literature for the substructures in the inner halo of M31. We reiterate that PN LOSV measurements are a discrete sampling of their parent stellar population LOSVs, and thus are representative of the LOSV measurements of the entire M 31 stellar population. I.e., each PNe is representative of a the LOSV of a certain mass of stars in M 31 (to be precise, it is representative of a certain luminosity; see Buzzoni et al. 2006 for details). Since hydrodynamic simulations also have particles representative of a certain mass of stars, the PN LOSV distribution can directly be compared to that of any simulation for the same galaxy (as the number of particles would only be different from the number of PNe by a constant scale factor).
3.1 Major-merger simulation of M 31
The merger simulations by Hammer et al. (2018) were tuned to simultaneously reproduce the observed M 31 disc properties along with the spatial distribution of the faint inner-halo substructures. They were constrained by the structural properties of the inner M 31 galaxy, i.e, bulge-to-total ratio, the 10 kpc star-forming ring, bar and disc size, and the H i disc, as well as by the high velocity dispersion measured ( km s-1) for Gyr old RGB stars in the M 31 disc (Dorman et al., 2015), and the burst of star-formation Gyr ago observed throughout the M 31 disc and inner-halo substructures (Bernard et al., 2015; Williams et al., 2017).
Assuming the GS is the trailing debris of the in-falling satellite (as is also the case for the minor merger scenario; Fardal et al. 2013), and the NE- and W-shelves are formed after the merger from satellite debris, the orbital inclination of the satellite with respect to the M 31 pre-merger disc is constrained. Given the burst of star formation posits a timing of the event 2-3 Gyr ago and given that a satellite massive enough to heat the pre-merger M 31 disc to the observed velocity dispersion values are necessary, Hammer et al. (2018) model a bulgeless thin disc gas-rich (20% gas fraction) satellite in-falling into a more massive gas-rich (20% gas fraction) bulgeless thin disc which is the M 31 progenitor. The same DM fraction of 80% is assumed for both the M 31 disc and satellite progenitors.
The satellite infalls with its first pericentric passage 7 Gyr ago at a large distance from the M 31 disc. The second pericentric passage occurs 3–4 Gyr ago along the GS with the satellite losing some of its mass forming the NE- and W-shelves. However, the satellite is not completely disrupted and instead has a third pericentric passage that occurs 2–3 Gyr ago, forming an overdensity at the CGS and depositing further disrupted material in the GS. The GS formed in this process contains debris trails from the satellite but also of particles from the pre-existing disc. This therefore predicts a broad LOSV distribution for the GS. The satellite then has many short passages around the M 31 center that heats the pre-existing M 31 disc stars to form a thicker disc having high velocity dispersion (as also measured in observations by Bhattacharya et al. 2019b) while also depositing satellite debris. The satellite core finally coalesces with the M 31 core to build-up the M 31 central regions, leaving no separate remnant core. The NE- and W-shelves also have more material deposited in multiple passages though the bulk of the material there is deposited in the second and third pericentric passages. The G1-clump is a dynamically cold substructure formed from perturbed material from the pre-merger M 31 disc and is thus predicted to contain metal-rich stars (Faria et al., 2007; Bhattacharya et al., 2021). Hammer et al. (2018) find that a 1:4 mass ratio merger best reproduces the observed M 31 features they compared.
In this work, we utilise Model 336 from Hammer et al. (2018) for comparing with observations as this is their best model333Five more models have been marked as best models by Hammer et al. (2018) but ran at lower resolution with only 2 million particles. for M 31 that was chosen for their highest resolution run with 20 million particles. Figure 3 shows the simulated spatial distribution of the as M 31 would appear from our line-of-sight. The three panels of Figure 3 show all particles (left), only host particles (center) and only satellite particles (right) respectively. The five analogous regions cospatial to the observed substructures are marked. Both host and satellite particles are observed out to large radii (Figure 3). Their distribution is discussed further in Section 4.4. We note that the disc scale length of the M 31 analogue in this model is 3.6 kpc, which is lower than that for the observed M 31 disc scale length of 6 kpc (Yin et al., 2009). We note also that the substructures evolve over time (see also Cooper et al. 2011) and the model snapshot in Figure 3 is chosen such that the surface brightness of the substructures are close to their observed values. Hence the positions of the model substructures are not exactly at the same distance from the M 31 center as their observed counterparts. The offset in projected radius of the simulated substructure from the observed ones, Rproj,offset, has been noted in Table 2. We can see that the simulated NE-shelf and CGS subregions lie at the same projected radius as their observed analogues but the other substructures are slightly offset. The simulated G1-clump, W-shelf and GS occur kpc, kpc and kpc further away respectively than their observed analogues.
The mean LOSV (VLOS,sim) and their LOSV dispersion () for the particles in each simulated substructure are noted in Table 2. We separately select those particles from the simulation which originate from the M 31 host (or were formed in the resulting disc after the merger) and those originating the satellite. The mean LOSV and dispersion of host (VLOS,host, ) and satellite (VLOS,sat, ) particles for each substructure are also listed in Table 2.
3.2 Line-of-sight velocity distribution of simulated substructures
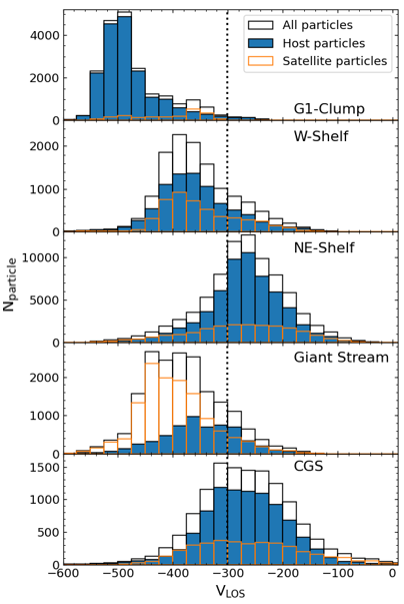
Figure 4 shows the LOSV distributions of simulated particles (separately for all, only host and only satellite particles) for the substructure analogues. This can be qualitatively compared to the LOSV distributions of observed PNe444We note that even though RGB star positions and velocities are available for the Keck/Deimos fields in the NE-Shelf and GS (Gilbert et al., 2009; Escala et al., 2022), the selection function for these RGB stars as well as the choice of field positions makes a direct statistical comparison of LOSV distributions complicated. An additional challenge is the contamination from the MW disc and halo RGBs that vary across field positions in M 31. This is further compounded by the offset in the positions between the observed substructures and their simulated analogues. They are useful for comparing with the simulations upon considering both the spatial and LOSV distributions as in Escala et al. (2022), discussed in Section 3.3. in the M 31 inner halo substructures (Figure 2).
The G1-Clump appears as a relatively dynamically cold substructure in the simulation, predominantly consisting of host particles that peak at a mean value consistent with observation (see Table 2) with satellite particles showing a distinct distribution. For the NE- and W- shelves, both host and satellite particles have overlapping LOSV distributions, with nearly the same mean LOSV value (see Table 2). The particle LOSV distributions in the NE-shelf span the same range as that of the observed PNe while for the W-shelf, a wider distribution is seen than the observed multi-modal LOSV distribution. The satellite and host particles of the GS also have overlapping distributions but have distinct mean LOSV values (see Table 2). The LOSV range spanned is similar to that of the observed PNe in the GS. For the CGS, much like the shelves, the LOSV distributions of host and satellite particles overlap with similar mean values though the satellite particles are expected to be dynamically hotter (see Table 2). The LOSV range spanned is similar to the observed PNe at the expected position of the CGS.
For a quantitative analysis to understand which component of the simulated substructure, if any, are consistent with the observed substructure kinematics, we statistically compare the observed PN LOSV distributions with that of their simulated analogues with an Anderson-Darling test (AD-test; Scholz & Stephens 1987), distinguishing between the host and satellite components. The AD-test usage has been discussed in detail in Bhattacharya et al. (2021, see Section 3.4). It is adopted here to allow the comparison of numerically different data-sets. In Table 3, we note the test significance (equivalent to a p-value) for each compared pair (observed vs. simulated particles separately for all, only host and only satellite particles) for each substructure. The substructure LOSV distributions are identified as being drawn from different parent distributions if the significance is below 0.05. Otherwise, they may or may not be drawn from the same parent distribution. We discuss the comparison for each of the substructures as follows:
-
•
G1-Clump: The observed LOSV distribution of the PNe and satellite particles are drawn from different parent distributions (see Table 3), indicating that the G1-clump is not formed from satellite debris. However, its observed LOSV distribution is consistent with having formed mostly from the host debris especially considering the simulated host mean LOSV, V km s-1 is remarkably similar to the observed value. However, the simulated host LOSV dispersion is higher than observed with km s-1.
-
•
W-Shelf: The observed multi-modal LOSV distribution of the W-Shelf (Figure 2) is not observed for the simulated W-Shelf and hence the AD-test identifies that the simulated particles (also separately host and satellite ones) are drawn from a different parent distribution than the observed values.
-
•
NE-Shelf: The LOSV distributions of both the satellite and host particles are consistent with the observed LOSV distribution.
-
•
GS: The observed LOSV distribution of the PNe and host particles are drawn from different parent distributions (see Table 3) but the satellite particles are consistent with the observed LOSV distribution.
-
•
CGS: The observed PN LOSV distribution is compatible with that for both host and satellite particles. Hence the presence of a distinct substructure at the location of the CGS cannot be established from the LOSV distribution.
Substructure Ad-test significance compared to simulation all particles host particles satellite particles G1-Clump 0.13 0.083 0.001* W-Shelf 0.001* 0.001* 0.001* NE-Shelf 0.25 0.25 0.25 GS 0.065 0.049* 0.06 CGS 0.25 0.25 0.25
While comparing the LOSV distributions of the observed and simulated substructures does shed light on their possible origin as disrupted material from either the satellite or the host galaxy, further insight may be obtained considering both the spatial and LOSV distributions.
3.3 Distribution of observed and simulated substructures in position-velocity phase space
We compare the distribution of the observed PNe and simulated particles from Hammer et al. (2018) in the Rproj vs. LOSV diagram. Recall from Section 3.1 that the simulated substructures do not appear at the exact same distance as their observed counterparts. So we subtract Rproj,offset (see Table 2) from the projected distance of each simulated particle in a given substructure. We discuss the comparison for each of the substructures as follows:
-
•
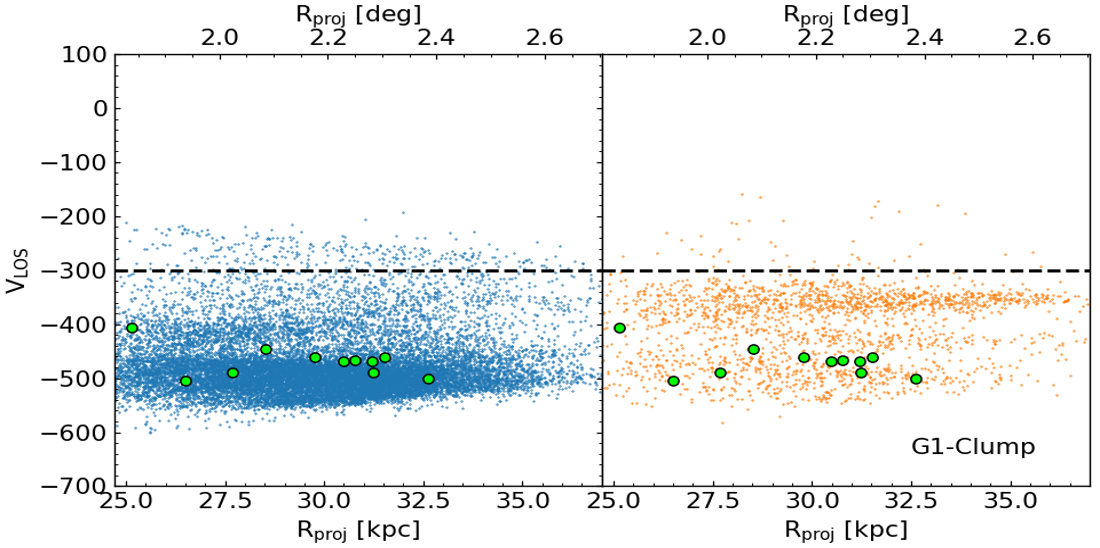
G1-Clump: The Rproj vs. VLOS diagram for the simulated particles and PNe in the G1-clump are shown in Figure 5. The bulk of the host particles in the simulated G1-Clump appear as an extended structure in Rproj with LOSV km s-1. This structure is indeed dynamically cold. The observed PNe in the G1-Clump overlap with this host simulated analogue structure, albeit with slight offset in velocity. While there are a few satellite particles also at the position of the PNe in Figure 5, the satellite particle LOSV distribution is clearly more uniform with an mean LOSV value of km s-1. Given that PNe trace the kinematics of their parent stellar population and given that of the stellar population in the G1-clump comes from the host material (Table 2), the PN thus trace the host material kinematics in M 31.
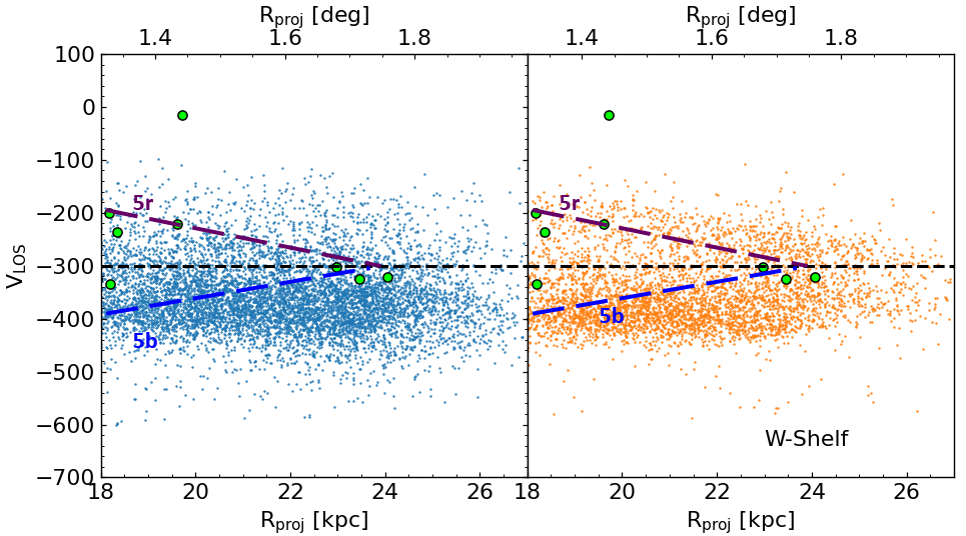
Figure 6: Same as Figure 5 but for the W-shelf. Additionally, the overdensity boundaries identified from the RGB stars in the DESI survey in this phase space are marked with dashed lines (see Section 3.3 for details). -
•
W-Shelf: The Rproj vs. VLOS diagram for the simulated particles and PNe in the W-Shelf are shown in Figure 6. An asymmetric wedge pattern with the lower arm having higher particle density is visible for the satellite particles. The host particles occupy nearly the same parameter space as the lower arm but are denser at higher projected radii. The PNe overlap quite well with the upper arm of the satellite particle distribution, though there is only one PN present at an offset with the lower arm. The RGB stars from the DESI survey (Dey et al., 2023) also trace a wedge pattern in the W-shelf, with the overdensity boundaries (5r – purple; 5b – blue) marked in Figure 6. We note that the PNe, the RGBs555Dey et al. (2023) also show that the PNe presented here (LOSV measured by those authors from archival spectra of our observations) trace the same feature as their RGB stars in position-velocity phase space. and the W-shelf simulated satellite debris trace the same upper arm of the wedge. The RGB overdensity boundary position of the lower arm of the wedge, consistent with that of the single PN at that position, is also offset from the lower arm of the simulated satellite particles.
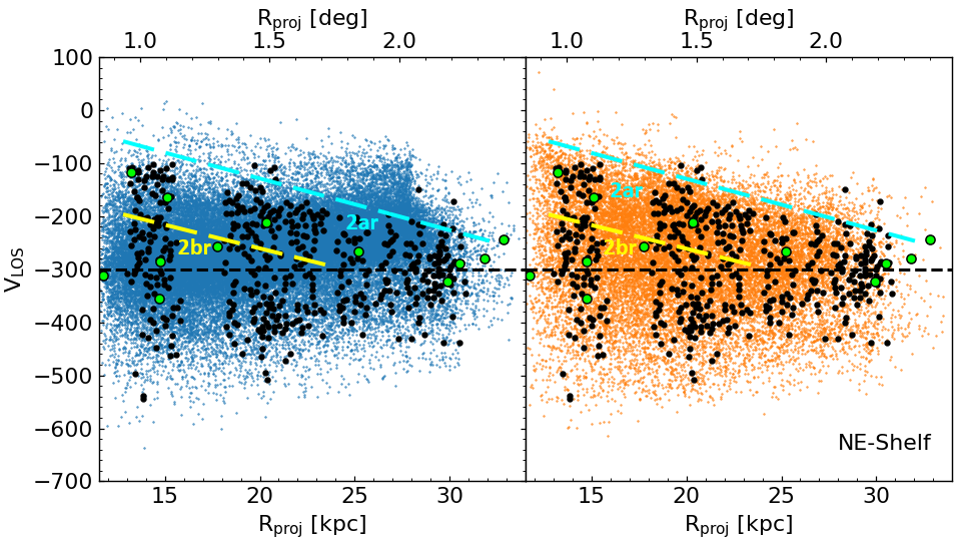
Figure 7: Same as Figure 5 but for the NE-shelf. The overdensity boundaries identified from the RGB stars in the DESI survey in this phase space are marked with dashed lines (see Section 3.3 for details). Additionally, the RGB stars identified by Escala et al. (2022) are marked in black. 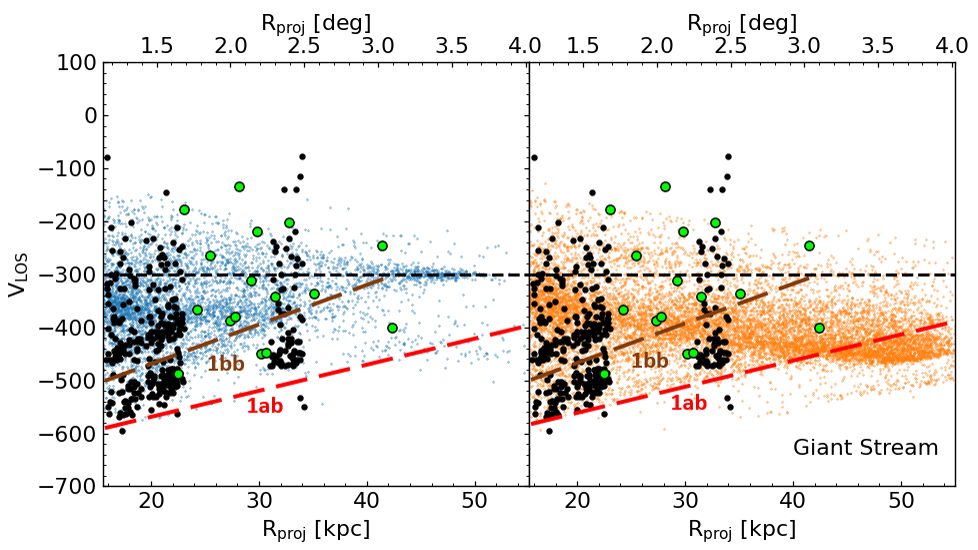
Figure 8: Same as Figure 5 but for the GS. The overdensity boundaries identified from the RGB stars in the DESI survey in this phase space are marked with dashed lines (see Section 3.3 for details). Additionally, the RGB stars identified by Gilbert et al. (2019) are marked in black. -
•
NE-Shelf: The Rproj vs. VLOS diagram for the simulated particles and PNe in the NE-Shelf are shown in Figure 7. The simulated satellite particles show a filled wedge pattern, distributing not only along the arms of the wedge but rather occupying a broader VLOS range that reduces with increased Rproj. The rotating M 31 thick disc is also visible from the distribution of the host particles having V km s-1 at R kpc. The PNe are consistent with both the satellite and host particles in this figure. The RGB stars from Escala et al. (2022), nearly co-spatial with the detected PN positions, overlap with the wedge pattern observed for the NE-shelf, though some of the RGB stars may be associated with the host particles that overlaps with the satellite material in this phase space. Figure 7 also shows the overdensity boundaries (2ar – cyan; 2br – yellow) in the Rproj vs. VLOS phase space of the NE-shelf identified from the RGBs in the DESI survey (Dey et al., 2023). 2ar traces the upper boundary of the wedge traced by the RGBs from Escala et al. (2022) as well as that from the satellite debris in the simulation. 2br is not clearly traced by the DESI RGBs (see Figure 6 in Dey et al. 2023) but its expected position is consistent with the PNe. Overall there is no clear apparent overdensity boundary in this phase space region for the RGBs observed by Escala et al. (2022) nor in the satellite debris in the simulation. We note that the lower boundary of the NE-shelf in this phase space is traced by the PNe cospatial with the M 31 disc but which are velocity outliers (Merrett et al., 2003).
-
•
GS: The Rproj vs. VLOS diagram for the simulated particles and PNe in the GS are shown in Figure 8. The PNe co-spatial with the GS trace a relatively broad distribution in LOSV around the satellite particles. Their spread in LOSV is similar to that of the RGB stars from Gilbert et al. (2009). Figure 8 also marks the median position of the RGB overdensity boundaries in this phase space (Dey et al., 2023) identified recently in the DESI survey of M 31 (1ab – red; 1bb – purple). 1ab and 1bb are the same two kinematic components identified by Gilbert et al. (2009) (see the overdensities for the RGBs nearest to these lines in Figure 8 but with a small velocity offset) but traced out to larger radii. There are some PNe that are along these tracks for the simulated host and satellite particles. We discuss these features in comparison with the simulation in Section 4.3. We note that the main broad high-density nearly-horizontal track of satellite particles seen in Figure 8 does have corresponding RGB stars observed at this position in the phase space (see Figure 6 in Dey et al. 2023) but this is not marked as an overdensity by these authors.
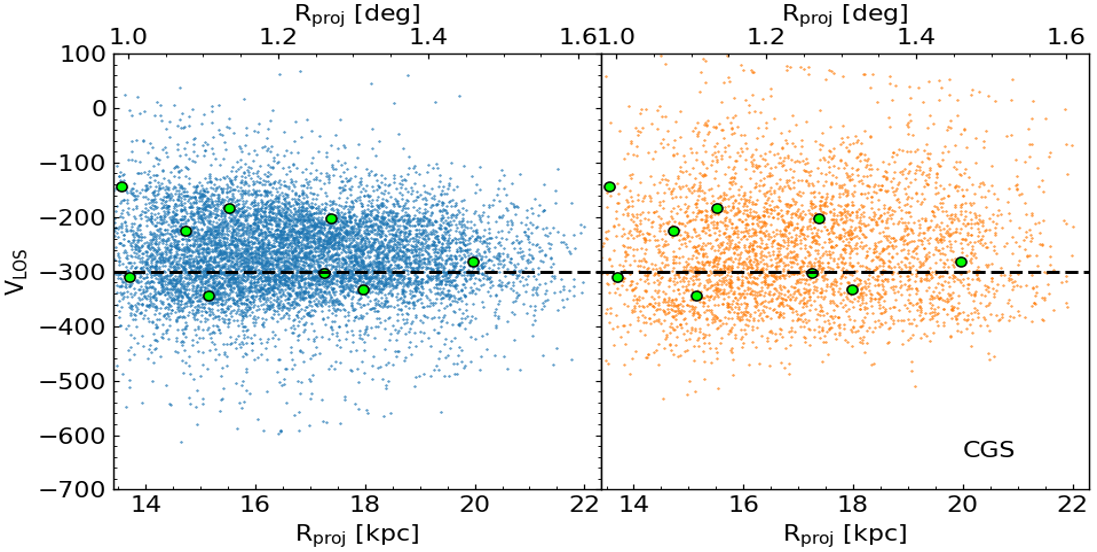
Figure 9: Same as Figure 5 but for the CGS. -
•
CGS: The Rproj vs. VLOS diagram for the simulated particles and PNe in the CGS are shown in Figure 9. While there is an overdensity of host particles (f; Table 2) , the satellite and host particles mostly overlap in Figure 9. As such the PNe can not clearly be attributed to either of the host or satellite. The predicted satellite particle distribution of the CGS is too sparse and close to the simulated M 31 disc. An exploration of PN LOSVs at larger radii along the predicted position of the CGS may be useful in identifying or denying its existence in the Rproj vs. LOSV phase space.
In summary, the Rproj vs. VLOS phase space, together with the LOSV distribution comparison in Section 3.2 provides constraints on the origin of some of the inner-halo substructures in M 31. The relatively dynamically cold ( km s-1) G1-Clump substructure is consistent with a perturbation of the pre-merger M 31 disc, which is a prediction of the major merger simulation. The RGB (consistent also with the PNe) trace the wedge structure for the W-Shelf in the Rproj vs. VLOS phase space, but are different from the asymmetric wedge shape traced by the satellite particles in the W-shelf simulated analogue. The GS PNe have a broad distribution consistent with the Rproj vs. VLOS phase space positions predicted by the major merger simulation. The PNe co-spatial with the NE-Shelf and the CGS location may originate from either the host or the satellite.
4 Discussion
4.1 The G1-clump LOSV measurements as a smoking gun for the major merger in M 31
Given the low luminosity of the G1-clump (L M⊙), Ferguson et al. (2002) had initially suggested it to be a dissolving dwarf galaxy. However, its measured photometric metallicity ([M/H]; Bernard et al. 2015) is too high for a dwarf galaxy. Thus, it has been suggested to be a remnant perturbed from the M 31 disc (Faria et al., 2007). Minor mergers with mass ratio of the order 1:20 (as simulated by Fardal et al. 2013; Kirihara et al. 2017) do not perturb the disc of the host galaxy significantly enough to greatly increase its rotational velocity dispersion (Martig et al., 2014), at least not even close to 3 times that of the MW as measured for the M 31 thicker disc (Dorman et al., 2015; Bhattacharya et al., 2019b). So producing a substructure from perturbed disc material, such as the G1-clump necessitates a major merger event. The G1-Clump has observed metallicity distribution, star formation history (Bernard et al., 2015) and PN Luminosity Function (PNLF) consistent with that of the M 31 disc (Bhattacharya et al., 2021). Its LOSV distribution and Rproj vs. VLOS diagram are consistent with those predicted by the major merger simulation by Hammer et al. (2018), that links its origin to the same merger event that formed the GS, NE-shelf and W-shelf. No separate merger event for the formation of the G1-clump is needed.
The G1-clump LOSV measurements are thus a smoking gun signature that show that the same wet merger (Arnaboldi et al., 2022) event that produced the kinematically (Bhattacharya et al., 2019b) and chemically (Bhattacharya et al., 2022) distinct thin and thick disc in M 31, had the satellite in-fall along the GS (see orbital properties in Table 1 and associated discussion in Hammer et al. 2018) producing the NE- and W-shelves from satellite debris material while the G1-clump formed out of perturbed disc material.
4.2 The wedge pattern for the NE- and W-shelves
The wedge patterns in the Rproj vs. VLOS diagram for the satellite particles in the NE- and W-shelves are predicted by both minor (Fardal et al., 2013; Kirihara et al., 2017) and major merger scenarios (Section 3.3) in M 31 though the relative intensity of the arms of the wedges depend on the morphology and orbital inclination of the infalling satellite (Kirihara et al., 2017). The large spatial coverage of our PN survey allows us to map PNe belonging to different parts of the W-shelf and thereby, in conjunction with the RGB surveyed in the DESI survey (Dey et al., 2023), allowed us to observe its wedge pattern in the Rproj vs. LOSV phase space. The density of the W-shelf wedge pattern is asymmetric for the satellite particles in the major merger model (Figure 6) while the observations support a more symmetric wedge.
We do not observe the wedge-pattern clearly in the NE-Shelf solely from our PN kinematics. However, in tandem with the RGB LOSVs in the NE-Shelf from Escala et al. (2022) (also Dey et al. 2023), the wedge pattern in the Rproj vs. VLOS diagram is observed. The observed pattern is consistent with the satellite debris for both minor merger (see Figure 10 in Escala et al. 2022) and major merger simulation predictions (Figure 7). While some of the RGB stars and PNe are tracing the wedge pattern of satellite debris, some fraction of them are likely also tracing the M 31 thick disc that overlaps the NE-shelf in the Rproj vs. LOSV phase space (Figure 7).
In this regard, we note that f and for the NE-shelf and W-shelf simulated analogues respectively. Since PNe trace the kinematics of the entire parent stellar population, it is expected that similar percentages of PNe would trace the NE- and W-shelf host LOSVs. But at least for the W-shelf, the PNe seem to only trace the satellite particles (Figure 6). A feature of the major merger simulations in Hammer et al. (2018) is that the positions of the substructures vary with time. The large percentage of host particles in the shelves is likely a consequence of these substructures forming close to the M 31 disc in these simulations (see Section 3.1 for details), with the disc being thicker and dynamically hotter than that adopted in minor merger simulations (e.g. Fardal et al., 2013).
In Bhattacharya et al. (2021), we had also found that the NE-Shelf and GS PNLF shapes connect their stellar population to the satellite stellar population, while they are quantitatively different from that of the M 31 disc. The same conclusion was reached by Escala et al. (2022) from the photometric metallicity of the NE-shelf and GS RGBs. The wedge patterns in the Rproj vs. LOSV phase space for the NE and W-shelves confirm the long-predicted hypothesis (Ibata et al., 2004) that the NE-shelf, W-shelf and GS were formed in the same merger event. However, given current observations these patterns only constrain the orbital characteristics of the infalling satellite and do not yet set definite values its mass and morphology (though deeper observations may help distinguish subtle differences).
4.3 The Giant Stream and the infalling satellite
The broad LOSV distribution of the GS and its distribution in the Rproj vs. VLOS diagram as traced by PNe are consistent with the predictions from the major merger simulation of Hammer et al. (2018), whereas the minor merger scenario simulations predicted a narrower (20 km) single component LOSV distribution as a function of Rproj (Fardal et al., 2012; Kirihara et al., 2017).
A fascinating prediction of the major merger simulation is that at low Rproj, the GS contains not only satellite debris but also a substantial amount of host particle debris (see Figure 8). In particular, note the central overdensities in the Rproj vs. VLOS diagram that are almost identical for both host (at low Rproj) and satellite particles. The initial angular momentum of the host, satellite, and that of the GS orbit were all different from each other. So the only way for the satellite and host particles in the central overdensity to have the same angular momentum is that there are stars from the host now belonging to the GS. The host particles were likely brought along by the satellite during its multiple pericenter passages and deposited along the GS at low Rproj. We note that the PNe sample at a higher Rproj region in the GS where their LOSV distribution is statistically distinct from that of the host particles (as found in Section 3.2) while the lower Rproj region is sampled by RGBs from Gilbert et al. (2009).
There is also a clear wedge structure of host material (Figure 8 [left]). The 1bb structure re-identified in Dey et al. (2023) (originally called KCC by Gilbert et al. 2009) out to large radii is consistent with being the edge of this wedge of host material. The 1ab structure (attributed to the main body of the GSS by Gilbert et al. 2009) is consistent with a trail of satellite debris seen in Figure 8 [right]. We reiterate that the bulk of satellite debris present in the central overdensity in this phase space has many corresponding RGB stars observed along this trail by Dey et al. (2023, see their Figure 6) but were not marked as an overdensity by them. The major merger model would thus explain the two kinematic components identified by Gilbert et al. (2009) and Dey et al. (2023) as dominated by host and satellite material respectively.
The origin of stars/PNe in the GS either from the host or satellite would be imprinted in their chemical abundances. Indeed a variation in the percentage mass of host material, decreasing with projected radial distance from M 31 along the GS, would naturally predict a variation of metallicity in the GS with Rproj. A metallicity gradient along the GS has been measured from isochrone fitting of photometric RGB observations (E.g. Conn et al., 2016) as well as for spectroscopy of RGB stars (Escala et al., 2021) though such a gradient was not observed by Dey et al. (2023). Comparison of the metallicity distributions of RGB stars with predictions from the major merger simulation by Hammer et al. (2018) would be necessary to constrain the presence of host galaxy material in the GS, and is planned for a future work.
4.4 Formation of an in-situ halo in M 31
Figure 3 shows the number density map of simulated particles in the highest resolution major merger model of M 31 from Hammer et al. (2018). While host and/or satellite particles form the different inner halo substructures during the merger (as discussed in the previous sections), they also populate the extended halo in this simulation out to large radii. Indeed, in addition to the substructure velocities observed in the position-velocity plots in Figures 5–9, we observe particles (for both host and satellite) populating the entire range of velocities in each substructure region. These likely belong to the extended halo formed in the major merger simulation666Note that no halo particles were present at the start of the simulation; see Section 3.1 for details.. Hammer et al. (2018) have already shown that the mass density profile (see their Figure 14) and metallicity (see their Figure 16) of their simulated particles in the halo of M 31 is qualitatively consistent with that observed from RGB stars (PAndAS, Ibata et al., 2014). Here we explore the relative fraction of host and satellite particles in the M 31 halo in this major-merger simulation.
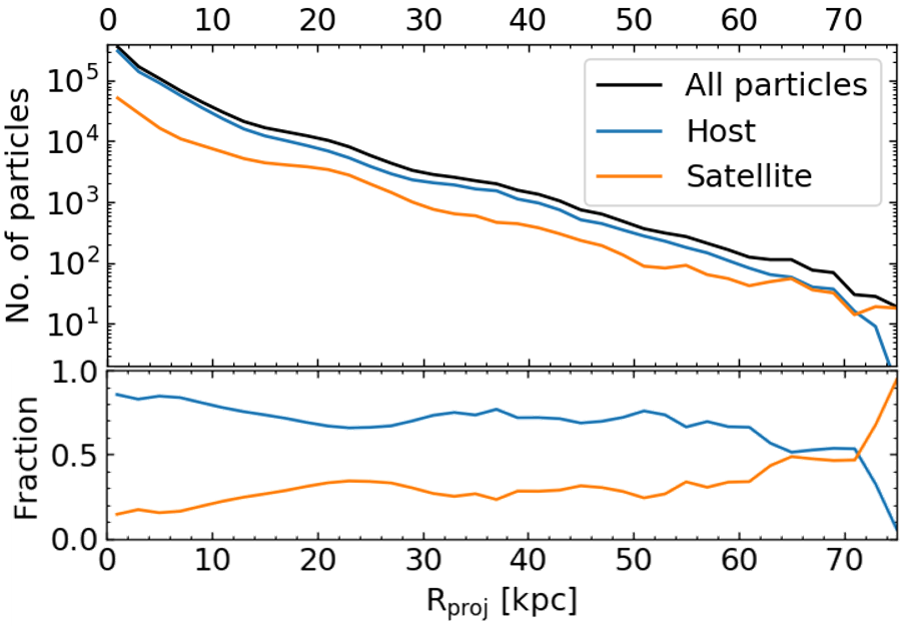
Figure 10 shows the number as well as fractions of host and satellite particles, in a 30∘ cone around the disc minor axis (to limit the contribution of the M 31 disc and exclude the GS), as a function of projected radial distance from the center of M 31. The fraction of satellite particles is low (%) within R kpc along the minor axis where the disc dominates but slowly increases to 35% at R kpc. At this radii, the NE- & W-shelves are present in the simulation (see Figure 3) with a significant fraction of satellite debris (see Section 4.1). Beyond R kpc, there are no bright substructures present and allows exploration of the inner halo of M 31 predicted from the simulation. The host particles constitute 70% of the M 31 halo at R30–60 kpc while the satellite particles constitute the other 30%. Beyond R60 kpc, the satellite particle fraction increases rapidly till R75 kpc, beyond which almost no host particles are present and the sparse M 31 halo is dominated almost exclusively by satellite particles. The major merger simulation by Hammer et al. (2018) thus predicts that the halo of M 31 is mainly constituted by in-situ host particles that dominate over the accreted satellite particles out to R60 kpc.
We recall that in this simulation, the bulk of the satellite material is deposited in the central regions of M 31 (see Section 3.1). This is consistent with the predictions from N-body simulations of Karademir et al. (2019) where more massive satellites are found to deposit the bulk of their material at central regions of the host, whereas in minor mergers, the less massive satellites deposit their materials in the outskirts.
In the MW, the last major merger (also with mass ratio1:4) has been reported to have happened 10 Gyr ago (e.g. Belokurov et al., 2018; Helmi et al., 2018). This event is thought to have formed an additional inner halo component (called the splash by Belokurov et al. 2020) from the pre-merger MW disc. Grand et al. (2020) showed with the Auriga simulations of the MW that a major merger with a gas-rich satellite (almost 90% gas mass given the early epoch) can form the puffed up MW thick disc and contribute an additional inner halo component from the particles in the proto-MW galaxy.
The major merger simulation (though at a much later epoch) for M 31 also predicts the formation of an in-situ halo from similarly splashed out host material that dominates the accreted halo from satellite material out to 60 kpc (Figure 10). This is qualitatively consistent with the identification of metal-rich RGB stars in the M 31 inner halo (in the disc line-of-sight as well as in pencil-beam fields in the inner halo substructure regions and along the minor axis of M 31) in the SPLASH survey (Dorman et al., 2013; Escala et al., 2023) that are considered to be kicked-up stars from the M 31 disc stellar population.
A quantitative comparison of the observed number density (Gilbert et al., 2012; Ibata et al., 2014), kinematic (Dorman et al., 2013; Gilbert et al., 2012) and metallicity (Escala et al., 2020; Wojno et al., 2022; Escala et al., 2023) measurements in M 31 with that of the extended halo from the major merger simulation by Hammer et al. (2018) would be required to investigate if such a scenario is consistent with the observed halo properties in M 31. Such an investigation will be carried out in a forthcoming work.
Finally, we note that given the ubiquity of host particles in the M 31 inner halo within R60 kpc, it is unsurprising to find relatively high fractions of host material in the M 31 substructure fields studied in this work (see Table 2). The substructure spatial regions with relatively high fractions of satellite debris material, such as the GS and the two shelves, would thus be primarily composed of this satellite debris material but lying co-spatially on the host material-dominated inner halo, as has been discussed in Sections 4.2 & 4.3.
4.5 On the possibility that M 32 is the remnant core of the merged satellite
We note that given the NE-shelf, W-shelf and GS were formed in the same merger event, the orbit of the satellite is well constrained (see the orbital characteristics in Fardal et al. 2013 as well as in Hammer et al. 2018) with the GS as the trailing trail of the satellite. D’Souza & Bell (2018a) presented arguments favouring the compact elliptical dwarf galaxy M 32 (projected 24′ away from the center of M 31; R kpc) as the remnant of the infalling satellite by comparison with a candidate analogue from the Illustris cosmological simulation. However, in that analogue, the GS formed as a leading tail of the merger. Such an analogue is ruled out given the constraints on the M 31 satellite infall orbit with the GS being a trailing tail.
In the major merger scenario from Hammer et al. (2018), which is favoured given the formation of the G1-Clump in the same event, the two merging galaxies are assumed to be bulgeless thin discs (see Section 3.1 for details). Given this assumption, no core would survive and most of the satellite material would be dispersed in the central regions of the host. However for the formation of a compact dwarf elliptical like M 32, the progenitor satellite would need to also have a dense bulge (D’Souza & Bell, 2018a). The satellite would still be required to infall along the GS, produce the shelves, dynamically heat the M 31 thicker disc to its observed values (Bhattacharya et al., 2019b) while also producing the G1-clump and its remant core would then need to be present at the observed position of M 32. Simulations similar to Hammer et al. (2018) but with both disc galaxies having initial bulges would be required to constrain whether an M 32 like remnant is possible given the stringent orbit constrains. Furthermore, precise constraints on M 32’s proper motion measurements (as is underway with HST; Sohn et al. 2020) would allow us to determine if such satellite infall orbits are possible.
4.6 On the dark matter fraction of the satellite in merger simulations
Sadoun et al. (2014) and Milošević et al. (2022) support a similar minor-merger (mass ratio of barionic mass 1:20) scenario as Fardal et al. (2013) but prefer a more massive satellite M⊙, including DM. Milošević et al. (2022) posit that the merger happened 2.4–2.9 Gyr ago which would produce a GS with two kinematic components (debris left in overlapping orbits of the satellite) that appears as a broad distribution of the GS in the Rproj vs. VLOS diagram, while also being consistent with the observed metallicity gradient of the GS (E.g. Conn et al., 2016). However, in their simulation the host galaxy has a DM mass fraction of 80% while the satellite has a DM mass fraction of 95% (note that in the simulations by Hammer et al. 2018, both host and satellite had 80% DM content). This means that though that their baryonic merger mass ratio may be 1:20 but the total merger mass ratio (including DM) is 1:5. Given the stellar mass – halo mass relation favours higher DM fraction in dwarf galaxies (E.g. Brook et al., 2014), such a scenario is indeed possible. We however note that Milošević et al. (2022) had assumed a gas-free satellite infall and thus simulated a ‘dry’ merger in M 31. The radial abundance gradient measured by PNe in the thin and thicker disc of M 31 (Bhattacharya et al., 2022) as well as their distribution in the log(O/Ar) vs. 12+ log(Ar/H) plane (Arnaboldi et al., 2022) necessitate a ‘wet’ merger in M 31, ruling out a gas-free satellite.
Thus, we can not concretely claim that the infallen satellite in M 31 had a baryonic mass (stars as well as gas) 25% that of M 31, but certainly its total mass (including DM) would be 25% that of M 31. The formation of a G1-clump simulated counterpart, as well as keeping other constraints, in a merger simulation with different DM fractions for the host and satellite galaxies still needs to be explored.
5 Conclusion
In this work, we present the first LOSV measurements of PNe co-spatial with five inner halo substructures of M 31. We compare their LOSV distribution and distribution in the Rproj vs. VLOS diagram with that from a major-merger simulation by Hammer et al. (2018). Our conclusions are as follows:
-
1.
The G1-clump is a dynamically cold substructure whose observed mean LOSV is remarkably consistent with being formed from the perturbed disc of M 31 (independently supported from its PNLF; Bhattacharya et al. 2021) during the same major merger event that formed the GS, NE-shelf and W-shelf. It is the smoking gun for the major merger scenario (mass ratio 1:4 including DM; Hammer et al. 2018) in M 31 as such a structure can not be formed in a minor merger scenario.
-
2.
In the Rproj vs. VLOS diagrams for the two shelves and the GS, the PNe are consistent with the observations for their RGB counterparts and the predictions from the major merger simulations. We identify the wedge structures in the Rproj vs. VLOS diagram for the W- and NE-shelves, while the GS PNe have an extended distribution in this plane.
-
3.
The major merger model by Hammer et al. (2018) predicts different distributions of the host and satellite particles in the Rproj vs. VLOS diagrams for different substructures (see Section 3). In particular the GS is dominated by satellite material. The two GS kinematic components, KCC and main GS, identified from RGBs (Gilbert et al., 2009; Dey et al., 2023) are consistent with the host dominated and satellite dominated debris material respectively. However, the PNe co-spatial with the predicted CGS position, through their LOSVs, can neither validate nor disprove the existence of the CGS.
-
4.
The major merger simulation also predicts that the M 31 inner (R kpc) halo is primarily ( 70%) constituted by in-situ host material that has been splashed out during the merger event. This is qualitatively consistent with the observed prevalence of kicked-up metal-rich disc RGB stars in the M 31 inner halo (Escala et al., 2023).
We can now paint a more comprehensive picture of the recent merger history of M 31 based on PN LOSV measurements, their PNLF (Bhattacharya et al., 2021), the age velocity dispersion relation of the M 31 thin and thicker discs (Bhattacharya et al., 2019b; Dorman et al., 2015) as well as their chemistry (Arnaboldi et al., 2022; Bhattacharya et al., 2022). M 31 has had a recent (2.5–4 Gyr ago777The PNe themselves would only limit the time of merger to 2.5–4.5 Gyr ago as the high-extinction PNe in the thin disc have a mean age of 2.5 Gyr while the low-extinction PNe in the thicker disc of M 31 have ages of 4.5 Gyr or more (Bhattacharya et al., 2019b). However, the presence of Gyr old RGB stars in the GS (Gilbert et al., 2009) would set the time of the merger to between 2.5–4 Gyr ago.) major merger with mass ratio 1:5 (Bhattacharya et al., 2019b) with the gas-rich satellite falling along the Giant Stream that perturbed the pre-merger disc to form the M 31 thicker disc while also forming the NE- & W-shelves from satellite debris, and the G1-clump from disc debris. The M 31 thin disc is re-formed in a burst of star formation (Bernard et al., 2015; Williams et al., 2017) from pre-merger M 31 gas mixed with metal-poor gas brought in by the satellite (Bhattacharya et al., 2022; Arnaboldi et al., 2022).
The LOSV distributions of the M 31 inner halo substructures (G1-clump, NE and W-shelves, and GS) are interpreted consistently by the major merger simulation by Hammer et al. (2018). The G1-clump LOSV measurements in particular necessitate a recent major merger (including DM) in M 31 to form this substructure, ruling out minor merger scenarios (mass ratio 1:20–1:10 including DM). This wet merger simulation is also consistent with observations in its predictions of a disrupted thick disc in M 31 along with that of a thin disc from gas brought in by the satellite.
Next steps include a comparison of the major merger simulation predictions (Hammer et al., 2018) with RGB LOSV measurements from DESI (Dey et al., 2023) as well as with the chemistry of the PNe (Bhattacharya et al., 2022; Arnaboldi et al., 2022) and RGB stars (Escala et al., 2023) in the M 31 disc and substructures respectively. Furthermore, deeper spectroscopic observations of substructure PNe would enable determination of their chemical abundances (E.g. Bhattacharya et al., 2022), and thereby the chemical abundances and enrichment history of the substructures they are associated with may be inferred (as in Arnaboldi et al., 2022). The subtle differences in the substructure phase space associated with different mass and morphologies of the infalling satellite (E.g. Kirihara et al., 2017; Hammer et al., 2018) would require a high resolution sampling of their phase space, possible when PNe and RGB LOSV measurements are utilized in conjunction.
Acknowledgements
We thank the anonymous referee for their comments. SB is funded by the INSPIRE Faculty award (DST/INSPIRE/04/2020/002224), Department of Science and Technology (DST), Government of India. SB and MAR thank the European Southern Observatory, Garching, Germany for supporting SB’s visit through the 2021 SSDF. This research was supported by the Excellence Cluster ORIGINS which is funded by the Deutsche Forschungsgemeinschaft (DFG, German Research Foundation) under Germany´s Excellence Strategy – EXC-2094 – 390783311. YY thanks the National Natural Foundation of China (NSFC No. 12041302 and No. 11973042). YY and FH thank for the support the International Research Program Tianguan, which is an agreement between the CNRS, NAOC and the Yunnan University. Based on observations obtained at the MMT Observatory, a joint facility of the Smithsonian Institution and the University of Arizona, and with MegaPrime/MegaCam, a joint project of CFHT and CEA/DAPNIA, at the Canada-France-Hawaii Telescope (CFHT). This research made use of Astropy– a community-developed core Python package for Astronomy (Astropy Collaboration et al., 2013), SciPy (Virtanen et al., 2019), NumPy (Oliphant, 2015) and Matplotlib (Hunter, 2007). This research also made use of NASA’s Astrophysics Data System (ADS888https://ui.adsabs.harvard.edu).
Data Availability
Table 1 provides the required data on the VLOS of the PNe in each substructure. The PN spectra can be shared upon reasonable request to the authors.
References
- Aniyan et al. (2018) Aniyan S., et al., 2018, MNRAS, 476, 1909
- Aniyan et al. (2021) Aniyan S., Ponomareva A. A., Freeman K. C., Arnaboldi M., Gerhard O. E., Coccato L., Kuijken K., Merrifield M., 2021, MNRAS, 500, 3579
- Arnaboldi et al. (2022) Arnaboldi M., et al., 2022, A&A, 666, A109
- Astropy Collaboration et al. (2013) Astropy Collaboration et al., 2013, A&A, 558, A33
- Belokurov et al. (2018) Belokurov V., Erkal D., Evans N. W., Koposov S. E., Deason A. J., 2018, MNRAS, 478, 611
- Belokurov et al. (2020) Belokurov V., Sanders J. L., Fattahi A., Smith M. C., Deason A. J., Evans N. W., Grand R. J. J., 2020, MNRAS, 494, 3880
- Bernard et al. (2012) Bernard E. J., et al., 2012, MNRAS, 420, 2625
- Bernard et al. (2015) Bernard E. J., et al., 2015, MNRAS, 446, 2789
- Bhattacharya (2020) Bhattacharya S., 2020, PhD thesis, Ludwig-Maximilians University of Munich, Germany, doi:10.5282/edoc.27186
- Bhattacharya et al. (2019a) Bhattacharya S., Arnaboldi M., Hartke J., Gerhard O., Comte V., McConnachie A., Caldwell N., 2019a, A&A, 624, A132
- Bhattacharya et al. (2019b) Bhattacharya S., et al., 2019b, A&A, 631, A56
- Bhattacharya et al. (2021) Bhattacharya S., Arnaboldi M., Gerhard O., McConnachie A., Caldwell N., Hartke J., Freeman K. C., 2021, A&A, 647, A130
- Bhattacharya et al. (2022) Bhattacharya S., et al., 2022, MNRAS, 517, 2343
- Brook et al. (2014) Brook C. B., Di Cintio A., Knebe A., Gottlöber S., Hoffman Y., Yepes G., Garrison-Kimmel S., 2014, ApJ, 784, L14
- Buzzoni et al. (2006) Buzzoni A., Arnaboldi M., Corradi R. L. M., 2006, MNRAS, 368, 877
- Conn et al. (2016) Conn A. R., et al., 2016, MNRAS, 458, 3282
- Cooper et al. (2011) Cooper A. P., et al., 2011, ApJ, 743, L21
- D’Souza & Bell (2018a) D’Souza R., Bell E. F., 2018a, Nature Astronomy, 2, 737
- D’Souza & Bell (2018b) D’Souza R., Bell E. F., 2018b, MNRAS, 474, 5300
- Dey et al. (2023) Dey A., et al., 2023, ApJ, 944, 1
- Dorman et al. (2013) Dorman C. E., et al., 2013, ApJ, 779, 103
- Dorman et al. (2015) Dorman C. E., et al., 2015, ApJ, 803, 24
- Escala et al. (2020) Escala I., Kirby E. N., Gilbert K. M., Wojno J., Cunningham E. C., Guhathakurta P., 2020, ApJ, 902, 51
- Escala et al. (2021) Escala I., Gilbert K. M., Wojno J., Kirby E. N., Guhathakurta P., 2021, AJ, 162, 45
- Escala et al. (2022) Escala I., Gilbert K. M., Fardal M., Guhathakurta P., Sanderson R. E., Kalirai J. S., Mobasher B., 2022, AJ, 164, 20
- Escala et al. (2023) Escala I., Quirk A. C. N., Guhathakurta P., Gilbert K. M., Wojno J. L., Cullinane L., Williams B. F., Dalcanton J., 2023, AJ, 165, 75
- Fabricant et al. (2005) Fabricant D., et al., 2005, Publications of the Astronomical Society of the Pacific, 117, 1411
- Fardal et al. (2006) Fardal M. A., Babul A., Geehan J. J., Guhathakurta P., 2006, MNRAS, 366, 1012
- Fardal et al. (2007) Fardal M. A., Guhathakurta P., Babul A., McConnachie A. W., 2007, MNRAS, 380, 15
- Fardal et al. (2012) Fardal M. A., et al., 2012, MNRAS, 423, 3134
- Fardal et al. (2013) Fardal M. A., et al., 2013, MNRAS, 434, 2779
- Faria et al. (2007) Faria D., Johnson R. A., Ferguson A. M. N., Irwin M. J., Ibata R. A., Johnston K. V., Lewis G. F., Tanvir N. R., 2007, AJ, 133, 1275
- Ferguson & Mackey (2016) Ferguson A. M. N., Mackey A. D., 2016, in Newberg H. J., Carlin J. L., eds, Vol. 420, Tidal Streams in the Local Group and Beyond. p. 191, doi:10.1007/978-3-319-19336-6_8
- Ferguson et al. (2002) Ferguson A. M. N., Irwin M. J., Ibata R. A., Lewis G. F., Tanvir N. R., 2002, AJ, 124, 1452
- Gilbert et al. (2009) Gilbert K. M., et al., 2009, ApJ, 705, 1275
- Gilbert et al. (2012) Gilbert K. M., et al., 2012, ApJ, 760, 76
- Gilbert et al. (2019) Gilbert K. M., Kirby E. N., Escala I., Wojno J., Kalirai J. S., Guhathakurta P., 2019, ApJ, 883, 128
- Grand et al. (2020) Grand R. J. J., et al., 2020, MNRAS,
- Guhathakurta et al. (2005) Guhathakurta P., Ostheimer J. C., Gilbert K. M., Rich R. M., Majewski S. R., Kalirai J. S., Reitzel D. B., Patterson R. J., 2005, arXiv e-prints [astro-ph/0502366]
- Hammer et al. (2018) Hammer F., Yang Y. B., Wang J. L., Ibata R., Flores H., Puech M., 2018, MNRAS, 475, 2754
- Hartke et al. (2022) Hartke J., et al., 2022, A&A, 663, A12
- Helmi et al. (2018) Helmi A., Babusiaux C., Koppelman H. H., Massari D., Veljanoski J., Brown A. G. A., 2018, Nature, 563, 85
- Hopkins et al. (2009) Hopkins P. F., Cox T. J., Younger J. D., Hernquist L., 2009, ApJ, 691, 1168
- Hunter (2007) Hunter J. D., 2007, Computing In Science & Engineering, 9, 90
- Ibata et al. (2001) Ibata R., Irwin M., Lewis G., Ferguson A. M. N., Tanvir N., 2001, Nature, 412, 49
- Ibata et al. (2004) Ibata R., Chapman S., Ferguson A. M. N., Irwin M., Lewis G., McConnachie A., 2004, MNRAS, 351, 117
- Ibata et al. (2014) Ibata R. A., et al., 2014, ApJ, 780, 128
- Johnston et al. (2008) Johnston K. V., Bullock J. S., Sharma S., Font A., Robertson B. E., Leitner S. N., 2008, ApJ, 689, 936
- Karademir et al. (2019) Karademir G. S., Remus R.-S., Burkert A., Dolag K., Hoffmann T. L., Moster B. P., Steinwandel U. P., Zhang J., 2019, MNRAS, 487, 318
- Kirihara et al. (2017) Kirihara T., Miki Y., Mori M., Kawaguchi T., Rich R. M., 2017, MNRAS, 464, 3509
- Mackey et al. (2019) Mackey D., et al., 2019, Nature, 574, 69
- Martig et al. (2014) Martig M., Minchev I., Flynn C., 2014, MNRAS, 443, 2452
- McConnachie et al. (2009) McConnachie A. W., et al., 2009, Nature, 461, 66
- McConnachie et al. (2018) McConnachie A. W., et al., 2018, ApJ, 868, 55
- Merrett et al. (2003) Merrett H. R., et al., 2003, MNRAS, 346, L62
- Merrett et al. (2006) Merrett H. R., et al., 2006, MNRAS, 369, 120
- Milošević et al. (2022) Milošević S., Mićić M., Lewis G. F., 2022, MNRAS, 511, 2868
- Oliphant (2015) Oliphant T. E., 2015, Guide to NumPy, 2nd edn. CreateSpace Independent Publishing Platform, USA
- Pulsoni et al. (2018) Pulsoni C., et al., 2018, A&A, 618, A94
- Reitzel et al. (2004) Reitzel D. B., Guhathakurta P., Rich R. M., 2004, AJ, 127, 2133
- Sadoun et al. (2014) Sadoun R., Mohayaee R., Colin J., 2014, MNRAS, 442, 160
- Sanders et al. (2012) Sanders N. E., Caldwell N., McDowell J., Harding P., 2012, ApJ, 758, 133
- Scholz & Stephens (1987) Scholz F. W., Stephens M. A., 1987, Journal of the American Statistical Association, 82, 918
- Sohn et al. (2020) Sohn T., et al., 2020, in American Astronomical Society Meeting Abstracts #235. p. 324.02
- Virtanen et al. (2019) Virtanen P., et al., 2019, arXiv e-prints, p. arXiv:1907.10121
- Watkins et al. (2013) Watkins L. L., Evans N. W., van de Ven G., 2013, MNRAS, 430, 971
- Williams et al. (2017) Williams B. F., et al., 2017, ApJ, 846, 145
- Wojno et al. (2022) Wojno J. L., et al., 2022, arXiv e-prints, p. arXiv:2211.15288
- Yin et al. (2009) Yin J., Hou J. L., Prantzos N., Boissier S., Chang R. X., Shen S. Y., Zhang B., 2009, A&A, 505, 497
- Zinchenko et al. (2015) Zinchenko I. A., Berczik P., Grebel E. K., Pilyugin L. S., Just A., 2015, ApJ, 806, 267