Why not both? Complementing explanations with uncertainty, and the role of self-confidence in Human-AI collaboration
Abstract
AI and ML models have already found many applications in critical domains, such as healthcare and criminal justice. However, fully automating such high-stakes applications can raise ethical or fairness concerns. Instead, in such cases, humans should be assisted by automated systems so that the two parties reach a joint decision, stemming out of their interaction. In this work we conduct an empirical study to identify how uncertainty estimates and model explanations affect users’ reliance, understanding, and trust towards a model, looking for potential benefits of bringing the two together. Moreover, we seek to assess how users’ behaviour is affected by their own self-confidence in their abilities to perform a certain task, while we also discuss how the latter may distort the outcome of an analysis based on agreement and switching percentages.
1 Introduction
AI and ML models have already become an indispensable component in many applications, ranging from medical diagnosis to criminal justice. However, full automation is not always desirable, especially in high-stakes applications, for example due to ethical (Naik et al., 2022) or fairness (Mehrabi et al., 2021) concerns. Instead, in such cases, humans should be assisted by automated systems so that the two parties reach a joint decision, stemming out of their interaction. The advantage of this approach is that while it makes use of sophisticated AI systems, humans retain full agency over the final decision, limiting the adverse effect of potential poor model predictions. One of the primary objectives of this human-AI collaboration is to achieve high performance, a goal that requires human users to be able to decide when to follow the model’s predictions, which is a multi-faceted objective, influenced by complex interactions between multiple factors (Lee and See, 2004; Hoff and Bashir, 2015; Adams et al., 2003).
Identifying such factors as well as the way they influence user behaviour and attitude towards a model has been an active research area for decades within the human factors and the AI communities, resulting in several behavioural theories describing the dynamics of the human-AI interaction (Lee and Moray, 1992; Linegang et al., 2006; Madsen and Gregor, 2000). A consistent point of convergence among these theories is that both model-related factors, such as the extent to which a model is perceived to be reliable and understandable, and user-related factors, such as their self-confidence in their abilities to carry out a task, play a crucial role in the formation of the human-AI relationship.
As far as model-related factors are concerned, the emergence of explainable AI has sparked a surge of empirical studies that explore the effect of different explanation styles on model understanding, or the capacity of explanations to allow users detect unfair model behaviour (Lai and Tan, 2019; Wang and Yin, 2021; Dodge et al., 2019; Lai et al., 2020). Moreover, with respect to reliability, recent studies have contrasted the influence of model predictions, uncertainty estimates, and explanations on users’ perceived model reliability, comparing their relative effectiveness on instilling trust and/or inducing a complementary performance benefit, where the joint human-AI accuracy is superior to the individual accuracy of either party (Zhang et al., 2020; Bansal et al., 2021b; Green and Chen, 2019; Lundberg et al., 2018). While this is an ongoing endeavour, there has been substantial evidence suggesting that uncertainty estimates are at least as effective as explanations in achieving these goals. Moreover, uncertainty estimates are arguably simpler to implement and communicate to diverse audiences, raising questions about the overall utility of explanations.
Having said that, surveys that consider both uncertainty estimates and explanations, usually view them as competing sources of reliability-related information. While this approach has the merit of providing a common ground upon which it is possible to compare the two, it reduces explanations to reliability indicators, even though their primarily function is to enhance understanding (Hoffman et al., 2018). In addition, while prior research suggests that information regarding reliability and understanding have complementary functions (Zuboff, 1988; Sheridan, 1989; Lee and Moray, 1992; Madsen and Gregor, 2000; Kelly, 2003), the aforementioned approach fails to capture this aspect and provide relevant insights. For example, uncertainty estimates may help users decide the extent to which to rely on a model, but they provide no justifications in cases where a model makes incorrect predictions, hindering model acceptance (Ashoori and Weisz, 2019). On the other hand, while explanations mitigate this issue, inferring a model’s prediction and uncertainty based on explanations alone, requires substantial technical expertise, while also inducing a very high cognitive load, making it an inefficient strategy for practical applications (Kaur et al., 2020).
In addition to the above, users’ self-confidence in their abilities to complete a certain task is another factor that influences multiple aspects of the human-AI relationship (Lee and Moray, 1992; Lewandowsky et al., 2000; De Vries et al., 2003; Lee and See, 2004). A number of empirical surveys have studied this effect in tasks where humans function as operators, deciding whether to perform a task manually or allocate it to a model, providing evidence that humans’ self-confidence has a significant influence on trust and reliance. Despite such findings, in the context of joint decision-making, where humans are always in charge of taking a decision, and the model takes on an advisory role, self-confidence has received very little attention. This leaves a significant gap in empirical investigations, especially considering that many surveys in the domain explore questions concerning trust in automation.
Moreover, another point that warrants further consideration is the way trust is operationalized in recent surveys. In particular, trust is almost exclusively assessed through the lens of agreement and switching percentages (Zhang et al., 2020), as opposed to using specialized trust measuring scales, such as those developed in (Madsen and Gregor, 2000; Jian et al., 2000; Adams et al., 2003; Cahour and Forzy, 2009). Nevertheless, it is well established that both of these percentages measure reliance, not trust, and that they may fail to account for confounding variables, such as time constraints, inherent application risks, or users’ own self-confidence (Miller et al., 2016; Chancey et al., 2013). This is because although trust has been identified to mediate reliance on automation, trust is a broader attitude towards automation, while reliance is a behaviour that may potentially constitute a manifestation of trust (Ajzen, 1980; Lee and See, 2004). For example, it is possible for one to rely on a model without really trusting it, simply because one lacks the background to take an informed decision. On the other hand, it is also possible for users to base their decisions solely on their own knowledge, so any agreement with the model is only coincidental, not a manifestation of reliance or trust.
In this work we attempt to address these issues by conducting an empirical study to identify the effect of self-confidence and various types of model assistance on human-AI collaboration. In particular, we seek to identify how the joint accuracy of the ensemble is affected by users’ confidence, as well as whether there are differences in user behaviour depending on the provided level of model assistance. Moreover, we seek to uncover potential non accuracy-related benefits of bringing together uncertainty estimates and explanations, looking for differences in terms of reliance, understanding, and trust towards the model. With this we aim to provide evidence that although uncertainty estimates may be as effective as explanations with respect to performance, the latter influence other key aspects, so pairing the two together induces a complementary effect by leveraging the simplicity of uncertainty estimates and the unique insights offered by explanations. More specifically we present the following contributions:
-
•
We design and implement an online empirical study with human participants.
-
•
We identify a complementary effect between uncertainty estimates and explanations, with the former being sufficient for improving performance, and the latter leading to significant improvements in both subjective and objective model understanding.
-
•
We provide evidence that human self-confidence significantly influences the joint human-AI accuracy, while we also illustrate the pitfalls of not properly adjusting for this effect.
-
•
We showcase how different uncertainty measures influence user behaviour.
-
•
We show that both human and model confidence affect reliance, understanding, and trust.
-
•
We demonstrate the limitations of using switching and agreement percentages as a proxy for trust.
2 Related work
The importance of establishing a transparent relationship between human users and automation on fostering an effective collaboration between the two parties has been consistently identified in prior literature. In (Bhatt et al., 2021) the authors called for utilizing diverse estimates that convey multiple aspects of the underlying model uncertainty to promote transparency and help users comprehend the degree to which a model’s predictions should be followed. Moreover, the findings in (Ashoori and Weisz, 2019) suggested that in high-stakes applications uncertainty estimates might not be enough, since the absence of explanations may lead to users entirely dismissing a model, regardless of its accuracy.
Motivated by such discussions, a growing body of recent empirical investigations focus on the relative effect of uncertainty and explanations on joint accuracy and trust. For example, the findings in (Zhang et al., 2020), suggested that simply providing participants with information about model confidence, i.e. the probability a model assigns to its predictions, is more effective than explanations in improving trust and joint accuracy, as well as that explanations were not successful in allowing participants disentangle between high and low confidence predictions. Moreover, the results in (Lai and Tan, 2019) demonstrated that the best joint accuracy was achieved when presenting information containing the model’s prediction paired with the corresponding model confidence, in line with (Zhang et al., 2020). Pairing local feature importance explanations and model predictions was slightly less effective, while presenting explanations alone, led only to a minor improvement compared to the baseline.
Another related study is presented in (Bansal et al., 2021b), which explores whether combining model confidence and explanations can further improve the accuracy of the human-AI team. The resulting analysis showed that when both parties had comparable individual accuracy, then presenting participants with the model’s prediction and confidence led to the ensemble achieving superior joint accuracy. The authors found no further improvement when pairing this information with explanations, concluding that the former strategy is as effective as the latter, while also being substantially simpler.
Moreover, in both (Bansal et al., 2021b; Zhang et al., 2020) it has been acknowledged that a user’s self-confidence should have an effect on the joint human-AI accuracy in the context of decision-making tasks. Despite this being an intuitive remark, to the best of our knowledge, this idea has not been empirically verified. This is in contrast to alternative settings, such as when humans function as operators being in charge of deciding whether to perform a task manually or delegate it to a model, where the role of self-confidence has received considerable attention. In (Lee and Moray, 1994), the authors provided evidence that participants turned into automation only when their trust in its capabilities exceeded their own, otherwise they tended to performed a task manually. These findings are extended in (De Vries et al., 2003), where the results indicated that there exists a fundamental bias towards people trusting their own abilities, instead of the model. Moreover, in (Lewandowsky et al., 2000), it is shown that participants’ self-confidence determined whether they retained control or not, strengthening the previous findings.
Apart from exploring the effect of explanations on accuracy in decision-making tasks, other surveys focus on alternative questions, such as the one in (Dodge et al., 2019), which explored the efficacy of explanations in helping human users detect unfair model behaviour. Interestingly, the results revealed that local explanations were the most effective in exposing fairness discrepancies among individuals, while global ones instilled more confidence in the users that their understanding was correct. In addition, the study in (Wang and Yin, 2021), brought a new perspective by exploring the comparative effect of explanation styles on model understanding, across datasets of varying difficulty. The final results uncovered that the difficulty of the application significantly influenced the effect of explanations on model understanding, while also indicating that local explanations improved participants’ objective understanding, and that global explanations improved their self-reported subjective understanding.
Finally, a methodological approach shared by many recent studies on trust in the human-AI collaboration, is that trust is measured using agreement and switching percentages. The former is the fraction of times that the user and the model agreed on their final predictions, while the latter is the percentage of times users switched their predictions to follow the model, assuming the two parties initially disagreed. This approach is in contrast with the predominant practice in the human factors and human-computer interaction communities, where trust is assessed based on either specialized trust measuring scales such as (Madsen and Gregor, 2000; Jian et al., 2000; Adams et al., 2003; Cahour and Forzy, 2009), sophisticated implicit behavioural measures (De Vries et al., 2003; Miller et al., 2016), or combinations thereof. Furthermore, focusing exclusively on the aforementioned percentages to measure trust poses a major methodological shift, since both of them are indicators of reliance (Miller et al., 2016; Lee and See, 2004), so this paradigm presupposes that trust can be indirectly inferred through reliance.
3 Study Overview
In this study we design a salary prediction task, and we seek to answer questions along two principal axes. On the one hand, we follow the discussions in (Bansal et al., 2021b) and we seek to obtain deeper insights regarding the role of the interaction of human and model confidence in influencing joint accuracy. As the authors note, this interaction should play an important part in regulating joint accuracy, however, there is no concrete evidence supporting this view. In this work we fill this gap, while further expanding on this idea, exploring not only how the joint accuracy is affected, but also how reliance, understanding, and trust are shaped as a result of this interaction. On the other hand, we seek to find evidence of added benefits of pairing uncertainty estimates with explanations. Recent surveys have consistently demonstrated that in terms of accuracy the former is at least as effective as the latter, suggesting that uncertainty alone is enough to promote an effective human-AI collaboration. However, it is still unclear whether combining uncertainty and explanations can yield alternative, non accuracy related benefits. In this work we look for differences with respect to model understanding, which is an important factor, linked to aspects such as model acceptance and long-term adoption (Adams et al., 2003). Similarly, motivated by the discussions in (Bhatt et al., 2021), we explore the effect of combining uncertainty measures of different scope on users’ behaviour. In particular, we ask the following research questions:
-
RQ1
How is joint predictive performance influenced by the interaction of human confidence, model confidence, and the degree of model assistance?
-
RQ2
How are reliance, understanding, and trust towards the model affected by the same factors?
-
RQ3
Does the combination of explanations and uncertainty measures offer non accuracy-related, complementary benefits?
-
RQ4
How uncertainty estimates of varying scope influence user behaviour?
Studying these questions, we aim to assess the role of self-confidence in decision-making tasks, as well as how different combinations of information elicit differences in user behaviour. Moreover, we demonstrate the pitfalls of using switching and agreement percentages as a proxy for studying trust. In sum, our goal is to uncover concrete advantages of employing combinations of diverse information sources, promoting research that further expands on this topic. This is especially important considering that in naturalistic settings, stakeholders expect combinations of multiple sources of information. More specifically, we aim to test the following hypotheses:
-
H1
Superior joint accuracy will be observed when humans have low self-confidence, and the model makes high confidence predictions. Moreover, pairing model prediction and confidence will be sufficient to induce this effect.
-
H2
Participants provided with explanations will have better model understanding.
-
H3
Reliance, understanding and trust towards the model will be affected by both human confidence and model confidence, as follows:
-
H3.1
Reliance will be affected primarily by human confidence, and to a lesser extent by model confidence. Furthermore, we expect to find an increase in reliance when humans have low confidence and the model makes high confidence predictions .
-
H3.2
Understanding will be similarly affected by both human and model confidence . In addition, we expect an increase in understanding when both parties have high confidence.
-
H3.3
Trust will be affected primarily by human confidence, and to a lesser extent by model confidence. We also expect an increase in trust when both parties have high confidence.
-
H3.1
-
H4
The difference between uncertainty measures of distinct scopes (global vs local) will induce differences in user behaviour.
3.1 Experimental Design
3.1.1 Participants
We recruited participants from Amazon Mechanical Turk for our experiment. participants were women, and were men. participants were between age and , between age and , between and , and were over years old. Furthermore, our task was available only to USA residents, due to the fact that the selected dataset contained information that was relevant to the USA social context.
3.1.2 Dataset
We designed a modified version of the task presented in (Zhang et al., 2020), where participants had to predict whether a person’s annual salary was greater than dollars. However, since this task was based on the Adult dataset, which contains data from the Census111Link: https://archive.ics.uci.edu/ml/datasets/adult, we needed to adjust the salary threshold to account for inflation. Considering that in this time span the US dollar has seen a cumulative price increase of , the adjusted value became , which was rounded to dollars. The dataset contains instances, and each one is comprised of features. Following the authors in (Zhang et al., 2020), we opted for using only the most relevant ones, so participants were not overloaded with information. These features corresponded to a person’s: age, employer, education, marital status, occupation, ethnic background, gender, as well as the hours-per-week spent working. We trained a gradient boosting decision tree model on of this dataset, leaving the remaining to test its final performance, which turnout out to be .
3.1.3 Task Instances
The reason we selected the Adult dataset, was that it contains instances of varying difficulty, where some of them are relatively easy to predict for lay users with no prior related experience, while others can be significantly harder. This allows for actively manipulating participants’ self-confidence to study its effect on various aspects of the human-AI collaboration. In contrast, the authors in (Wang and Yin, 2021), utilized datasets that were either relatively easy or very hard for lay users. A limitation of this approach is that when participants perform a task for which they have no related knowledge or intuition, they are in a state of absolute ignorance promoting a blind reliance on the model, which is first very different from being uncertain and second very far from real-life situations. Indeed, it is highly improbable that a model will be employed by stakeholders having no knowledge/intuition regarding the application at hand. Instead, our prediction task is quite intuitive and mostly requires common sense knowledge, while also allowing for different degrees of confidence in one’s predictions.
In order to select the actual task instances, we first set the threshold for low confidence model predictions at , meaning that any prediction with probability not exceeding that number, was considered to be a low confidence model prediction. The corresponding threshold for high confidence predictions was set at . We intentionally opted for a relatively large gap between the two thresholds in order to avoid the interval in-between where it is ambiguous whether a prediction should be seen as having low or high confidence. We then went through the resulting filtered dataset looking for instances of varying complexity, from a human’s perspective. After completing this step, we needed to make sure that humans and model have comparable individual performances, to match the setting in (Bansal et al., 2021b). Following the suggestion in (Zhang et al., 2020), we used a stratified sampling approach, constraining the model accuracy to be , since the unconstrained accuracy () was very high for lay people. By the end of this procedure, we identified instances, equally divided into the configurations of human/model confidence: (Human - High & Model - High), (Human - High & Model - Low), (Human - Low & Model - High), (Human - Low & Model - Low). In order to verify that these instances were indeed effective both in inducing different states of human confidence and in allowing for comparable human-model performance, we recruited participants from Amazon Mechanical Turk, asking them to provide a confidence score and prediction for each of these datapoints. Finally, we confirmed that our categorization was effective at inducing a different level of self-confidence to lay users (, ), as well as that the selected instances allowed for a comparable accuracy between participants and model (Average human accuracy , confidence interval )222For the former we used Wilcoxon’s signed-rank test, while the latter was estimated using the bootstrap method..
3.1.4 Design
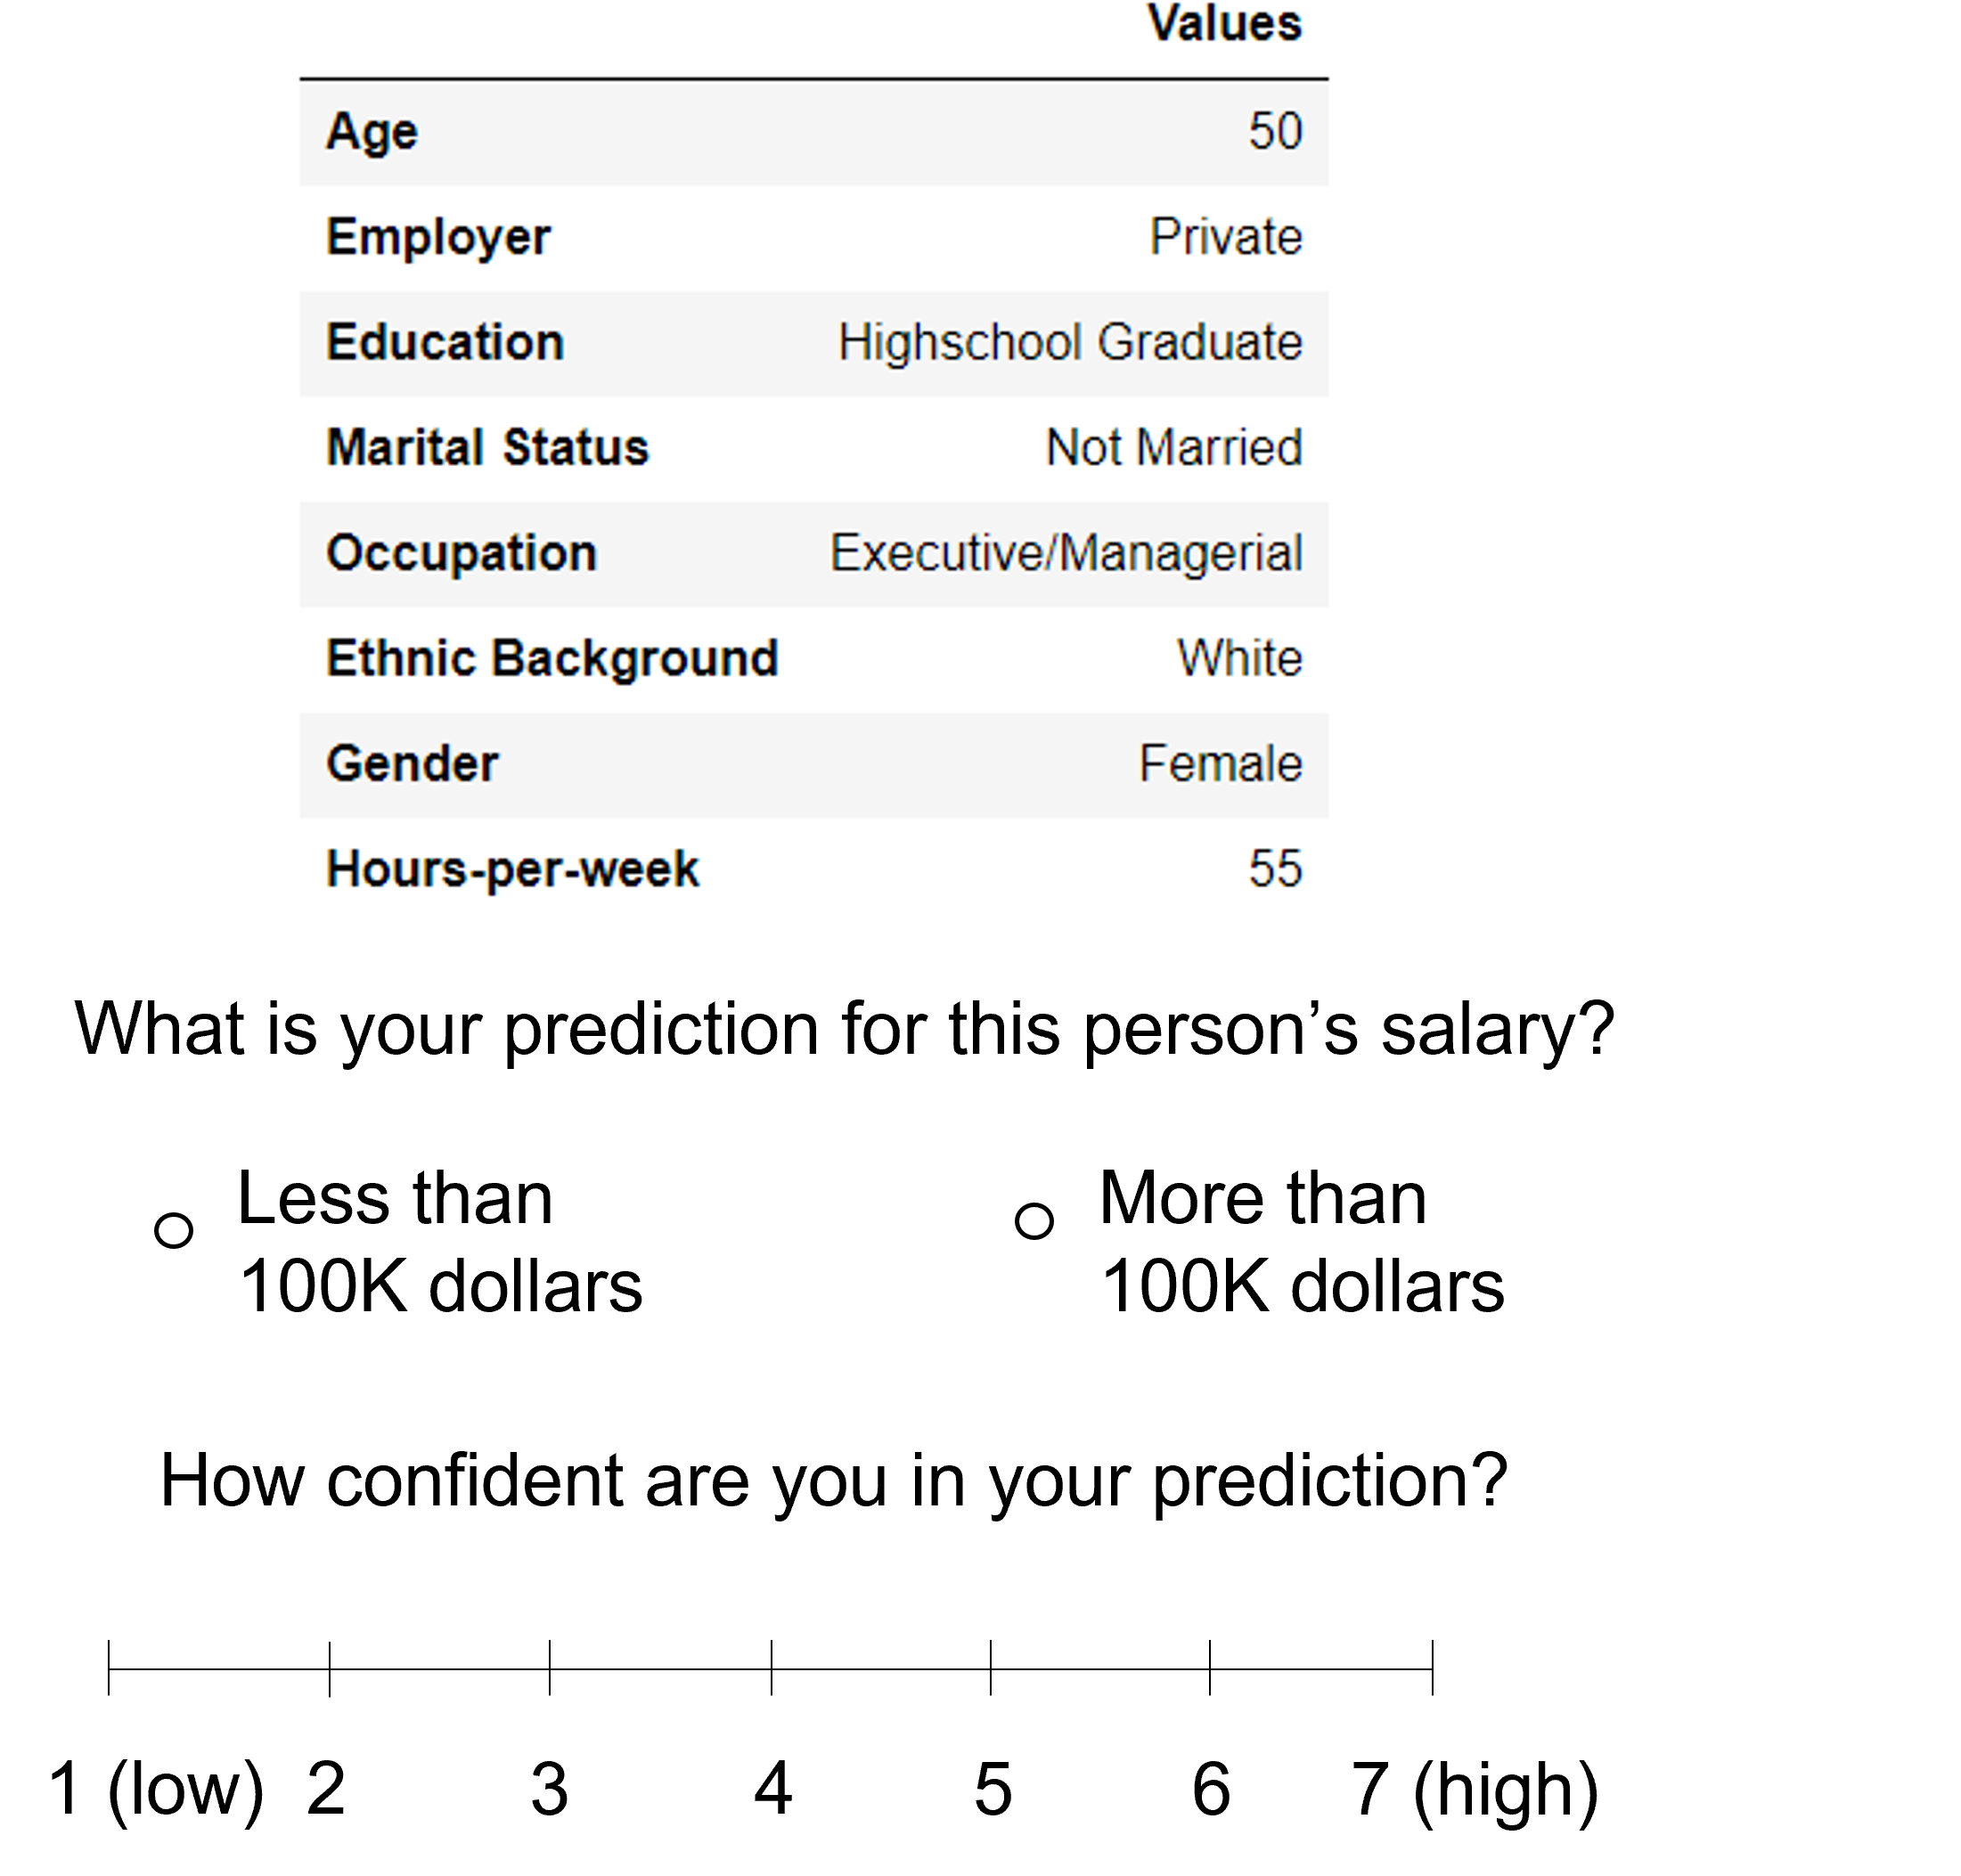
In order to address our research questions, we designed a prediction task where in each trial participants needed to go through a three-step process. First, they had to inspect an instance, and provide an initial prediction about that person’s salary, as well as an estimate of their confidence. Following that they were provided with varying levels of model assistance, depending on the condition (see below), and then they were asked to give their final prediction, where they were free to either maintain or change their initial one. Figure 1 shows an example of this procedure. Finally, participants needed to provide an estimate of how much they relied on the model for that prediction, how much they felt they understood its decision-making process, as well as to which extent they trusted the model’s prediction. These three steps were repeated in each trial, and after completing the task participants were given a test comprised of multiple choice questions, adapted from (Wang and Yin, 2021), to assess their objective understanding of the model.
In more detail, there were experimental conditions, each one providing an increasing level of model support:
-
•
Prediction: In this condition, after participants submitted their initial prediction and confidence score, they are shown only the model’s prediction for the same instance. After inspecting it, they are asked to submit their final answer. This serves as the baseline condition, providing only minimal model assistance.
-
•
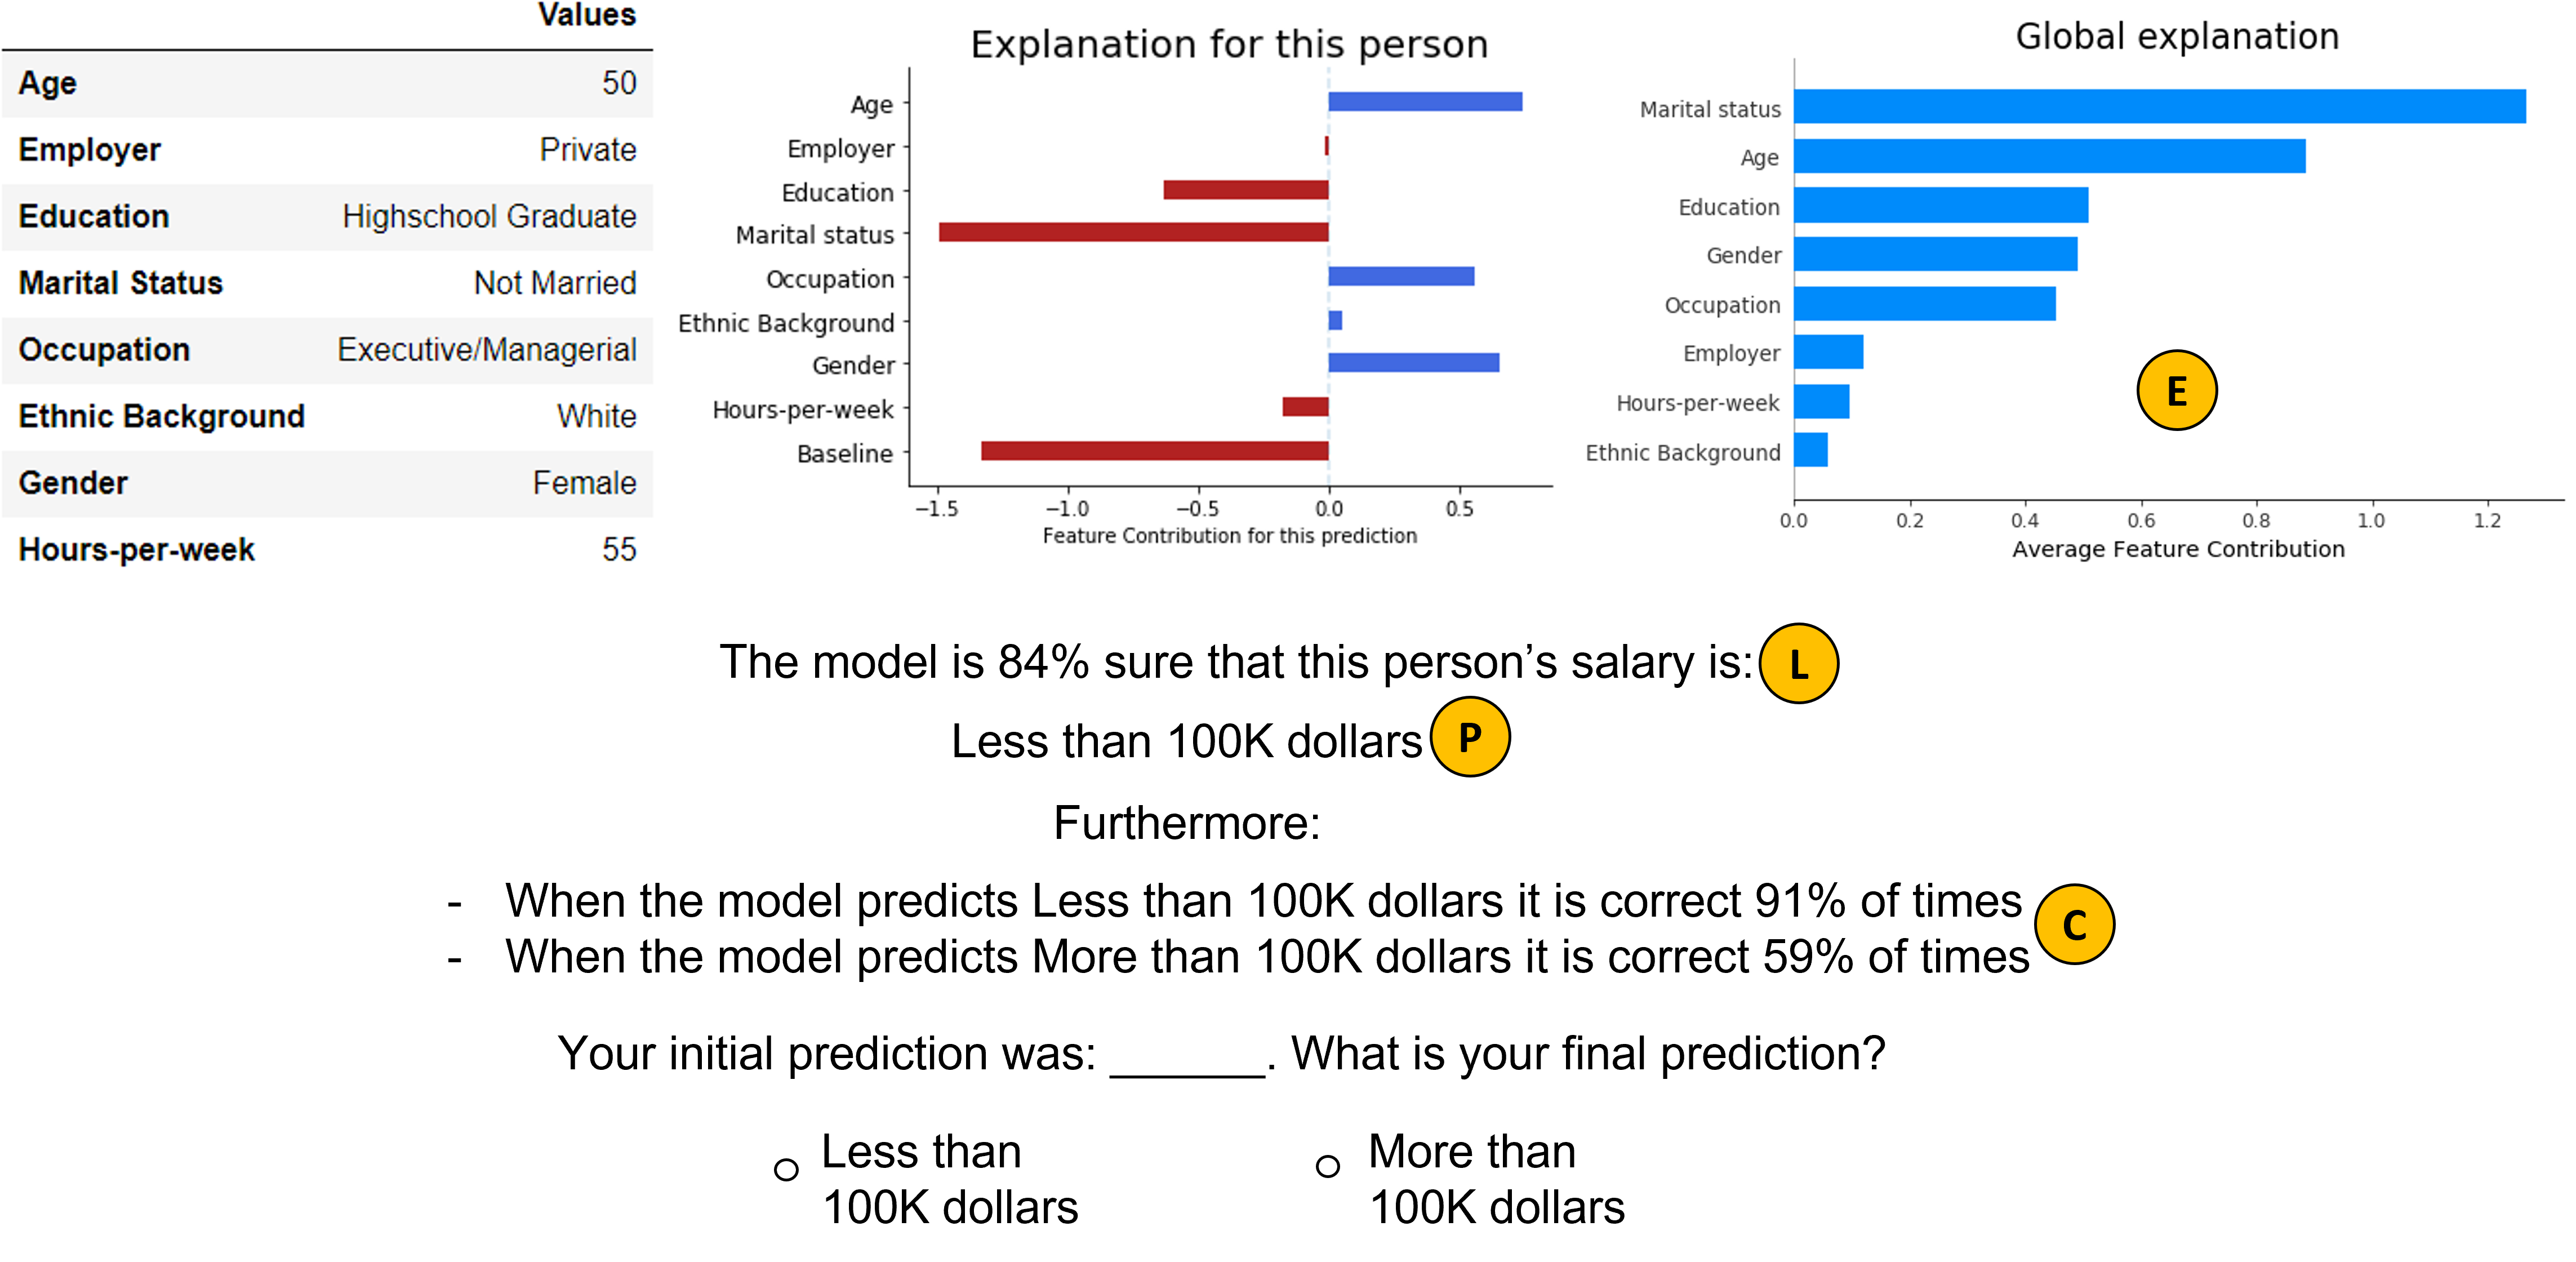
Local Confidence: In this condition, participants were shown both the model’s prediction and the corresponding model confidence, i.e the probability that the model assigned to each prediction.
-
•
Combined Confidence: In this condition, participants were shown all the information that was available in the previous one, plus the recall for each class, , i.e. the fraction of times an instance is correctly identified by the model as being a member of the class. Here, recall acts as a global meta uncertainty estimate, providing information about the robustness of a model’s own confidence. Combining these uncertainty measures should help participants gain a more refined picture of the model’s performance, since knowing that a model is, say, confident in its prediction, but predictions for this class are correct only of the time, is more informative than just knowing the model’s confidence.
-
•
Explanations: In this condition, participants were shown all of the previous information, as well as a local and a global explanation. Based on the findings in (Wang and Yin, 2021), we employed feature importance explanations for both, due to their effectiveness in promoting a better model understanding. Local explanations showed how much each feature influenced the model to reach a particular prediction, while global ones displayed the average overall impact of each feature. All explanations were generated based on SHAP.
Participants were randomly assigned to one of the four conditions. Within subjects we manipulated model confidence and human confidence, such that participants in each condition were presented with an equal number of trials with each confidence combination. More precisely, each participant was presented with instances of each of the following certainty combinations: (Human - High & Model - High), (Human - High & Model - Low), (Human - Low & Model - High), (Human - Low & Model - Low). Participants were also asked to provide their confidence in each of their predictions, which was used to confirm that our manipulation was successful in inducing varying degrees of confidence in this sample too (, ).
In addition, we matched the number of instances with people earning less/more than K dollars within each certainty combination, such that two out of the four instances of each combination showed people gaining more than K dollars. Order of presentation of instances was random. Our dependent variables are accuracy, reliance, subjective understanding of the model, trust and objective understanding of the model.
3.1.5 Procedure
Upon accepting to take part in the experiment, participants were presented with the task instructions, which matched the demands of each condition. In the Explanations condition, after participants read the instructions, they went through an introduction on explanations and the interpretation of the local and global explanation plots. Then, they were presented with three multiple-choice questions testing whether they conceptually understood the distinction between local and global explanations and whether they were able to correctly interpret the explanation plots. Participants in this condition needed to answer or questions correctly to be included in the sample.
Once the introduction was completed, participants in all conditions went through a familiarization phase, consisting of trials. In each trial, participants first inspected a person’s profile for whom the age, employer, education, marital status, occupation, ethnic background, gender and hours per week spent working were provided. Participants had to predict whether this person gains more or less than K dollars per year and to give their confidence in their prediction by clicking on a Likert scale ranging from (low) to (high). In the next slide, participants were provided with the model’s assistance, which contained different kinds of information depending on the condition (see Section 3.1.4) and they were asked to give their final prediction, which could be the same or different from their initial one. Once both of these steps were performed, participants were shown the real life outcome for the person under consideration. The aim of our familiarization phase was two-fold. First, participants could understand better their task and develop some familiarity with the model’s assistance (especially in the case of the Explanations condition, which contained a greater amount and a more diverse set of information) but more importantly, participants had the opportunity to gain some insight about the model’s performance. In particular, given that participants were provided with the real-life outcomes, they were exposed to instances where the model erred, from which they could infer that following the model blindly would not be a fruitful strategy.
After the end of the familiarization phase, participants were informed that they were about to start with the main phase of the experiment, which consisted of trials. In each of them, the two first steps were identical to the first two steps of the familiarization phase, that is participants inspected an instance, they provided their prediction and their confidence in their prediction and in the next slide they were provided with the model’s assistance and they were required to provide their final prediction for this instance. In the test phase, however, after submitting their final prediction, instead of inspecting the real life outcome, participants were asked to answer on a scale from to to which extent they agreed with the following statements, which we borrowed from the scales in (Cahour and Forzy, 2009; Adams et al., 2003):
-
•
I relied on the model to reach my final prediction.
-
•
I understand the model’s decision making process.
-
•
I trust the model’s prediction for this person.
Finally, after going through all trials, participants were presented with an exit survey of multiple choice questions which assessed their objective understanding of the model, adapted from (Wang and Yin, 2021).333All the question can be found in Appendix B. The aim of these questions was to address H2, since they allowed for comparing model understanding across conditions. This made possible to identify whether explanations offer any significant added benefits, compared to providing users with uncertainty estimates alone. The questions cover a wide spectrum of objectives related to understanding:
-
•
Global feature importance: Participants were asked to select the most/least influential features the model utilizes to reach its predictions. ( questions)
-
•
Local feature importance: Participants were given a person’s profile, and they were asked to select the most influential feature for this particular case. ( question)
-
•
Counterfactual thinking: Participants were presented with a person’s profile, as well as a list of changes in the values of the features, and they were asked to select which of these changes would be sufficient to alter the model’s prediction. ( questions)
-
•
Model simulation: Participants were given a profile, and they were asked to answer what they believed the model’s prediction for this person would be. ( questions)
-
•
Error detection: Participants were shown a profile, as well as the model’s prediction, and they were asked whether they find this prediction to be correct or not. ( questions)
To make sure that participants were attentive, we included two attention checks in the experiment, where they were given instructions about which answer they should submit. Those who failed to pass the checks, were excluded from the analysis. The base payment was for participants in the Explanations condition, and for the rest of them, since the former required participants to go through an introduction on feature importance explanations. Moreover, to further motivate participants, we included two performance based bonuses; those who provided a correct final prediction on more than of the main trials were given an extra , and those who answered correctly more than of the questions in the exit survey received a bonus of .
4 Results
In this section we present an analysis of our obtained data. All confidence intervals (CIs) were calculated using the non-parametric bootstrap estimation method (Efron and Tibshirani, 1986). Pairwise comparisons between conditions were performed using the Mann-Whitney U Test (McKnight and Najab, 2010), while all other comparisons were conducted using Wilcoxon’s signed-rank test (Woolson, 2007). Details about all CIs and comparisons can be found in Appendix A.
4.1 Performance
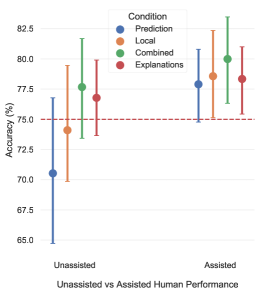
The first set of analyses examined the effect of human confidence, model confidence, and model assistance (condition) on human performance. To address this question, we began with comparing the individual accuracy of the two parties, so that we can then assess whether the ensemble achieved superior performance. To this end, we compared participants’ accuracy before exposure to any model assistance (Unassisted Performance) to the model’s accuracy. Figure 2a, depicts participants’ unassisted performance per condition, along with a confidence interval. Details about all CIs are presented in Appendix A. Figure 2a shows that belongs to all CIs, so participants and model showed comparable performance in all conditions, thus recreating the setting in (Bansal et al., 2021b).
Then, we compared participants’ performance after exposure to the model’s assistance (Assisted Performance) to the model’s accuracy. Figure 2a, shows the assisted performance, along with the corresponding CIs. Participants’ assisted performance was significantly better than in all but the Prediction condition, suggesting that even the simple strategy of pairing model predictions with confidence, as in the Local condition, is beneficial to participants’ performance, in line with the findings in (Bansal et al., 2021b). On the other hand, participants in the Prediction condition failed to surpass the model’s performance, suggesting that predictions alone are not as effective in improving the joint performance, supporting the findings in (Lai and Tan, 2019).
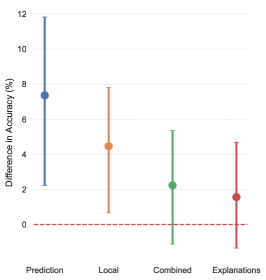
Having established that the model’s assistance helped the ensemble surpass the individual model accuracy, we continue by examining whether it surpassed participant’s individual accuracy as well. Figure 2b, shows the CIs of the difference between participants’ assisted and unassisted performance, per condition. Participants’ assisted performance was significantly better than their unassisted performance in the Prediction and Local conditions. On the contrary, the same comparison did not yield statistically significant results in the Combined and Explanations conditions, even though the point estimates were positive. This pattern can be explained, at least in part, by the fact that participants in the Combined and Explanations conditions already had better performance in their unassisted predictions compared to participants in the Prediction and Local conditions, leaving less room for improvement for them. Interestingly, when the point estimate of participants’ unassisted accuracy was lower than the model’s accuracy (conditions Prediction and Local), the ensemble surpassed the accuracy of both parties, however, when the point estimate was higher than (conditions Combined and Explanations), it failed to significantly outperform participants’ individual accuracy. In (Bansal et al., 2021b), participants’ accuracy was always lower than the model’s, so this might explain why the ensemble achieved superior accuracy in all tasks in their study.
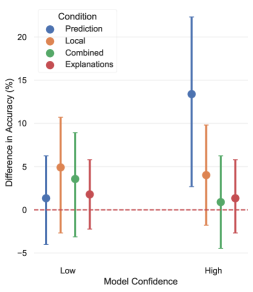
Expanding on the above findings, we then isolated the effect of the different levels of model confidence (Low/High) on participants’ accuracy (see Figure 2c). The resulting analysis showed that, with the exception of the Prediction condition, model confidence did not appear to modulate participants’ performance. Note that the Prediction condition was the only one where participants had in fact no information about whether the model had low or high confidence, and taking into account the width of the corresponding CI, which suggests that there was substantial variation in participants’ accuracy, this result might be due to noise in the data.
A careful inspection of the pattern of the results discussed so far leads to a seemingly paradoxical observation: Focusing on the Local condition, we found that the model’s assistance significantly improved participants’ performance, yet when we broke down this effect for the different levels of model confidence, neither high nor low confidence model predictions significantly improved participants’ performance. This leads to the puzzling conclusion that when considering model assistance in general, it helped participants improve their accuracy, but when zooming into each of the levels of assistance it provides (low and high confidence predictions) separately, this effect vanishes. This phenomenon is known as the Simpson’s paradox, and it has been extensively studied in statistics, causal inference and philosophy (Wagner, 1982; Julious and Mullee, 1994; Hernán et al., 2011). In statistical terms, this indicates that there are important confounding variables and/or causal relationships, that have not been accounted for into the analysis. The emergence of this phenomenon in our analysis perfectly captured the potential perils of not taking into account human confidence, since as soon as we adjusted for this factor, the paradox resolved itself.
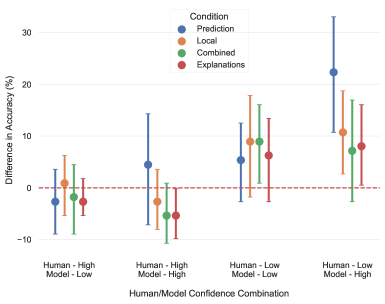
Figure 3 breaks down the difference between assisted and unassisted accuracy, as a function of condition, human confidence, and model confidence. Participants’ accuracy showed a significant improvement when they were themselves uncertain, but the model showed high confidence in its predictions, in all but the Combined condition (see Appendix A), suggesting that the significant effect observed in the Local condition (discussed in the previous paragraph) was due to this interaction, which is why looking at model confidence alone resulted into seemingly paradoxical conclusions. Furthermore, for the Combined condition, we found a significant improvement when both model and human confidence were low. These findings demonstrated that although we found no significant overall improvement for participants in the Combined and Explanations conditions, interpreting our results through the interaction of human and model confidence allowed us to detect fine grained effects that would have been otherwise missed.
On the other hand, when participants were confident about their predictions, but the model was not, there was virtually no difference in accuracy, indicating that participants’ predictions were primarily driven by their own intuitions or knowledge of the world. Finally, when both parties were confident in their predictions, participants’ performance slightly declined, but this effect only reached significance in the Explanations condition. A possible interpretation of this pattern is that explanations and high model confidence prompted participants to exhibit a slightly over-reliance on the model, which is consistent with the findings in (Kaur et al., 2020). The fact that the reverse trend was observed in the Prediction condition strengthens this interpretation, suggesting that in the absence of uncertainty estimates, participants’ own confidence dominated, thus no over-reliance was observed. These findings provide strong evidence in favour of H1, suggesting that the interaction between human and model confidence is an important factor influencing when and how much a model’s predictions will be followed, above and beyond model confidence.
4.2 Reliance, Understanding, and Trust
This set of analyses examines the effect of human confidence, model confidence and condition on participants reliance, understanding, and trust. Following the discussion in (Wobbrock and Kay, 2016), we opted for analyzing our data using a semi-parametric ANOVA approach, which is robust against violations of the underlying parametric ANOVA assumptions, such as normality, in line with numerous recent studies (Roo and Hachet, 2017; Gugenheimer et al., 2017; Hartmann et al., 2019; Thoravi Kumaravel et al., 2020; Kudo et al., 2021) that utilize non- or semi-parametric methods. In particular, we based our analysis on the Wald-type statistic proposed in (Konietschke et al., 2015).
4.2.1 Reliance
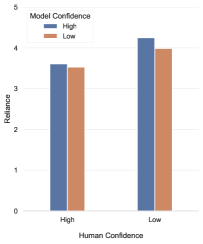
Starting with reliance, a three-way repeated measures ANOVA with Human ConfidenceModel ConfidenceCondition identified a main effect of Human Confidence (, ), a main effect of Model Confidence (), as well as an interaction between Condition and Model Confidence (). Participants’ reliance dropped by when they themselves were confident, compared to when they were uncertain. Moreover, participants’ reliance increased by when the model made high confidence predictions. Contrasting these two effect sizes, we see that the former is more than times bigger than the latter, providing evidence that it is primarily human confidence that influences model reliance, in line with H3.1. However, overall this hypothesis was only partially confirmed, since we did not detect a significant interaction between human and model confidence (). That being said, we suspect this was due to sample size limitations, since the combination of confidences (Human - Low & Model - High) showed the greatest reliance, suggesting that a bigger sample size would lead to statistically significant results (see Figure 4a).
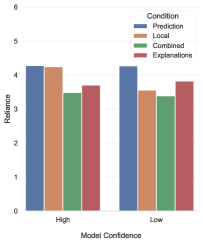
With respect to the interaction between Condition and Model Confidence, pairwise comparisons revealed that this effect was due to the Local condition (). Moreover, as Figure 4b shows the remaining conditions exhibited virtually no variation in reliance for the different levels of model confidence. In the Local condition, participants’ reliance was higher when the model was confident, compared to when it was not. A possible interpretation of this finding is that while local confidence communicates model uncertainty, it does not provide any meta-information quantifying the robustness of this information, thus it did not allow participants to adjust their reliance. This is because they were only aware of the model’s uncertainty, but they did not have any information about either the model’s global error rates (as in the Combined condition) or about the reasons behind the prediction (as in the Explanations condition). This is a very interesting finding that demonstrates that although extra information might not necessarily lead to better predictive accuracy, it can play a major part in adjusting human behaviour.
4.2.2 Understanding
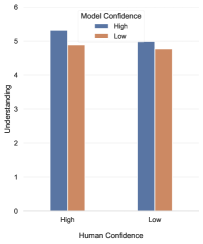
Moving on we turn our attention to participants understanding, and how it was impacted by the various factors in our study. A three-way repeated measures ANOVA with Human ConfidenceModel ConfidenceCondition identified a main effect of Human Confidence (), a main effect of Model Confidence (), a main effect of Condition (), as well as an interaction between Human Confidence and Model Confidence (). Participants’ subjective understanding improved by , when they had high confidence, suggesting that they took into account their own knowledge when interpreting the model’s predictions. Moreover, participants’ understanding improved by when the model was confident, compared to when it was not, providing evidence that high confidence model predictions made participants feel more certain that their understanding was correct. With respect to the interaction of human and model confidence, pairwise comparisons revealed that when both human and model confidence were high, understanding was significantly higher than all the remaining combinations. In more detail, compared to the combinations (Human - High & Model - Low), (Human - Low & Model - High), (Human - Low & Model - Low), understanding was (), (), and (), higher, respectively. This provided evidence that the interaction of human and model confidence influences model understanding, which fully supported H3.2. No other comparison yielded significant differences (see Figure 5a and Appendix A)
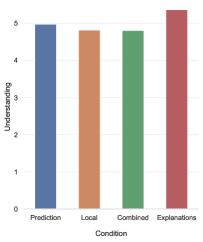
Finally, looking at the main effect of Condition, pairwise comparisons showed that subjective understanding ratings in the Explanations condition differed significantly from the ones in the Local () and Combined () conditions, but not from the ones in the Prediction condition (). Figure 5b shows the average subjective understanding per condition. The fact that there was no difference between the Explanations and Prediction conditions, is consistent with the finding that humans tend to project their reasoning on the model, without actually having a well-versed understanding of the model’s decision making process. In contrast, in the Local and Combined conditions, participants were aware of the model’s uncertainty, so they were more conservative with their understanding scores. The actual discrepancy of model understanding between the Explanations and Prediction conditions will become more apparent in Section 4.3, where we discuss participants’ objective model understanding.
4.2.3 Trust
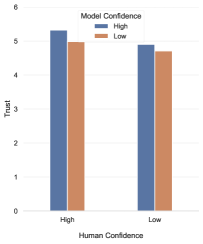
We concluded this part of the analysis studying participants’ trust towards the model’s predictions. A three-way repeated measures ANOVA with Human ConfidenceModel ConfidenceCondition identified a main effect of Human Confidence (), a main effect of Model Confidence (), as well as an interaction between Condition and Model Confidence (). Participants’ trust increased by when they were confident in their predictions. Moreover, participants’ trust increased by when model confidence was high. The difference in size between these two effects suggests that while both influenced participants’ trust, the uncertainty stemming due to their own confidence had a slightly more pronounced effect. Despite the fact that we did not find significant evidence in favour of the effect arising from the interaction between human and model confidence (), we suspect that this was mainly due to sample size limitations, since the pattern shown in Figure 6a, suggested that when both parties were confident, participants’ trust was likely higher. As it was the case when studying reliance, H3.3 was partially supported, calling for further investigations on the effect of the interaction of human and model confidence on trust.
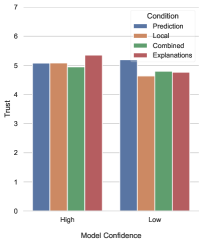
Finally, following up on the interaction between Condition and Model Confidence, pairwise comparisons revealed that in the Local () and Explanations () conditions participants tended to trust high confidence model predictions more than low ones (see Figure 6b). In the Local condition, high confidence model predictions improved trust ratings by . In the Explanations condition, this difference was even more pronounced, and equal to . There is a rather intuitive interpretation of this result, in the sense that when participants were presented with local confidence information, it was reasonable that high confidence predictions imparted higher levels of trust. However, when these scores were complemented with global error rates, participants became aware of the fact that high confidence predictions might not necessarily translate into high accuracy, which is why they did not induce the same level of trust (). Having said that, when all this information was paired with explanations, participants were able to inspect the model’s reasoning for each individual instance, so high confident predictions paired with reasonable explanations bypassed the uncertainty induced due to poor global error rates (as when the model predicts More than K dollars).
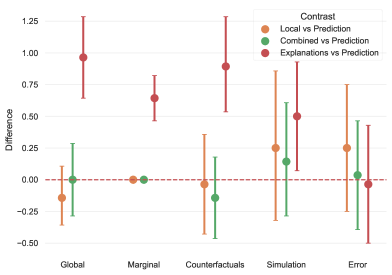
4.3 Objective Understanding
In this section we studied objective model understanding, as captured via the multiple choice questions that participants completed before exiting the experiment. We looked for differences between Prediction and every other condition, to assess whether including uncertainty estimates or explanations led to improved understanding, compared to providing model predictions alone. Recall that these questions addressed different aspects of objective model understanding. Each aspect is analyzed separately in order to gain a more refined picture of participants’ understanding. Figure 7, shows the difference in scores between conditions, broken down by each aspect of understanding. Starting with global feature importance, participants’ scores in the Explanations condition significantly outperformed those in the Prediction one, while there was no difference between the remaining contrasts. This result was not surprising since global feature importance information was available to participants in the Explanations condition. However, the fact that there was no difference among the remaining conditions highlighted that uncertainty estimates were as effective as plain predictions in helping participants infer such information.
With respect to local feature importance the discrepancy was even more severe, since no participant in the Prediction, Local, Combined conditions was able to provide a correct answer. On the other hand, of the participants in the Explanations condition answered this question correctly. Again, we expected participants in the latter to have an edge on this task, however, in contrast to global feature importance which remains constant across instances, local feature importance information depends on the instance at hand, meaning that this effect was not due to mere memorization. Instead, participants needed to critically reflect on the information presented throughout the experiment to reach their decision. This sharp difference clearly demonstrated that when it came to inferring local feature importance the information in the remaining conditions was insufficient.
Participants’ scores in the counterfactual component of the test showed again that only those in the Explanations condition significantly outperformed those in the Prediction condition. This is a very interesting finding, indicating that although explanations contained factual information, participants were able to extract counterfactual knowledge out of them, while uncertainty information did not provide any such benefits. The exact same pattern was observed when considering the aspect of model simulation, despite the fact that explanations themselves did not explicitly contain any information regarding simulating the model’s behaviour. Regardless, the enhanced understanding of the model’s decision making process helped participants in the Explanations condition achieve superior performance in the simulation component of the test.
Finally, participants’ ability to detect erroneous model predictions was assessed, where no significant differences between conditions were found. Error detection closely resembled the main prediction task, since it required inspecting an instance and the corresponding model prediction to assess its correctness. This means participants in all conditions had substantial exposure/familiarity with this procedure, which explains why there was no difference in their performance. Overall, the preceding analysis provided strong evidence suggesting that explanations led to better model understanding, compared to uncertainty estimates, thus fully supporting H2.
4.4 Switching and Agreement
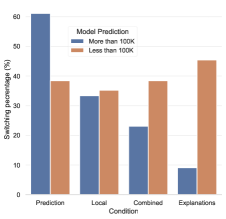
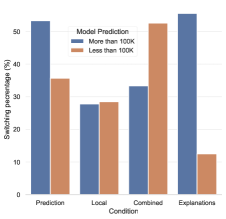
We concluded our analysis by addressing two issues, starting with the effect of pairing uncertainty estimates of different scopes, and then moving to the potential pitfalls of utilizing switching and agreement percentages to measure trust. To this end, we began with a brief qualitative analysis of users’ switching behaviour. Unfortunately, when isolating trials where participants’ initial answer differed from the model’s prediction, the statistical power of our analysis is greatly reduced, so our tests fail to detect significant differences. Despite that, there are some clear patterns present in the data, from which we can gain valuable insights, so we opted for providing a qualitative analysis, instead of dismissing them. Overall, participants’ switching percentage in the Prediction, Local, Combined, Explanations conditions was , , , and , respectively. Furthermore, in all conditions switching helped participants improve their performance, since by altering their initial prediction to follow the model’s suggestion their accuracy increased by , , , and , following the same order as before.
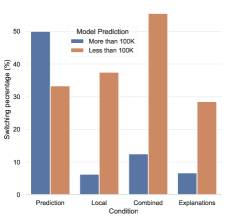
Focusing on the Local and Combined conditions, we looked for differences in switching behaviour that can be explained by the fact that global error rates were available in the latter, but not in the former. Figure 8 depicts the percentage of trials participants switched their prediction, depending on Condition, Human Confidence, and Model Confidence, where we differentiate between cases where the model predicts Less than K and those where it predicts More than K. In the (Human - High & Model - Low) combination participants exhibited a similar behaviour in both conditions, presumably because their behaviour was driven by their own intuitions. However, in every other confidence combination participants’ behaviour in the Local and Combined conditions were strikingly different. One the one hand, in the Local condition, switching percentages between the two classes were almost identical, but on the other hand, in the Combined condition, the switching percentage when the model’s prediction was Less than K was much higher than when the prediction was More than K, consistent with the view that the poor global error rates of the More than K class lessened the chances of participants switching to match the model’s prediction. Inversely, the great global error rates in the Less than K class prompted participants to follow these suggestions.
This is more clearly demonstrated when (Human - Low & Model - High), where knowing that the model had success rate when predicting Less than K, encouraged participants in the Combined condition to switch in of the trials, compared to in the Local one. In line with this reasoning, when the prediction was More than K, participants in the former condition were aware that model performance was relatively poor, so their switching percentage plummeted to , which is substantially lower than the in the Local condition. This observation perfectly captures the added benefits of pairing these estimates together, as global error rates convey information about the robustness of local confidence scores themselves, which is in line with H4, however, additional studies are necessary in order to provide more robust evidence confirming this effect.
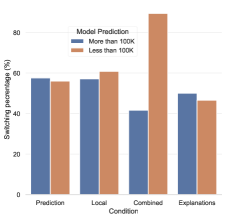
In the same vein, while the Combined and Explanations conditions followed a similar trend for instances with high human confidence, the pattern was drastically different for low confidence instances. Especially when (Human - Low & Model - Low), the trends got reversed, which could be interpreted as additional evidence that explanations promoted case by case reasoning. According to this account, participants in the Explanations condition looked past the poor error rate of the More than K predictions, using explanations to verify whether the model’s reasoning was sound for the instance at hand. Notably they were very successful in doing so, since their accuracy in cases where they switched to follow a More than K model prediction was . Future research should investigate this topic in more detail, however this pattern along with the one in Section 4.2.3, provided some very promising indications in favour of this interpretation of the results.
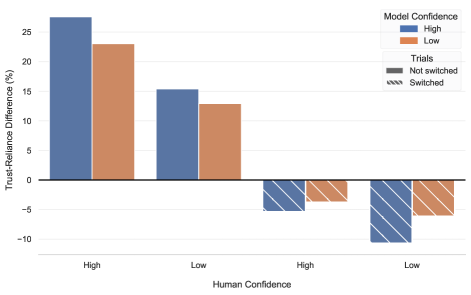
Finally, we discuss a pattern that illustrates the non-equivalence of reliance and trust. Figure 9 shows the average difference between participants’ trust and reliance scores, once considering trials where participants did not switch their predictions (regardless of whether they initially agreed with the model), and once considering only trials where they switched. In the former, there was a positive trend for all human/model combinations of confidence, meaning that participants’ trust scores were higher than their reliance ones. However, when considering only switching trials, a stark contrast was observed, with the trend getting completely reversed, and reliance scores dominating the corresponding trust ones. We should note that this discrepancy was induced by differences in reliance, since although participants’ trust increased by in switching trials, the corresponding increase in reliance was equal to an impressive . Even though we only offer a qualitative account of this phenomenon, the observed pattern is consistent with previous works that argue that both agreement and switching percentages are indicators of reliance, not trust. Adding to this, we found that in of all trials where participants and model agreed, their reported reliance scores were lower that out of , meaning that their predictions were predominantly driven by their own intuitions. This indicates that switching percentage is a stronger indicator of reliance, since human-model agreement on its own does not necessarily imply high reliance. Regardless, interpreting either as a manifestation of trust may result to misleading conclusions.
5 Discussion
In this section we discuss and contextualize our results, as well as we propose several future research directions.
5.1 The role of human confidence
Our findings provided strong evidence that human confidence has a major effect on multiple aspects of the joint human-AI synergy. Extending the results in (Bansal et al., 2021b), we showed that humans were predominantly benefited by the model’s assistance in cases where they are uncertain, but the model made high confidence predictions. This finding is in line with highly influential existing theories on human-computer interaction (Lee and See, 2004; Hoff and Bashir, 2015), where it is argued that users’ self-confidence impacts their attitude towards automation. Furthermore, the results presented in Section 4.1, demonstrated that not accounting for human confidence may severely distort an analysis. In light of these findings, future experimental studies should be designed in a way that records or controls for human confidence, instead of solely focusing on model confidence. Interestingly, an emerging line of research calls for training ML models using procedures that incorporate human confidence (Bansal et al., 2021a; Mozannar and Sontag, 2020; Wilder et al., 2020), indicating that there is a general interest into utilizing and accounting for this factor.
Beyond predictive performance, our findings suggested that the influence of human confidence extends to users’ reliance, understanding, and trust towards a model. Moreover the discussion in Section 4.4, emphasized that human confidence also influenced switching and agreement percentages, while also raising concerns about the suitability of these two indicators to assess trust. Previous research has been consistent that both of these measure reliance (Dixon and Wickens, 2006; Madhavan and Phillips, 2010; Miller et al., 2016), and has discussed the caveats of studying trust through reliance (Chancey et al., 2015; Hussein et al., 2020). In our opinion, this calls for rethinking experimental designs or for adjusting the way final results are interpreted. A potential resolution would be to compliment reliance indicators with items from specialized trust measuring scales, and assess trust based on both, which has been the standard practice within the human factors and human-computer interaction communities (Wang et al., 2009; Chancey et al., 2013; Moray et al., 2000; Merritt and Ilgen, 2008), or to use more elaborated behavioural indicators that capture multiple aspects of trust, such as those in (De Vries et al., 2003; Miller et al., 2016). An alternative to modifying the experimental designs, would be to motivate surveys and form hypotheses in terms of reliance (Lee and See, 2004).
5.2 The complementary effect of uncertainty and explanations
Another central question we explored in this work concerns the role of combining uncertainty estimates and explanations. Prior work suggested that in terms of accuracy, pairing model predictions with the corresponding confidence is as effective as pairing them with explanations (Bansal et al., 2021b; Lai and Tan, 2019; Lai et al., 2020), implying that, performance-wise, uncertainty estimates are as powerful as explanations, while arguably being simpler to understand and implement. Consistent with this idea, our results provided evidence that when both predictions and confidence information were available, providing participants with additional information did not lead to better performance. Despite that, we identified a strong complementary effect, since participants in the Explanations condition had significantly higher self-reported understanding, while also exhibiting a far superior objective model understanding. Interestingly, although only feature importance explanation were provided, their effect permeated multiple aspects of model understanding. Increased understanding has been linked to higher rates of model acceptance (Shin, 2021), while the findings in (Ashoori and Weisz, 2019) indicate that when the stakes are high, ethical considerations may lead to people entirely dismissing a model, regardless of its accuracy, unless they are able to understand its decision-making process. A promising future direction is to adopt a longitudinal experimental design and quantify the effect of explanations on model acceptance or retention. In general, user behaviour is shaped over multiple interactions with the model through an extended period of time, where unexpected or otherwise surprising behaviour may manifest, so longitudinal designs have the potential to provide important insights that are missed by cross sectional designs, which do not record how user behaviour changes over extended periods of time.
Moreover, our results indicated that complementary effects can be found within uncertainty measures too, as discussed in Section 4.4. This is consistent with the recent discussions in (Bhatt et al., 2021), demonstrating how communicating different kinds of uncertainty information can induce different user behaviour. In this work we considered predicted probabilities and recall, however there is a lot of room for exploring different measures or combinations thereof, such as precision, false discovery rate, etc. In particular, we find the approach of combining information with diverse scopes (e.g. local and global) to be very promising and worthy of further exploration. An immediate follow up study stemming from our work could explore the effect of more refined global uncertainty information. For example, instead of providing the overall recall of each class, we could first cluster the datapoints based on similarity, and then compute cluster-wise recalls. This localized version of a global summary allows for capturing potential variability in model performance within the same class, depending on sub-population characteristics. However, it should be noted that such approaches require users to have a certain level of numerical competency, which differs substantially from person to person (Zikmund-Fisher et al., 2007), so alternatives exploring visualizations and/or natural language expressions of uncertainty should be considered as well.
5.3 Explanations in AI
Our findings suggested that explanations provided unique insights that impact model understanding, however explanatory needs are highly dependent on the application (Zhou et al., 2021; Ribera and Lapedriza, 2019). Our work only considered feature importance explanations, however alternative scenarios may call for different types of explanations, such as generating counterfactual instances (Wachter et al., 2018) or propositional rules (Ribeiro et al., 2018). Although there is a number of recent surveys that compare the effect of various explanation types (Wang and Yin, 2021; Bansal et al., 2021b; Lai and Tan, 2019), to our knowledge there has not been a systematic effort to study the relationship between application characteristics and explanation style preference or efficacy. Furthermore, even within the same application, we expect stakeholders of different expertise to have different explanatory preferences.
Finally, in Section 4.1, we provided evidence that when participants had low confidence, model assistance significantly improved their performance, especially when the model generated high confidence predictions. Having said that, when both parties had high confidence, we mostly observed a downwards trend, which resulted in a significant decline in performance in the Explanations condition. It is possible that this finding was due to participants’ having an information overload (Poursabzi-Sangdeh et al., 2021), where they had a hard time keeping track of all the information that was presented to them. However, other surveys have raised concerns about human over-reliance on a model when explanations are provided (Bansal et al., 2021b; Kaur et al., 2020), so the observed decline in accuracy might be related to this phenomenon. In our view, a promising step towards resolving this situation could be to explore the effect of communicating information about the robustness of an explanation. Most XAI techniques heavily rely on approximations, which means that the final explanation might not be faithful to the model, thus distorting its decision-making process. Moreover, even if no approximations are performed, explanations might face stability issues, where small feature perturbations may lead to drastically different explanations (Yeh et al., 2019). If presented with such information, it is reasonable to assume that users would be more skeptical of explanations, thus reducing their over-reliance. All things considered, we believe that the interplay between uncertainty and explanations calls for further exploration, as it can be integral in guiding the safe and responsible adaptation of automated systems.
6 Limitations
We acknowledge that one limitation of our study is that we only recruited participants residing in USA, thus we make no claims about the cross-cultural validity of our results. Moreover, we did not record information about participants’ familiarity and attitude towards AI, so our results may be influenced by participants predispositions towards automation. Furthermore, participants were not experts on salary prediction tasks. We alleviated this limitation by including a familiarization phase in our experiment. The fact that participants’ performance was comparable to the model’s indicates that our approach was effective.
Another limitation is that participants were not held liable for their performance, which bared no consequence to them. We addressed this limitation by providing additional performance-based rewards to motivate participants strive for optimal performance.
7 Conclusions
Previous empirical studies have demonstrated that pairing model predictions and confidence is more effective than explanations in assisting humans improve their accuracy in decision-making tasks. In this work we ask whether bringing them together can provide complementary, non-accuracy related benefits, while also exploring how the interaction of human and model confidence influences human-AI joint accuracy, reliance, understanding, and trust towards the model. To this end, we conducted a study with human participants. We found strong evidence suggesting that human performance is improved in cases where they have low confidence themselves, but the model makes high confidence predictions. Moreover, we found that pairing uncertainty estimates with explanations induces a complementary effect, resulting in high performance and significantly better model understanding. We concluded our findings by providing a qualitative analysis outlining the benefits of combining uncertainty estimates with different scopes, as well as the potential pitfalls of utilizing reliance indicators to measure trust.
We hope that this work will motivate future research that further investigates the role of self-confidence and how different combinations of information influence the human-AI collaboration, in situations where time constraints or other inherent risks are present. Furthermore, another promising direction would be to explore whether interactive methods where humans can actively enquiry a model to satisfy their explanatory needs yield additional benefits, compared to static strategies (like the ones considered in this experiment). Achieving a synergistic relationship between humans and AI is set to be one of the main end goals of the responsible incorporation of AI in our society, and advances along these lines should hopefully bring us a step closer to achieving these endeavours.
Acknowledgments and Disclosure of Funding
We would like to thank Peter Gostev for all the stimulating discussions, which heavily contributed into pursuing the research questions considered in this work. Moreover, we are grateful to Maria Mavridaki for her feedback and suggestions, which greatly improved the quality of the final manuscript.
References
- Adams et al. [2003] Barbara D Adams, Lora E Bruyn, Sébastien Houde, Paul Angelopoulos, Kim Iwasa-Madge, and Carol McCann. Trust in automated systems. Ministry of National Defence, 2003.
- Ajzen [1980] Icek Ajzen. Understanding attitudes and predicting social behavior. Englewood cliffs, 1980.
- Ashoori and Weisz [2019] Maryam Ashoori and Justin D Weisz. In ai we trust? factors that influence trustworthiness of ai-infused decision-making processes. arXiv preprint arXiv:1912.02675, 2019.
- Bansal et al. [2021a] Gagan Bansal, Besmira Nushi, Ece Kamar, Eric Horvitz, and Daniel S Weld. Is the most accurate ai the best teammate? optimizing ai for teamwork. In Proceedings of the AAAI Conference on Artificial Intelligence, volume 35, pages 11405–11414, 2021a.
- Bansal et al. [2021b] Gagan Bansal, Tongshuang Wu, Joyce Zhou, Raymond Fok, Besmira Nushi, Ece Kamar, Marco Tulio Ribeiro, and Daniel Weld. Does the whole exceed its parts? the effect of ai explanations on complementary team performance. In Proceedings of the 2021 CHI Conference on Human Factors in Computing Systems, pages 1–16, 2021b.
- Bhatt et al. [2021] Umang Bhatt, Javier Antorán, Yunfeng Zhang, Q Vera Liao, Prasanna Sattigeri, Riccardo Fogliato, Gabrielle Melançon, Ranganath Krishnan, Jason Stanley, Omesh Tickoo, et al. Uncertainty as a form of transparency: Measuring, communicating, and using uncertainty. In Proceedings of the 2021 AAAI/ACM Conference on AI, Ethics, and Society, pages 401–413, 2021.
- Cahour and Forzy [2009] Béatrice Cahour and Jean-François Forzy. Does projection into use improve trust and exploration? an example with a cruise control system. Safety science, 47(9):1260–1270, 2009.
- Chancey et al. [2013] Eric T Chancey, Alexandra Proaps, and James P Bliss. The role of trust as a mediator between signaling system reliability and response behaviors. In Proceedings of the Human Factors and Ergonomics Society Annual Meeting, volume 57, pages 285–289. SAGE Publications Sage CA: Los Angeles, CA, 2013.
- Chancey et al. [2015] Eric T Chancey, James P Bliss, Alexandra B Proaps, and Poornima Madhavan. The role of trust as a mediator between system characteristics and response behaviors. Human factors, 57(6):947–958, 2015.
- De Vries et al. [2003] Peter De Vries, Cees Midden, and Don Bouwhuis. The effects of errors on system trust, self-confidence, and the allocation of control in route planning. International Journal of Human-Computer Studies, 58(6):719–735, 2003.
- Dixon and Wickens [2006] Stephen R Dixon and Christopher D Wickens. Automation reliability in unmanned aerial vehicle control: A reliance-compliance model of automation dependence in high workload. Human factors, 48(3):474–486, 2006.
- Dodge et al. [2019] Jonathan Dodge, Q Vera Liao, Yunfeng Zhang, Rachel KE Bellamy, and Casey Dugan. Explaining models: an empirical study of how explanations impact fairness judgment. In Proceedings of the 24th international conference on intelligent user interfaces, pages 275–285, 2019.
- Efron and Tibshirani [1986] Bradley Efron and Robert Tibshirani. Bootstrap methods for standard errors, confidence intervals, and other measures of statistical accuracy. Statistical science, pages 54–75, 1986.
- Green and Chen [2019] Ben Green and Yiling Chen. The principles and limits of algorithm-in-the-loop decision making. Proceedings of the ACM on Human-Computer Interaction, 3(CSCW):1–24, 2019.
- Gugenheimer et al. [2017] Jan Gugenheimer, Evgeny Stemasov, Julian Frommel, and Enrico Rukzio. Sharevr: Enabling co-located experiences for virtual reality between hmd and non-hmd users. In Proceedings of the 2017 CHI Conference on Human Factors in Computing Systems, pages 4021–4033, 2017.
- Hartmann et al. [2019] Jeremy Hartmann, Christian Holz, Eyal Ofek, and Andrew D Wilson. Realitycheck: Blending virtual environments with situated physical reality. In Proceedings of the 2019 CHI Conference on Human Factors in Computing Systems, pages 1–12, 2019.
- Hernán et al. [2011] Miguel A Hernán, David Clayton, and Niels Keiding. The simpson’s paradox unraveled. International journal of epidemiology, 40(3):780–785, 2011.
- Hoff and Bashir [2015] Kevin Anthony Hoff and Masooda Bashir. Trust in automation: Integrating empirical evidence on factors that influence trust. Human factors, 57(3):407–434, 2015.
- Hoffman et al. [2018] Robert R Hoffman, Shane T Mueller, Gary Klein, and Jordan Litman. Metrics for explainable ai: Challenges and prospects. arXiv preprint arXiv:1812.04608, 2018.
- Hussein et al. [2020] Aya Hussein, Sondoss Elsawah, and Hussein A Abbass. Trust mediating reliability–reliance relationship in supervisory control of human–swarm interactions. Human Factors, 62(8):1237–1248, 2020.
- Jian et al. [2000] Jiun-Yin Jian, Ann M Bisantz, and Colin G Drury. Foundations for an empirically determined scale of trust in automated systems. International journal of cognitive ergonomics, 4(1):53–71, 2000.
- Julious and Mullee [1994] Steven A Julious and Mark A Mullee. Confounding and simpson’s paradox. Bmj, 309(6967):1480–1481, 1994.
- Kaur et al. [2020] Harmanpreet Kaur, Harsha Nori, Samuel Jenkins, Rich Caruana, Hanna Wallach, and Jennifer Wortman Vaughan. Interpreting interpretability: understanding data scientists’ use of interpretability tools for machine learning. In Proceedings of the 2020 CHI conference on human factors in computing systems, pages 1–14, 2020.
- Kelly [2003] C Kelly. Guidelines for trust in future atm systems-principles. EUROCONTROL: Brussels, 2003.
- Konietschke et al. [2015] Frank Konietschke, Arne C Bathke, Solomon W Harrar, and Markus Pauly. Parametric and nonparametric bootstrap methods for general manova. Journal of Multivariate Analysis, 140:291–301, 2015.
- Kudo et al. [2021] Yoshiki Kudo, Anthony Tang, Kazuyuki Fujita, Isamu Endo, Kazuki Takashima, and Yoshifumi Kitamura. Towards balancing vr immersion and bystander awareness. Proc. ACM Hum. Comput. Interact., 5(ISS):1–22, 2021.
- Lai and Tan [2019] Vivian Lai and Chenhao Tan. On human predictions with explanations and predictions of machine learning models: A case study on deception detection. In Proceedings of the conference on fairness, accountability, and transparency, pages 29–38, 2019.
- Lai et al. [2020] Vivian Lai, Han Liu, and Chenhao Tan. ” why is’ chicago’deceptive?” towards building model-driven tutorials for humans. In Proceedings of the 2020 CHI Conference on Human Factors in Computing Systems, pages 1–13, 2020.
- Lee and Moray [1992] John Lee and Neville Moray. Trust, control strategies and allocation of function in human-machine systems. Ergonomics, 35(10):1243–1270, 1992.
- Lee and Moray [1994] John D Lee and Neville Moray. Trust, self-confidence, and operators’ adaptation to automation. International journal of human-computer studies, 40(1):153–184, 1994.
- Lee and See [2004] John D Lee and Katrina A See. Trust in automation: Designing for appropriate reliance. Human factors, 46(1):50–80, 2004.
- Lewandowsky et al. [2000] Stephan Lewandowsky, Michael Mundy, and Gerard Tan. The dynamics of trust: comparing humans to automation. Journal of Experimental Psychology: Applied, 6(2):104, 2000.
- Linegang et al. [2006] Michael P Linegang, Heather A Stoner, Michael J Patterson, Bobbie D Seppelt, Joshua D Hoffman, Zachariah B Crittendon, and John D Lee. Human-automation collaboration in dynamic mission planning: A challenge requiring an ecological approach. In Proceedings of the human factors and ergonomics society annual meeting, volume 50, pages 2482–2486. SAGE Publications Sage CA: Los Angeles, CA, 2006.
- Lundberg et al. [2018] Scott M Lundberg, Bala Nair, Monica S Vavilala, Mayumi Horibe, Michael J Eisses, Trevor Adams, David E Liston, Daniel King-Wai Low, Shu-Fang Newman, Jerry Kim, et al. Explainable machine-learning predictions for the prevention of hypoxaemia during surgery. Nature biomedical engineering, 2(10):749–760, 2018.
- Madhavan and Phillips [2010] Poornima Madhavan and Rachel R Phillips. Effects of computer self-efficacy and system reliability on user interaction with decision support systems. Computers in Human Behavior, 26(2):199–204, 2010.
- Madsen and Gregor [2000] Maria Madsen and Shirley Gregor. Measuring human-computer trust. In 11th australasian conference on information systems, volume 53, pages 6–8. Citeseer, 2000.
- McKnight and Najab [2010] Patrick E McKnight and Julius Najab. Mann-whitney u test. The Corsini encyclopedia of psychology, pages 1–1, 2010.
- Mehrabi et al. [2021] Ninareh Mehrabi, Fred Morstatter, Nripsuta Saxena, Kristina Lerman, and Aram Galstyan. A survey on bias and fairness in machine learning. ACM Comput. Surv., 54(6), July 2021. ISSN 0360-0300. doi: 10.1145/3457607. URL https://doi.org/10.1145/3457607.
- Merritt and Ilgen [2008] Stephanie M Merritt and Daniel R Ilgen. Not all trust is created equal: Dispositional and history-based trust in human-automation interactions. Human factors, 50(2):194–210, 2008.
- Miller et al. [2016] David Miller, Mishel Johns, Brian Mok, Nikhil Gowda, David Sirkin, Key Lee, and Wendy Ju. Behavioral measurement of trust in automation: the trust fall. In Proceedings of the human factors and ergonomics society annual meeting, volume 60, pages 1849–1853. SAGE Publications Sage CA: Los Angeles, CA, 2016.
- Moray et al. [2000] Neville Moray, Toshiyuki Inagaki, and Makoto Itoh. Adaptive automation, trust, and self-confidence in fault management of time-critical tasks. Journal of experimental psychology: Applied, 6(1):44, 2000.
- Mozannar and Sontag [2020] Hussein Mozannar and David Sontag. Consistent estimators for learning to defer to an expert. In International Conference on Machine Learning, pages 7076–7087. PMLR, 2020.
- Naik et al. [2022] Nithesh Naik, BM Hameed, Dasharathraj K Shetty, Dishant Swain, Milap Shah, Rahul Paul, Kaivalya Aggarwal, Sufyan Ibrahim, Vathsala Patil, Komal Smriti, et al. Legal and ethical consideration in artificial intelligence in healthcare: who takes responsibility? Frontiers in surgery, page 266, 2022.
- Poursabzi-Sangdeh et al. [2021] Forough Poursabzi-Sangdeh, Daniel G Goldstein, Jake M Hofman, Jennifer Wortman Wortman Vaughan, and Hanna Wallach. Manipulating and measuring model interpretability. In Proceedings of the 2021 CHI conference on human factors in computing systems, pages 1–52, 2021.
- Ribeiro et al. [2018] Marco Tulio Ribeiro, Sameer Singh, and Carlos Guestrin. Anchors: High-precision model-agnostic explanations. 2018. URL https://www.aaai.org/ocs/index.php/AAAI/AAAI18/paper/view/16982.
- Ribera and Lapedriza [2019] Mireia Ribera and Agata Lapedriza. Can we do better explanations? a proposal of user-centered explainable ai. In IUI workshops, volume 2327, page 38, 2019.
- Roo and Hachet [2017] Joan Sol Roo and Martin Hachet. One reality: Augmenting how the physical world is experienced by combining multiple mixed reality modalities. In Proceedings of the 30th annual ACM symposium on user interface software and technology, pages 787–795, 2017.
- Sheridan [1989] TB Sheridan. Trustworthiness of command and control systems. In Analysis, Design and Evaluation of Man–Machine Systems 1988, pages 427–431. Elsevier, 1989.
- Shin [2021] Donghee Shin. The effects of explainability and causability on perception, trust, and acceptance: Implications for explainable ai. International Journal of Human-Computer Studies, 146:102551, 2021.
- Thoravi Kumaravel et al. [2020] Balasaravanan Thoravi Kumaravel, Cuong Nguyen, Stephen DiVerdi, and Bjoern Hartmann. Transceivr: Bridging asymmetrical communication between vr users and external collaborators. In Proceedings of the 33rd Annual ACM Symposium on User Interface Software and Technology, pages 182–195, 2020.
- Wachter et al. [2018] Sandra Wachter, Brent Mittelstadt, and Chris Russell. Counterfactual explanations without opening the black box: Automated decisions and the gdpr. Harvard journal of law & technology, 31:841–887, 04 2018.
- Wagner [1982] Clifford H Wagner. Simpson’s paradox in real life. The American Statistician, 36(1):46–48, 1982.
- Wang et al. [2009] Lu Wang, Greg A Jamieson, and Justin G Hollands. Trust and reliance on an automated combat identification system. Human factors, 51(3):281–291, 2009.
- Wang and Yin [2021] Xinru Wang and Ming Yin. Are explanations helpful? a comparative study of the effects of explanations in ai-assisted decision-making. In 26th International Conference on Intelligent User Interfaces, pages 318–328, 2021.
- Wilder et al. [2020] Bryan Wilder, Eric Horvitz, and Ece Kamar. Learning to complement humans. arXiv preprint arXiv:2005.00582, 2020.
- Wobbrock and Kay [2016] Jacob O Wobbrock and Matthew Kay. Nonparametric statistics in human–computer interaction. Modern statistical methods for HCI, pages 135–170, 2016.
- Woolson [2007] Robert F Woolson. Wilcoxon signed-rank test. Wiley encyclopedia of clinical trials, pages 1–3, 2007.
- Yeh et al. [2019] Chih-Kuan Yeh, Cheng-Yu Hsieh, Arun Suggala, David I Inouye, and Pradeep K Ravikumar. On the (in) fidelity and sensitivity of explanations. Advances in Neural Information Processing Systems, 32, 2019.
- Zhang et al. [2020] Yunfeng Zhang, Q Vera Liao, and Rachel KE Bellamy. Effect of confidence and explanation on accuracy and trust calibration in ai-assisted decision making. In Proceedings of the 2020 Conference on Fairness, Accountability, and Transparency, pages 295–305, 2020.
- Zhou et al. [2021] Jianlong Zhou, Amir H Gandomi, Fang Chen, and Andreas Holzinger. Evaluating the quality of machine learning explanations: A survey on methods and metrics. Electronics, 10(5):593, 2021.
- Zikmund-Fisher et al. [2007] Brian J Zikmund-Fisher, Dylan M Smith, Peter A Ubel, and Angela Fagerlin. Validation of the subjective numeracy scale: effects of low numeracy on comprehension of risk communications and utility elicitations. Medical Decision Making, 27(5):663–671, 2007.
- Zuboff [1988] Shoshana Zuboff. In the age of the smart machine: The future of work and power. Basic Books, Inc., 1988.
Appendix A CIs and Comparisons
Here are all the details of the CIs and comparisons that were presented in the main paper. All CIs are open, while CIs and p-values have been adjusted using the Bonferroni correction method in order to control the family-wise error rate.
A.1 CIs for Section 4.1
| Condition | Average Accuracy | CI |
| Prediction | ||
| Local | ||
| Combined | ||
| Explanations |
| Condition | Average Accuracy | CI |
| Prediction | ||
| Local | ||
| Combined | ||
| Explanations |
| Condition | Average Difference | CI |
| Prediction | ||
| Local | ||
| Combined | ||
| Explanations |
| Condition | Model Confidence | Average Difference | CI |
| Prediction | Low | ||
| Prediction | High | ||
| Local | Low | ||
| Local | High | ||
| Combined | Low | ||
| Combined | High | ||
| Explanations | Low | ||
| Explanations | Low |
| Condition | Human Confidence | Model Confidence | Average Difference | CI |
| Prediction | Low | Low | ||
| Prediction | High | Low | ||
| Prediction | Low | High | ||
| Prediction | High | High | ||
| Local | Low | Low | ||
| Local | High | Low | ||
| Local | Low | High | ||
| Local | High | High | ||
| Combined | Low | Low | ||
| Combined | High | Low | ||
| Combined | Low | High | ||
| Combined | High | High | ||
| Explanations | Low | Low | ||
| Explanations | High | Low | ||
| Explanations | Low | High | ||
| Explanations | High | High |
A.2 Effects and comparisons for Section 4.2.1
| Factor | df | Statistic | p-value |
| Condition | |||
| Model Confidence | |||
| ConditionModel Confidence | |||
| Human Confidence | |||
| ConditionHuman Confidence | |||
| Model ConfidenceHuman Confidence | |||
| ConditionModel ConfidenceHuman Confidence |
| Condition | Average Difference | Statistic | p-value |
| Prediction | |||
| Local | |||
| Combined | |||
| Explanations |
A.3 Effects and comparisons for Section 4.2.2
| Factor | df | Statistic | p-value |
| Condition | |||
| Model Confidence | |||
| ConditionModel Confidence | |||
| Human Confidence | |||
| ConditionHuman Confidence | |||
| Model ConfidenceHuman Confidence | |||
| ConditionModel ConfidenceHuman Confidence |
| Human/Model Confidence Contrast | Average Difference | Statistic | p-value |
| High/High vs High/Low | |||
| High/High vs Low/Low | |||
| High/High vs Low/High | |||
| High/Low vs Low/Low | |||
| High/Low vs Low/High | |||
| Low/High vs Low/Low |
| Condition Contrast | Average Difference | Statistic | p-value |
| Explanations vs Prediction | |||
| Explanations vs Local | |||
| Explanations vs Combined |
A.4 Effects and comparisons for Section 4.2.3
| Factor | df | Statistic | p-value |
| Condition | |||
| Model Confidence | |||
| ConditionModel Confidence | |||
| Human Confidence | |||
| ConditionHuman Confidence | |||
| Model ConfidenceHuman Confidence | |||
| ConditionModel ConfidenceHuman Confidence |
| Condition | Average Difference | Statistic | p-value |
| Prediction | |||
| Local | |||
| Combined | |||
| Explanations |
A.5 CIs for Section 4.3
| Contrast | Aspect | Average Difference | CI |
| Local vs Prediction | Global feature importance | ||
| Combined vs Prediction | Global feature importance | ||
| Explanations vs Prediction | Global feature importance | ||
| Local vs Prediction | Local feature importance | ||
| Combined vs Prediction | Local feature importance | ||
| Explanations vs Prediction | Local feature importance | ||
| Local vs Prediction | Counterfactuals | ||
| Combined vs Prediction | Counterfactuals | ||
| Explanations vs Prediction | Counterfactuals | ||
| Local vs Prediction | Model simulation | ||
| Combined vs Prediction | Model simulation | ||
| Explanations vs Prediction | Model simulation | ||
| Local vs Prediction | Error detection | ||
| Combined vs Prediction | Error detection | ||
| Explanations vs Prediction | Error detection |
Appendix B Objective Model Understanding Questions
The following are the multiple choice questions that were used to assess participants’ objective model understanding. The qualitative aspects of all questions and answers agree with the ones found in the test developed in [Wang and Yin, 2021], except from the fact that we do not allow for multiple correct answers. The correct answers are in red.
B.1 Global Feature Importance
B.1.1 Question 1
In general, the value of which feature has the greatest influence on the model’s predictions?
[a)] Age \tabenumitem[b)] Employer
\tabenumitem[c)] Education \tabenumitem[d)] Marital Status
\tabenumitem[e)] Occupation \tabenumitem[f)] Ethnic Background
\tabenumitem[g)] Gender \tabenumitem[h)] Hours-per-week
B.1.2 Question 2
In general, the value of which feature has the least influence on the model’s predictions?
[a)] Age \tabenumitem[b)] Employer
\tabenumitem[c)] Education \tabenumitem[d)] Marital Status
\tabenumitem[e)] Occupation \tabenumitem[f)] Ethnic Background
\tabenumitem[g)] Gender \tabenumitem[h)] Hours-per-week
B.2 Local Feature Importance
B.2.1 Question 3

For this particular person, the value of which feature had the greatest influence on the model’s prediction?
[a)] Age \tabenumitem[b)] Employer
\tabenumitem[c)] Education \tabenumitem[d)] Marital Status
\tabenumitem[e)] Occupation \tabenumitem[f)] Ethnic Background
\tabenumitem[g)] Gender \tabenumitem[h)] Hours-per-week
B.3 Counterfactuals
B.3.1 Question 4
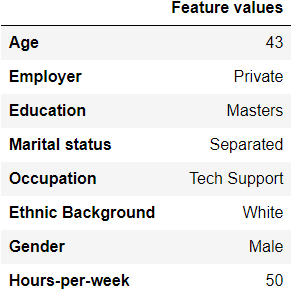
Our model currently predicts this person earns more than 100K dollars. If we change only one feature of this profile but leave all other features unchanged, which of the following changes is going to change our model’s prediction (i.e., make the model predict that the person earns less than 100K dollars)?
[a)] Change Age from 43 to 25
\tabenumitem[b)] Change Marital Status from Separated to Married
\tabenumitem[c)] Change Ethnic Background from White to Black
\tabenumitem[d)] Change Gender from Male to Female
B.3.2 Question 5
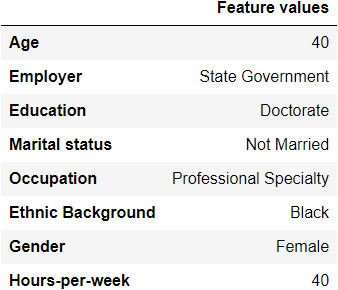
Our model currently predicts this person earns less than 100K dollars. If we change only one feature of this profile but leave all other features unchanged, which of the following changes is going to change our model’s prediction (i.e., make the model predict that the person earns more than 100K dollars)?
[a)] Change Age from 40 to 50
\tabenumitem[b)] Change Employer from State Government to Federal Government
\tabenumitem[c)] Change Marital Status from Not Married to Married
\tabenumitem[d)] Change Hours-per-week from 40 to 45
B.4 Model Simulation
B.4.1 Question 6
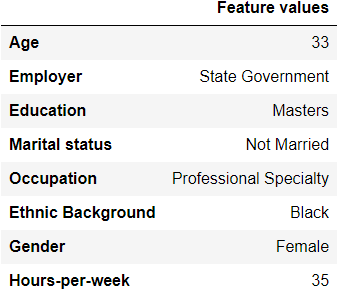
What do you think our model will predict for this person?
[a)] The model will predict this person earns Less than 100K dollars
\tabenumitem[b)] The model will predict this person earns More than 100K dollars
B.4.2 Question 7
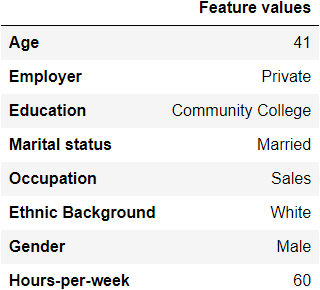
What do you think our model will predict for this person?
[a)] The model will predict this person earns Less than 100K dollars
\tabenumitem[b)] The model will predict this person earns More than 100K dollars
B.5 Error Detection
B.5.1 Question 8
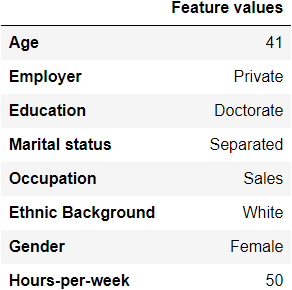
Our model predicts that this person earns Less than 100K dollars. Do you believe this prediction is correct?
[a)] Yes, I think this prediction is correct
\tabenumitem[b)] No, I think this prediction is wrong
B.5.2 Question 9
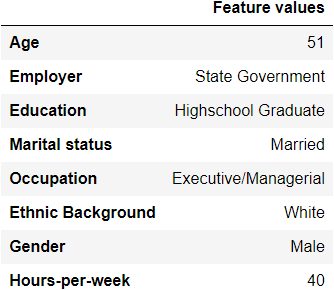
Our model predicts that this person earns Less than 100K dollars. Do you believe this prediction is correct?
[a)] Yes, I think this prediction is correct
\tabenumitem[b)] No, I think this prediction is wrong