supplement.pdf
Infrared spectra in amorphous alumina: a combined ab initio and experimental study
Abstract
We present a combined study based on experimental measurements of infrared (IR) dielectric function and first-principles calculations of IR spectra and vibrational density of states (VDOS) of amorphous alumina (am-\ceAl2O3). In particular, we show that the main features of the imaginary part of the dielectric function at 380 and 630 cm-1 are related to the motions of threefold coordinated oxygen atoms, which are the vast majority of oxygen atoms in am-\ceAl2O3. Our analysis provides an alternative point of view with respect to an earlier suggested assignment of the vibrational modes, which relates them to the stretching and bending vibrational modes of \ceAlOn ( 4, 5, and 6) polyhedra. Our assignment is based on the additive decomposition of the VDOS and spectra, which shows that: (i) the band at 380 cm-1 features oxygen motions occurring in a direction normal to the plane defined by the three nearest-neighbor aluminum atoms, i.e. out-of-plane motions of oxygen atoms; (ii) Al–O stretching vibrations (i.e. in-plane motions of oxygen atoms) appear at frequencies above 500 cm-1, which characterize the vibrational modes underlying the band at 630 cm-1. Aluminum and fourfold coordinated oxygen atoms contribute uniformly to the VDOS and spectra in the frequency region 350–650 cm-1 without causing specific features. Our numerical results are in good agreement with the previous and presently obtained experimental data on the IR dielectric function of am-\ceAl2O3 films. Finally, we show that the IR spectrum can be modeled successfully by assuming isotropic Born charges for aluminum atoms and fourfold coordinated oxygen atoms, while requiring the use of three parameters, defined in a local reference frame, for the anisotropic Born charges of threefold coordinated oxygen atoms.
I Introduction
Aluminium oxide (\ceAl2O3) is a technologically relevant material used in a wide variety of applications [1, 2, 3, 4, 5, 6]. In particular, polymorphs of \ceAl2O3 possess chemical inertness, thermal stability, and high dielectric properties [7]. In recent decades, the electronic properties of amorphous alumina (am-\ceAl2O3) have made it an attractive dielectric-insulator material for the use as a high- material [5] and for the development of supercapacitors [8, 7]. Also, the nanocomposites based on the am-\ceAl2O3 matrix have been explored for applications in harsh environments, for instance, to produce fuel cladding for Generation IV systems [4, 9], and as scratch-resistant coatings [10]. Finally, the heat transport properties of am-\ceAl2O3 are also an active field of research [2, 11], the understanding of which is ultimately associated with the correct description of the vibrational modes.
Al2O3 presents a variety of crystalline phases (e.g. , , , , , ). This structural polymorphism reflects the predominant ionic nature of the Al-O bond, which entails a large variability in the O-Al-O bond angle and in local structures, which can be composed of both tetrahedral and octahedral Al units. Amorphous \ceAl2O3 can be produced in different forms, e.g. anodic or evaporated films. The atomic structure of am-\ceAl2O3 thin films has been the object of many experimental investigations in the last two decades. For instance, high-resolution solid-state NMR studies have shown that the fractions of fourfold and fivefold coordinated Al atoms (i.e. \ceAlO4 and \ceAlO5 units) are dominant in these films reaching 92–95% [12, 13, 14]. A subsequent first-principles study [15] confirmed this fact for the densities of model structures of 2.9, 3.1, and 3.3 g/cm3. The fivefold coordination of Al atoms can be regarded as a fingerprint of the amorphous phase [16], which eventually might be relevant for catalysis applications [6]. Crystallization phenomena leads to formation of edge-sharing sixfold coordinated Al polyhedra (i.e. \ceAlO6 units) together with threefold and fourfold coordinated O atoms (i.e. \ceOAl3 and \ceOAl4 units) while the fivefold coordinated Al atoms undergo annihilation [17, 16]. Recent structural investigations (X-ray, neutron, and NMR) of amorphous and deeply supercooled liquid alumina were carried out by Shi et al. [18] and Hashimoto et al. [19], which also support the presence of high populations of \ceAlO4 and \ceAlO5 units predominantly linked by triply shared O atoms.
Unlike various glass-forming oxides (e.g. \ceSiO2, \ceGeO2, \ceB2O3, \ceP2O5, etc.), for am-\ceAl2O3, as far as we know, there are still no experimental data on inelastic scattering of neutrons or X-rays that provide a vibrational density of states (VDOS), with the exception for nanoparticle shells in the Boson peak frequency range [20]. Infrared (IR) spectroscopy is the most widely used experimental technique to investigate vibrational properties in am-\ceAl2O3 thin films [21, 22, 23, 24, 25], but despite this fact, the vibrational bands in the frequency range from 300 to 700 cm-1 are still assigned in the literature to not so well specified \ceAlO4, \ceAlO5, and \ceAlO6 stretching vibrational modes [26]. Moreover, previous theoretical approaches ranging from classical and ab initio molecular dynamics (MD) [27, 28, 29] to neural network schemes [30] do not lead to a reliable analysis for the assignment of the vibrational modes.
To the best of our knowledge, experimentally derived complex dielectric functions, , for high-quality am-\ceAl2O3 films have been provided only in a few cases [21, 31]. In particular, in Ref. 21 the dielectric function was derived from the experimental transmittance and reflectance data by using Fresnel’s equations. However, there is a problem with these experimental data, in particular that these data extrapolate to a rather low static dielectric limit, , compared to typical values obtained for beam-evaporated alumina films (8–9) [32, 33, 34, 35]. It should be noted that the technique used in Ref. 21 requires a non-reflecting substrate, high film homogeneity, low surface roughness, and sufficiently large thickness to ensure that no light returns from the inner sample to the sample surface. In addition, the quality of the experimental data depends on the proper choice and treatment (subtraction) of the substrate as well as from the evaluation of the refraction index . All of these factors can be the cause of the aforementioned inconsistencies. As a result, all these contradictions, both experimental and theoretical, prompt us to undertake a new combined numerical-experimental study.
In this work, we primarily focus on the origin of the vibrational modes of am-\ceAl2O3 giving rise to the experimental IR features peaking at 380 cm-1 and 600–630 cm-1 in the dielectric function. In order to elucidate the physics behind these features, we perform a complementary analysis based on high-quality experimental IR measurements (of am-\ceAl2O3 thin films prepared by using an electron-beam evaporation), and first-principles calculations based on density functional theory (DFT). We provide detailed numerical modeling of the IR and VDOS spectra, and reveal the contributions of the chemical species (O and Al) and various atomic units through additive decomposition approach. In particular, we point out the primary role of the motions of threefold coordinated O atoms in directions normal and parallel to the plane of the neighboring Al atoms. Such a comprehensive analysis provides a solid ground for the assignment of the vibrational modes and specific IR features of am-\ceAl2O3. Based on the analysis of the calculated Born effective charges, we outline a parametric model that, despite its simplicity, reflects the underlying physics and allows us to calculate the dielectric function at a level comparable to ab initio quality.
This paper is organized as follows. In Sec. II we provide computational details of the DFT calculations (Sec. II.1), and the physical properties of the am-\ceAl2O3 models used for this study are discussed in Sec. II.2. Experimental details concerning the synthesis, structural analysis, and IR spectra measurements are given in Sec. II.3. In Sec. III.1, we address structural properties such as coordination numbers and composition of the \ceOAl3 units for threefold coordinated oxygen atoms, and we also analyse short- and medium-range orders using the Al-O bond-length and void distributions. Section III.2 is devoted to vibrational modes, and, in particular, we present an analysis of the VDOS spectra. In Sec. III.3, we present results for the calculated and measured IR dielectric functions, the static and high-frequency dielectric constants, while in Sec. III.4 we provide an analysis of the dynamical Born charges needed to define a parametric model for calculating IR spectra. Section IV is devoted to the discussion of the results. The conclusions of this work are drawn in Sec. V.
II Methods
II.1 ab initio computational details
All the calculations for am-\ceAl2O3 carried out in this work are based on DFT, using the generalized gradient approximation (GGA) [i.e. the Perdew-Burke-Ernzerhof (PBE) [36] functional] and norm-conserving pseudopotentials for O and Al atoms [37, 38]. The Kohn-Sham wave functions are expanded in a basis of plane waves up to a kinetic energy cutoff of 70 Ry at the sole -point of the Brillouin zone, as justified by the large size and the large band gap of the considered system [39].
The structural models of am-\ceAl2O3 (Sec. II.2) are relaxed by adopting a force threshold of 0.0025 eV/Å, which allows for a proper harmonic treatment of the vibrational modes. We calculate the vibrational frequencies and eigenmodes as well as the high-frequency dielectric constant and the dynamical Born charges within the linear response approach [40]. In addition, the vibrational modes are obtained under the constraint that the force constants satisfy the acoustic sum rule. The codes used here for calculating structural and vibrational properties are freely available with the Quantum ESPRESSO package [40].
II.2 am-\ceAl2O3 model structures
In our study, we use several structural models of am-\ceAl2O3. The first structural model (hereafter named model I) was generated in Ref. 39 via Born-Oppenheimer MD simulations following a quench-from-the-melt approach. The initial configuration was obtained by adapting a 160-atom model of -\ceAl2O3 to an orthorhombic supercell. The alumina melt was equilibrated at 3000 K for 1 ps and subsequently quenched to 300 K in 14 ps. The atomic structure was then further relaxed by constraining the shape of the supercell and by allowing the lattice constants to relax freely in order to remove the residual stress. The final model contains 160 atoms in a (periodic) orthorombic simulation cell with sides: 11.475, 11.244, and 12.778 Å, corresponding to a density of 3.3 g/cm3. The neutron radial distribution function (RDF) calculated for this model [39] is found in fair agreement with experimental data from Ref. 41. For the present work, we have just further relaxed the atomic configuration (generated in Ref. [39] and available in Ref. [42]) as explained in Sec. II.1.
Two other models, hereafter named model II and model III, were generated in Ref. 27 (and named there as model G and model H, respectively). Models II and III both contain 120 atoms in an orthorhombic periodic supercell with a density of 3.27 and 3.22 g/cm3 [27], respectively. The models were generated by means of classical MD through a quench-from-the-melt procedure using the empirical pair-wise potential developed by Matsui in Ref. 43, and then employed in DFT calculations within the local density approximation (LDA) to obtain the dielectric response [27, 44]. Structure factors and RDFs of models II and III have been discussed in Ref. [27], and found to be consistent with other classical MD results and experiments. In the present work, the atomic configurations of these models have been only further relaxed by first-principles as explained in Sec. II.1.
To analyze the medium-range-order structure of our am-\ceAl2O3 models, we perform a void size distribution (VSD) analysis by using the Zeo++ code [45], an open source software that carries out a geometry-based analysis of porous materials and their voids (pores). In this analysis, every atom is considered as a sphere, and the radius of Al and O atoms are 1.23 and 0.73 Å, respectively [46]. A probe radius of 0.1 Å is used to scan empty space and find voids, i.e. spheres that can be inserted in contact with surrounding atoms without intersecting with them. Thus, the resulting VSD shows us how much void space corresponds to certain void sizes.
II.3 Experimental methods
Amorphous \ceAl2O3 films are deposited on the surface of a 500 m-thick undoped Si single-crystal wafer by using an electron-beam evaporation (Angstrom Engineering AMOD) with the substrate at room temperature and base pressure of Torr. The evaporation source is high-purity \ceAl2O3 and the deposition rate is 1 Å/s and controlled by a quartz crystal microbalance. The nominal thickness is 300 nm for FTIR spectroscopy measurements and 100 nm for X-ray reflectivity (XRR) measurements. The high resolution transmission electron microscopy (HR-TEM) imaging and X-ray diffraction are used to reveal the amorphous nature of the \ceAl2O3 film. Applying the XRR technique gives a density of 2.74 g/cm3 and shows a low surface roughness of 1.1 nm. The reader is referred to Fig. S1 and related text in the Supplementary Material [47] for more information on film characterization.
IR spectra are recorded using Bruker Vertex 70V IR spectrometer in transmission mode under vacuum. 64 scans are averaged with a resolution of 2 cm-1. A blank Si wafer is used for background recording. The traces of atmospheric water and \ceCO2 were removed using atmospheric compensation in Opus software (Bruker Optik GmbH). The spectra are smoothed by using the Savytzky-Golay algorithm and leveled to zero absorption at 4000 cm-1. In addition to the broad absorption between 100 and 1100 cm-1, there is a weak but broad absorption between 3000 and 3600 cm-1. This band pattern can be assigned to the stretching vibrations of surface hydroxyl groups [48].
For calculating optical constants and , related to the complex refraction index , we follow the procedure developed by Gerakines and Hudson [49]. This iterative procedure requires as input a transmission spectrum with a reference refractive index of the film, its thickness, and optical constants for the substrate over the same wavenumber range as the transmission spectrum. At each iteration, the Kramers-Kronig relation is used to obtain from for each wavenumber. The method is preferred in systems where obtaining a pure substance is challenging (e.g. in thin films), because it is hard to avoid multiple reflections and inferences when using reflective substrates.
III Results
III.1 Structural analysis
Before addressing the vibrational spectra of am-\ceAl2O3 presented in the next subsections, we here provide some basic information about the structure of the am-\ceAl2O3 models used in this study. In particular, in Table 1 we provide the coordination numbers of Al and O atoms, which is the most essential information for describing the local atomic arrangement (short-range order) in am-\ceAl2O3. Model I features a large fraction (70%) of fivefold and sixfold coordinated Al atoms with a smaller content of fourfold coordinated Al atoms (30%), in contrast to models II and III where the fraction of fourfold coordinated Al atoms (50%) is comparable to the total amount of fivefold and sixfold coordinated Al atoms. In model I, the vast majority (75%) of the O atoms are threefold coordinated (to Al atoms), while the remaining 25% show fourfold coordination. The fractions of O atoms that are threefold coordinated are even larger in models II and III, reaching up to 91.7%, although some of the O atoms in these models are even found to be twofold coordinated (1.4 and 8.3% in models II and III, respectively).
| Al | O | |||||
|---|---|---|---|---|---|---|
| Coordination | 4 | 5 | 6 | 2 | 3 | 4 |
| Model I | 29.7 | 53.1 | 17.2 | 75.0 | 25.0 | |
| Model II | 50.0 | 39.6 | 10.4 | 1.4 | 91.7 | 6.9 |
| Model III | 52.1 | 43.7 | 4.2 | 8.3 | 82.0 | 9.7 |
| Expt. [19] | 37.5 | 52.1 | 10.3 | |||
| Expt. [17] | 484 | 454 | 72 | |||
| Al3 | AlAl | AlAl2 | AlAl | AlAl2 | AlAlAl | Al3 | |
|---|---|---|---|---|---|---|---|
| Model I | 2.8 | 11.1 | 36.1 | 4.2 | 4.2 | 15.3 | 11.3 |
| Model II | 9.1 | 18.2 | 22.7 | 15.2 | 3.0 | 22.7 | 3.0 |
| Model III | 8.5 | 30.5 | 25.4 | 8.5 | 1.7 | 11.9 | 11.9 |
| 0.987 | 0.978 | 0.961 | 0.972 | 0.957 | 0.969 | 0.972 |
Models II and III show Al coordination numbers in reasonable agreement with the experimental estimate of Refs. 13, 17, 19, with minor differences with respect to the LDA-DFT results of Ref. 27, of which the most noticeable one concerns the low number of fivefold coordinated Al atoms, which has been found to increase by 10 upon the generation of model II [27]. On the other hand, model I shows a larger average Al coordination due to the larger number of sixfold and fivefold coordinated Al atoms. Incidentally, we note that, in spin-coated am-\ceAl2O3 films, large fractions (20%) of sixfold coordinated Al atoms have been estimated by using NMR spectroscopy [51]. Indeed, the structure of am-\ceAl2O3 films depends on the method of synthesis and on the deposition conditions [17, 52, 51], which can lead to structural changes, typically corresponding to fluctuations up to 10% of the coordination frequencies of Al (see Table 1). In particular, am-\ceAl2O3 resulting from solution processing such as sol-gel and spin-coating can exhibit large fractions of sixfold coordinated Al atoms due to the presence of hydroxyl groups, residual hydrogen or hydration [17].
The NMR investigation of Ref. 17 provided evidence that threefold coordinated O atoms in am-\ceAl2O3 can be distinguished from threefold coordinated O atoms in transition alumina phases, like - and -alumina. In fact, the threefold coordinated O atoms in the crystal structure are found to form a particular structural motif with one fourfold and two sixfold coordinated Al atoms (i.e. OAlAl2). By contrast, Ref. 17 suggests that in am-\ceAl2O3 the dominant configurations are OAlAl and OAlAl2, while the occurrence of configurations featuring only sixfold coordinated Al atoms, such as OAl3, should be negligible.
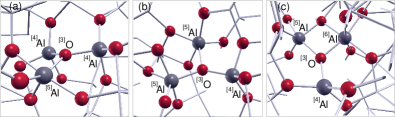
In Table 2 we give the results of the analysis of \ceOAl3 units in our models, and in particular we confirm that the dominant configurations (Fig. 1) in am-\ceAl2O3 models are OAlAl and OAlAl2 as they sum up to 50% of the \ceOAl3 units (56% in model III). Yet, we also find an important fraction of OAlAlAl units, which have to be considered as typical of the amorphous phase because of the occurrence of a fivefold coordinated Al atom, and which could be relevant in the context of crystallization [17]. The low concentration of OAlAl2 in our models indicates a marked structural difference with respect to - or -alumina crystalline phases, and it is consistent with the amorphous nature of our model structures [17].
The threefold coordinated O atoms are found to approximately lie on the plane of their three Al neighbors. To evaluate the planarity of these units, we define the ratio as obtained by dividing the sum over the three Al-O-Al angles by 360∘, which at most equals 1 for an ideal planar unit. About 80% of \ceOAl3 units in our models show a quite high degree of planarity, with a larger than 0.95 (i.e. with a sum of angles of 342∘), comparable to the degree of planarity of \ceOAl3 units in -alumina. In particular, we find that OAl3 and OAlAl are highly planar with an average of 0.987 and 0.978, respectively.
The mean Al-O bond lengths for models I, II, and III are 1.88, 1.85, and 1.84 Å, respectively. The average Al-O bond lengths for models II and III are in rather good agreement with the peak of the experimental neutron RDF of Ref. 19 located at 1.81 Å. Compared to the LDA-DFT simulation [27], we register a slight increase (by 0.10 Å) of the mean Al-O bond length for models II and III. Moreover, the calculated average Al-O bond-lengths of the \ceAlO4, \ceAlO5 and \ceAlO6 polyhedra in our models are 1.79, 1.89, and 1.96 Å, respectively. Hence, the slightly longer mean Al-O bond length of model I reflects the higher number of \ceAlO6 polyhedra and the smaller number of \ceAlO4 tetrahedra in this model as compared to models II and III (see Table 1). On the other hand, the calculated average O-Al bond lengths in our models for twofold, threefold and fourfold coordinated O atoms are 1.72, 1.85, and 1.95 Å, respectively, with some minor variations among models (0.01 Å) and with a rather large spread of about 0.04 Å in the bond distributions.
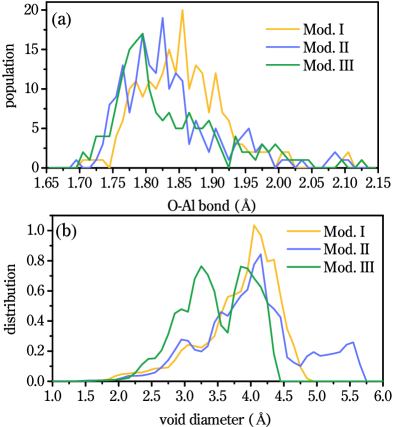
In Figs. 2(a) and (b) we provide the distribution of O-Al bond lengths for threefold coordinated O atoms and the void distribution analysis for the three alumina models. The Al-O bond length distributions of models II and III show peaks at 1.82 Å and 1.78 Å, respectively. The Al-O bond distribution of model I shows a shift towards longer bonds, as indicated by its peak located at 1.86 Å with respect to the distributions of models II and III. This value overestimates by 0.05 Å the experimental bond length [19]. This is also consistent with the differences between the mean Al-O bond lengths in our models, indicating that threefold coordinated O are still rather well representing the O-Al bond distribution.
The density of alumina films may vary due to its porosity and this can affect the dielectric function [31]. Although a discussion of porosity in alumina is beyond the scope of the present paper, it is of some interest to evaluate the distribution of voids in our models. This will also give a measure of the “openness” of the alumina network structure. Despite the fact that all the models have similar material densities, although slightly smaller in model III than in model I, we note that the VSD shown in Fig. 2(b) is substantially different in the three models. Moreover, from the positions of the main peaks of the VSDs in Fig. 2(b), one is brought to assume that a greater porosity corresponds to longer bonds, i.e. that the population of bond lengths correlates with the VSD.
III.2 Vibrational density of states
The vibrational density of states is calculated as
| (1) |
where is the total number of atoms in the model and is the vibrational frequency of the -th vibrational eigenmode . In addition, we consider the atomic contributions of the and differently coordinated O subpopulations:
| (2) |
where or O and the index enumerates the atoms.
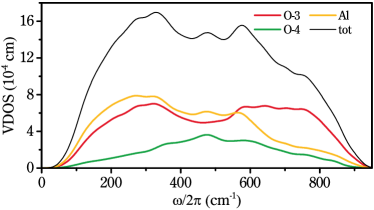
In Fig. 3, we show the total VDOS for model I of the am-\ceAl2O3 along with its decomposition in terms of oxygen and aluminium contributions as defined in Eq. (2). The calculated VDOS spectrum extends up to 950 cm-1. Several bands can be discerned and interpreted thanks to the atomic decomposition. The two bands peaked at 320 and 590 cm-1 reflect underlying features related to threefold coordinated O atoms. The central band peaking at 470 cm-1 corresponds to the contribution of fourfold coordinated O atoms to the total VDOS. The localization of vibrational modes is studied by using the mode participation ratio [54, 55], which is shown in Fig. S2 in the Supplementary Material [47]. It can be noted that the modes between 200 and 400 cm-1 are not spatially localized on individual \ceOAl3 units, while the stretching modes above 500 cm-1 show a tendency to become much more spatially localized.
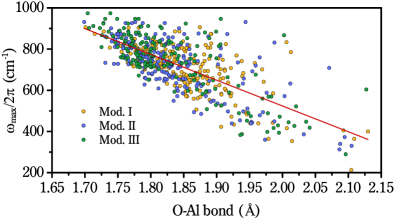
In Fig. 4, we consider threefold coordinated O atoms, and demonstrate that there is a correlation between the O-Al bond-lengths associated with these O atoms and the O-Al stretching frequencies . These frequencies are calculated by first finding the projections of the oxygen displacements, , onto the O-Al directions for each one of the three neighboring Al atoms, and then by looking at the frequency position of the peak of . The linear interpolation obtained by fitting the stretching frequencies for all threefold coordinated O atoms of the three models under study shows that the O-Al stretching frequency decreases with increasing bond lengths with a slope of 1250 cm-1/Å. Since Al atoms with increasing oxygen coordination show longer Al-O bond-lengths (Sec. III.1), this correlation allows us to explain the redshifts of the stretching bands in the spectra of our models as discussed in Sec. III.3.
III.3 Infrared dielectric function
The real and imaginary parts of the dielectric response function, and , are here calculated with the following expressions [56, 57]:
| (3) | |||||
| (4) |
where is the volume of the periodic simulation cell, and is the high-frequency (electronic) dielectric constant. The oscillator strengths can be calculated from the Born charges and eigenmodes as:
| (5) |
where is the atomic mass of the atom . We also introduce a coupling function as follows:
| (6) |
where is the VDOS given by Eq. (1).
Similar to the Raman additive decomposition (see Refs. 55, 58), the IR spectrum can be recast as:
| (7) |
where
| (8) |
with the -th oscillator strengths given by:
| (9) |
We evaluate the static dielectric constant , which can be written in terms of the electronic and lattice contributions [57] as:
| (10) | |||||
| (11) |
The dielectric function described above gives access to all the dielectric properties. In particular, to access longitudinal optical modes, we hereafter address the so-called energy loss function, which can be written in terms of the complex dielectric function by using directly Eqs. (3) and (4):
| (12) |
However, the loss function can also be obtained through a direct calculation [56, 59] by using the longitudinal modes as follows:
| (13) |
where is calculated by using and obtained by diagonalizing the full dynamical matrix [59]. For isotropic systems, the energy loss function in Eq. (13) can be averaged over all directions . Here, we use the three Cartesian directions for this average.
| Model I | 3.30 | 11.44 | 8.26 | 3.18 |
| Model II | 3.27 | 10.33 | 7.21 | 3.12 |
| Model III | 3.22 | 11.11 | 8.01 | 3.10 |
| Expt. | 2.53.4 | 811 | 2.52.9 | |
| Expt. (present) | 2.74 | 9 | 2.72 |
In Table 3, we give the static dielectric constants calculated for models I, II, and III, together with the high-frequency dielectric constants and the lattice contributions, in comparison with experimental data. The values of the static dielectric constant given in the literature depend on the method of preparation, e.g. is 8.3 for electron-beam evaporated films [34, 33, 32], while Ref. 64 gives values ranging from 9.8 to 13.3 for barrier-type aluminium oxides. For films obtained by atomic layer deposition (ALD), one finds in Ref. 62 a value of 11, while Kübler [32] provides 9.0 below 10 Hz at room temperature for films prepared by ion-assisted evaporation. The densities of am-\ceAl2O3 films also varies significantly depending on the production method, e.g. densities of 3.1–3.4 g/cm3 have been reported for magnetron-sputtered alumina films [61, 60], while a value of 2.45 g/cm3 has been measured for sol-gel prepared alumina films [31]. Beam-evaporated alumina films, as those investigated in this study, typically show a density range of 2.6–3.1 g/cm3 [32, 65]. The experimental values of the high-frequency electronic dielectric constant of am-\ceAl2O3 films range from 2.5 to 2.9, which corresponds to a high-frequency refractive index between 1.6 and 1.7 (at wavelengths around 1 m) [34, 35, 63, 61], with slight variations depending on the preparation method.
The calculated density of the studied am-\ceAl2O3 models is about 3.2–3.3 g/cm3 and lies in the range of experimentally recorded densities (Table 3). The electronic dielectric constant shows only minor variations between models (3%), which have slightly different densities (see Table 3). Also, the PBE-DFT results for models II and III show only minor differences (1.5%) compared to the LDA-DFT results [44]. In contrast, the lattice contribution is quite sensitive to the details of the VDOS, as indicated by the rather large differences between the models in Table 3 (see also Ref. 27). Compared to the LDA-DFT results of Ref. [27], we have an increase of about 20% for the in model III, meanwhile for model II we register a decrease of 2%, likely due to the fact that our VDOS does not show the strong peaks in the frequency range 50–100 cm-1 found for the corresponding model G [27, 44]. In Ref. 64, by using finite electric fields, a value of 3.03 was found for the high-frequency permittivity of model I, which only slightly underestimates the linear-response result in Table 3. This is consistent with the results obtained with different methods for models containing about a hundred atoms [66].
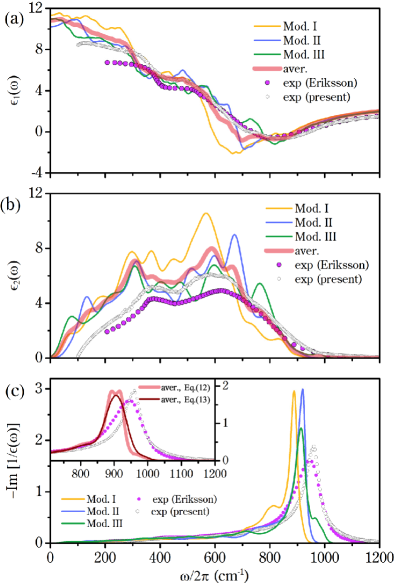
In Figs. 5(a) and (b), the dielectric functions and calculated for the three am-\ceAl2O3 models are compared with the experimental ones obtained from the data on the transmittance and reflectance by using the Fresnel equations [21], and those measured in this work. While the experimental of Refs. 21, 67 gives a static limit of 7, the data measured in this work entails a larger value 9. The shapes of the spectra shown in Fig. 5(a) are similar for both sets of experimental data, with a rather smooth step at 360–380 cm-1 and a very broad minimum at 800 cm-1. The dielectric function calculated for all three models is rather noisy due to the finite-size effect, which limits the number of vibrational modes at low frequencies. For all the models the static limit (10–11) is considerably larger than the experimental ones, because of (i) the slightly larger density, which may account for an increase of by 0.4 (Table 3), and of (ii) the finite size of our models, which leads to vibrational modes being less accessible at low frequencies ( cm-1, i.e. Boson peak region). Despite these limitations, the shape of the spectrum obtained by averaging over the three models agrees reasonably well with the experimental data.
The experimental spectrum reported in Refs. 21, 67 shows a very broad peak with a maximum at 630 cm-1 together with an additional feature at 380 cm-1. The experimental data obtained in this work present similar broad bands: the main band forming a plateau from 570 to 620 cm-1, peaking at 585 cm-1), and the additional band showing a peak at 370 cm-1. The intensity of both bands turns out to be significantly increased compared to previous measurements [21]. The main features of the spectrum calculated for model I comprise a double peak at 305 and 370 cm-1 and a principal band peaked at 570 cm-1, which exhibits a redshift with respect to the experimental data displayed in Fig. 5(b). The average Al-O bond length in model I is larger than in models II and III by about 0.03 Å. Because of the trend shown in Fig. 4, this produces a redshift in the stretching region (500–900 cm-1) of the spectrum of model I, compared to the spectra of the other two models. The spectra of models II and III show the first band at 320 cm-1 and the second band extending from 500 to 700 cm-1, the main peaks of which are located at 600 and 670 cm-1 in models III and II, respectively. The dielectric response for models II and III should be compared with the LDA-DFT results of Ref. 44, since our GGA-PBE models II and III are obtained by relaxation of the LDA-DFT models (see details in Sec. II.2). For model III, the results are very close to those reported in Ref. 44. By contrast, for model II, our results do not show neither any strong peak below 100 cm-1, as was found in Ref. 44, nor any important feature at 480 cm-1. We attribute these differences to minor structural changes that occur upon the structural relaxation described in Sec. III.1 and to the different DFT setups. In addition, we note that porous am-\ceAl2O3 can exhibit features in the spectrum at low frequency, i.e. 100 cm-1, but these do not occur in high-quality films of am-\ceAl2O3 [31]. Overall, averaging over the three models gives an spectrum in good agreement with the experimental one, except for a slight underestimation of the frequencies of the main peaks (by 10%) and an overestimation of the band intensities, which is typical for amorphous models of such size [69].
In Fig. 5(c), we show the loss function, , calculated through Eq. (12). The transverse and longitudinal modes are revealed by the frequency position of the maxima in and spectra, respectively [70]. A dominant high-frequency peak of at 900 cm-1 is clearly visible for all models. In models II and III, the peaks occur at very close frequencies (920 and 915 cm-1), while model I exhibits a peak at a slightly redshifted frequency 890 cm-1, as a likely consequence of the trend explained hereabove for the spectrum. The peaks obtained by averaging the spectra [calculated by Eqs. (12) and (13)] over all models [see inset on the panel (c)], are located at 900 cm-1, which is in good agreement (within 7%) with our experimental position of the high-frequency peak at 970 cm-1 obtained by using Eq. (12). Moreover both the experimental data obtained in this work and in Ref. 21 produce peaks at close frequencies at about 950-970 cm-1.
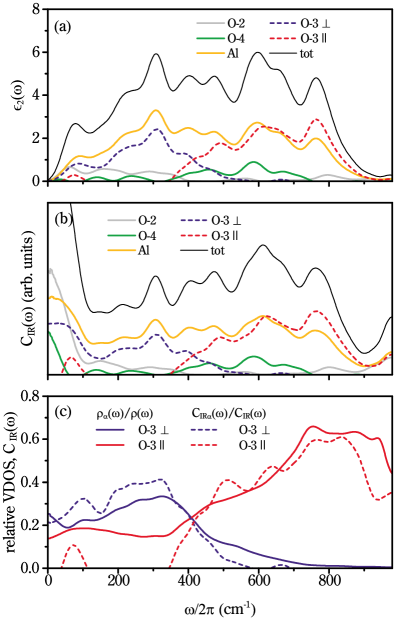
In the remainder of this subsection, in order to discuss the origin of the IR vibrational bands, we provide an atomic decomposition of the IR spectrum by using Eqs. (6) and (7). Next, we analyse the two main components underlying the IR spectrum: (i) the IR coupling functions given by Eq. (6); (ii) the squared displacement spectra in terms of relative weights of partial VDOSs given by Eq. (2). In Fig. 6(a), we show such a decomposition focusing on the imaginary part of the dielectric function, , of model III, the results for the other two models being similar. It can be seen that the main features come from contributions of in-plane and out-of-plane (perpendicular) motions of threefold coordinated O atoms, the plane being defined by the three nearest neighbor Al atoms. The vibrations related to the out-of-plane motion of these O atoms occur in the range cm-1 (dash blue), and give a maximal contribution to around 320 cm-1. Vibrational modes featuring in-plane motions of threefold coordinated oxygens cover the range cm-1 (dash red) and become dominant above 500 cm-1. The distinct separation of these contributions is due to different force constants associated with motions of threefold coordinated O atoms in parallel (stiff) and perpendicular (soft) directions. Al atoms, being highly coordinated, do not possess prominent features and contribute to the spectrum rather uniformly over the entire frequency domain (50%). Twofold coordinated O atoms provide a small contribution for frequencies below 400 cm-1, and also at about 800 cm-1 (O-Al stretching motions). Fourfold coordinated O atoms also give a rather minor contribution to the spectrum in the frequency range going from 400 to 700 cm-1. Thus, twofold and fourfold coordinated O atoms do not produce specific features in the spectrum, because of their rare occurrence in all our am-\ceAl2O3 models (as compared to threefold coordinated O atoms, see Table 1) and also because of the wide O-Al bond distribution associated with fourfold coordinated O atoms, as indicated by its large spread of 0.04 Å.
The atomic decomposition of the coupling function, , presented in Fig. 6(b), shows that the amplitude relations for the contributions of twofold, threefold, and fourfold coordinated O atoms, are quite similar to the ones displayed by the in Fig. 6(a), consistently with the fact that the VDOS is rather constant, without showing prominent peaks in the range from to 800 cm-1. In Fig. 6(c) we show the relative partial VDOSs (or squared displacement spectra) that highlights the frequency ranges of in-plane and out-of-plane motions of threefold coordinated O atoms. We also display the relative coupling functions [i.e. ], which present a substantial similarity to the relative partial VDOSs. The good agreement between the curves highlights (i) the dominant role of the pure in-plane and the pure out-of-plane vibrations, i.e. the interference effect, given by Eq. (8), is marginal, and (ii) the minor influence of the anisotropy and the orientation of the Born effective charge tensors. Thus, the functional dependence of the IR spectrum on frequency is mainly determined by the weighted squared displacement spectra and VDOS , i.e. . Equivalently, we can recast as a superposition of weighted partial VDOS spectra, i.e. , where are average Born effective charges corresponding to species, and where the O contribution can be further decomposed into in-plane and out-of-plane contributions. The next subsection is devoted to a detailed discussion of the Born effective charges.
III.4 Born charge tensors and parametric model
We here analyse the Born charges and discuss a parametric model that allows for the straightforward calculation of IR spectra provided that the atomic configuration, the vibrational modes and their frequencies are available.
The overwhelming majority of O atoms in am-\ceAl2O3 are threefold coordinated with Al atoms (see Table 1), while the O atom lies in the plane of its Al neighbors (see Sec. III.1). Then, to analyze their Born charge tensors , it is convenient to introduce the following local reference frame: the first basis vector is chosen along the bisector of an Al-Al-Al angle ( direction) of the triangle with the Al neighbors at the vertices; the second basis vector is taken along the direction perpendicular to the plane defined by the three nearest neighbors Al atoms ( direction); the last one can be found by the cross product of the first two basis vectors ( direction). Thus, \ceOAl3 units have an approximate trigonal symmetry (C3v), with the symmetry axis lying in the direction, according to our definition hereabove. In this local reference system, we calculate for the threefold coordinated O atom (hereafter ) as an average over the three possible choices of the basis and over the three models:
| (14) |
The average isotropic charge, i.e. , is found to be . For each atom, we perform a decomposition of its Born charge tensor in terms of the representations of the spatial rotations [71]:
| (15) |
where the first term is the isotropic term,
| (16) |
and the two traceless terms and are given by:
| (17) | ||||
| (18) |
with the superscript indicating the transpose matrix. We adopt a standard matricial norm (or matrix norm) [57] to quantify the respective weights of each component in Eq. (15). On average, we find that is negligible (weight 0.03%), while the traceless symmetric term (weight 3%) is well described by a diagonal matrix
| (19) |
By averaging over all atoms in our models and also keeping into account the three possible local bases for each O atom, we obtain the values and with standard deviations of 0.1. Due to the approximate trigonal symmetry , which leads to the fact that the tensor can be regarded as isotropic in the plane. Hence, we adopt the following Born charge tensor for atoms, defined in their local reference frame:
| (20) |
For fourfold, fivefold, and sixfold coordinated Al atoms, the isotropic component () accounts on average for 98.9%, 99.2% and 99.6% of the norm of the Born charge tensors , respectively. For fourfold coordinated O atoms, the average isotropic component accounts for 98.5% of the Born charge, which is noticeably higher than for atoms (96.6%). It was found that the average isotropic dynamical charge of fourfold coordinated O atoms , which is close to typical values given in the literature for O atoms in -\ceAl2O3 [72].
| Al | 4 | 5 | 6 |
|---|---|---|---|
| 2.73 (0.1) | 2.84 (0.08) | 2.93 (0.07) | |
| O | 2 | 3 | 4 |
| 1.82 (0.03) | 1.89 (0.05) | 1.95 (0.03) |
Since the twofold coordinated O atoms are rare [73] in am-\ceAl2O3 (see Table 1), we here just retain, for sake of simplicity, their average isotropic Born charge (). All average isotropic charges of Al and O atoms to be used as parameters in the evaluation of IR spectra are given in Table 4.
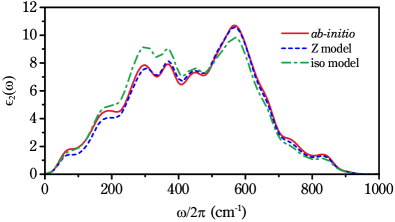
By taking advantage of Eqs. (15) and (19), and by assuming an isotropic charge for fourfold coordinated O atoms and for Al atoms, it is possible to define a basic parametric model for the calculation of the Born charge tensors in am-\ceAl2O3. In Fig. 7, we show spectra calculated with the parameters given in Table 4 compared with the ab initio result. For convenience, the spectrum achieved with the parametric coupling is also compared with the result from a calculation with sole average isotropic charges, i.e. and for all O and Al atoms, respectively. As we can see, the isotropic model is qualitatively correct, which is also implied by Sec. III.3, but it overestimates the band at 350 cm-1 and underestimates the band at 570 cm -1, showing quite large discrepancies from 8 to 15% relative to the parametric model, which accurately reproduces the intensity of all the main features of the ab initio spectrum. The higher accuracy of the parametric model compared to the isotropic one is due to the fact that the parametric model accounts for the difference in coupling charges of [3]O atoms for in-plane and out-of-plane motions (the plane defined by its Al neighbors). As can be seen in Eq. (20), this difference amounts to 30%, with the coupling charge along the out-of-plane (normal) direction being smaller than along in-plane directions. As a result, in the spectrum, the anisotropic Born charge of [3]O atoms [see Eq. (20)] leads to a lowering of the band intensity at 300–370 cm-1 with respect to that at 570 cm-1 (see Fig. 7).
IV Discussion
IR spectroscopy is a common technique for analyzing am-\ceAl2O3 films. In particular, absorption or transmission spectra are typically collected in the mid- and far-IR regions. These spectra are underlain by the dielectric function, the knowledge of which is essential for the correct description and interpretation of the features that appear in the experimental spectra.
Relying on the decomposition shown in Figs. 3 and 6, we associate the two main features of the spectrum with the motions of [3]O atoms. In particular, the band peaking at 380 cm-1 reflects the occurrence of oxygen motions in the direction normal to the plane of its Al neighbors (out-of-plane motions) in the \ceOAl3 units, while the band peaking at 600–630 cm-1 mainly results from in-plane motions of the same O atoms (i.e. from O-Al stretching vibrations). Hence, the function (or equivalently, the absorption) of am-\ceAl2O3 shows the presence of two main bands, and not of three bands, as e.g. in other oxides glasses, such as vitreous silica [74]. This is clearly a consequence of the dominant occurrence of \ceOAl3 subunits in the structure of am-\ceAl2O3 (see Table 1). We note that the presence of triply coordinated O atoms ([3]O) in am-\ceAl2O3 was recently discovered by using a special NMR-spectroscopy study [17]. This study shows that these [3]O atoms carry detailed NMR characteristics that are peculiar to am-\ceAl2O3 and differ substantially from those of [3]O atoms in crystalline counterparts, such as -alumina. In accordance with the remarks made in Ref. 17, we here find that in our models the dominant \ceOAl3 subunits contain one or two fivefold coordinated Al atoms (see Table 2), which do not occur in crystalline systems. Subunits containing threefold coordinated atoms also critically affect the shape of the spectrum in other materials, such as, e.g., amorphous \ceSi3N4, where nitrogen atoms are mostly threefold coordinated with silicon atoms [69]. As in am-\ceAl2O3, the spectrum in amorphous \ceSi3N4 exhibits two bands, located at 480 cm-1 and 820 cm-1 [69]. These bands are sharper than those of am-\ceAl2O3, which can be explained by the fact that the structure of amorphous \ceSi3N4 is dominated by silicon-centered tetrahedra, while the structure of am-\ceAl2O3 is more complex, with several competing types of Al-centered polyhedra.
Even if the spectrum in am-\ceAl2O3 might at first sight resemble that of -\ceAl2O3, which consists of several sharp features located in the ranges 380–440 cm-1 and 570–635 cm-1 [75], the origin of the vibrational modes at 380 cm-1 in am-\ceAl2O3 is essentially different. In -\ceAl2O3 all the O atoms are fourfold coordinated, while the vast majority of O atoms in am-\ceAl2O3 are threefold coordinated, which leads to the appearance of a broad band peaking at 380 cm-1 in the spectrum and featuring oxygen motion in the direction normal to the plane of three Al neighbors. The modes at 380 cm-1 in am-\ceAl2O3 inevitably differ from the modes arising upon bending modes of single \ceAlO6 octahedra in -\ceAl2O3 [76], where there are no [3]O atoms. In fact, all bending modes of the \ceAlO4, \ceAlO5, and \ceAlO6 polyhedra present in am-\ceAl2O3 should be considered, but a detailed analysis based on all vibrations of polyhedra is beyond the scope of this work. Nevertheless, the presence of structural motifs characteristic of the -\ceAl2O3 phase, i.e. edge-sharing polyhedra and sixfold Al polyhedra, in particular, can accidentally lead to a spatially local analogy between the vibrational modes of crystalline phases and the vibrational modes observed in the amorphous phase.
Among the transition alumina phases [15], -alumina features the largest fraction (50%) of \ceAlO4 tetrahedra and \ceAlO6 octahedra and, rather similarly to the amorphous phase, it also features a remarkable fraction (66%) of threefold coordinated O atoms (\ceOAl3 units in -alumina are of the OAlAl2 and OAlAl kinds showing a degree of planarity of 0.96 and 0.99, respectively) and a rather similar density (3.6 g/cm3 [77]). IR-spectroscopy studies of transition alumina phases assign a doublet with features at 330 and 370 cm-1 in the absorbance spectrum to the occurrence of the -alumina phase [76, 78, 79]. Considering that -alumina and am-\ceAl2O3 have some structural similarity, as noted above, one can conclude that vibrational modes around 330 cm-1 in -alumina [76] should have similar characteristics. In fact, in the present work we find (Figs. S3 and S4 in the Supplementary Material [47]) that in the frequency range 280–340 cm-1 the vibrational modes of the -alumina show significant out-of-plane motions of threefold coordinated O atoms. In our IR calculations (PBE-DFT), the highest frequency peak of the peculiar doublet is underestimated by about 40 cm-1 (i.e. 11%) [76, 80]. We thus infer that the peak position (320 cm-1) related to out-of-plane O motions, as found in our calculations (see Figs. 5 and 6), may suffer from a redshift of 40 cm-1 with respect to the experimental frequency. This further supports the assignment of the 370 cm-1 band in to out-of-plane motions of [3]O atoms.
A comparison between the various IR spectra of the models discussed here does not allow one to estimate the concentration of fourfold coordinated O atoms. However, based on Fig. 5, several considerations can be made. First, the \ceAl-O bond-length distribution of model I is shifted towards longer bonds compared to other models. Since the distribution reflects the variety of structural motifs present in model I, the shift can be explained by an excessively frequent occurrence of fivefold and sixfold coordinated Al atoms, as well as of fourfold coordinated O atoms, which leads to an increase in the average \ceAl-O bond-length (see Sec. III.1). Second, the trend (see Fig. 4) that correlates the \ceAl-O bond lengths and stretching frequencies, together with the distributions of \ceAl-O bond-lengths (see Fig. 2), implies that, in the spectrum of model I, the bond stretching bands will be redshifted compared with those of models II and III, thus explaining the lower frequency of the main peak (570 cm-1) and rapid decay of spectrum above 650 cm-1.
On the other hand, the out-of-plane oxygen band peaking at 320 cm-1 in model II is too sharp [see Fig. 5(b)], which probably indicates an excess of \ceOAl3 units in the model. Among the three models, the model that gives the values of closest to the experiment in terms of the positions of the bands and the overall shape of the spectrum is model III. In terms of the global shape of the spectrum, however, we achieve the best description of , and by averaging over all our models. This indicates that the set of models used in the present work is sufficiently representative of am-\ceAl2O3, although none of the adopted models provide such a good agreement individually. On the whole, as regards the intensities of the bands and the positions of the peaks, we have a better agreement between the calculated average IR spectra and those measured in this work compared to Ref. [21].
The averaged spectrum shows a very strained and stretched S-like shape, reminiscent of the one in silica [81]. From the high-frequency limit of the calculated we derive a refractive index of 1.7, which is consistent with the upper values pertaining to very compact am-\ceAl2O3 films [60]. In the low-frequency limit, we obtain for a value of 10–11, which belongs to the upper side of the typical experimental range 8–11 (see Table 3).
While the formation of am-\ceAl2O3 is thermodynamically quite unfavourable, it can be stabilized by applying interface, surface, or bulk stress. Indeed, producing thin films and nanoparticles was shown to be a successful approach to stabilize am-\ceAl2O3 [7]. In the present study, the electron-beam deposition technique at extremely low deposition rate is used to prepare homogeneous void-free am-\ceAl2O3 as indicated by Masakazu Tane et al. [82]. We note that other kinds of am-\ceAl2O3 thin films, e.g. prepared by RF sputtering, are known to have a grainy structure, which consequently introduces a source of scattering that affects the recorded IR spectra, while ALD prepared films contain carbon and chlorine impurities, which are absent in high-quality electron-beam deposited alumina films. Furthermore, a background subtraction processing is crucial to obtain a correct dielectric function. In our study, a transmission spectrum of a blank Si substrate is subtracted, allowing one to calculate the dielectric function taking advantage of the absence of IR absorption in the substrate. The ability to avoid measuring the reflectance eliminates the need to correctly indicate the intensity of the reflectance, which is usually related to Au (see Ref. [21]), and in fact differs from the reflectance at the substrate interface, thereby introducing a systematic error. However, in the case of thin films, it is particularly challenging to extract the dielectric function through the Kramers-Kronig relations, because of the multiple reflections and inferences arising from light interaction at the film-substrate interfaces and grain boundaries. Additionally, systematic errors in reflectivity measurements can occur by choosing, storing and measuring a suitable reference for the reflectivity measurements [83]. In this work we demonstrate that using the iterative procedure developed in Ref. [49] is an efficient way for obtaining the dielectric function from a single transmission spectrum. The value of the dielectric function in the mid-IR range nicely follows the experimental data previously reported by Eriksson et al. [21], while in the far-IR range Eriksson’s data shows lower values. The origin of the discrepancy might arise from the processing method used to prepare the thin films [52]. The intensity in the spectrum around 580 cm-1 measured in this work is larger compared with Eriksson’s data. In the light of our theoretical analysis, this may be attributed to a larger content of \ceAlO6 octahedra in the films used in the present work. Also, the films obtained by evaporation are not necessarily stoichiometric [21], which leads to some variability in the proportions of \ceAlO4, \ceAlO5, and \ceAlO6 polyhedra.
V Conclusions
In this paper, we investigate the vibrational spectra, IR and VDOS spectra, in am-\ceAl2O3 by means of first-principles calculations and experimental measurements. We validate our numerical results by carrying out a critical comparison of our calculated vibrational spectra with two sets of experimental data for the dielectric function of am-\ceAl2O3, taken from the literature [21] and measured in this work. In particular, the comparison between the latter data set and the dielectric function obtained through ab initio calculations results in an improved agreement with respect to the data reported by Eriksson et al. [21].
We show that the main features of the spectrum peaking at 360–380 cm -1 and 600–630 cm-1 arise from the motions of threefold coordinated O atoms, which form the vast majority of O atoms in am-\ceAl2O3. By using an atomic decomposition analysis, we show that the oxygen motions at 370 cm-1 occur along a direction normal to the plane defined by the three Al nearest neighbors, i.e. out-of-plane O motions. At frequencies above 500 cm-1, Al-O stretching vibrations, which for threefold coordinated O atoms correspond to in-plane motions, occur and underlie the broad band peaking at 600–630 cm-1. Al atoms and fourfold coordinated O atoms give a fairly uniform contribution to the VDOS and spectra in the frequency range of 300–700 cm-1 without manifesting specific features. Essentially, by conducting this comprehensive analysis we disclaim earlier hypotheses that relate the observed vibrational modes from 200 to 400 cm-1 in am-\ceAl2O3 to stretching vibrational modes in \ceAlOn (, 5 and 6) polyhedra.
Finally, we demonstrate that the IR spectrum can be successfully modeled by assuming isotropic Born charges for Al atoms and fourfold coordinated O atoms, while in the case of threefold coordinated O atoms, the anisotropy of the Born charges can well be captured through the use of only two extra parameters in the local reference frame.
The scope of the proposed Born charges model is quite wide, which allows modeling the spectra of much larger models compared to ab initio ones, since it allows for a direct calculation of IR spectra requiring only the atomic configuration, vibrational modes, and frequencies, e.g. obtained by using classical MD simulations.
Acknowledgements.
L.G. and A.M. acknowledge financing of the Slovenian Research Agency (ARRS) through the Research Core Funding No. P2-0412. A.M. also acknowledges ARRS support through Project No. J2-2498, and L.G. acknowledges support through the CEA-ARRS Project No. 0018. Y.L. acknowledges the financial support from the National Natural Science Foundation of China (22279013, 21872019). N.S.S. acknowledges support from the French government (ANR) through the national program Investments for the Future, Grant No. ANR-11-LABX022-01 (LabEx MMCD project). We acknowledge Prof. H. Momida for providing us with models of Ref. 27. We acknowledge EPFL for providing access to hpc facilities at EPFL (SCITAS) and I. Jerman from National Institute of Chemistry (Slovenia) for recording IR spectra. L.G. acknowledges Dr. Nicolas Salles (CNR-IOM) for providing a -alumina supercell, J. Kurtović for test calculations and Prof. S. de Gironcoli (SISSA) for computational resources at CINECA and useful discussions.References
- Hung et al. [2022] C.-C. Hung, L. Yu, N. Foroozani, S. Fritz, D. Gerthsen, and K. D. Osborn, Probing hundreds of individual quantum defects in polycrystalline and amorphous alumina, Phys. Rev. Applied 17, 034025 (2022).
- Scott et al. [2018] E. A. Scott, J. T. Gaskins, S. W. King, and P. E. Hopkins, Thermal conductivity and thermal boundary resistance of atomic layer deposited high-k dielectric aluminum oxide, hafnium oxide, and titanium oxide thin films on silicon, APL Materials 6, 058302 (2018).
- Reuna et al. [2021] J. Reuna, A. Aho, R. Isoaho, M. Raappana, T. Aho, E. Anttola, A. Hietalahti, A. Tukiainen, and M. Guina, Use of nanostructured alumina thin films in multilayer anti-reflective coatings, Nanotechnology 32, 215602 (2021).
- García Ferré et al. [2016] F. García Ferré, A. Mairov, L. Ceseracciu, Y. Serruys, P. Trocellier, C. Baumier, O. Kaïtasov, R. Brescia, D. Gastaldi, P. Vena, M. G. Beghi, L. Beck, K. Sridharan, and F. Di Fonzo, Radiation endurance in Al2O3 nanoceramics, Scientific Reports 6, 1 (2016).
- Robertson and Falabretti [2006] J. Robertson and B. Falabretti, Band offsets of high gate oxides on III-V semiconductors, Journal of Applied Physics 100, 014111 (2006).
- Zhao et al. [2022] Z. Zhao, D. Xiao, K. Chen, R. Wang, L. Liang, Z. Liu, I. Hung, Z. Gan, and G. Hou, Nature of five-coordinated Al in -\ceAl2O3 revealed by ultra-high-field solid-state NMR, ACS Central Science 8, 795 (2022).
- Mavrič et al. [2019] A. Mavrič, M. Valant, C. Cui, and Z. M. Wang, Advanced applications of amorphous alumina: From nano to bulk, Journal of Non-Crystalline Solids 521, 119493 (2019).
- Fukuhara et al. [2018] M. Fukuhara, T. Kuroda, F. Hasegawa, T. Hashida, E. Kwon, and K. Konno, Amorphous aluminum-oxide supercapacitors, EPL (Europhysics Letters) 123, 58004 (2018).
- Zaborowska et al. [2021] A. Zaborowska, M. Clozel, E. Olivier, J. O’Connell, M. Vanazzi, F. Di Fonzo, A. Azarov, I. Jóźwik, M. Frelek-Kozak, R. Diduszko, J. H. Neethling, and J. Jagielski, Absolute radiation tolerance of amorphous alumina coatings at room temperature, Ceramics International 47, 34740 (2021).
- Valant et al. [2016] M. Valant, U. Luin, M. Fanetti, A. Mavrič, K. Vyshniakova, Z. Siketić, and M. Kalin, Fully transparent nanocomposite coating with an amorphous alumina matrix and exceptional wear and scratch resistance, Advanced Functional Materials 26, 4362 (2016).
- Harper et al. [2023] A. F. Harper, K. Iwanowski, M. C. Payne, and M. Simoncelli, Vibrational and thermal properties of amorphous alumina from first principles (2023), arXiv:2303.08637 [cond-mat.mtrl-sci] .
- Lee et al. [2010] S. K. Lee, S. Y. Park, Y. S. Yi, and J. Moon, Structure and disorder in amorphous alumina thin films: Insights from high-resolution solid-state NMR, The Journal of Physical Chemistry C 114, 13890 (2010).
- Lee et al. [2009] S. K. Lee, S. B. Lee, S. Y. Park, Y. S. Yi, and C. W. Ahn, Structure of amorphous aluminum oxide, Physical Review Letters 103, 095501 (2009).
- Kim et al. [2014] N. Kim, R. Bassiri, M. M. Fejer, and J. F. Stebbins, The structure of ion beam sputtered amorphous alumina films and effects of zn doping: High-resolution 27al nmr, Journal of Non-Crystalline Solids 405, 1 (2014).
- Lizárraga et al. [2011] R. Lizárraga, E. Holmström, S. C. Parker, and C. Arrouvel, Structural characterization of amorphous alumina and its polymorphs from first-principles XPS and NMR calculations, Physical Review B 83, 094201 (2011).
- Nakamura et al. [2013] R. Nakamura, M. Ishimaru, H. Yasuda, and H. Nakajima, Atomic rearrangements in amorphous \ceAl2O3 under electron-beam irradiation, Journal of Applied Physics 113, 064312 (2013).
- Lee and Ryu [2018] S. K. Lee and S. Ryu, Probing of triply coordinated oxygen in amorphous \ceAl2O3, The Journal of Physical Chemistry Letters 9, 150 (2018).
- Shi et al. [2019] C. Shi, O. L. Alderman, D. Berman, J. Du, J. Neuefeind, A. Tamalonis, J. R. Weber, J. You, and C. J. Benmore, The structure of amorphous and deeply supercooled liquid alumina, Frontiers in Materials 6, 38 (2019).
- Hashimoto et al. [2022] H. Hashimoto, Y. Onodera, S. Tahara, S. Kohara, K. Yazawa, H. Segawa, M. Murakami, and K. Ohara, Structure of alumina glass, Scientific Reports 12, 1 (2022).
- Cortie et al. [2020] D. L. Cortie, M. J. Cyster, T. A. Ablott, C. Richardson, J. S. Smith, G. N. Iles, X. L. Wang, D. R. G. Mitchell, R. A. Mole, N. R. de Souza, D. H. Yu, and J. H. Cole, Boson peak in ultrathin alumina layers investigated with neutron spectroscopy, Phys. Rev. Research 2, 023320 (2020).
- Eriksson et al. [1981] T. Eriksson, A. Hjortsberg, G. Niklasson, and C.-G. Granqvist, Infrared optical properties of evaporated alumina films, Applied Optics 20, 2742 (1981).
- Ohwaki and Onishi [1999] T. Ohwaki and T. Onishi, Infrared absorption at longitudinal optical frequency in amorphous oxides and their mixtures, Japanese Journal of Applied Physics 38, L1191 (1999).
- Maruyama and Arai [1992] T. Maruyama and S. Arai, Aluminum oxide thin films prepared by chemical vapor deposition from aluminum acetylacetonate, Applied Physics Letters 60, 322 (1992).
- Chu et al. [1988] Y. Chu, J. Bates, C. White, and G. Farlow, Optical dielectric functions for amorphous Al2O3 and -Al2O3, Journal of Applied Physics 64, 3727 (1988).
- Orosco and Coimbra [2018] J. Orosco and C. Coimbra, Optical response of thin amorphous films to infrared radiation, Physical Review B 97, 094301 (2018).
- Li et al. [2020a] Z. Li, P. R. Wray, M. P. Su, Q. Tu, H. P. Andaraarachchi, Y. J. Jeong, H. A. Atwater, and U. R. Kortshagen, Aluminum oxide nanoparticle films deposited from a nonthermal plasma: Synthesis, characterization, and crystallization, ACS Omega 5, 24754 (2020a).
- Momida et al. [2006] H. Momida, T. Hamada, Y. Takagi, T. Yamamoto, T. Uda, and T. Ohno, Theoretical study on dielectric response of amorphous alumina, Physical Review B 73, 054108 (2006).
- Vashishta et al. [2008] P. Vashishta, R. K. Kalia, A. Nakano, and J. P. Rino, Interaction potentials for alumina and molecular dynamics simulations of amorphous and liquid alumina, Journal of Applied Physics 103, 083504 (2008).
- Gutiérrez et al. [2010] G. Gutiérrez, E. Menéndez-Proupin, C. Loyola, J. Peralta, and S. Davis, Computer simulation study of amorphous compounds: Structural and vibrational properties, Journal of Materials Science 45, 5124 (2010).
- Li et al. [2020b] W. Li, Y. Ando, and S. Watanabe, Effects of density and composition on the properties of amorphous alumina: A high-dimensional neural network potential study, The Journal of Chemical Physics 153, 164119 (2020b).
- Begemann et al. [1997] B. Begemann, J. Dorschner, T. Henning, H. Mutschke, J. Gürtler, C. Kömpe, and R. Nass, Aluminum oxide and the opacity of oxygen-rich circumstellar dust in the 12-17 micron range, The Astrophysical Journal 476, 199 (1997).
- Kübler [1991] W. Kübler, Properties of \ceAl2O3 thin films prepared by ion-assisted evaporation, Thin Solid Films 199, 247 (1991).
- Eisele [1975] K. M. Eisele, Charge storage and stoichiometry in electron beam evaporated alumina, Journal of The Electrochemical Society 122, 148 (1975).
- Shamala et al. [2004] K. Shamala, L. Murthy, and K. N. Rao, Studies on optical and dielectric properties of \ceAl2O3 thin films prepared by electron beam evaporation and spray pyrolysis method, Materials Science and Engineering: B 106, 269 (2004).
- Mikhaelashvili et al. [1998] V. Mikhaelashvili, Y. Betzer, I. Prudnikov, M. Orenstein, D. Ritter, and G. Eisenstein, Electrical characteristics of metal-dielectric-metal and metal-dielectric-semiconductor structures based on electron beam evaporated \ceY2O3, \ceTa2O5 and \ceA2O3 thin film, Journal of Applied Physics 84, 6747 (1998).
- Perdew et al. [1996] J. P. Perdew, K. Burke, and M. Ernzerhof, Generalized gradient approximation made simple, Physical Review Letters 77, 3865 (1996).
- [37] We used the pseudopotential files o.pbe-mt.upf, al.pbe-rrkj.upf as available from the qe website http://www.quantum-espresso.org.
- [38] For the purposes of the present work, which are the description of the local mode symmetry and clarification the origin of the main ir bands, frequency shifts (10 cm-1) related to the choice of the exchange-correlation functional [80] are minor issues not affecting the conclusion of the present paper.
- Colleoni et al. [2015] D. Colleoni, G. Miceli, and A. Pasquarello, Band alignment and chemical bonding at the \ceGaAs/Al2O3 interface: A hybrid functional study, Applied Physics Letters 107, 211601 (2015).
- Giannozzi et al. [2009] P. Giannozzi, S. Baroni, N. Bonini, M. Calandra, R. Car, C. Cavazzoni, D. Ceresoli, G. L. Chiarotti, M. Cococcioni, I. Dabo, A. Dal Corso, S. de Gironcoli, S. Fabris, G. Fratesi, R. Gebauer, U. Gerstmann, C. Gougoussis, A. Kokalj, M. Lazzeri, L. Martin-Samos, N. Marzari, F. Mauri, R. Mazzarello, S. Paolini, A. Pasquarello, L. Paulatto, C. Sbraccia, S. Scandolo, G. Sclauzero, A. P. Seitsonen, A. Smogunov, P. Umari, and R. M. Wentzcovitch, QUANTUM ESPRESSO: a modular and open-source software project for quantum simulations of materials, Journal of Physics: Condensed Matter 21, 395502 (2009).
- Lamparter and Kniep [1997] P. Lamparter and R. Kniep, Structure of amorphous \ceAl2O3, Physica B: Condensed Matter 234, 405 (1997).
- [42] Z. Guo, F. Ambrosio, and A. Pasquarello, Oxygen defects in amorphous \ceAl2O3, Materials Cloud Archive 2019.0026/v1 (2019).
- Matsui [1996] M. Matsui, Molecular dynamics study of the structures and bulk moduli of crystals in the system \ceCaO-MgO-Al2O3-SiO2, Physics and Chemistry of Minerals 23, 345 (1996).
- Momida et al. [2007] H. Momida, T. Hamada, and T. Ohno, First-principles study of dielectric properties of amorphous high-k materials, Japanese Journal of Applied Physics 46, 3255 (2007).
- Willems et al. [2012] T. F. Willems, C. H. Rycroft, M. Kazi, J. C. Meza, and M. Haranczyk, Algorithms and tools for high-throughput geometry-based analysis of crystalline porous materials, Microporous and Mesoporous Materials 149, 134 (2012).
- Hung and Vinh [2006] P. Hung and L. Vinh, Local microstructure of liquid and amorphous \ceAl2O3, Journal of Non-Crystalline Solids 352, 5531 (2006).
- [47] See Supplemental Material at http://link.aps.org/supplemental/10.1103/PhysRevMaterials.7.045604 for further details on thin film characterization, and on the calculation of IR active modes in -alumina and of participation ratio in am-\ceAl2O3. For convenience of the reader the stand-alone pdf file has been included at the end of the present manuscript.
- Al-Abadleh and Grassian [2003] H. A. Al-Abadleh and V. Grassian, FT-IR study of water adsorption on aluminum oxide surfaces, Langmuir 19, 341 (2003).
- Gerakines and Hudson [2020] P. A. Gerakines and R. L. Hudson, A modified algorithm and open-source computational package for the determination of infrared optical constants relevant to astrophysics, The Astrophysical Journal 901, 52 (2020).
- [50] The first-principles relaxation of models ii and iii with PBE, as compared to the original LDA configurations from Momida [27] (and named there as model g and model h, respectively), shows a tendency to slightly increase the number of fivefold and sixfold coordinated Al atoms and of the number of fourfold coordinated O atoms by decreasing the number of fourfold coordinated Al atoms and twofold O atoms.
- Cui et al. [2018] J. Cui, M. G. Kast, B. A. Hammann, Y. Afriyie, K. N. Woods, P. N. Plassmeyer, C. K. Perkins, Z. L. Ma, D. A. Keszler, C. J. Page, S. W. Boettcher, and S. E. Hayes, Aluminum oxide thin films from aqueous solutions: Insights from solid-state nmr and dielectric response, Chemistry of Materials 30, 7456 (2018).
- Lee and Ahn [2014] S. K. Lee and C. W. Ahn, Probing of 2 dimensional confinement-induced structural transitions in amorphous oxide thin film, Scientific reports 4, 1 (2014).
- Kokalj [1999] A. Kokalj, XCrySDen—a new program for displaying crystalline structures and electron densities, Journal of Molecular Graphics and Modelling 17, 176 (1999).
- Bell and Dean [1972] R. J. Bell and P. Dean, The structure of vitreous silica: Validity of the random network theory, Philosophical Magazine 25, 1381 (1972).
- Shcheblanov et al. [2019] N. Shcheblanov, L. Giacomazzi, M. Povarnitsyn, S. Kohara, L. Martin-Samos, G. Mountjoy, R. Newport, R. Haworth, N. Richard, and N. Ollier, Vibrational and structural properties of \ceP2O5 glass: Advances from a combined modeling approach, Physical Review B 100, 134309 (2019).
- Thorpe and De Leeuw [1986] M. F. Thorpe and S. W. De Leeuw, Coulomb effects in disordered solids, Physical Review B 33, 8490 (1986).
- Pasquarello and Car [1997] A. Pasquarello and R. Car, Dynamical charge tensors and infrared spectrum of amorphous \ceSiO2, Physical Review Letters 79, 1766 (1997).
- Povarnitsyn et al. [2020] M. Povarnitsyn, N. Shcheblanov, D. Ivanov, V. Y. Timoshenko, and S. Klimentov, Vibrational analysis of silicon nanoparticles using simulation and decomposition of raman spectra, Phys. Rev. Applied 14, 014067 (2020).
- Umari and Pasquarello [2005] P. Umari and A. Pasquarello, Infrared and raman spectra of disordered materials from first principles, Diamond and Related Materials 14, 1255 (2005).
- Lee et al. [1995] S.-M. Lee, D. G. Cahill, and T. H. Allen, Thermal conductivity of sputtered oxide films, Physical Review B 52, 253 (1995).
- Segda et al. [2001] B. Segda, M. Jacquet, and J. Besse, Elaboration, characterization and dielectric properties study of amorphous alumina thin films deposited by r.f. magnetron sputtering, Vacuum 62, 27 (2001).
- Gusev et al. [2001] E. Gusev, E. Cartier, D. Buchanan, M. Gribelyuk, M. Copel, H. Okorn-Schmidt, and C. D’emic, Ultrathin high-k metal oxides on silicon: processing, characterization and integration issues, Microelectronic Engineering 59, 341 (2001).
- Aguilar-Gama et al. [2015] M. T. Aguilar-Gama, E. Ramírez-Morales, Z. Montiel-González, A. Mendoza-Galván, M. Sotelo-Lerma, P. Nair, and H. Hu, Structure and refractive index of thin alumina films grown by atomic layer deposition, Journal of Materials Science: Materials in Electronics 26, 5546 (2015).
- Evangelisti et al. [2017] F. Evangelisti, M. Stiefel, O. Guseva, R. P. Nia, R. Hauert, E. Hack, L. P. Jeurgens, F. Ambrosio, A. Pasquarello, P. Schmutz, and C. Cancellieri, Electronic and structural characterization of barrier-type amorphous aluminium oxide, Electrochimica Acta 224, 503 (2017).
- Parfitt et al. [1995] L. Parfitt, M. Goldiner, J. W. Jones, and G. S. Was, Residual stresses in amorphous alumina films synthesized by ion beam assisted deposition, Journal of Applied Physics 77, 3029 (1995).
- Umari and Pasquarello [2003] P. Umari and A. Pasquarello, Polarizability and dielectric constant in density-functional supercell calculations with discrete k-point samplings, Physical Review B 68, 085114 (2003).
- Eriksson et al. [1982] T. Eriksson, A. Hjortsberg, and C. Granqvist, Solar absorptance and thermal emittance of \ceAl2O3 films on Al: A theoretical assessment, Solar Energy Materials 6, 191 (1982).
- [68] The experimental data of refs. [21, 67] have been digitized using the software Engauge Digitizer v.10.10. for the function, we find peaks positions at 378 and 627 cm-1 with an estimated position error of 2.5 cm-1.
- Giacomazzi and Umari [2009] L. Giacomazzi and P. Umari, First-principles investigation of electronic, structural, and vibrational properties of a-\ceSi3N4, Physical Review B 80, 144201 (2009).
- Galeener and Lucovsky [1976] F. Galeener and G. Lucovsky, Longitudinal optical vibrations in glasses: \ceGeO2 and \ceSiO2, Physical Review Letters 37, 1474 (1976).
- Giacomazzi et al. [2006] L. Giacomazzi, P. Umari, and A. Pasquarello, Vibrational spectra of vitreous germania from first-principles, Physical Review B 74, 155208 (2006).
- Heid et al. [2000] R. Heid, D. Strauch, and K.-P. Bohnen, Ab initio lattice dynamics of sapphire, Physical Review B 61, 8625 (2000).
- Dicks et al. [2019] O. A. Dicks, J. Cottom, A. L. Shluger, and V. V. Afanas’ev, The origin of negative charging in amorphous Al2O3 films: the role of native defects, Nanotechnology 30, 205201 (2019).
- Giacomazzi and Pasquarello [2007] L. Giacomazzi and A. Pasquarello, Vibrational spectra of vitreous SiO2 and vitreous GeO2 from first principles, Journal of Physics: Condensed Matter 19, 415112 (2007).
- Schubert et al. [2000] M. Schubert, T. Tiwald, and C. Herzinger, Infrared dielectric anisotropy and phonon modes of sapphire, Physical Review B 61, 8187 (2000).
- Boumaza et al. [2009] A. Boumaza, L. Favaro, J. Lédion, G. Sattonnay, J. Brubach, P. Berthet, A. Huntz, P. Roy, and R. Tétot, Transition alumina phases induced by heat treatment of boehmite: An X-ray diffraction and infrared spectroscopy study, Journal of Solid State Chemistry 182, 1171 (2009).
- Kao and Wei [2000] H.-C. Kao and W.-C. Wei, Kinetics and microstructural evolution of heterogeneous transformation of -alumina to -alumina, Journal of the American Ceramic Society 83, 362 (2000).
- Dorsey [1968] G. A. Dorsey, Far infrared absorption of hydrous and anhydrous aluminas, Analytical Chemistry 40, 971 (1968).
- Tarte [1967] P. Tarte, Infra-red spectra of inorganic aluminates and characteristic vibrational frequencies of AlO4 tetrahedra and AlO6 octahedra, Spectrochimica Acta Part A: Molecular Spectroscopy 23, 2127 (1967).
- Demichelis et al. [2010] R. Demichelis, B. Civalleri, M. Ferrabone, and R. Dovesi, On the performance of eleven DFT functionals in the description of the vibrational properties of aluminosilicates, International Journal of Quantum Chemistry 110, 406 (2010).
- Giacomazzi et al. [2009] L. Giacomazzi, P. Umari, and A. Pasquarello, Medium-range structure of vitreous SiO2 obtained through first-principles investigation of vibrational spectra, Phys. Rev. B 79, 064202 (2009).
- Tane et al. [2011] M. Tane, S. Nakano, R. Nakamura, H. Ogi, M. Ishimaru, H. Kimizuka, and H. Nakajima, Nanovoid formation by change in amorphous structure through the annealing of amorphous \ceAl2O3 thin films, Acta Materialia 59, 4631 (2011).
- Bennett and Ashley [1965] J. M. Bennett and E. J. Ashley, Infrared reflectance and emittance of silver and gold evaporated in ultrahigh vacuum, Appl. Opt. 4, 221 (1965).
See pages 1, of supplement.pdf See pages 0, of supplement.pdf