LSTM based IoT Device Identification
Abstract
While the use of the Internet of Things is becoming more and more popular, many security vulnerabilities are emerging with the large number of devices being introduced to the market. In this environment, IoT device identification methods provide a preventive security measure as an important factor in identifying these devices and detecting the vulnerabilities they suffer from. In this study, we present a method that identifies devices in the Aalto dataset using Long short-term memory (LSTM).
While the use of the Internet of Things is becoming more and more popular, many security vulnerabilities are emerging with the large number of devices being introduced to the market. In this environment, IoT device identification methods provide a preventive security measure as an important factor in identifying these devices and detecting the vulnerabilities they suffer from. In this study, we present a method that identifies devices in the Aalto dataset using Long short-term memory (LSTM).
Feed-forward ANN models, such as CNNs, are very good at studying static data. However, if there is a sequence relationship between the processed data, a specialized type of ANN has been created to solve it. This model is named RNN [1, 2, 3].
For example, while ANNs are very successful for images, it is preferred to apply RNN to videos. Because the video is actually images that are stacked in a time frame. Examples of sequential / queue dependent data include language processing, audio, video, stock market, weather and network data.
RNN is a type of artificial neural network used to discover various patterns, among which are sequential data. While a normal neural network cell is attached only to the cells in its lower and upper layer, the RNN cell is connected to and interacts with the previous and next neurons in its layer in addition to this bond (see Figure 1) [1, 2, 3].
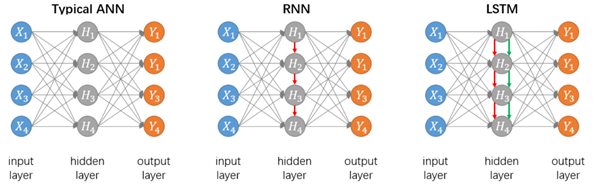
The figure copied from [4].
However, there are some problems in using RNN. Although RNN cells share data and interact with each other, the interaction between the two RNN cells decreases as the distance between them increases. This is called the vanishing gradients problem. Another problem is that RNN uses some kind of sliding window method and therefore the data outside the window is ignored. So, RNN is not successful in long-sequence data due to both lost gradients and limited window size [1, 2, 3].
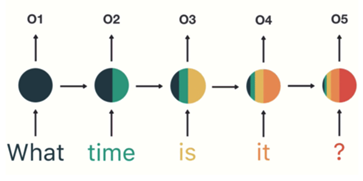
The figure copied from [1].
In Figure 2, a sentence processing scenario is examined. As can be seen in the figure, the interaction of the consecutive cells with each other is high, while the interactions of the cells which is far from each other are low. Also, interaction with the previous/next sentences (if any) cannot be established due to the window size. However, the significance levels of any inputs vary and are often much more complex than a simple order [1, 2].
Various methods have been developed to deal with these negativities. LSTM (Long Short-Term Memory) and GRU (Gated Recurrent Unit) are the most widely used solutions. In both methods, the aim is to ensure that important information is transferred to future cells in a productive way. In other words, if the information is important, it is transferred to the future/next neuron regardless of its location and order. If the information is insignificant, it is forgotten regardless of its location and sequence. The architecture of these methods is shown below (see Figure 3) [1, 2].
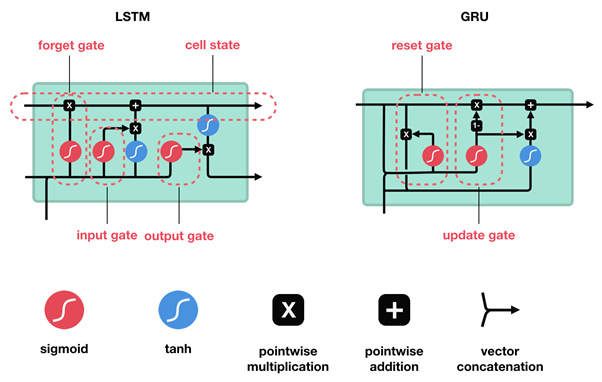
The figure copied from [2].
RNNs that are actively used in sequential data are also promising in the analysis of network flow, which is consecutive network packets. There are many studies in IoT security using this method [5, 6, 7, 8, 9]. For instance, in Lopez-Martin et al.’s study [9], CNN and RNN methods are used to classify IoT network traffic. In the 4.2 RNN Implementation section, this study is described in depth.
RNNs are used extensively in the analysis of sequential data such as video, audio and text. Network behaviours are also formed by the combination of sequential packets, and these packets follow a whole set of rules called ”protocols”. Because of this feature of network behaviour, many researchers have used methods such as RNN and its enhanced versions, LSTM and GRU, in their work [5, 6, 9, 7, 8].
Among these studies, Lopez-Martin et al.’s study [9] is particularly striking. In this study, CNN - RNN methods are used to classify IoT network traffic. In this study, TCP headers are used to obtain input data. For each flow, the first 20 packets are taken, and the six features of these packets are used (the source port, destination port, number of bytes in the packet payload, TCP window size (0 for UDP packets), interarrival time and direction of the packet). In this way, a 6x20 matrix time series is obtained for each network flow.
In our application111The script available at: github.com/kahramankostas/LSTM-based-IoT-Device-Identification, a strategy very similar to this method was followed. Since RNNs are used in the analysis of time series, we created consecutive sets of fingerprints to simulate the fingerprints of the devices into the time series. In the data used, there are 540 sessions in total. These sessions consist of 27 devices each producing 20 sessions.
By taking the first 12 packets of each session, a series of packets is created. The reason for choosing the first 12 packets is that this number creates the lowest limit in the dataset. The device, which produces the least number of network packets, produces 11 packets per session. Actually, this lower limit is 11, but instead of using a prime number like 11, the number 12, which is much more prone to division, was preferred. In this process, a 12th packet consisting of zeros was added to the session containing less than 12 packs. For session larger than 12, the packets after the 12th packet were ignored. Since we created the features using the IoTDevIDv1 [10] feature set, which contains 25 features, 540 matrices of 12X25 size were obtained.
In the learning step, among the many versions of RNN, 4 of them are used, whose names and brief descriptions are given below (see Figure 4 for the representation of architectures).
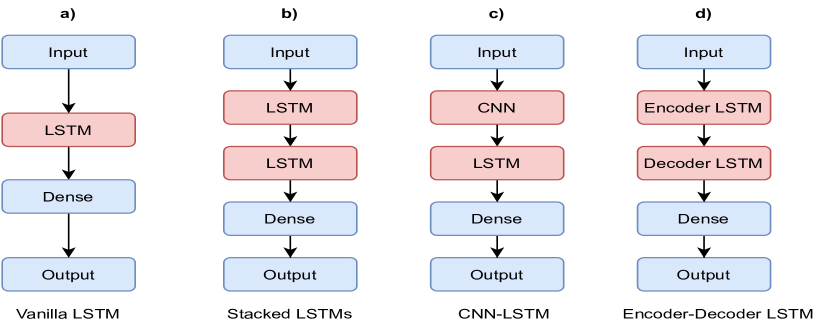
Vanilla LSTM: It is the simplest LSTM application. It consists of only one layer of LSTM [11].
Stacked LSTM:It consists of multiple LSTM layers as hidden layer. It can also be called as deep LSTM [11].
CNN- LSTM: It consists of merging the CNN layer with the LSTM layer in the hidden layer. The CNN layer processes mxn size image / pseudo-image data. The results of this process are used as input in the LSTM layer [11].
Encoder-Decoder LSTM: It is a model consisting of combining two LSTM layers, one encoding and the other decoding. The Encode layer converts the inputs into vectors, and the decoding layer converts the vectors to the predicted output [11].
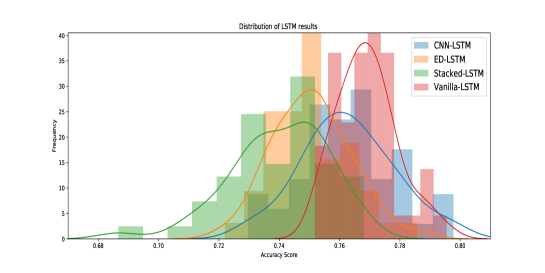
| CNN-LSTM | ED-LSTM | Stacked-LSTM | Vanilla-LSTM | |
| Accuracy | 0.763 | 0.750 | 0.740 | 0.769 |
Table 1 shows the results of the applications of these 4 architectures, and Figure 5 shows the distribution of these results. The results are the average of 50 repeats. All applications exceeded more than 0.70 accuracies, achieving notable success. Among the applications, Vanilla and CNN-LSTM have the highest accuracy, 0.769 and 0.763, respectively. The lowest value is the Stacked LSTM method. Statistical test results are available at Table 2 in Appendix G
References
- [1] M. Nguyen, “Illustrated guide to recurrent neural networks,” 2018. Accessed: 2020-03-20.
- [2] M. Nguyen, “Illustrated guide to lstm’s and gru’s: A step by step explanation,” 2018. Accessed: 2020-03-20.
- [3] C. Olah, “Understanding lstm networks,” 2015. Accessed: 2020-03-20.
- [4] J. Ma, Y. Ding, V. J. Gan, C. Lin, and Z. Wan, “Spatiotemporal prediction of pm2. 5 concentrations at different time granularities using idw-blstm,” IEEE Access, vol. 7, pp. 107897–107907, 2019.
- [5] H. HaddadPajouh, A. Dehghantanha, R. Khayami, and K.-K. R. Choo, “A deep recurrent neural network based approach for internet of things malware threat hunting,” Future Generation Computer Systems, vol. 85, pp. 88–96, 2018.
- [6] N. Koroniotis, N. Moustafa, E. Sitnikova, and B. Turnbull, “Towards the development of realistic botnet dataset in the internet of things for network forensic analytics: Bot-iot dataset,” Future Generation Computer Systems, vol. 100, pp. 779–796, 2019.
- [7] N. Moustafa, B. Turnbull, and K.-K. R. Choo, “An ensemble intrusion detection technique based on proposed statistical flow features for protecting network traffic of internet of things,” IEEE Internet of Things Journal, vol. 6, no. 3, pp. 4815–4830, 2018.
- [8] J. Ortiz, C. Crawford, and F. Le, “Devicemien: network device behavior modeling for identifying unknown iot devices,” in Proceedings of the International Conference on Internet of Things Design and Implementation, pp. 106–117, 2019.
- [9] M. Lopez-Martin, B. Carro, A. Sanchez-Esguevillas, and J. Lloret, “Network traffic classifier with convolutional and recurrent neural networks for internet of things,” IEEE Access, vol. 5, pp. 18042–18050, 2017.
- [10] K. Kostas, M. Just, and M. A. Lones, “IoTDevID: A behaviour-based fingerprinting method for device identification in the IoT,” 2021.
- [11] J. Brownlee, Long Short-term Memory Networks with Python: Develop Sequence Prediction Models with Deep Learning. Machine Learning Mastery, 2017.
Appendix
Appendix G
4.2 RNN Implementation section Statistical test results
| Test | P Value |
|---|---|
| ANOVACNN-LSTM,ED-LSTM,Stacked-LSTM,Vanilla-LSTM | 1.32E-21 |
| Utest (CNN-LSTM, ED-LSTM) | 3.42E-05 |
| Utest (CNN-LSTM, Stacked-LSTM) | 8.02E-10 |
| Utest (CNN-LSTM, Vanilla-LSTM) | 0.007966986 |
| Utest (ED-LSTM, Stacked-LSTM) | 0.00066457 |
| Utest (ED-LSTM, Vanilla-LSTM) | 3.07E-11 |
| Utest (Stacked-LSTM, Vanilla-LSTM) | 1.16E-15 |
The significance level is 0.05 for the ANOVA test and it is 0.0083 for the Mann Whitney U test