CNN based IoT Device Identification
Abstract
While the use of the Internet of Things is becoming more and more popular, many security vulnerabilities are emerging with the large number of devices being introduced to the market. In this environment, IoT device identification methods provide a preventive security measure as an important factor in identifying these devices and detecting the vulnerabilities they suffer from. In this study, we present a method that identifies devices in the Aalto dataset using the convolutional neural network (CNN).
While the use of the Internet of Things is becoming more and more popular, many security vulnerabilities are emerging with the large number of devices being introduced to the market. In this environment, IoT device identification methods provide a preventive security measure as an important factor in identifying these devices and detecting the vulnerabilities they suffer from. In this study, we present a method that identifies devices in the Aalto dataset[1, 2] using the convolutional neural network (CNN) .
The CNN is used in network security or classification of network data, while the network packet information is converted to pseudo-images to present to the algorithm. In this part, it is mentioned how the internet flow is translated into pseudo-pictures. Some of the paths followed in these conversion processes are talk about in the studies below.
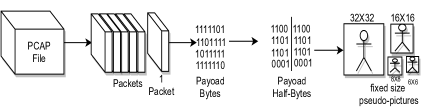
Lim et al. [3] converted the network data into pseudo-images for use on CNN.
For this process, firstly, the payload portion of the network packet was converted to binary
numbers to obtain 4-bit groups (two-part for every byte). These nibbles were converted to
decimal numbers, each of which acted as pixels of a picture. Pseudo-pictures of 36,64,256,1024
pixels were produced according to their size in payloads (Please see Figure 1).
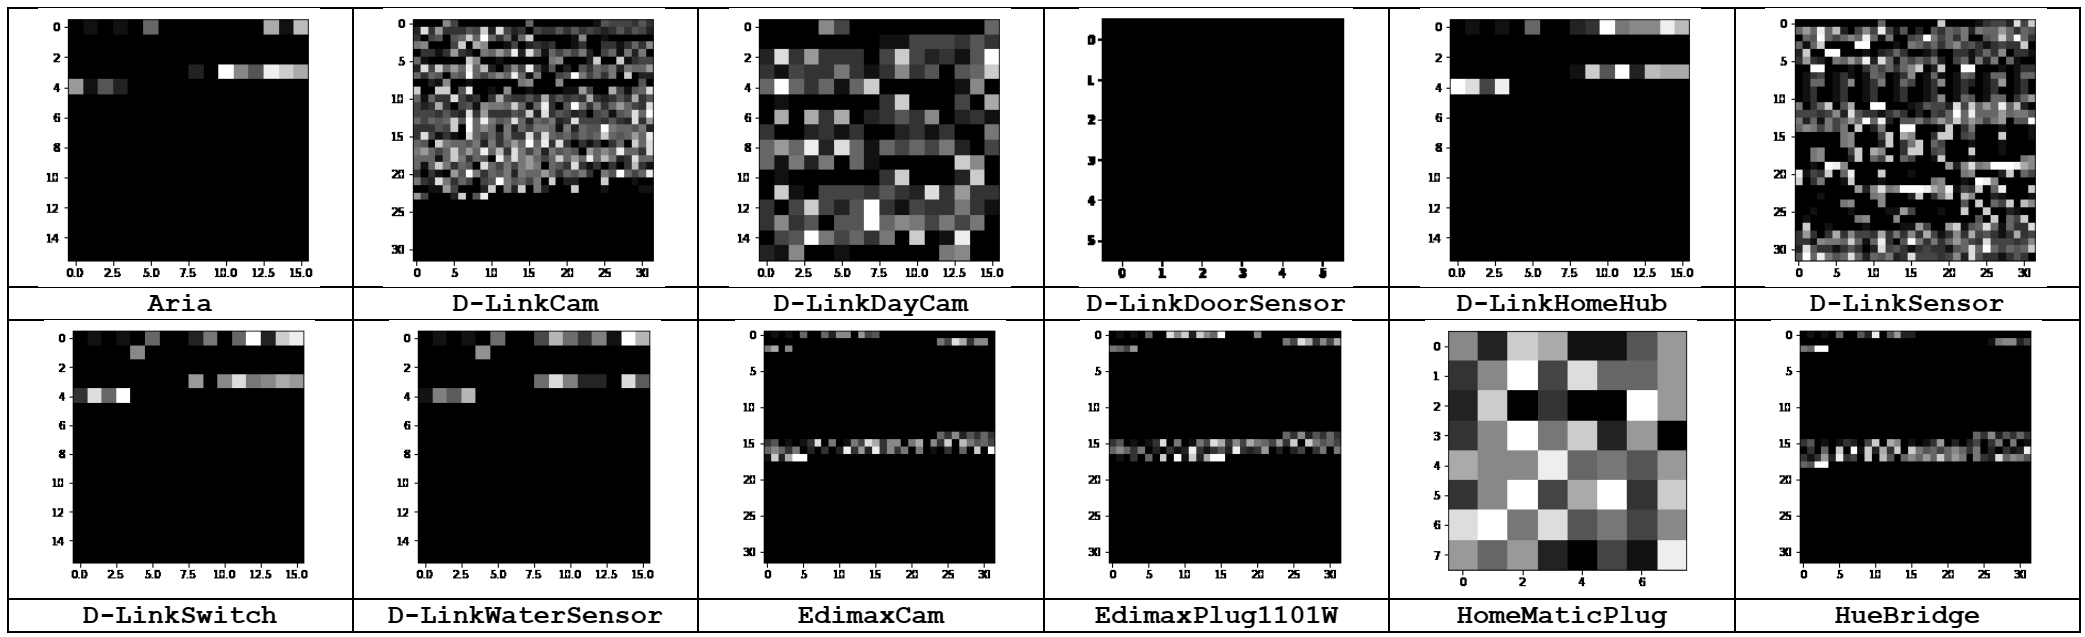
For this operation, the length of the series of numbers to create the image is rounded to the nearest image size (36,64,256 or 1024). For this, the interrupt or 0 padding method is applied. For example, the algorithm adds 26 zeros to a series of 10 numbers to reach the closest length option (36). On the other hand, in a series with a length of 500 numbers, it is ignored by cutting after 256. Some of the pseudo pictures obtained from this process (pictures from the first package for 10 different devices) are shared below (Please see Figure 2).
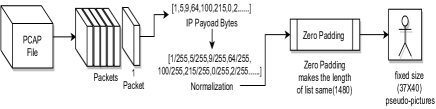
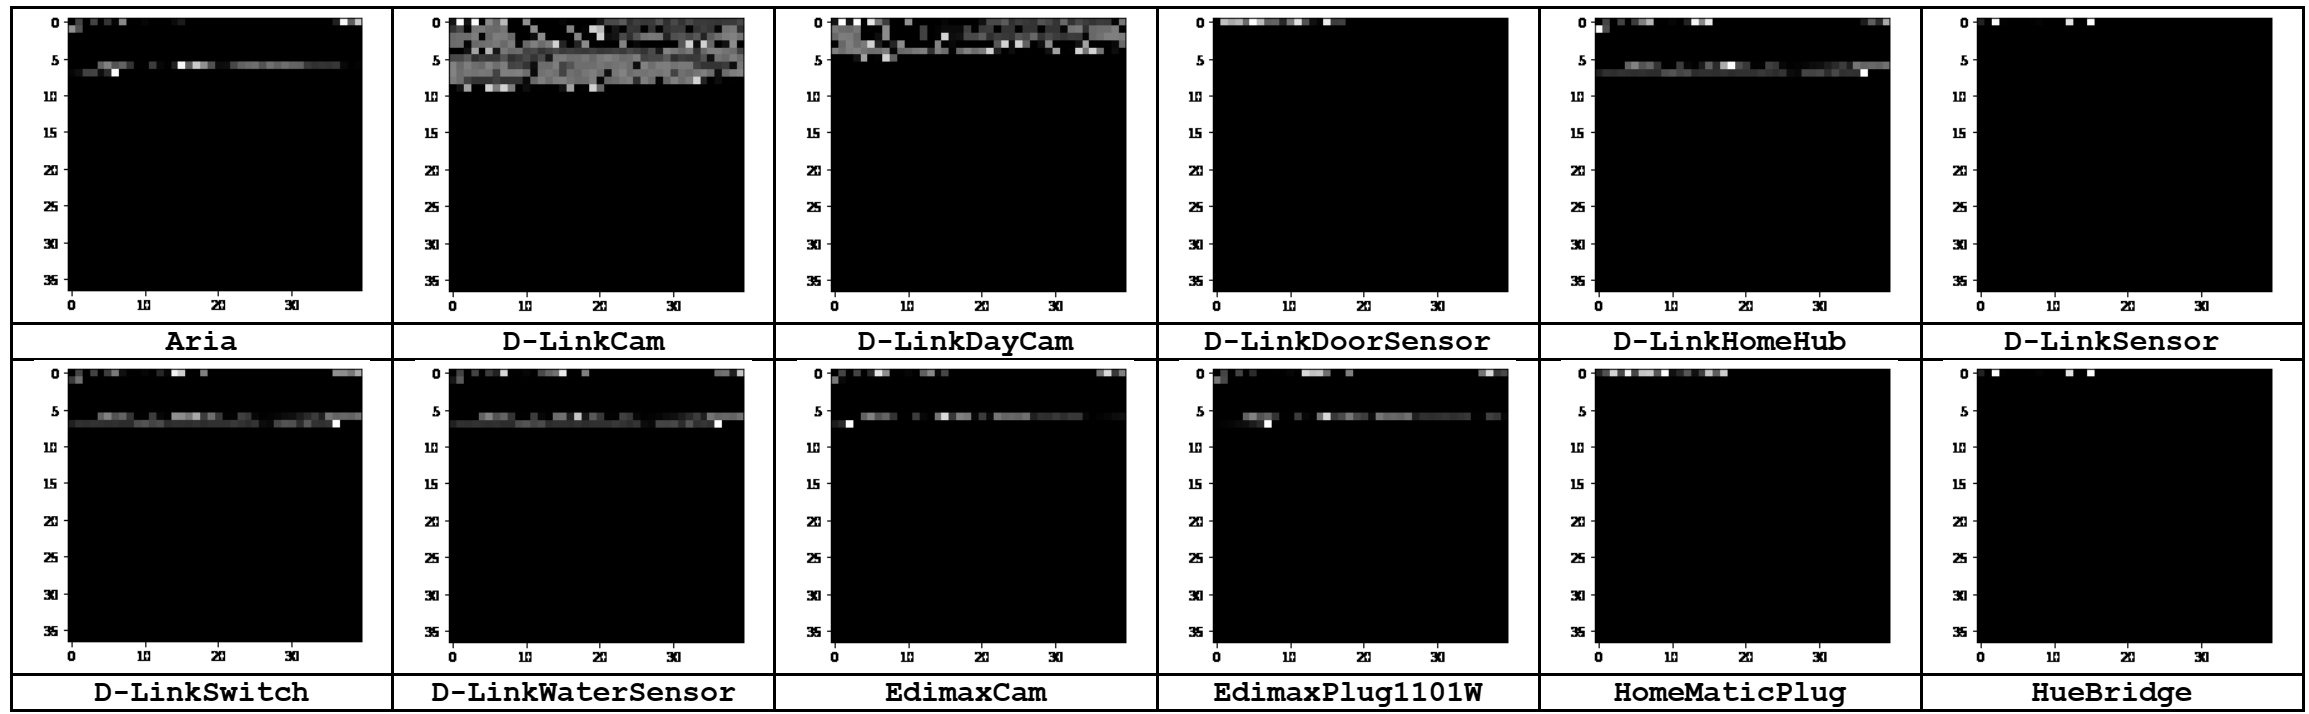
Lotfollahi et al. [4] use pcap files for CNN and SAE. These operations can be listed as follows. The Ethernet header is deleted. Standard packets such as DNS or tree-way handshake packets are deleted because they do not carry payloads and are not effective in determining the class of data. Adding 0 to the end of UDP packets and IP payloads less than 1480 Bytes ensures that all data arrays are the same size. Then normalization is performed by dividing each byte to 255. The result is a pseudo-image of 1480 pixels (37x40). The representation of this operation can be seen from Figure 3.
Some of the pseudo pictures obtained from this process (pictures from the first package for 10 different devices) are shared below (See Figure 4).
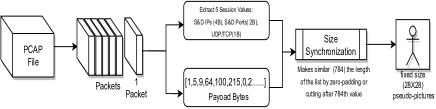
In their study, Wang et al. [5] convert 4 different data groups (Session + All, Session + L7, Flow + All, Flow + L7) to pseudo-pictures of 784 (28 * 28) pixels to be used in CNN. In this process, Session and flow refer to the 5-tuples such as source IP, source port, destination IP, destination port and transport-level protocol. However, while the session is bi-directional, flow is one-way. L7 stands for application layer and ALL stands for all protocol layers. The representation of this operation can be seen from Figure 5.
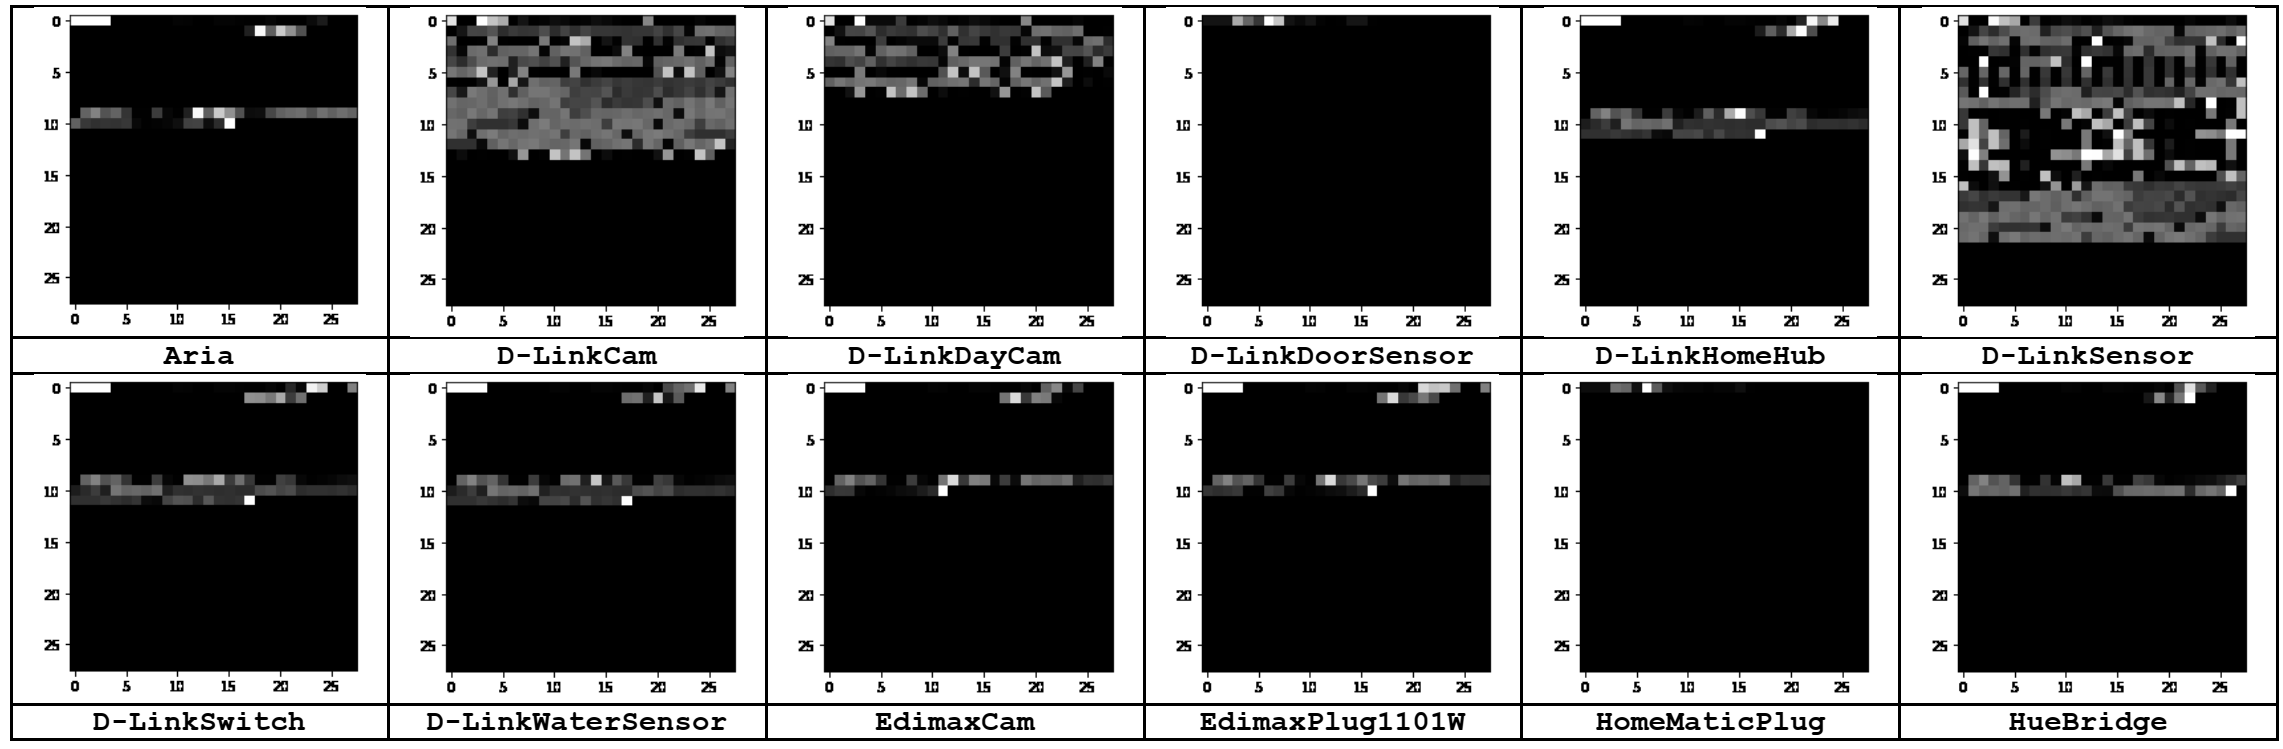
We have performed only one (Session + L7) of these options and shared the methods and results below. The first 13 pixels of the generated image symbolize the session (Source IP:4 Byte, Destination IP:4 Byte, Source Port:2 Byte, Destination Port:2 Byte, UDP/TCP:1 Byte) and the remaining 771 pixels symbolize the payload. Some of the pseudo pictures obtained from this process (pictures from the first package for 10 different devices) are shared below (See Figure 6).
All three of the above-mentioned studies have been done on traditional networks. In the application below, using these methods, devices will be classified through payload from the Pcap file obtained from IoT appliance.
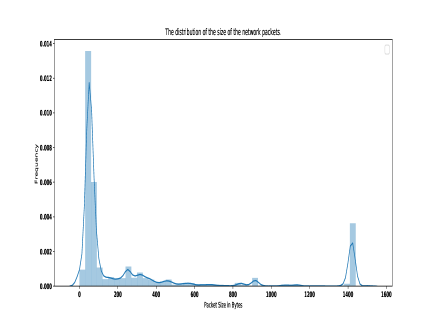
In the approach of Lim et al. [3], It is seen that the data has been put into more than one form, and this approach will require training of different models. However, we preferred to give this data a standard shape and evaluate it with a single model. For this, we chose to get the first 784 bytes like Wang et al. This is because the size of the packets produced by the majority of the network packets produced by the devices ranges from 0 to 800 (Please see Figure 6).
On the other hand, unlike Wang et al. [5], we did not use the features extracted from the layer headers because we see this process as some kind of feature extraction. Whereas with this application, we want to focus on to classify the devices using only the payload.
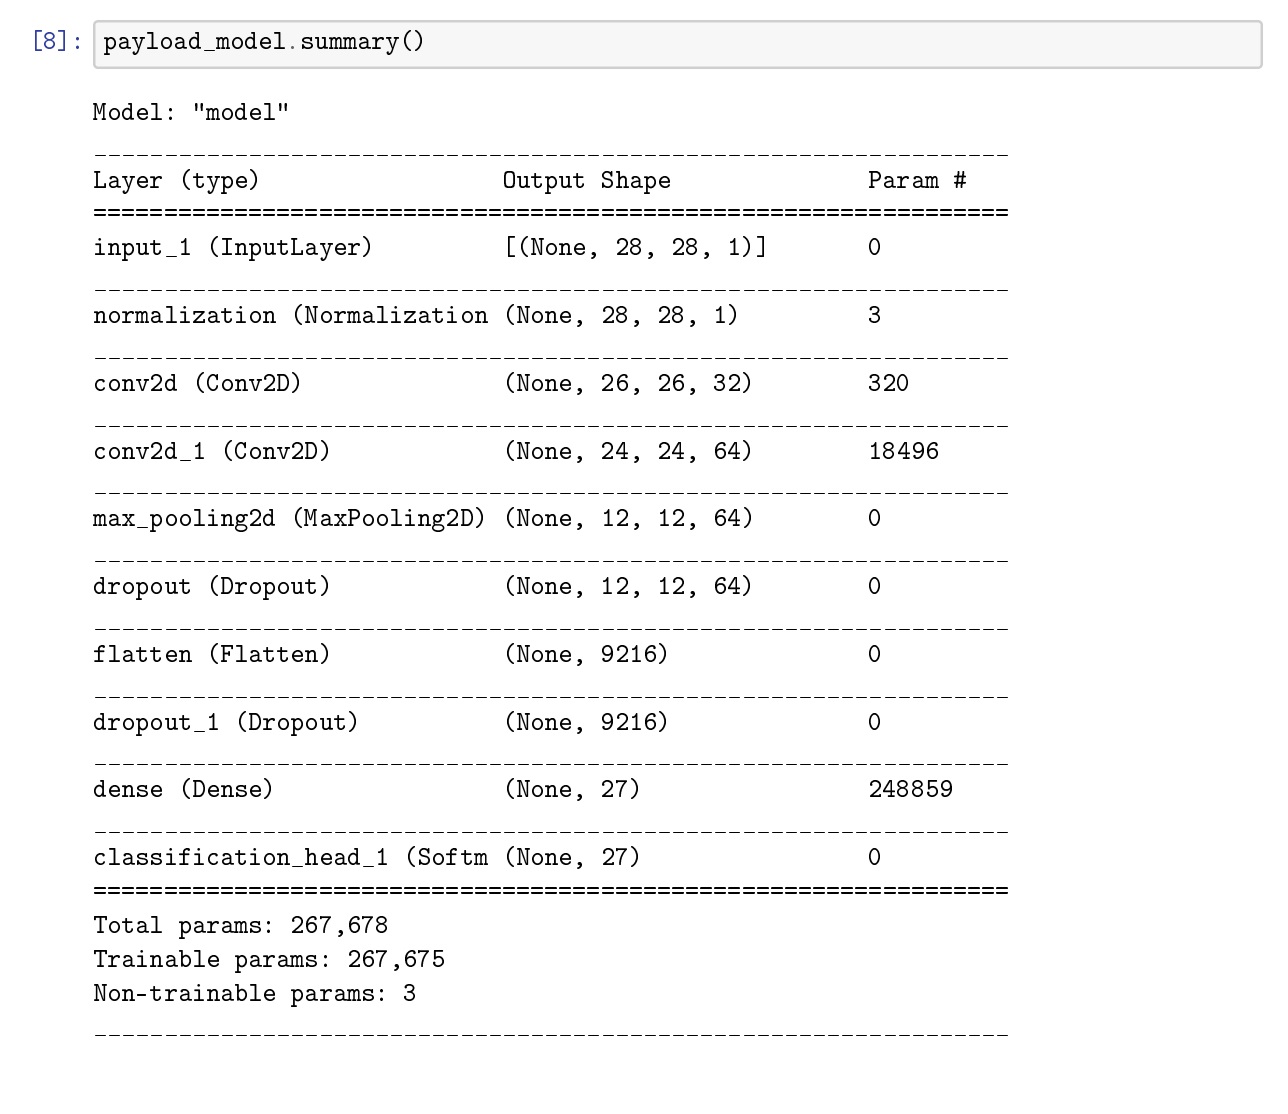
In this step, we will compare the performance of pseudo-images obtained from packet payloads and pseudo-images obtained from the feature sets from IoTDevIDv1 [6] using CNN. The process of creating pseudo-images from payload can be summarized briefly as follows111The script available at: github.com/kahramankostas/CNN-based-IoT-Device-Identification: During this process, all headers of the internet packages are deleted and the data obtained is converted into a two-dimensional matrix (28X28). In this process, packages that do not contain any loads such as 3-handshake packages are ignored. If the package contains more than 784 bytes of data, the excess portion is ignored. However, if the package size contains less than 784 data, it is brought to this size by adding ”0” to the end of the payload. In order to select the optimum hyperparameters of CNNs in these two processes, the ImageClassifier feature of the library named Autokeras[7], which scans parameters in ANNs, is used. Selected parameters and architecture can be seen in Appendix K. The data obtained as a result of this process is given in Table 1 below. It can be seen the distribution of accuracy scores in Figure 8.
| CNN with Payload | CNN with Fingerprint | |
| Accuracy | 0.631 | 0.625 |
| Time (seconds) | 209.926 | 20.809 |
| Utest (CNN with Payload, CNN with Fingerprint) | 5.84e-09 |
The significance level is 0.05 for the Mann Whitney U test.
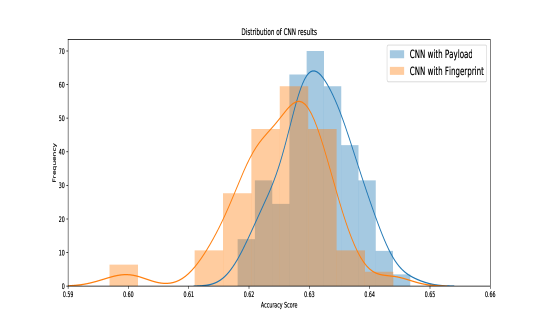
When Table 1 is looked at, it is seen that the results obtained with the fingerprint method are quite close to the results obtained by examining the payloads (accuracy score is approximately 0.006 lower). However, if the speeds of these two methods are compared, it is seen that the fingerprint method is about 10 times faster than the other method.
References
- [1] S. Marchal, “IoT devices captures, aalto university,” 2017. Accessed: 2021-08-25.
- [2] M. Miettinen, S. Marchal, I. Hafeez, N. Asokan, A.-R. Sadeghi, and S. Tarkoma, “Iot sentinel: Automated device-type identification for security enforcement in iot,” in 2017 IEEE 37th International Conference on Distributed Computing Systems (ICDCS), pp. 2177–2184, IEEE, 2017.
- [3] H.-K. Lim, J.-B. Kim, J.-S. Heo, K. Kim, Y.-G. Hong, and Y.-H. Han, “Packet-based network traffic classification using deep learning,” in 2019 International Conference on Artificial Intelligence in Information and Communication (ICAIIC), pp. 046–051, IEEE, 2019.
- [4] M. Lotfollahi, M. J. Siavoshani, R. S. H. Zade, and M. Saberian, “Deep packet: A novel approach for encrypted traffic classification using deep learning,” Soft Computing, vol. 24, no. 3, pp. 1999–2012, 2020.
- [5] W. Wang, M. Zhu, J. Wang, X. Zeng, and Z. Yang, “End-to-end encrypted traffic classification with one-dimensional convolution neural networks,” in 2017 IEEE International Conference on Intelligence and Security Informatics (ISI), pp. 43–48, IEEE, 2017.
- [6] K. Kostas, M. Just, and M. A. Lones, “IoTDevID: A behaviour-based fingerprinting method for device identification in the IoT,” 2021.
- [7] H. Jin, Q. Song, and X. Hu, “Auto-keras: An efficient neural architecture search system,” in Proceedings of the 25th ACM SIGKDD International Conference on Knowledge Discovery & Data Mining, pp. 1946–1956, ACM, 2019.
Appendix
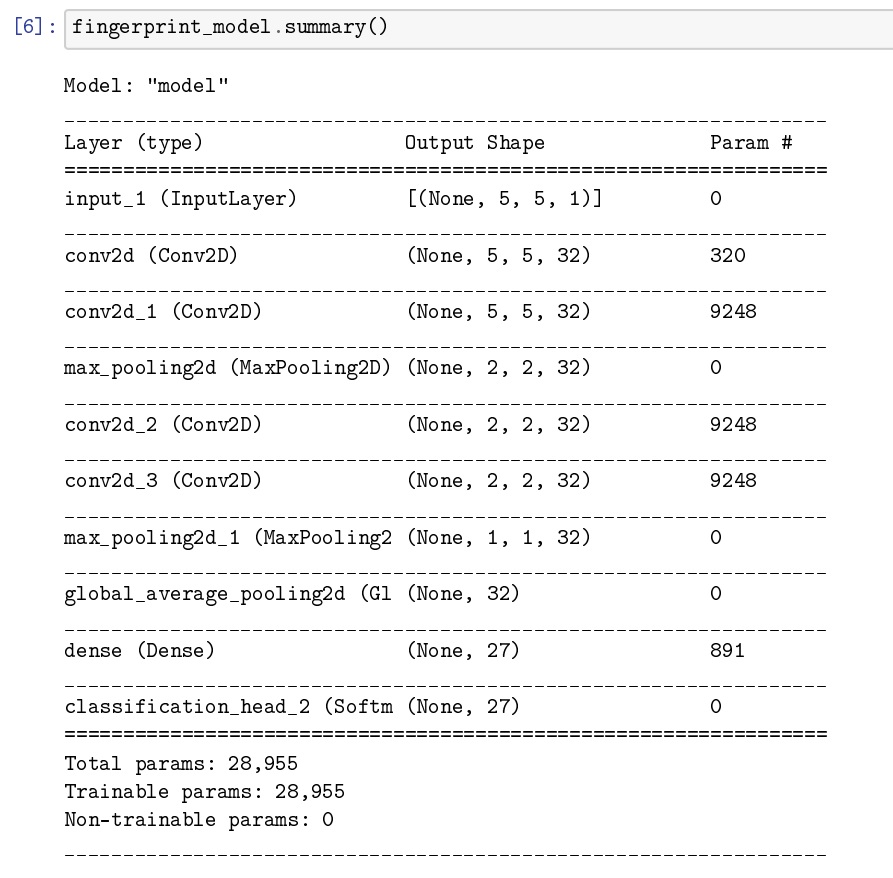
Appendix K-1
CNN Model Architecture for the Fingerprint dataset.
Appendix K-2
CNN Model Architecture for Payload.