Temperature Evolution of Domains and Intradomain Chirality in 1T-TaS2
Abstract
We use scanning tunneling microscopy to study the temperature evolution of the atomic-scale properties of the nearly-commensurate charge density wave (NC-CDW) state of the low-dimensional material, 1T-TaS2. Our measurements at 203 K, 300 K, and 354 K, roughly spanning the temperature range of the NC-CDW state, show that while the average CDW periodicity is temperature independent, domaining and the local evolution of the CDW lattice within a domain is temperature dependent. Further, we characterize the temperature evolution of the displacement field associated with the recently-discovered intradomain chirality of the NC-CDW state by calculating the local rotation vector. Intradomain chirality throughout the NC-CDW phase is likely driven by a strong coupling of the CDW lattice to the atomic lattice.
I
I.1 Introduction
1T-TaS2, is a member of the transition-metal dichalcogenides (TMDs) and has garnered significant interest for the wealth of physics it hosts including multiple charge density wave (CDW) states [1, 2], a reported Mott insulating state [3], and superconductivity [4, 5]. Additional attention has focused on manipulating these states through a variety of means including elemental doping, pressure, thickness, strain, as well as local voltage and light pulses so as to induce transitions from one quantum state to another or to create new orders.[6, 7, 8, 9, 10, 11, 12] In this work, we focus on one of the CDW states hosted by 1T-TaS2, the nearly-commensurate (NC-CDW) phase.
Upon cooling, 1T-TaS2 hosts three CDW states including an incommensurate (IC) phase above 355 K, a nearly-commensurate (NC) phase between 180 K and 355 K, and a commensurate (C) phase below 180 K.[2] Within the IC-CDW state, the CDW lattice is hexagonal with a periodicity of 3.55 and zero rotation relative to the atomic lattice.[13] In the low-temperature C-CDW state, the CDW lattice is a commensurate a0a0 supermodulation which is rotated 13.9° relative to the atomic lattice.[14]
The NC-CDW phase is a bridge between the IC- and C-CDW states and has an average CDW lattice periodicity of 11.75 Å and average CDW lattice rotation of 11-13°, depending on the temperature, relative to the atomic lattice.[14, 2] The NC-CDW state is typically described as comprised of hexagonally-ordered domains within which there is a C-CDW state separated by domain walls characterized by discommensurations or an incommensurate CDW network.[9, 15, 16, 17, 18, 19] Such typical descriptions imply that the CDW lattice within a domain in the NC-CDW state is equivalent to that of the low temperature C-CDW state. However, recent work at 300 K [20] indicates that the CDW lattice within domains is not equivalent to that of the low-temperature C-CDW state. Rather, instead of a uniform C-CDW state within a domain, there is a continual evolution of the CDW lattice from domain center to domain wall. The CDW lattice parameter and angle relative to the atomic lattice at a domain center is close to that of the low-temperature C-CDW state, but evolves toward the domain wall. One goal of the current work is to understand the CDW lattice within domain and domain walls particularly near the temperature limits of the NC-CDW state.
Making the NC-CDW state of even further interest, the NC-CDW state has recently been reported to have a chiral CDW domain structure.[20] A select few chiral CDW states among TMDs have been previously reported including in 1T-TiSe2 [21] as well as for a specific Ti-doping of 1T-TaS2, [22]. In these compounds, the chiral CDW states are believed to originate from orbital ordering [22, 23]. Within undoped 1T-TaS2, the NC-CDW state has one chirality which is a simple in-plane mirror symmetry breaking which occurs when the CDW lattice rotates relative to the atomic lattice on cooling from the IC to the NC-CDW phase.[18] More recently, measurements at 300 K show that the NC-CDW state has a second chirality of separate origin, an intradomain chirality, which is suggested to originate from the strong coupling of an incommensurate CDW state to the atomic lattice.[20] A second goal of the current work is to extend studies of this intradomain chirality to the temperature limits of NC-CDW state.
I.2 CDW Lattice Domain Evolution
In our previous work we detailed the atomic-scale characteristics of the CDW lattice in the NC-CDW state at 300 K.[20] Here we build upon this initial work and extend it to near the temperature limits of the NC-CDW phase so as to detail and understand the evolution of the CDW lattice throughout this phase. Figure 1a shows a topographic image of the NC-CDW state we acquired at 300 K. Atomic and CDW periodicities as well as domaining are clearly visible by eye. The wavevectors associated with each of the periodicities can be extracted from the FFT of the topography (Figure 1b).
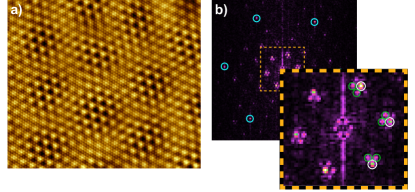
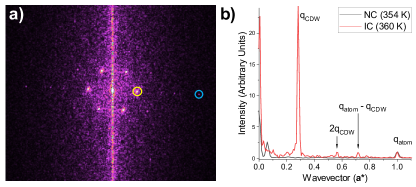
Figure 2 shows the FFTs, zoomed to include only CDW-related signals, of acquired STM topographic images taken at 203 K, 300 K, and 354 K. These three temperatures span the majority of the NC-CDW temperature range (180 K to 355 K). In each FFT, circled in white, is a central CDW peak around which there are satellite peaks (circled in green), standard for the NC-CDW state. Most obvious in the FFTs are the change in the distance of the satellite peak to the central CDW peak with temperature, namely the satellite peaks become closer to the central CDW peak with lower temperature. Since qdomain = qsat – qcdw, this indicates that the domain size grows with decreasing temperature as has been noted in previously.[2]
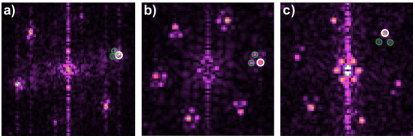
For each of the three temperatures, we extract the central CDW peak wavevector, qcdw, using Gaussian fits to peaks in the FFTs, so as to determine the average CDW lattice periodicity and angle. Similar fits to satellite peaks at each temperature allow us to determine the average domain periodicity and angle relative to that of the atomic lattice. The results are summarized in Table 1. We find that the average CDW periodicity is essentially constant at 11.76 Å over the temperature range, consistent with previous electron diffraction data [14]. The average angle of the CDW lattice with respect to the atomic lattice decreases with increasing temperature (from 12.6° to 10.5°) and has values consistent with both previous electron diffraction and STM measurements.[14, 2] The domain size/periodicity gets smaller (108 Å at 203 K to 57 Å at 354 K) as the temperature increases, consistent with previous STM data [2]. The satellite peak angle (equivalent to the domain lattice angle) with respect to that atomic lattice is close to that of the average CDW angle at 203 K (right above the C-CDW transition) and significantly evolves away from the average CDW angle with increasing temperature.
| 203 K | 300 K | 354K | |
| CDW Periodicity (Å) | 11.75 | 11.76 | 11.75 |
| CDW Angle | +12.6° | +11.8° | +10.5° |
| Domain Periodicity (Å) | 108 | 73 | 57 |
| Domain Angle | +11.8° | +3.2° | -4.3° |
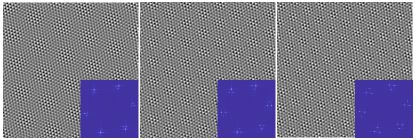
Following our previous work [20], we can use the wavevectors for the atomic peaks, central CDW peaks, and for the two most intense satellite peaks to simulate topographies for each of the three temperatures for further analysis. The simulations allow us to create clean, extended topographies so as to focus on the essential physics contained within the material without the influence of surface or subsurface defects which can otherwise complicate analysis.
Figure 3 shows computer simulated topographies for the CDW lattice (central CDW peaks and two satellite peaks) at each of the three temperatures without the atomic lattice. Note that the simulated images are rotated such that the atomic lattice orientation is identical for each temperature simulation. In addition, in the case of the 354 K, we simulated the equivalent mirror image for consistency with the 203 K and 300 K simulations.
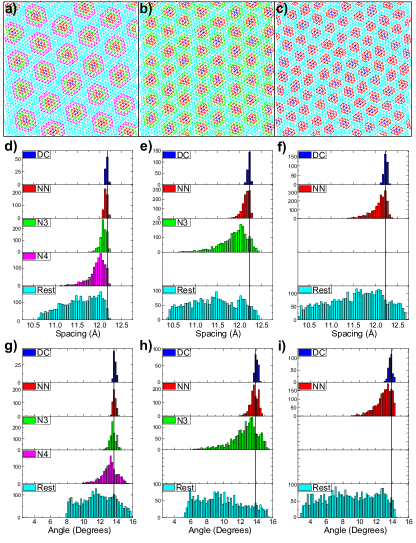
We now examine the general evolution of the CDW lattice from domain center to domain wall. We use intensity thresholding to determine the 3 to 4 most intense CDW maxima within each domain for a simulated topography and use those to define the domain centers. We then draw line segments connecting these domain center CDW maxima and designate these line segments as ’DC’ (seen in blue in Figures 4a-c). Next we find the CDW maxima which are nearest neighbors to those of the domain center. The line segments connecting these CDW maxima to those in the domain center and to each other we designate as NN (in red). We continue this process moving outward from the domain center connecting the next nearest neighbors to the domain center CDWs to the nearest neighbors and to each other (N3 in green) and so on. For a given temperature, domain-associated nearest neighbor line segments stop at the last color which includes no CDW maxima which would connect to two different domains (N4 for 203 K, N3 for 300 K, and NN for 354 K). The remaining CDW maxima comprise those mainly in domain walls. The nearest neighbor connections made from these remaining CDW maxima are colored in cyan and designated as ’Rest’. Together, using the drawn line segments, we can characterize domains from domain center to domain wall. The length of each segment gives the local CDW lattice spacing and the segment slope can be used to determine the local CDW lattice angle relative to that of the atomic lattice. Figure 4 shows histograms which illustrate the progression of the nearest neighbor CDW distances and angles from domain center to domain walls. The statistics are summarized in Table 2.
At a given temperature, the average nearest neighbor CDW distance spacing and angle is largest at the domain center and the width of the distance/angle distributions are narrowest and close to the low-temperature C-CDW values of 12.1 Å and 13.9° [24]. Progressing away from the domain center, the average nearest neighbor distances/angles become smaller and the distributions wider.
Comparing across temperatures, with lower temperatures, as domains get larger, the evolution in nearest neighbor distances/angles from domain center to domain wall is more gradual as compared to higher temperatures. Illustrating this, at 354 K, there is a 2.5 larger change in the average nearest neighbor spacing from DC to NN than at 203 K. Similarly, while there is a 0.9° change in angle from DC to NN at 354 K, there is only a 0.8° change in CDW angle from DC to N4 at 203 K. In addition, the width of each distribution for a given domain location (DC, NN, and N3) becomes narrower with lower temperature. In short, while there continues to be an evolution in the CDW lattice from domain center to domain wall at lower temperatures, the domain is becoming more uniform and closer to the CDW lattice found in the low-temperature C-CDW state.
| Distance (Å) | 203 K | 300 K | 354K |
|---|---|---|---|
| DC | 12.16 0.02 | 12.21 0.03 | 12.23 0.04 |
| NN | 12.14 0.04 | 12.14 0.09 | 12.08 0.18 |
| N3 | 12.09 0.07 | 11.88 0.32 | |
| N4 | 11.94 0.19 | ||
| Rest | 11.55 0.40 | 11.41 0.54 | 11.56 0.62 |
| Domain Average | 11.78 0.40 | 11.76 0.50 | 11.77 0.57 |
| Angle (°) | 203 K | 300 K | 354K |
| DC | 13.8 0.1 | 14.1 0.2 | 13.8 0.2 |
| NN | 13.8 0.2 | 13.8 0.5 | 13.9 1.0 |
| N3 | 13.6 0.4 | 12.5 1.7 | |
| N4 | 13.1 1.0 | ||
| Rest | 11.7 2.1 | 9.8 2.7 | 8.8 3.3 |
| Domain Average | 12.5 1.8 | 11.7 2.6 | 10.5 3.3 |
At higher temperatures, the domains progressively become smaller, and the fraction of the sample which is comprised of the domain walls increases. As a rough estimate of this fraction, we can compare the percentage of nearest neighbor connectors designated as ‘Rest’ at each of the temperatures: 53% at 203 K and 63 at 354 K. The domain walls separating domains have been described as discommensurations or an incommensurate wall network.[11, 17] Since a domained NC-CDW state emerges from the IC-CDW with cooling through the 355 K transition, it is natural to investigate whether there is evidence for the higher-temperature IC-CDW state within the NC-CDW state, possibly within the domain walls. Figure 5 shows the FFT of an STM topography of the IC-CDW state we acquired at 360 K. The FFT shows that, in the IC-CDW state, qCDW is colinear with the atomic lattice and a linecut in the direction of a* reveals a CDW peak at (q = 0.28 a*), consistent with what has been previously reported by x-ray diffraction measurements [13]. A similar linecut through the FFT of NC-CDW state at 354 K (from Figure 2c) in the direction of a*, shows no peak near q = 0.28 a* and no evidence for the presence of the IC-CDW state within the NC-CDW state. Instead of a smooth evolution from the NC-CDW state to the IC-CDW state, there is a sudden shift in qCDW in passing through the transition.
I.3 Chirality
Previously, an intradomain chirality characterizing the NC-CDW state at 300 K was uncovered by examining the displacement field created by examining the shifts of the actual CDW lattice (CDWltc) relative to the average CDW lattice (CDWave).[20] The CDWave lattice is the result of Fourier filtering an STM topography such that only the signals from the central CDW peaks (one of which is designated by a white circle in Figure 1b) are present. This results in a perfect hexagonal lattice incommensurate with the atomic lattice. CDWltc, which is the fully observed CDW lattice with domaining in the topography, can be isolated from an STM topography by Fourier filtering the central CDW peak and surrounding satellite peaks. CDWltc peaks are shifted slightly from CDWave peaks, by an average of 0.72 Å and a maximum displacement of 1.70 Å. Arrows drawn from each CDWave peak location to the nearest CDWltc peak location with a length proportional to the separation creates the displacement field seen in Figure 6a. The intradomain chirality is obvious by eye with a counterclockwise spiral of arrows within each domain. Displacements are smallest at domain centers and continue to increase away from domain centers to domain walls. Computer simulated STM topographies using the signals associated with the central CDW peak and two most intense satellite peaks well recreate this displacement field.[20]
We build on this previous work and extend this to 203 K and 354 K using STM-data-based CDW computer simulated topographies to understand the evolution of the displacement fields across the NC-CDW state of 1T-TaS2. Figures 6b-d show the displacement fields for the three temperatures 203K, 300K, and 354 K. In each, the spiral nature of the displacement field yielding the intradomain chirality is obvious. However, despite the different domain sizes at each of the three temperatures, the average displacement remains essentially constant with average displacements of 0.78 0.31 Å, 0.75 0.30 Å, and 0.75 0.31 Å at 203 K, 300 K, and 354 K respectively.
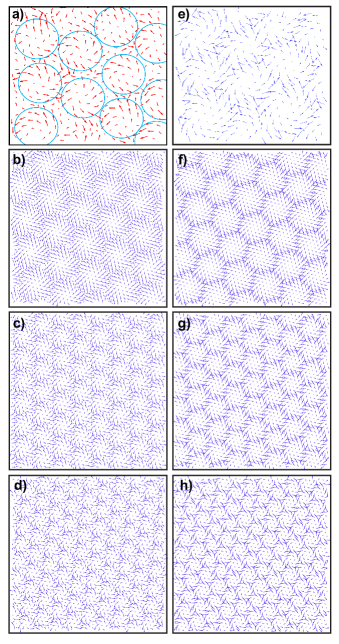
Figures 6e-h show the displacement field resulting from connecting CDWave maxima to the nearest atomic lattice site. Like those in Figures 6a-d, these displacement fields show a spiral-like domain structure with displacements smallest at the center of a domain. The displacement fields in 6e-h represent the displacements of the CDWave in the limit where the CDW lattice has a strong coupling to the atomic lattice with no energy cost for deformation. The striking similarity of these displacement fields strongly suggest that a strong coupling of the CDW lattice to the atomic lattice drives the intradomain chirality. However, there are some differences between the displacement fields. For example, we find that, at a given temperature, the domain size and orientation from the displacement field for CDWave to CDWltc is slightly different from that of CDWave to nearest atomic sites (Table 3). These differences point to additional physics at play. As proposed previously [20], there likely is a competition between CDW lattice coupling and energy gained from the electronic structure. Both CDW-lattice coupling and the electronic structure likely evolve with temperature in ways which require more understanding. Further insight into this competition would benefit from theoretical work, such as using a McMillan-type Landau framework [25, 26] which specifically includes CDW-atomic lattice coupling.
| Domain Size Comparison | Domain Angle | |
|---|---|---|
| (Percent Difference) | ||
| 203 K | 9.6 | -2.4° |
| 300 K | 2.1 | -1.5° |
| 354 K | 14.7 | +3.2° |
We use the curl of the displacement field (twice the rotation vector, the antisymmetric component of the displacement gradient tensor) as a way to visualize chirality and quantify the displacement fields of Figure 6 and their evolution with temperature. We calculate the curl of the displacement field, u, following Stoke’s theorem:
| (1) |
We calculate the curl by calculating the circulation of the displacement field for each group of three CDW lattice sites and dividing by the area of the triangle formed by the three sites as seen in Figure 7. Given the discrete nature of the displacement field we calculate the circulation for the triangle in Figure 7 using:
| (2) |
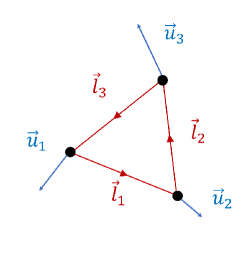
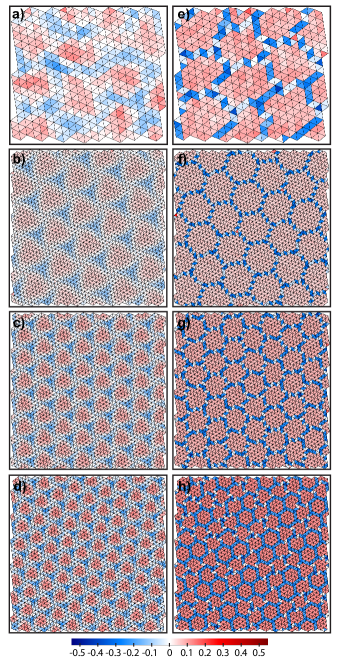
Figure 8a-d shows the curl calculations for the CDWave - CDWltc displacement fields seen in Figure 6a-d. At a given temperature, within a domain, the curl has one sign (we choose positive) and is roughly constant until the domain edge. Within the domain walls, the curl is negative and is largest at the point of convergence of three domains. However, the domains are not C6 rotationally symmetric as one might expect for a hexagonal domain pattern. Rather, the domains have a more triangular shape more in line with C3 rotational symmetry as is most obvious in the 203 K curl diagram. Consistent with this, within the domain wall at the locations where three domains converge of which there are six, three of the locations show a larger magnitude curl (darker blue) than the other three. The average curl across the topographic region is zero. While the domains have one chirality, the domain walls have an opposite chirality. And, while there is local chirality, this does not lead to large-scale chirality (aside from the rotation of the CDW lattice with respect to the atomic lattice) which may explain why only recently this intradomain chirality in 1T-Ta2 was uncovered.
Examining the curl of the CDWave - CDWltc displacement fields with temperature, the magnitude of the curl within a domain, as well as within domain walls, increases with increasing temperature. However, summing the curls for each triangle within a domain together, we find: 2.8 (203 K), 2.1 (300 K), 1.8 (354 K). This indicates that while the curl within a domain decreases with decreasing temperature, the circulation for the entire domain, , increases.
For comparison, we calculate the curl of the CDWave – atomic displacement field (Figures 8e-h). Similar to the curls in Figures 8a-d, the curls of these displacement fields are roughly constant and positive within a domain and have the opposite sign in the domain walls. The magnitude of the curl within a domain, as well as within domain walls, increases with increasing temperature, also consistent with the Figures 8a-d. If we sum the curls for each triangle within a domain, we find: 5.0 (203 K), 3.9 (300 K), 2.7 (354 K). Again we find the overall circulation for a domain increases with decreasing temperature.
Differing from the curl of the CDWave – CDWltc displacement fields, the curls for the CDWave – atomic displacement fields show an abrupt change in the curl sign at the domain walls, the domain walls are thinner, and the domains appear hexagonally-shaped with a roughly C6 rotational symmetry. These differences further emphasize that physics beyond a strong coupling of the CDW to the lattice drives the CDWltc properties in 1T-TaS2.
I.4 Conclusions
In our sub-angstrom characterization of domains across the NC-CDW state of 1T-Ta2, we find that, at any temperature, there is an evolution in the nearest neighbor CDW spacing and angle relative to the lattice from domain center to domain wall. At the center of a domain, the CDW spacing and local angle are close to that of the low temperature C-CDW state. But, as one progresses from the center to the domain wall, the average spacing and local angles decrease, and there is a wider variation in the spacing/angle values.
As the temperature decreases and the domains become larger, there are smaller differences in the distances/angles for DC, NN, N3 line segments. In essence, the domains are becoming more uniform with a higher fraction of distances/angles close to that of the low-temperature C-CDW state. At 354 K, just below the transition to the IC-CDW state, we find no evidence for the presence of the IC-CDW state. Instead, there is a sudden change of qcdw through the first order phase transition from the NC-CDW state at 354 K to the IC-CDW state, most noticeable by the sudden rotation of the wavevector.
The NC-CDW state is characterized by an intradomain chirality. Characterizing the rotation vector for the CDWave – CDWltc displacement field shows that the curl is roughly constant within a domain center and has the opposite sign in the domain walls. Whereas the average displacements for the CDWave – CDWltc displacement field is unchanged with temperature, the curl magnitude within the domains/domain walls increases with temperature. This trend is similar to that of the CDWave – atomic displacement field which is the displacement field which would be found if one were to start with an incommensurate CDW lattice and suddenly turn on coupling to the atomic lattice with no energy cost for distortions. The similarity in trends provides evidence that the formation of chiral domains is strongly related to the coupling of the CDW to the lattice. However, the differences in the displacement fields and curls point to a possible competition between coupling of the CDW to the atomic lattice and energy gained from the electronic structure.
Within the IC-CDW state, the curl is zero since CDWave and CDWltc are the same; there are no satellite peaks. The sudden onset of the large curl below 355 K accompanies the 1st order phase transition. As the temperature decreases and domain size increases, the curl magnitudes within the domains/domain walls decrease. This indicates a generally smoother evolution towards the C-CDW state in which the curl is 0 because again CDWave and CDWltc are the same within the C-CDW state. However, despite this smoother evolution for the curl, the NC-CDW to C-CDW phase transition is first order [19, 27] Future work which includes STM topographic measurements taken at small temperature increments around both NC-CDW to IC-CDW and NC-CDW to IC-CDW phase transitions will give stronger insight into the atomic-scale evolution of the CDW state through the transitions.
I.5 Methods
STM measurements were made using an RHK PanScan Freedom STM at 203 K, 300 K, 354 K, and 360 K. We used a tungesten tip, chemically-etched, cleaned, and sharpened via electron bombardment. The high-quality 1T-TaS2 crystals used in this study were purchased from HQ Graphene. Samples were cleaved at Torr.
I.6 Acknowledgements
We appreciate our informative conversations with Jasper van Wezel. This work was supported by the National Science Foundation under Grant No. DMR-1904918.
References
- Tanda et al. [1984] S. Tanda, T. Sambongi, T. Tani, and S. Tanaka, X-ray study of charge density wave structure in 1\chT-TaS2, Journal of the Physical Society of Japan 53, 476 (1984).
- Thomson et al. [1994] R. E. Thomson, B. Burk, A. Zettl, and J. Clarke, Scanning tunneling microscopy of the charge-density-wave structure in 1\chT-TaS2, Physical Review B 49, 16899 (1994).
- Law and Lee [2017] K. T. Law and P. A. Lee, 1\chT-TaS2 as a quantum spin liquid, Proceedings of the National Academy of Sciences 114, 6996 (2017).
- Sipos et al. [2008] B. Sipos, A. F. Kusmartseva, A. Akrap, H. Berger, L. Forró, and E. Tutis, From mott state to superconductivity in 1\chT-TaS2, Nature Materials 7, 960 (2008).
- Dong et al. [2021] Q. Dong, Q. Li, S. Li, X. Shi, S. Niu, S. Liu, R. Liu, B. Liu, X. Luo, J. Si, W. Lu, N. Hao, Y. Sun, and B. Liu, Structural phase transition and superconductivity hierarchy in 1t-tas2 under pressure up to 100 gpa, npj Quantum Materials 6, 20 (2021).
- Li et al. [2012] L. J. Li, W. J. Lu, X. D. Zhu, L. S. Ling, Z. Qu, and Y. P. Sun, Fe-doping–induced superconductivity in the charge-density-wave system 1\chT-TaS2, EPL (Europhysics Letters) 97, 67005 (2012).
- Liu et al. [2013] Y. Liu, R. Ang, W. J. Lu, W. H. Song, L. J. Li, and Y. P. Sun, Superconductivity induced by \chSe-doping in layered charge-density-wave system 1\chT-TaS2-xSex, Applied Physics Letters 102, 192602 (2013).
- Ritschel et al. [2013] T. Ritschel, J. Trinckauf, G. Garbarino, M. Hanfland, M. v. Zimmermann, H. Berger, B. Buchner, and J. Geck, Pressure dependence of the charge density wave in 1\chT-TaS2 and its relation to superconductivity, Physical Review B 87, 125135 (2013).
- Yoshida et al. [2014] M. Yoshida, Y. Zhang, J. Ye, R. Suzuki, Y. Imai, S. Kimura, A. Fujiwara, and Y. Iwasa, Controlling charge-density-wave states in nano-thick crystals of 1\chT-TaS2, Scientific Reports 4, 7302 (2014).
- Bu et al. [2019] K. Bu, W. Zhang, Y. Fei, Z. Wu, Y. Zheng, J. Gao, X. Luo, Y.-P. Sun, and Y. Yin, Possible strain induced mott gap collapse in 1\chT-TaS2, Communications Physics 2, 146 (2019).
- Ma et al. [2016] L. Ma, C. Ye, Y. Yu, X. F. Lu, X. Niu, S. Kim, D. Feng, D. Tománek, Y.-W. Son, X. H. Chen, and Y. Zhang, A metallic mosaic phase and the origin of \chMott-insulating state in 1\chT-TaS2, Nature Communications 7, 10956 (2016).
- Stojchevska et al. [2014] L. Stojchevska, I. Vaskivskyi, T. Mertelj, P. Kusar, D. Svetin, S. Brazovskii, and D. Mihailovic, Ultrafast switching to a stable hidden quantum state in an electronic crystal, Science 344, 177 (2014).
- Nakanishi et al. [1977] K. Nakanishi, H. Takatera, Y. Yamada, and H. Shiba, The nearly commensurate phase and effect of harmonics on the successive phase transition in 1\chT-TaS2, Journal of the Physical Society of Japan 43, 1509 (1977).
- Ishiguro and Sato [1991] T. Ishiguro and H. Sato, Electron microscopy of phase transformations in 1\chT-TaS2, Physical Review B 44, 2046 (1991).
- Tsen et al. [2015] A. W. Tsen, R. Hovden, D. Wang, Y. D. Kim, J. Okamoto, K. A. Spoth, Y. Liu, W. Lu, Y. Sun, J. C. Hone, L. F. Kourkoutis, P. Kim, and A. N. Pasupathy, Structure and control of charge density waves in two-dimensional 1\chT-TaS2, Proceedings of the National Academy of Sciences 112, 15054 (2015).
- Yoshida et al. [2015] M. Yoshida, R. Suzuki, Y. Zhang, M. Nakano, and Y. Iwasa, Memristive phase switching in two-dimensional 1\chT-TaS2 crystals, Science Advances 1, e1500606 (2015).
- Shao et al. [2016] D. F. Shao, R. C. Xiao, W. J. Lu, H. Y. Lv, J. Y. Li, X. B. Zhu, and Y. P. Sun, Manipulating charge density waves in 1\chT-TaS2 by charge-carrier doping: A first-principles investigation, Physical Review B 94, 125126 (2016).
- Zong et al. [2018] A. Zong, X. Shen, A. Kogar, L. Ye, C. Marks, D. Chowdhury, T. Rohwer, B. Freelon, S. Weathersby, R. Li, J. Yang, J. Checkelsky, X. Wang, and N. Gedik, Ultrafast manipulation of mirror domain walls in a charge density wave, Science Advances 4, eaau5501 (2018), https://www.science.org/doi/pdf/10.1126/sciadv.aau5501 .
- Wang et al. [2019] W. Wang, D. Dietzel, and A. Schirmeisen, Lattice discontinuities of 1\chT-TaS2 across first order charge density wave phase transitions, Scientific Reports 9, 7066 (2019).
- Singh et al. [2022] M. Singh, B. Yu, J. Huber, B. Sharma, G. Ainouche, L. Fu, J. van Wezel, and M. C. Boyer, Lattice-driven chiral charge density wave state in 1\chT-TaS2, Phys. Rev. B 106, L081407 (2022).
- Ishioka et al. [2010] J. Ishioka, Y. H. Liu, K. Shimatake, T. Kurosawa, K. Ichimura, Y. Toda, M. Oda, and S. Tanda, Chiral charge-density waves, Physical Review Letters 105, 176401 (2010).
- Gao et al. [2021] J. J. Gao, W. H. Zhang, J. G. Si, X. Luo, J. Yan, Z. Z. Jiang, W. Wang, H. Y. Lv, P. Tong, W. H. Song, X. B. Zhu, W. J. Lu, Y. Yin, and Y. P. Sun, Chiral charge density waves induced by \chTi-doping in 1\chT-TaS2, Applied Physics Letters 118, 213105 (2021).
- van Wezel [2011] J. van Wezel, Chirality and orbital order in charge density waves, EPL (Europhysics Letters) 96, 67011 (2011).
- Tanda and Sambongi [1985] S. Tanda and T. Sambongi, X-ray study of the new charge-density-wave phase in 1\chT-TaS2, Synthetic Metals 11, 85 (1985).
- McMillan [1975] W. L. McMillan, Landau theory of charge-density waves in transition-metal dichalcogenides, Phys. Rev. B 12, 1187 (1975).
- McMillan [1976] W. L. McMillan, Theory of discommensurations and the commensurate-incommensurate charge-density-wave phase transition, Phys. Rev. B 14, 1496 (1976).
- Kratochvilova et al. [2017] M. Kratochvilova, A. D. Hillier, A. R. Wildes, L. Wang, S.-W. Cheong, and J.-G. Park, The low-temperature highly correlated quantum phase in the charge-density-wave 1\chT-TaS2 compound, npj Quantum Materials 2, 42 (2017).