Advancing Ischemic Stroke Diagnosis: A Novel Two-Stage Approach for Blood Clot Origin Identification
Abstract
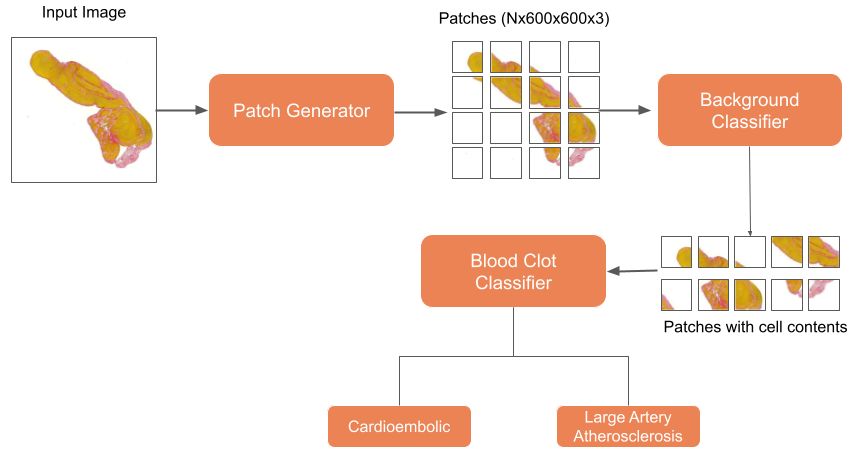
An innovative two-stage methodology for categorizing blood clot origins is presented in this paper, which is important for the diagnosis and treatment of ischemic stroke. First, a background classifier based on MobileNetV3 segments big whole-slide digital pathology images into numerous tiles to detect the presence of cellular material. After that, different pre-trained image classification algorithms are fine-tuned to determine the origin of blood clots. Due to complex blood flow dynamics and limitations in conventional imaging methods such as computed tomography (CT), magnetic resonance imaging (MRI), and ultrasound, identifying the sources of blood clots is a challenging task. Although these techniques are useful for identifying blood clots, they are not very good at determining how they originated. To address these challenges, our method makes use of robust computer vision models that have been refined using information from whole-slide digital pathology images. Out of all the models tested, the PoolFormer [1] performs better than the others, with 93.4% accuracy, 93.4% precision, 93.4% recall, and 93.4% F1-score. Moreover, it achieves the good weighted multi-class logarithmic loss (WMCLL) of 0.4361, which emphasizes how effective it is in this particular application. These encouraging findings suggest that our approach can successfully identify the origin of blood clots in a variety of vascular locations, potentially advancing ischemic stroke diagnosis and treatment approaches.
Index Terms:
ischemic stroke; PoolFormer; computer vision; blood clot origin;I Introduction
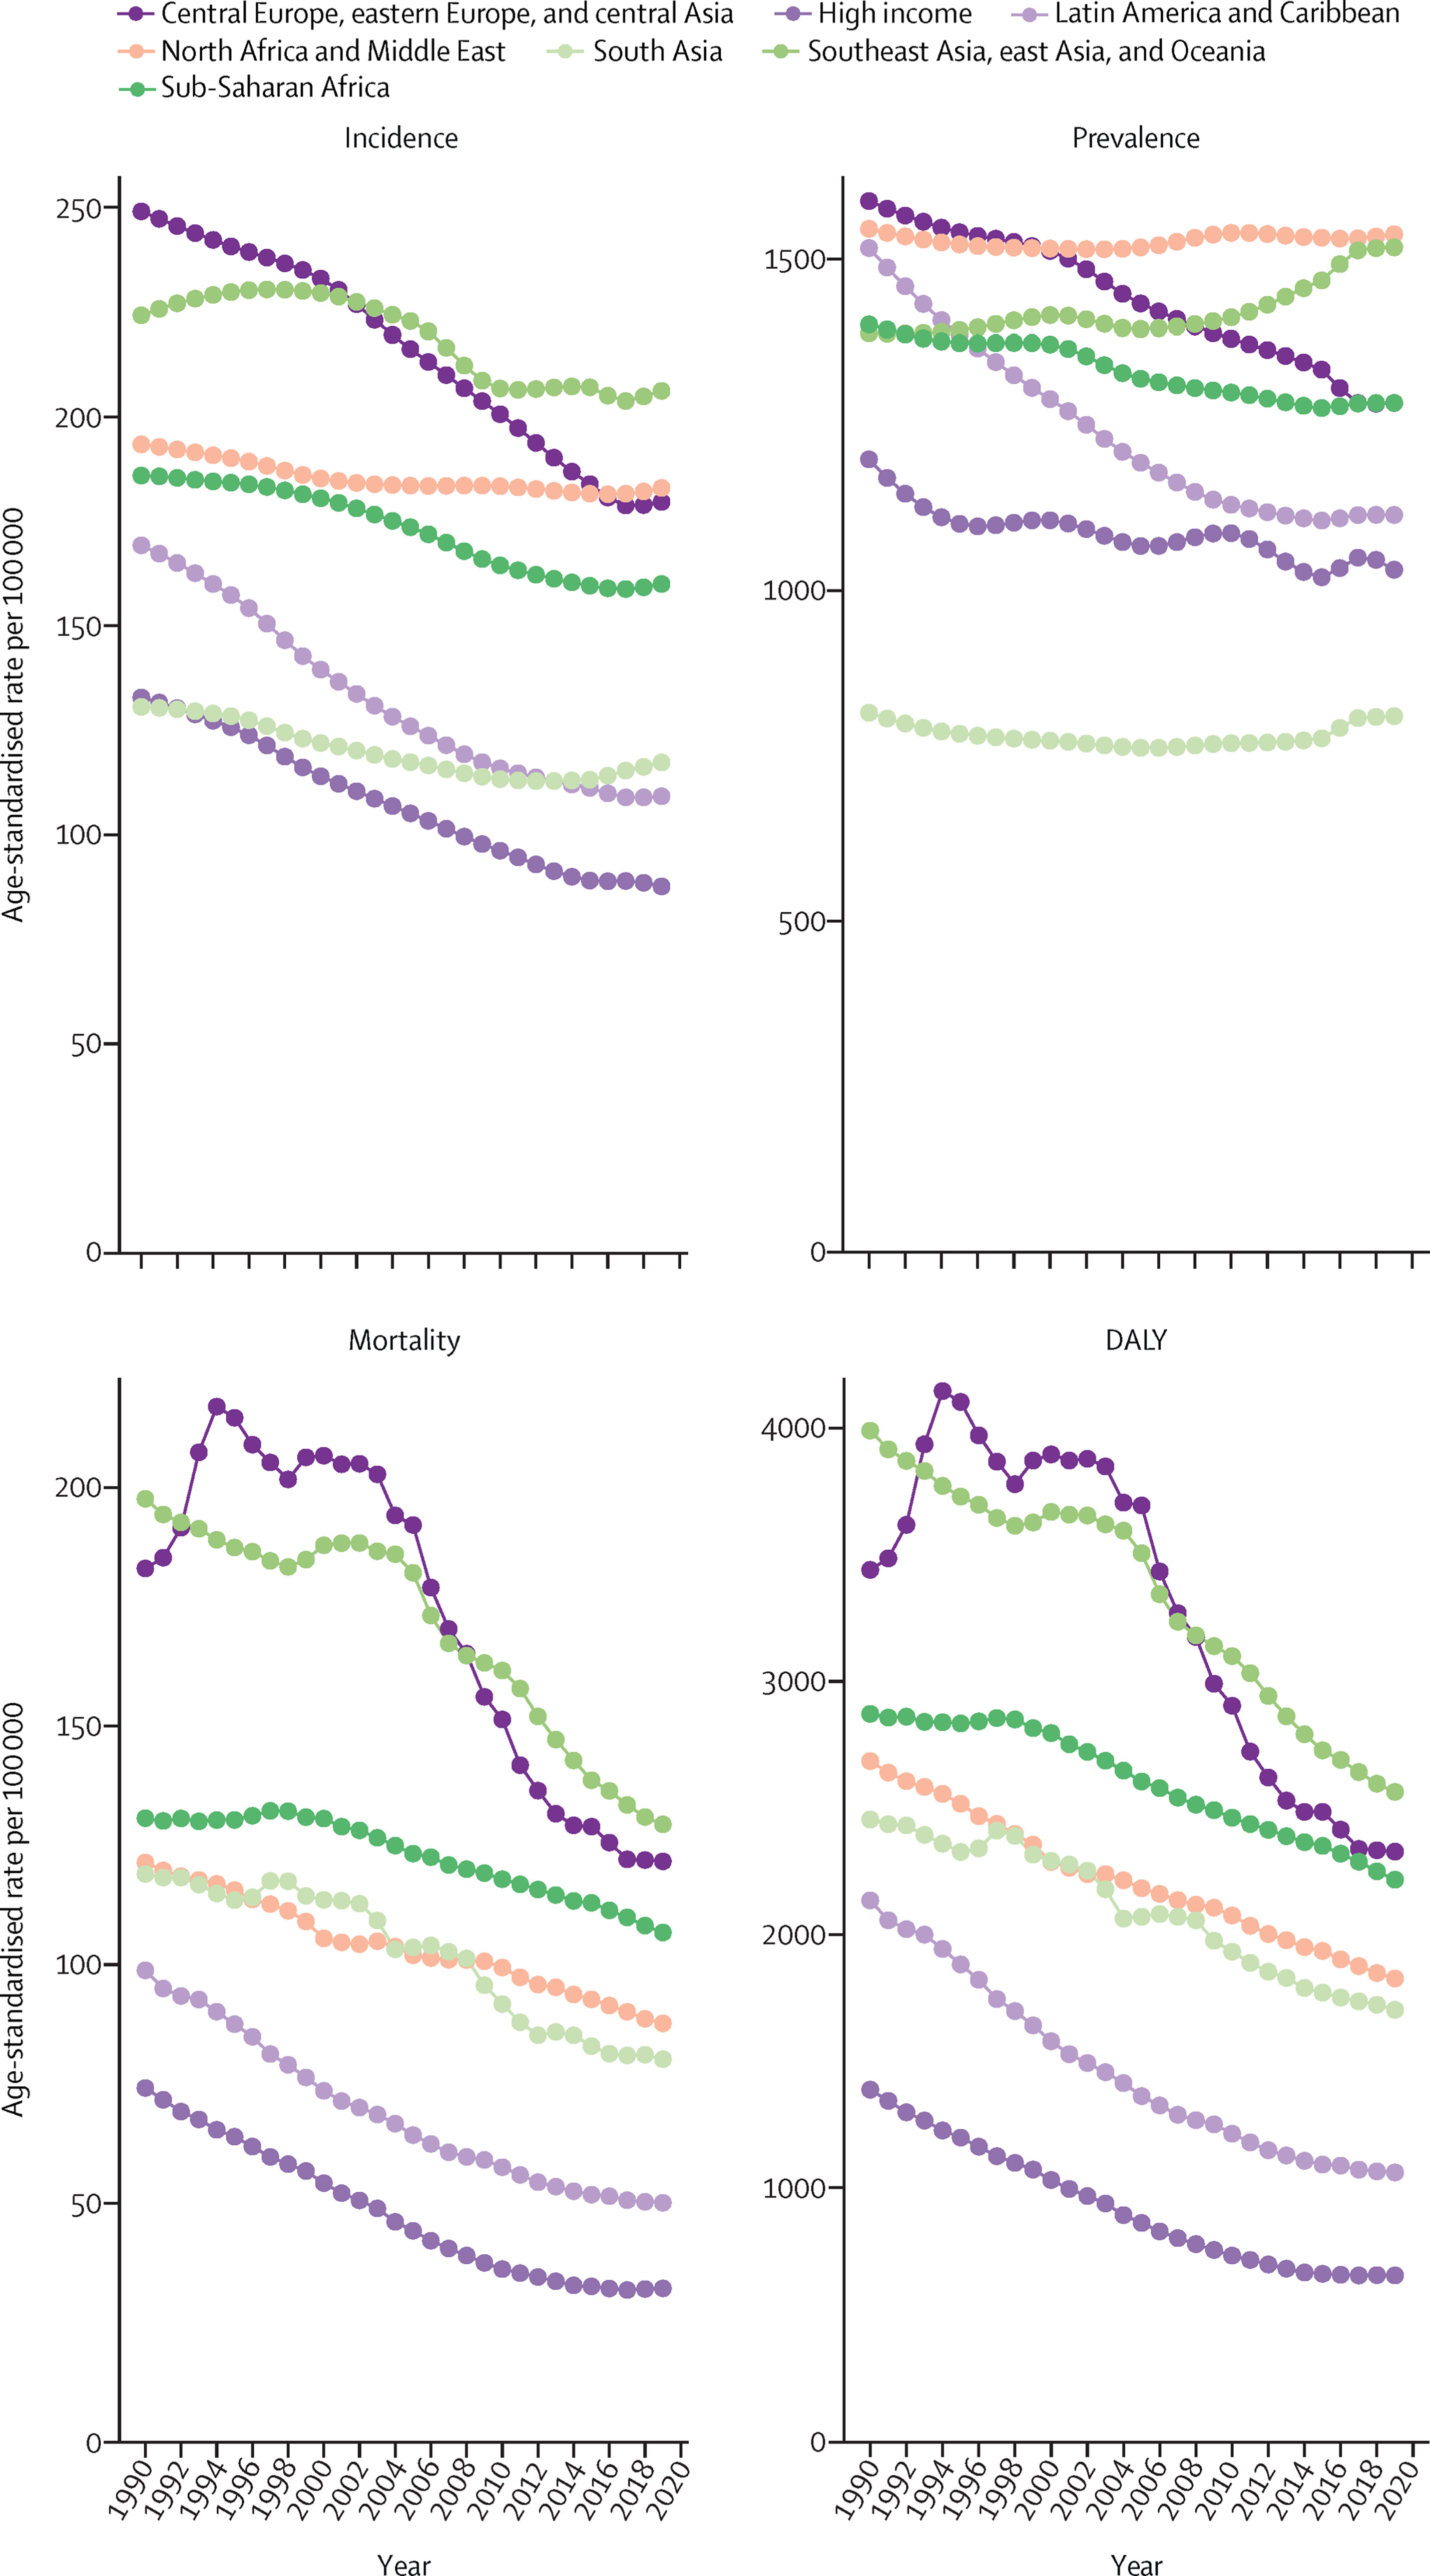
Stroke is considered the leading cause of death and disability globally, with approximately 12.2 million new cases reported annually [2]. It occurs when the brain’s blood supply is interrupted, leading to brain damage and potentially irreversible neurological impairments. Ischemic stroke is the most common type, resulting from a blockage in the blood vessel that supplies blood to the brain. The source of this blockage can be a blood clot originating from various parts of the body such as the heart, carotid artery, or other arteries. Identifying the source of the blood clot is essential for the effective prevention and treatment of stroke. There has been an increasing interest in developing methods to classify the origin of stroke blood clots in recent times. This paper aims to create an intuitive and easy-to-use system that performs well in classifying the origin of blood clots in ischemic stroke patients.
The article will commence by highlighting the significance of detecting the source of blood clots that cause strokes. Subsequently, it will analyze the different types of blood clots, including their incidence and features. The article will then delve into the proposed method that can classify the blood clots of ischemic stroke patients effectively.
Identifying the origin of blood clots that cause strokes presents a significant challenge due to the complicated nature of the underlying pathology. Blood clots can arise from various factors such as coagulopathy, atrial fibrillation, or atherosclerosis, and these factors can interact in intricate ways, making it challenging to pinpoint the cause of the clot. Additionally, stroke symptoms can differ based on the clot’s size and location, further complicating the classification process.
Innovative solutions have enabled researchers to create efficient techniques for categorizing the source of blood clots that cause strokes. To achieve this, they employ a range of imaging methods such as MRI and CT, which help identify the clot’s position and characteristics. Furthermore, lab evaluations involving blood tests and clotting factor assays, combined with thorough clinical assessments that entail a detailed medical history and physical examination, can offer valuable information on the underlying factors that trigger clot formation.
These classification methods offer the significant advantage of guiding treatment decisions. For example, if the clot originates from the heart, anticoagulant therapy may be recommended to prevent future strokes. On the other hand, if the clot is from the carotid artery, a surgical procedure called carotid endarterectomy, which removes plaque from the artery, may be suggested.
As technology continues to advance, there has been a growing interest in developing more advanced and precise methods for identifying the origin of stroke blood clots. One of these methods is the use of sophisticated imaging techniques such as diffusion-weighted imaging (DWI), which provides detailed information about the clot’s location and extent. Other imaging techniques like magnetic resonance angiography (MRA) and CT angiography (CTA) can also be employed to identify the blood vessels leading to the clot, thereby allowing for a more precise diagnosis of the clot’s source.
Laboratory examinations have displayed potential in recognizing the origin of blood clots that cause strokes. Specific biomarkers like D-dimer and brain natriuretic peptide (BNP) can give essential indications about the underlying cause of the blood clot. Genetic testing has also exhibited promise in identifying patients with an elevated risk of developing blood clots, primarily those with a family history of stroke or a recognized genetic disposition.
To classify the origin of blood clots that cause strokes, the clinical assessment remains a critical component. An exhaustive medical history can provide significant information about the patient’s risk factors for stroke such as hypertension, diabetes, and smoking. However, despite the promising developments in the classification of stroke blood clot origin, numerous obstacles need to be addressed to improve their accuracy and clinical effectiveness. One of the primary obstacles is the need for more standardized and validated criteria for classification.
Additionally, while advanced imaging techniques have demonstrated promise in detecting the source of stroke blood clots, their high cost and limited accessibility may restrict their widespread application in clinical practice. Despite these challenges, devising more precise and reliable methods for classifying the source of stroke blood clots holds the potential to significantly enhance stroke management and prevention. By identifying the root cause of the clot, healthcare providers can tailor treatment plans to each patient, resulting in improved outcomes and decreased risk of future strokes.
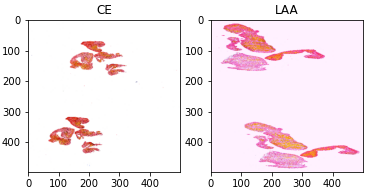
Thus, this study proposes a novel system that can analyze the whole-slide digital pathology image of blood clots from ischemic stroke patients and accurately classify them into Cardioembolic (CE) and Large Artery Atherosclerosis (LAA) and works on par with the pathologists in identifying the origin of stroke blood clots.
II Related Work
Deep learning has made great progress since its inception [4]. Neural networks were hampered in the 1980s by a lack of processing power and data. Yet, the advancement of graphics processing units (GPUs) and massive data has made deep neural network training possible [5]. This has resulted in advances in image identification, natural language processing, and speech recognition. Deep learning has transformed medical data analysis[6][7] significantly by helping physicians better diagnose numerous diseases and improve overall patient care.
In 2017, Vaswani et al. [8] presented the transformer architecture as a breakthrough in natural language processing for neural machine translation. By merging self-attention with linear layers, this approach outperformed LSTM-RNN-based methods in various NLP tasks, including neural machine translation. Over time, researchers have proposed various versions and improvements to the transformer architecture across different domains, resulting in superior performance in computer vision [9] and natural language processing tasks.
Lie et al. [10] developed an enhanced version of the swin transformer architecture by investigating large-scale models in computer vision. The study introduced three methods to address major concerns in the training and use of large-vision models. The strategies comprise a residual-post-norm approach, a log-spaced continuous position bias approach, and a self-supervised pre-training method. Utilizing these methods, the authors trained a 3 billion-parameter Swin Transformer V2 model with high-resolution images. This study achieved new performance records for four representative vision tasks and used 40 times less labeled data and training time than Google’s billion-level visual models.
Gupta et al. [11] present a comparison of various machine learning models on the task of stroke prediction using different machine learning models, with the AdaBoost, XGBoost, and Random Forest Classifiers having the highest accuracy scores. The study concluded that the RandomForest model achieves the highest accuracy of 97%.
In a recent study by Rahim et al. [12], the researchers suggest utilizing the Xtreme Gradient Boosting Algorithm as an ensemble learning technique to enhance the accuracy of stroke case predictions. Their results indicate that training data, consisting of 3582 instances, with test data of 1536 instances, produced a 96% accuracy rate and improved outcomes compared to prior studies.
Tazin et al. [13] have developed multiple machine learning (ML) models to anticipate the probability of a brain stroke happening. Their study revealed that the Random Forest algorithm had the highest accuracy rate, reaching 96%. The accuracy of the models used in this research surpasses those of previous studies, which indicates the increased reliability of these models.
Darapaneni et al. [14] explores deep learning models for classifying stroke-related images. It evaluates CNN architectures like ResNet, VGG, InceptionV3, and DenseNet, highlighting DenseNet with Adam optimizer as most effective. The study also addresses deep learning’s ”Black box” nature by correlating auto-encoder features with baseline image features. Challenges in processing high-resolution histopathology images are discussed, with ResNet152 and Adam optimizer identified as optimal for this application.
Rao et al. [15] propose a novel deep learning approach is utilized to classify the origin of blood clots in ischemic strokes. The model integrates EfficientNet-B0, VGG19, and ResNet-152 architectures to distinguish between cardioembolic and large artery atherosclerotic strokes. Employing the Mayo Clinic - Strip AI dataset, this method demonstrates improved accuracy over existing models, offering significant potential for enhanced diagnosis and management of stroke causes.
III Methodology
III-A Dataset
III-A1 Background classifier dataset
To develop a background classifier that could remove empty patches from the whole-slide digital pathology images, we utilized the STRIP AI background clot dataset [16] that was sourced from Kaggle. The dataset comprises a total of 19,998 images, half of which contain cell contents while the other half consists of empty patches without any cell contents.
III-A2 Blood clot origin classification dataset
To classify between Cardioembolic (CE) and Large Artery Atherosclerosis (LAA) Figure 2, the proposed system was trained on the Mayo Clinic - STRIP AI competition dataset [17]. The dataset comprises whole-slide digital pathology images of blood clots that were obtained from patients who experienced ischemic stroke. The competition aimed to develop a system that could accurately classify the two types of stroke.
| Split | Number patches with cell contents |
|---|---|
| Train | 60489 |
| Validation | 12962 |
| Test | 12963 |
| Total | 86414 |
| Model | Weighted Multi-Class Logarithmic Loss | Accuracy | Precision | Recall | F1-Score |
| Results from ”Image Classification of Ischemic Stroke Blood Clot Origin” | |||||
| Best Stacked Model (EfficientNet-B0, VGG19, ResNet-152) | 0.69312 | - | - | - | - |
| Results from Darapaneni et al. [14] | |||||
| ResNet152 | - | 0.7484 | - | - | - |
| CNN | - | 0.7615 | - | - | - |
| DenseNet121 | - | 0.6821 | - | - | - |
| EfficientNet | - | 0.7615 | - | - | - |
| Our Results | |||||
| ResNet50 | 1.057 | 0.7384 | 0.7384 | 0.7384 | 0.7384 |
| InceptionV3 | 0.5847 | 0.8761 | 0.8761 | 0.8761 | 0.8761 |
| ConvNeXtV2 | 0.4374 | 0.8948 | 0.8948 | 0.8948 | 0.8948 |
| SwinTransformerV2 | 0.3894 | 0.9269 | 0.9269 | 0.9269 | 0.9269 |
| PoolFormer | 0.4361 | 0.9345 | 0.9345 | 0.9345 | 0.9345 |
III-B Dataset Preprocessing
The data preprocessing step is an essential step in any research project. In this section, we will describe the steps we took to preprocess our data for analysis.
First, we obtained whole-slide digital pathology images of very large dimensions from the STRIP AI background clot dataset [16]. These images were in the TIFF format, which is a standard format for digital pathology images. To extract patches from these images, we used the OpenSlide [18] python library. OpenSlide [18] is an open-source library that provides a simple interface for reading digital pathology images. We extracted patches of size 600x600x3 dimensions from the whole-slide digital pathology images and saved them in PNG format.
We then used Otsu’s thresholding technique to filter out low-quality patches. The thresholding technique involves calculating the area of the slide contents in the image as well as the total content in the image. If the slide area consists of more than 30% of the total slide area, the image was kept otherwise it was discarded. This step helped us to remove images with low-quality content that could have affected our analysis negatively.
Subsequently, we used our previously trained background classifier to remove white images from the dataset. This was done to ensure that the dataset only contains images that are relevant to the study. These steps ensured that the dataset we used for analysis was of high quality and relevance to the study.
Finally, we used the albumentations [19] library’s numerous powerful image augmentation techniques on the image patches. We apply HorizontalFlip, VerticalFlip, RandomAdjustSharpness, Rotate, and ColorJitter transformations are applied on 50% of the training dataset. The RandomAdjustSharpness transformation was applied with a sharpness factor of 2 and the ColorJitter transformation was applied with brightness=0.2, hue=0.5, and saturation=0.5 values. The Resize transformation which resizes the 600x600x3 patches into 256x256x3 patches and the Normalize transformation which uses the ImageNet mean and standard deviation to normalize the patches are applied on all splits of the dataset.
IV Experiments and Analysis
IV-A Experimental Setup
IV-A1 Background Classifer
At first, we trained a background classifier model on the STRIP AI background clot dataset [16] which contains 9999 images each for both classes. Based on our previous research works [20], we implemented the transfer learning approach to fine-tune state-of-the-art computer vision models for the task at hand. We wanted to create a lightweight and efficient background classifier and hence we used the MobileNetV3 [21] architecture and replaced its classification head with a linear layer that produces the dataset-specific output. This background classifier was trained on images of dimension 128x128x3 to further reduce the inference time. We used the AdamW [22] optimizer with an initial learning rate of 3e-4.
IV-A2 Blood Clot Classifier
The classification of blood clot images into Large Artery Atherosclerosis (LAA) and Cardioembolic (CE) blood clots is crucial in the diagnosis and treatment of stroke. To accomplish this task, we utilized a transfer learning process, which involves fine-tuning pre-trained models on a new dataset. In particular, we used several state-of-the-art models including the swinv2_tiny_window16_256 variant of the SwinTransformerV2 [10] architecture, poolformers36 variant of the PoolFormer [1] architecture, convnext_small variant of the ConvNeXt [23] architecture, efficientnet_b3 variant of the EfficientNet [24] architecture, resnet50 variant of the ResNet [25] architecture, and the inceptionv3 [26] architecture, all of which have achieved impressive results in various computer vision tasks. We used the Timm [27] python library to get all the above-mentioned pretrained models and fine-tuned them on the ischemic stroke blood clot origin classification task.
To adapt these pre-trained models to our specific task, we replaced their top layers with a linear layer that produces dataset-specific output. We set the image size to 256 x 256 x 3, which gives a good balance between performance and computational efficiency. Furthermore, to determine the optimal hyperparameters, such as the learning rate and optimizer, we employed the Optuna hyperparameter optimization framework [28]. This approach involves conducting a systematic search over the hyperparameter space to find the configuration that yields the best performance on the validation set. Through 50 trials using various optimizers and learning rates from 1e-3 to 1e-6, we found that the AdamW optimizer [22] with an initial learning rate of 3e-4 worked well for all pre-trained models. AdamW optimizer[22] is an improved version of the popular Adam optimizer that includes weight decay regularization, to optimize the models’ parameters during training.
During training, we used two schedulers: StochasticWeightAveraging[29] and EarlyStopping. The former computes the average of multiple weight values during training to achieve better generalization, while the latter stops training if the monitored metric did not improve. These schedulers help prevent overfitting and improve the models’ generalization performance.
In summary, our approach involved fine-tuning several pre-trained models using transfer learning, optimizing the models’ hyperparameters using the Optuna framework [28], and using appropriate schedulers to improve the models’ performance. The resulting models showed promising results in the classification of blood clot images, which could potentially assist physicians in the diagnosis and treatment of stroke.
IV-B Evaluation Criteria
The Weighted Multi-Class Logarithmic Loss (WMCLL) is used as the loss function to be optimized for this problem. This loss function is a variation of the traditional multi-class logarithmic loss, enhanced by incorporating weights for each class. These weights adjust the contribution of each class to the total loss, emphasizing classes that are underrepresented or of greater importance. WMCLL penalizes incorrect predictions, with the penalty scaled according to the assigned class weights. The loss is calculated using the logarithm of predicted probabilities, ensuring that confident but incorrect predictions are penalized more heavily.
| (1) |
where:
-
•
is the number of samples.
-
•
is the number of classes.
-
•
is the weight for class .
-
•
is 1 if sample belongs to class , else 0.
-
•
is the predicted probability of sample for class .
Classification models are commonly evaluated using metrics such as accuracy, precision, recall, and F1 score.
Accuracy is a simple metric that reflects the fraction of properly identified samples among all samples. It is acceptable when the sample sizes in the classes are substantially comparable.
Precision is the percentage of true positive predictions to all positive predictions, and it reflects how frequently the model accurately identifies positive results. When the cost of false positives is significant, this statistic is extremely relevant.
The fraction of true positive predictions out of all real positive samples is measured as recall, and it reflects how well the model recognizes the positive class. When the cost of false negatives is substantial, this measure is acceptable.
F1 score is a composite metric that balances precision and recall using their harmonic mean. When the classes are imbalanced, with one class having much more samples than the other, this method is beneficial.
| (2) |
| (3) |
| (4) |
| (5) |
In this context, TP (True Positive) denotes the count of accurately classified positive samples, FN (False Negative) represents the quantity of negatively classified samples that were incorrect, TN (True Negative) indicates the number of accurately classified negative samples, and FP (False Positive) refers to the quantity of falsely classified positive samples.
V Results
The summarized results from Table II reveal a competitive landscape in the domain of stroke blood clot origin classification using various deep learning models. The stacked model from Rao et al. [15], combining EfficientNet-B0, VGG19, and ResNet-152, established a baseline with a Logarithmic Loss of 0.69312, although its accuracy and other metrics were not disclosed.
In contrast, the ResNet152 model, as reported from the study by Darapaneni et al. [14], achieved an accuracy of 74.84%, while a standard CNN and EfficientNet tied for the highest accuracy of 76.15%. DenseNet121 lagged behind with an accuracy of 68.21%. These results suggest that while ResNet152 is a strong performer, the standard CNN and EfficientNet models are equally competent in this application.
Our experimental outcomes further enrich this analysis. The ResNet50 model showed a balanced performance with an accuracy and other metrics uniformly at 73.84%, while InceptionV3 surpassed it with an accuracy of 87.61%. More advanced architectures like ConvNeXtV2 and SwinTransformerV2 demonstrated superior performance, with accuracy rates of 89.48% and 92.69%, respectively, reflecting their more efficient pattern recognition and generalization capabilities. The standout model in our study was PoolFormer, which not only achieved an excellent Logarithmic Loss of 0.4361 but also recorded the highest accuracy, precision, recall, and F1-score at 93.45%. This performance highlights the PoolFormer’s adeptness at handling the complexity of medical image classification and suggests its suitability for practical deployment in medical diagnostics.
VI Conclusion
Finally, the proposed stroke blood clot origin detection system is a valuable tool that can help doctors accurately determine the origin of a blood clot-caused stroke. The proposed system employs deep learning algorithms to give doctors a dependable and quick method of diagnosing the type of stroke and determining the best treatment approach. This system has the potential to save lives, save healthcare costs, and improve overall care quality. Overall, the proposed stroke blood clot origin detection system offers a substantial advancement in stroke diagnosis and therapy. It has the potential, with more development and refining, to transform how doctors approach stroke care, ultimately saving the lives of patients all around the world.
VII Future Work
Although the proposed system achieves higher accuracies in identifying the origin of blood clots, there is still room for improvement. The following are some of the approaches to improve the proposed system’s performance.
-
1.
Improving the accuracy of the classification algorithm is an essential topic of future effort. This could include employing more complex deep learning algorithms or incorporating additional data sources to increase the model’s accuracy.
-
2.
To boost the precision and effectiveness of the categorization, patient-specific data could be incorporated into the algorithm. Data such as age, gender, medical history, and other parameters could be used to better forecast the origin of a blood clot.
References
- [1] Weihao Yu et al. “MetaFormer Is Actually What You Need for Vision”, 2022 arXiv:2111.11418 [cs.CV]
- [2] “Learn About Stroke”, https://www.world-stroke.org/world-stroke-day-campaign/why-stroke-matters/learn-about-stroke
- [3] Valery L. Feigin et al. “Global, regional, and national burden of stroke and its risk factors, 1990–2019: a systematic analysis for the Global Burden of Disease Study 2019” In The Lancet Neurology 20.10 Elsevier, 2021, pp. 795–820 DOI: 10.1016/S1474-4422(21)00252-0
- [4] Karthik Sivarama Krishnan and Ferat Sahin “ORBDeepOdometry - A Feature-Based Deep Learning Approach to Monocular Visual Odometry” In 2019 14th Annual Conference System of Systems Engineering (SoSE), 2019, pp. 296–301 DOI: 10.1109/SYSOSE.2019.8753848
- [5] Koushik Sivarama Krishnan and Karthik Sivarama Krishnan “SwiftSRGAN - Rethinking Super-Resolution for Efficient and Real-time Inference” In 2021 International Conference on Intelligent Cybernetics Technology and Applications (ICICyTA), 2021, pp. 46–51 DOI: 10.1109/ICICyTA53712.2021.9689188
- [6] Koushik Sivarama Krishnan and Karthik Sivarama Krishnan “Vision Transformer based COVID-19 Detection using Chest X-rays” In 2021 6th International Conference on Signal Processing, Computing and Control (ISPCC), 2021, pp. 644–648 DOI: 10.1109/ISPCC53510.2021.9609375
- [7] Karthik Sivarama Krishnan and Koushik Sivarama Krishnan “Efficient Super-Resolution For Chest X-rays” In Acta Scientific COMPUTER SCIENCES Volume 4.6, 2022
- [8] Ashish Vaswani et al. “Attention Is All You Need”, 2017 arXiv:1706.03762 [cs.CL]
- [9] Karthik Sivarama Krishnan and Koushik Sivarama Krishnan “Benchmarking Conventional Vision Models on Neuromorphic Fall Detection and Action Recognition Dataset” In 2022 IEEE 12th Annual Computing and Communication Workshop and Conference (CCWC), 2022, pp. 0518–0523 DOI: 10.1109/CCWC54503.2022.9720737
- [10] Ze Liu et al. “Swin Transformer V2: Scaling Up Capacity and Resolution”, 2022 arXiv:2111.09883 [cs.CV]
- [11] Saumya Gupta and Supriya Raheja “Stroke Prediction using Machine Learning Methods” In 2022 12th International Conference on Cloud Computing, Data Science and Engineering (Confluence), 2022, pp. 553–558 DOI: 10.1109/Confluence52989.2022.9734197
- [12] Abd Mizwar A Rahim, Andi Sunyoto and Muhammad Rudyanto Arief “Stroke Prediction Using Machine Learning Method with Extreme Gradient Boosting Algorithm” In MATRIK : Jurnal Manajemen, Teknik Informatika dan Rekayasa Komputer 21.3, 2022, pp. 595–606 DOI: https://doi.org/10.30812/matrik.v21i3.1666
- [13] Tahia Tazin et al. “Stroke Disease Detection and Prediction Using Robust Learning Approaches” In Journal of healthcare engineering 2021, 2021, pp. 7633381 DOI: 10.1155/2021/7633381
- [14] Narayana Darapaneni et al. “Image Classification of Stroke Blood Clot Origin” In 2023 International Conference on Signal Processing, Computation, Electronics, Power and Telecommunication (IConSCEPT), 2023, pp. 1–6 DOI: 10.1109/IConSCEPT57958.2023.10170332
- [15] Masabathula V S Raghavendra Rao, Surya Puligundla, Nikhil Sai Ekkala and Srilatha Chebrolu “Image Classification of Ischemic Stroke Blood Clot Origin using Stacked EfficientNet-B0, VGG19 and ResNet-152” In 2023 Third International Conference on Secure Cyber Computing and Communication (ICSCCC), 2023, pp. 304–310 DOI: 10.1109/ICSCCC58608.2023.10176805
- [16] alejopaullier “strip-ai-background-clot” Kaggle, 2022 URL: https://www.kaggle.com/datasets/alejopaullier/strip-ai-background-clot
- [17] Ashley Chow et al. “Mayo Clinic - STRIP AI” Kaggle, 2022 URL: https://kaggle.com/competitions/mayo-clinic-strip-ai
- [18] Adam Goode et al. “OpenSlide: A vendor-neutral software foundation for digital pathology” In Journal of pathology informatics 4, 2013, pp. 27 DOI: 10.4103/2153-3539.119005
- [19] Alexander Buslaev et al. “Albumentations: Fast and Flexible Image Augmentations” In Information 11.2, 2020 DOI: 10.3390/info11020125
- [20] Karthik Sivarama Krishnan and Koushik Sivarama Krishnan “MFAAN: Unveiling Audio Deepfakes with a Multi-Feature Authenticity Network”, 2023 arXiv:2311.03509 [cs.SD]
- [21] Andrew Howard et al. “Searching for MobileNetV3”, 2019 arXiv:1905.02244 [cs.CV]
- [22] Ilya Loshchilov and Frank Hutter “Decoupled Weight Decay Regularization”, 2019 arXiv:1711.05101 [cs.LG]
- [23] Sanghyun Woo et al. “ConvNeXt V2: Co-designing and Scaling ConvNets with Masked Autoencoders”, 2023 arXiv:2301.00808 [cs.CV]
- [24] Mingxing Tan and Quoc V. Le “EfficientNet: Rethinking Model Scaling for Convolutional Neural Networks”, 2020 arXiv:1905.11946 [cs.LG]
- [25] Kaiming He, Xiangyu Zhang, Shaoqing Ren and Jian Sun “Deep Residual Learning for Image Recognition”, 2015 arXiv:1512.03385 [cs.CV]
- [26] Christian Szegedy et al. “Rethinking the Inception Architecture for Computer Vision”, 2015 arXiv:1512.00567 [cs.CV]
- [27] Ross Wightman “PyTorch Image Models” In GitHub repository GitHub, https://github.com/rwightman/pytorch-image-models, 2019 DOI: 10.5281/zenodo.4414861
- [28] Takuya Akiba et al. “Optuna: A Next-generation Hyperparameter Optimization Framework”, 2019 arXiv:1907.10902 [cs.LG]
- [29] Pavel Izmailov et al. “Averaging Weights Leads to Wider Optima and Better Generalization”, 2019 arXiv:1803.05407 [cs.LG]