.
Jefferson Lab Hall A Collaboration
A novel measurement of the neutron magnetic form factor from A=3 mirror nuclei
Abstract
The electromagnetic form factors of the proton and neutron encode information on the spatial structure of their charge and magnetization distributions. While measurements of the proton are relatively straightforward, the lack of a free neutron target makes measurements of the neutron’s electromagnetic structure more challenging and more sensitive to experimental or model-dependent uncertainties. Various experiments have attempted to extract the neutron form factors from scattering from the neutron in deuterium, with different techniques providing different, and sometimes large, systematic uncertainties. We present results from a novel measurement of the neutron magnetic form factor using quasielastic scattering from the mirror nuclei 3H and 3He, where the nuclear effects are larger than for deuterium but expected to largely cancel in the cross-section ratios. We extracted values of the neutron magnetic form factor for low-to-modest momentum transfer, GeV2, where existing measurements give inconsistent results. The precision and range of this data allow for a better understanding of the current world’s data, and suggest a path toward further improvement of our overall understanding of the neutron’s magnetic form factor.
The proton and neutron have dual roles as both the basic building blocks of nuclei and as the lightest (nearly degenerate) baryonic bound states of QCD. Studies of their parton distribution functions provide information on the momentum distribution of the quarks inside the nucleon, while measurements of the nucleon electromagnetic form factors connect to the quarks’ spatial distributions [1, 2, 3]. By combining measurements on the proton and neutron, we can separate the contributions of up- and down-quarks to their internal structure.
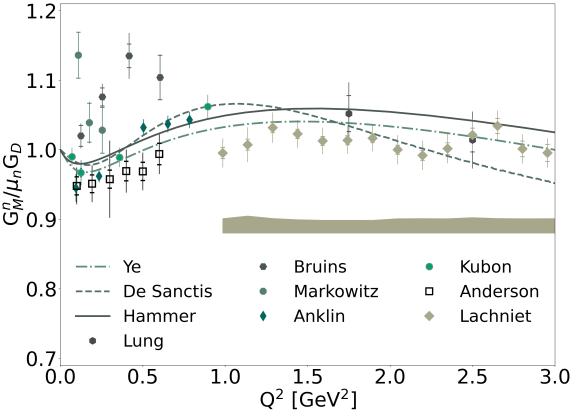
Because free neutrons decay with a 15 minute lifetime, measurements of neutron structure typically involve scattering from neutrons bound in nuclei, most commonly in the deuteron. For inclusive scattering, isolating the e-n elastic cross section involves correcting for the larger contribution from e-p scattering, as well as accounting for the effects such as binding and Fermi motion in the nucleus. Other measurements suppress the e-p contributions by measuring the neutron in the final state 2H(e,e’n), which requires a precise determination of the neutron detection efficiency and correcting for possible charge-exchange final-state interactions where the struck proton scatters from the spectator neutron which is then detected. More recently, polarized scattering from 3He was used to extract . These techniques and their limitations are discussed in Ref. [15, 16, 17]. Figure 1 shows several extractions of . While some of the more model-dependent extractions have been excluded, e.g. from low- inclusive scattering, there are large disagreements at low-. For some of the older measurements [6, 5], questions have been raised about the systematic uncertainties in these extractions [18, 19, 7], but even focusing on the more recent, high-precision measurements, there are discrepancies among different experiments for GeV2.
We present in this work a measurement of using a new technique, the comparison of quasielastic (QE) scattering from the mirror nuclei 3H and 3He, that minimizes systematic uncertainties and has small nuclear corrections. In the simplest approximation, QE scattering from a nucleus simply represents the sum of e-p and e-n elastic scattering, corrected for smearing and binding in the nucleus. Assuming nuclear corrections are similar for 3H and 3He, the scattering cross section ratio is
| (1) |
where is the ratio neglecting nuclear effects and accounting only for the free e-N elastic cross section contributions and . Several experimental systematic uncertainties cancel in taking the ratio , and a realistic cross section model can be used to estimate the small correction difference between and the exact 3H/3He cross section ratio.
The experiment was performed in Hall A at Jefferson Lab (JLab) in 2018. We used electron beam energies of 2.222 and 4.323 GeV [20] and detected scattered electrons in two high resolution spectrometers (HRSs) [21]. The basic components of the spectrometers are three superconducting quadrupoles (Q) and one superconducting dipole (D) in a QQDQ configuration. The quadrupoles focus the electrons while the dipole disperses the electrons so their momenta can be measured.
After passing the magnets, the scattered electrons go through two Vertical Drift Chambers (VDCs) where the information on the position and angle of the particles are recorded. They then pass through the trigger scintillator planes, S0 and S2, and a Cherenkov detector filled with CO2 between the trigger scintillator planes. Finally, the preshower and shower lead glass blocks induce a cascade of pair production and bremsstrahlung and the energy of the particles can be measured. More detailed information of the configuration for this experiment and relevant calibrations can be found in Refs. [22, 23, 24, 25]. Because the acceptance of the spectrometer is limited to % of the central momentum, multiple HRS momentum settings were used to more completely cover the QE peak. The kinematics, number of settings, and extracted form factors are shown in Table 1
The 3H, 3He, and 2H gas targets were contained in 25 cm long aluminum cells [26]. Two 3H cells from Savanah River Site were used, one for each run period [22]. It was found that the second cell, used for the data taking at 4.323 GeV, had a (4.120.20)% 1H contamination [22]. To correct for this contamination, 1H elastic data was used to estimate the amount of contamination, and 1H scattering data, when available, or simulations were used to subtract the 1H contribution from the 3H data. The 3H thickness was then reduced by (4.120.20)% to correct for the presence of 1H [22]. A correction was also applied to account for the reduction in gas density seen by the beam as a result of target heating, determined to be a 9.4% (6.0%) for 3H (3He) [27] at the average beam current of the experiment. Finally, because the tritium decays into 3He over time (up to 4.21% by the end of the run period), the 3He contribution was subtracted, based on the 3He measurement, and the target thickness reduced to account for the tritium decay.
| Label | Theta | # QE | ) | ||
|---|---|---|---|---|---|
| [GeV] | [deg] | [GeV2] | settings | ||
| L21 | 2.222 | 21.778 | 0.603 | 3 | 1.0690.0200.028 |
| L24 | 2.222 | 23.891 | 0.703 | 3 | 1.0510.0200.028 |
| L26 | 2.222 | 25.952 | 0.803 | 3 | 1.0660.0200.027 |
| L28 | 2.222 | 28.001 | 0.905 | 3 | 1.0510.0200.027 |
| L30 | 2.222 | 30.001 | 1.004 | 3 | 1.0580.0190.027 |
| L17 | 4.323 | 17.006 | 1.360 | 2 | 1.0410.0200.025 |
| R42 | 2.222 | 42.025 | 1.578 | 3 | 1.0650.0300.025 |
| R24 | 4.323 | 24.016 | 2.313 | 2 | 1.0660.0210.024 |
| R26 | 4.323 | 26.003 | 2.580 | 3 | 1.0290.0220.024 |
| R28 | 4.323 | 28.004 | 2.843 | 2 | 1.0230.0290.025 |
Cuts were applied on the reconstructed angle and momentum of the scattered electrons to focus on the high-acceptance regions of spectrometers, while the Cherenkov and shower counter signals were used to remove the small contamination of negative pions [25]. To subtract the large contribution from the target endcaps, the reaction vertex was selected to be 8 cm from the center of the target and the small (1%) residual contribution from the endcaps was removed using data from an empty cell or dummy target (two thicker Al foils at the position of the target windows that were used when the rate was low), as described in Ref. [22].
After applying cuts, the yield was normalized to the effective integrated luminosity which includes the target length, the data acquisition live time, the trigger, tracking, and particle identification efficiencies. The normalized yield was binned as a function of energy transfer, , and compared to a detailed simulation of the experiment. The simulation generates events over the acceptance of the spectrometer, weighted with a realistic cross section model that starts with a model of the Born cross section and then accounts for energy loss, multiple scattering, and radiative corrections [28], as described in [29]. The events were then propagated through a model of the HRS spectrometer to account for the spectrometer acceptance.
For each bin in , we took the cross section model and scale it by the ratio of normalized yield from the experiment to the normalized yield from the simulation. Assuming that the simulation accounts for all of the corrections needed to go from the Born cross section to the observed number of events, the only remaining uncertainty in the simulation was the model cross section itself and this procedure adjusts the model on a bin-by-bin basis to reproduce the data. In this procedure, any imperfections in the simulation (radiative corrections, acceptance, etc.) could modify the cross section, and we evaluated each of the aspects of the simulation to account for these uncertainties [25]. As discussed in the following sections, the main observable we are interested in for the extraction of is the ratio of 3H and 3He cross sections, integrated over the QE peak. The extracted cross sections have an estimated point-to-point systematic uncertainties from 1.8–2.8% and a normalization uncertainty of 3%. In taking this ratio, many sources of uncertainty, including most of the largest ones, cancel out and we are left with a much smaller systematic uncertainty. We note that for the R42 setting, GeV2, the cross sections for 3H, 3He, and 2H were all about 15% below out simple QE cross section model. Because this was the largest angle, the spectrometer sees the largest effective target length and the fact that target length acceptance wasn’t sufficiently well reconstructed for long targets in the Monte Carlo led to a reduced cross section. This effect should cancel in the ratios, and we tested this by comparing the ratio with the standard cut and with a 4 cm cut. The tighter cut raised the absolute cross sections for all targets but had minimal impact on the various cross section ratios (typically 0.5%). For the extraction of the QE cross section ratio, we treat this data set consistently with all the others and apply an additional 1% uncertainty in the ratio to account for the possible target-dependent impact of the imperfect modeling of the target length acceptance.
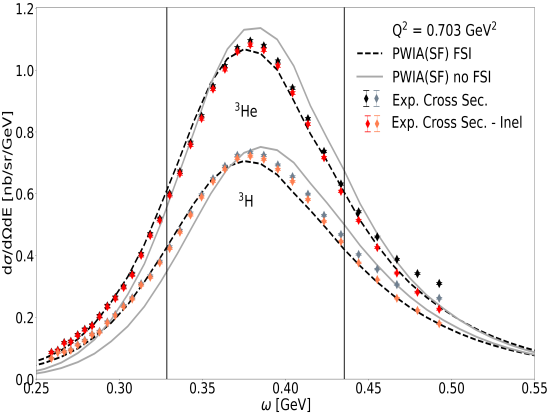
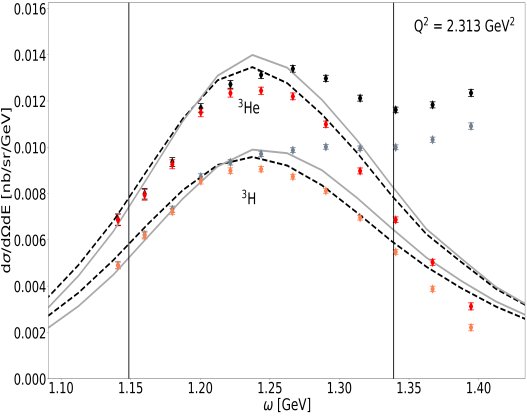
Figure 2 shows the 3H and 3He cross sections from setting L24 and R24, along with calculations based on Ref [30]. On the high side, we have subtracted the inelastic contribution using the model of Ref. [31] but with a modified meson-exchange contribution (MEC) (discussed below). Even where the subtraction is large, the inelastic-subtracted result is in fairly good agreement with the calculation, and because the subtraction is similar for both targets, the impact of the inelastic subtraction on the cross section is smaller when taking the ratio.
For the extraction, we integrated over the QE peak using only the statistical uncertainties, take the 3H/3He ratio, and then apply the contribution of uncertainties that do not cancel. The estimated point-to-point uncertainty is 0.75% for all values, where the major sources are from model and cut dependence in the cross section extraction, radiative corrections, and 3He contamination. The normalization uncertainty, common for all values, is 1.16%, dominated by the target thickness uncertainty of 1.08%. While there were two different 3H targets used, the target thickness uncertainties are dominated by our knowledge of the equation of state and calibration of the pressure and temperature measurements which were identical for both run periods.
We integrate over the central region of the peak for both nuclei, and take the 3H/3He cross section ratio. We choose an integration range of 1 standard deviation (as determined by a gaussian fit to the calculations) to minimize our sensitivity to any disagreement in the low- tail and to the inelastic subtraction which is larger on the high- side. We also apply a small offset in to the calculations for both targets, so that the peak positions are consistent with the data. This way we ensure that we are integrating around the center of the QE peak for both data and simulation. This, combined with the symmetric integration region around the peak, minimizes sensitivity to any residual offset.
As noted earlier, the cross section ratio is approximately , allowing for an extraction of . There is a small correction factor, , that accounts for the difference in nuclear effects and the impact of integrating the QE peak over a finite range (). We use cross section calculations [30] to determine , the difference between this simplified approximation and the full QE cross section ratio, integrated over the central part of the QE peak. The impact of off-shell effects is also accounted for in the extraction of from these calculations, but they are a very small correction as the n/p cross section ratio is much less modified by off-shell effects than the individual cross sections.
In addition, we vary the integration region for the data and model, changing the 1 integration limits by 0.5, excluding cases where this adds regions with no new data or where the inelastic subtraction was large. Based on the variation of the final result for with the variation of the cuts, we apply a 0.3% uncertainty to both point-to-point and normalization uncertainties, to account for the chosen integration window.
The functional form of the MEC to the inelastic model [31] was not intended to cover the low- side of the QE peak, and gives an unrealistically large contribution, especially at low . To avoid a large over-subtraction, we modified MEC contribution using different cutoff functions that reduced the low- contributions, as described in the Supplemental Material [32]. We compared these results to subtractions using no MEC and calculations [33] based on Ref. [34]. While the calculated MEC were smaller then our modified parmaterization, they yielded a somewhat larger correction due to the difference in the isospin structure. For the final results, we take the ratio based on our intermediate truncated MEC parameterization [32], applying a 100% uncertainty on the MEC subtraction, which roughly covers the range of all of the methods discussed above.
We extract by multiplying the extracted value of by the proton cross section from the parameterization of Ref. [35] that does not include corrections for two-photon exchange (TPE), taking a 1% uncertainty on the value of . We then apply TPE corrections to the extracted , based on the calculations from Ref. [36] (0.5%) to obtain in the Born approximation. We subtract the charge contribution to the elastic cross section (typically 5% of the total) using the value and uncertainty of from Ref. [12] to obtain .
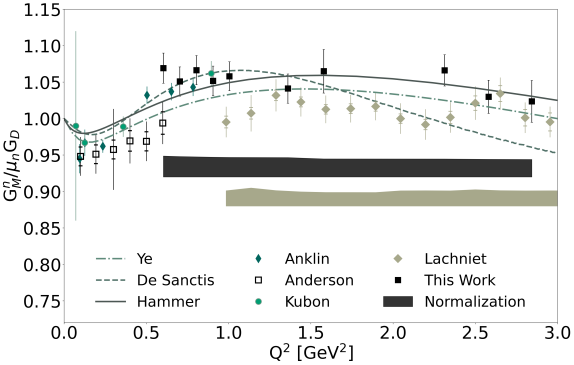
The extracted values of are shown in Fig. 3, along with a subset of previous measurements including the highest precision data sets and measurements covering a significant range. These are the data sets we use in the fit described below, and data sets with only one or two points and large uncertainties do not contribute significantly to the fit. Our results are in good agreement with the Mainz extractions [8, 9], and somewhat higher than previous JLab extractions from polarization [10] and cross section ratio [11] extractions. However, given our 2.5% correlated uncertainty, our results are only 2-3 above these experiments.
We note that the previous extractions shown in Fig. 3 include only statistical and uncorrelated systematic uncertainties. However, it is likely that several of these uncertainties have a correlated component that is better approximated as a normalization uncertainty. These include corrections associated with the proton and neutron detection efficiencies, detector acceptance, and radiative corrections. Beyond experimental corrections, extracting from the cross section ratios or polarization observables requires models for nuclear effects, knowledge of the electron-proton cross section, final-state interactions, off-shell effects, etc…, whose uncertainties can have a significant correlated component. In addition, our improved understanding of hard TPE effects [36] suggests an additional correction and uncertainty that was not considered in the original extractions. Based on a examination of the dominant uncertainties in these works, we estimate that these experiments have correlated uncertainties on their extracted values of that vary between 1.4-2%, including the impact of TPE corrections which were ignored in the original results. This is somewhat smaller than for our measurement, largely because isolating the neutron from the 3H/3He ratio has a greater ‘dilution’ of the signal, amplifying the uncertainties on 3H/3He in the extraction.
To examine the significance associated with these correlated uncertainties, we perform a global fit after applying a 1.5% normalization uncertainty on each of the previous data sets, based on an estimate of their correlated experimental and model-dependent uncertainties. We fit to a 3rd order inverse polynomial, neglecting the normalization uncertainties, and obtain for 36 degrees of freedom. If we allow the normalization of each data set to vary, with a penalty based on its normalization uncertainty, the fit gives for 36 degrees of freedom, bringing the data sets into good agreement even without an overly-flexible fitting function.
When we account for the estimated normalization uncertainties for the various data sets, we find that they are in excellent agreement. While our normalization uncertainty is somewhat larger than we estimated for the previous measurements, the fact that our data set has overlap with the Anklin, Lachniet, and Anderson extractions allow it to provide an improved cross-normalization of the various data sets.
In conclusion, we have extracted for values from 0.6-2.9 GeV2, with 2% point-to-point uncertainties and an additional correlated uncertainty of 2.6%. Part of the normalization uncertainty comes from our subtraction of the MEC, so this extraction can be improved with better understanding of the MECs. The current uncertainties, combined with the coverage of these data, allows us to better constrain the normalization of various data sets. This led us to reexamine the correlated uncertainties in previous data sets, and demonstrates that the data sets are consistent within their uncertainties, taking our estimate of 1.5% normalization uncertainty for the previous measurements. This suggests that overall understanding of could be further improved with the inclusion of data sets covering a large range, even with a significant normalization uncertainty, or with the addition of a new highly precise and accurate measurement, even with a very limited range or single point.
Acknowledgements.
We acknowledge useful discussions with J. Amaro, O. Benhar, and M. Sargsian and the contribution of the JLab target group and technical staff for design and construction of the Tritium target and their support running this experiment. This work was supported in part by the Department of Energy’s Office of Science, Office of Nuclear Physics, under contracts DE-AC02-05CH11231, DE-FG02-88ER40410, DE-SC0014168, DE-FG02-96ER40950, and DE-SC0014168, the National Science Foundation, including grant NSF PHY-1714809, the Science Committee of Republic of Armenia under grant 21AG-1C085, and the Tsinghua University Initiative Scientific Research Program, and DOE contract DE-AC05-06OR23177 under which JSA, LLC operates JLab.References
- Kelly [2002] J. J. Kelly, Phys. Rev. C 66, 065203 (2002), arXiv:hep-ph/0204239 .
- Miller [2007] G. A. Miller, Phys. Rev. Lett. 99, 112001 (2007), arXiv:0705.2409 [nucl-th] .
- Miller and Arrington [2008] G. A. Miller and J. Arrington, Phys. Rev. C 78, 032201 (2008), arXiv:0806.3977 [nucl-th] .
- Lung et al. [1993] A. Lung et al., Phys. Rev. Lett. 70, 718 (1993).
- Bruins et al. [1995] E. E. Bruins et al., Phys. Rev. Lett. 75, 21 (1995).
- Markowitz et al. [1993] P. Markowitz et al., Phys. Rev. C 48, R5 (1993).
- Anklin et al. [1994] H. Anklin et al., Phys. Lett. B 336, 313 (1994).
- Anklin et al. [1998] H. Anklin et al., Phys. Lett. B 428, 248 (1998).
- Kubon et al. [2002] G. Kubon et al., Phys. Lett. B 524, 26 (2002), arXiv:nucl-ex/0107016 .
- Anderson et al. [2007] B. Anderson et al. (Jefferson Lab E95-001), Phys. Rev. C 75, 034003 (2007), arXiv:nucl-ex/0605006 .
- Lachniet et al. [2009] J. Lachniet et al. (CLAS), Phys. Rev. Lett. 102, 192001 (2009).
- Ye et al. [2018] Z. Ye, J. Arrington, R. J. Hill, and G. Lee, Physics Letters B 777, 8 (2018).
- De Sanctis et al. [2007] M. De Sanctis, M. M. Giannini, E. Santopinto, and A. Vassallo, Phys. Rev. C 76, 062201 (2007), arXiv:nucl-th/0506033 .
- Hammer and Meissner [2004] H. W. Hammer and U.-G. Meissner, Eur. Phys. J. A 20, 469 (2004), arXiv:hep-ph/0312081 .
- Arrington et al. [2007a] J. Arrington, C. D. Roberts, and J. M. Zanotti, J. Phys. G 34, S23 (2007a), arXiv:nucl-th/0611050 .
- Perdrisat et al. [2007] C. F. Perdrisat, V. Punjabi, and M. Vanderhaeghen, Prog. Part. Nucl. Phys. 59, 694 (2007), arXiv:hep-ph/0612014 .
- Arrington et al. [2011a] J. Arrington, K. de Jager, and C. F. Perdrisat, J. Phys. Conf. Ser. 299, 012002 (2011a), arXiv:1102.2463 [nucl-ex] .
- Jourdan et al. [1997] J. Jourdan, I. Sick, and J. Zhao, Phys. Rev. Lett. 79, 5186 (1997).
- Bruins et al. [1997] E. E. W. Bruins et al., Phys. Rev. Lett. 79, 5187 (1997).
- Santiesteban et al. [2021] S. N. Santiesteban et al., arXiv:2110.06281 (2021).
- Alcorn et al. [2004] J. Alcorn et al., Nucl. Instrum. Meth. A 522, 294 (2004).
- Li et al. [2022] S. Li et al., Nature 609, 41 (2022).
- Cruz-Torres et al. [2019] R. Cruz-Torres et al., Phys. Lett. B 797, 134890 (2019).
- Cruz-Torres et al. [2020] R. Cruz-Torres et al., Phys. Rev. Lett. 124, 212501 (2020).
- Santiesteban [2021] S. N. Santiesteban, “Ph.D Thesis, University New Hampshire,” (2021).
- Brajuskovic et al. [2013] B. Brajuskovic, T. O’Connor, R. Holt, J. Reneker, D. Meekins, and P. Solvignon, Nucl. Instrum. Meth. A 729, 469 (2013).
- Santiesteban et al. [2019] S. N. Santiesteban et al., Nucl. Instrum. Meth. A 940, 351 (2019), arXiv:1811.12167 [physics.ins-det] .
- Dasu et al. [1994] S. Dasu et al., Phys. Rev. D 49, 5641 (1994).
- Arrington et al. [2021] J. Arrington et al., Phys. Rev. C 104, 065203 (2021).
- Andreoli et al. [2022] L. Andreoli, J. Carlson, A. Lovato, S. Pastore, N. Rocco, and R. B. Wiringa, Phys. Rev. C 105, 014002 (2022), arXiv:2108.10824 [nucl-th] .
- Bosted and Mamyan [2012] P. E. Bosted and V. Mamyan, arXiv:1203.2262 (2012).
- [32] Supplemental Material.
- Amaro et al. [2022] J. E. Amaro, V. L. Martinez-Consentino, and I. R. Simo, private communication (2022).
- Martinez-Consentino et al. [2021] V. L. Martinez-Consentino, I. Ruiz Simo, and J. E. Amaro, Phys. Rev. C 104, 025501 (2021).
- Arrington et al. [2007b] J. Arrington, W. Melnitchouk, and J. A. Tjon, Phys. Rev. C 76, 035205 (2007b).
- Arrington et al. [2011b] J. Arrington, P. G. Blunden, and W. Melnitchouk, Prog. Part. Nucl. Phys. 66, 782 (2011b).