Infrared spectroscopy of the 2022 eruption of the recurrent nova U Sco
Abstract
We present near-infrared spectroscopy of the 2022 eruption of the recurrent nova U Sco, over the period from 5.4 to 45.6 days after outburst. This is the most intensive infrared study of this nova. Our observations started early after the outburst and extended almost to the end of the “Super Soft” X-ray phase. A major find is the presence of coronal lines from day 9.41, one of the earliest appearances of these in any nova, classical or recurrent. The temperature of the coronal gas is K. There is also evidence for the presence of much cooler ( K) gas. Remarkable changes are seen in the He i 1.083m line, the strength of which declines, then recovers, in anti-correlation with the X-ray behaviour. We conclude that shock ionisation is the dominant excitation mechanism for the coronal line emission. There is evidence in the infrared spectra for the presence of black body emission at K, which we tentatively identify with the irradiated secondary, and for free-free/free-bound emission. For the previously determined binary inclination of , the implied ejection velocities are as high as 22000 km s-1. These velocities appear unprecedented in nova outflows, and are comparable to those seen in supernovae, thereby marking U Sco as a truly remarkable object.
keywords:
stars: individual: U Sco — novae, cataclysmic variables — infrared: stars1 Introduction
Recurrent novae (RNe) are a subset of the cataclysmic variable binary systems in which a cool component (the secondary) transfers matter via an accretion disk (AD) onto a white dwarf (WD; the primary). The base of the layer accreted on the WD becomes degenerate, and eventually hot enough to initiate a thermonuclear runaway, resulting in a nova eruption. In time, accretion resumes and eventually another eruption occurs. All novae are recurrent but the eruptions of RNe repeat on timescales yr (see Anupama, 2008, for a review).
2 U Sco: nature and recent eruptions
2.1 The binary
U Sco is the most frequent eruptor of the known Galactic RNe. It is known to have undergone eruptions in 1863, (1873, 1884, 1894), 1906, 1917, (1927), 1936, 1945, (1955), 1969, 1979, 1987, 1999, 2010 (2016) (dates in brackets are probable eruptions; see Darnley, 2021; Schaefer, 2022). U Sco is an eclipsing binary, consisting of a M⊙ WD and a M⊙ secondary; its inclination is (Thoroughgood et al., 2001). The orbital period prior to the 2022 eruption was days, as measured from 2016.78 (the time of the putative 2016 eruption) to 2022.4 (Schaefer, 2022). Schaefer also found an increase of 22.4 parts-per-million in the orbital period across the 2010 eruption, concluding that the period change is most likely due to the reaction of the binary to the asymmetric ejection of material during the nova eruption.
While the uncertainty is relatively large, the mass of the WD in U Sco seems uncomfortably high, although the mass limit for differentially rotating white dwarfs can be as high as 4 M⊙, i.e., far higher than the canonical Chandrasekhar limit (e.g., Yoon & Langer, 2005). Hachisu et al. (2000) modelled the light curve from the 1999 eruption, and found a WD mass of M⊙, very close to that found by Shara et al. (2018) on the basis of modelling the eruptions of classical and RNe. We assume 1.37 M⊙ here. The secondary star is a sub-giant of spectral type K2 (Anupama, 2008). Therefore, unlike RN systems such as RS Oph, in which the secondary is a red giant with a strong wind, the secondary in U Sco is evolved but has little or no wind. For this reason the evolution of an eruption in U Sco is expected to differ significantly from that in a RN system with a giant secondary.
There is evidence that less mass is ejected during an eruption of U Sco than is accreted by the WD between outbursts (Kahabka et al., 1999), suggesting that the WD mass in U Sco is increasing. As the WD likely has CO composition (Mason, 2013), U Sco is a candidate Type Ia supernova progenitor (Starrfield et al., 2020).
The distance of U Sco is poorly constrained (Schaefer, 2010), but is known to be large, between kpc and kpc. Where we need to use a distance here, we use 10 kpc.
2.2 A brief summary of three recent eruptions
The 1979 eruption of U Sco was observed at ultraviolet wavelengths by Williams et al. (1981), and at optical and ultraviolet wavelengths by Barlow et al. (1981). While both studies noted the presence of high ionisation states, such as C iv, N v, O iv, O vi, they did not report any forbidden lines. Indeed, Anupama (2008) stated that, up until the 1999 eruption, no forbidden lines had been reported during outburst. Barlow et al. and Williams et al. also estimated that the ejecta mass was low, M⊙, and that there was evidence for an overabundance of He relative to H.
The 1999 eruption was observed in the optical by Munari et al. (1999). These authors reported a narrowing of H, implying a deceleration of km s-1 day-1, and an increase in the degree of ionisation as the eruption progressed. Anupama et al. (2013) found short-term spectral variations during the 2010 eruption, and reported intrinsic linear polarisation due to electron scattering from the disc and jets. They estimated the mass of ejected hydrogen was M⊙. Maxwell et al. (2012) determined that the helium abundance in the ejecta was not significantly different from solar, in contrast to previous estimates, which had ranging from 0.16 to 4.5 (Evans et al., 2001; Iijima, 2002). In an erratum, Maxwell et al. (2015) gave . All post-1979 eruptions have been characterised by high ejection velocities ( km s-1; e.g., Barlow et al., 1981; Williams et al., 1981; Iijima, 2002; Anupama et al., 2013).
Drake & Orlando (2010) carried out 3-dimensional hydrodynamic simulations of the 2010 eruption. They found that, as the ejecta encountered the secondary star, the secondary gave rise to a “bow shock”, in which the ejecta were shocked to a temperature of a few K. They further concluded that high wind and equatorial gas densities result in X-ray emission that exceeded the observational upper limits, and that the circumstellar gas density is therefore rather low. Hachisu et al. (2000) modelled the light curve of the 1999 eruption, and concluded that the “burning” phase of the eruption, which is accompanied by a strong wind, persisted for the first days of the eruption. In this case one might expect the bow shock associated with the secondary to persist for that length of time.
Near-infrared (NIR) observations were obtained during the eruptions of 1999 (Evans et al., 2001) and 2010 (Banerjee et al., 2010; Mason et al., 2012; Maxwell et al., 2012; Rudy et al., 2022). Evans et al. (2001) noted the presence of an excess in the continuum, which they attributed to free-free emission. Evans et al. reported that there were no coronal lines in the 1999 eruption spectrum, but it is likely that the strong line at m in their data was [Al ix] m rather than He i 2.059m (see below). This is also likely to be the case for the line at approximately the same wavelength seen in the 2010 eruption and tentatively identified as He i by Mason et al. (2012). Following the report of coronal line emission in the 2022 eruption (Banerjee et al., 2022), Rudy et al. (2022) reported re-examinations of their spectra of the 2010 outburst, and those of other observers (e.g., Banerjee et al., 2010; Mason et al., 2012; Maxwell et al., 2012). They noted the presence of coronal lines in the 2010 outburst as well, which either had not been identified, or had gone unnoticed.
2.3 The 2022 eruption
| 2022 Date | MJD | Instrument | Resolution∗ | range | Airmass | Day† | |||
| () | (m) | U Sco | Standard | (mag) | (K) | ||||
| June 12 | 59742.10 | F2 | 200-1200 | 0.9–2.5 | 1.06 | 1.08 | 5.38 | — | — |
| June 16 | 59746.13 | F2 | 200-1200 | 0.9–2.5 | 1.03 | 1.04 | 9.41 | ||
| June 17 | 59747.14 | F2 | 200-1200 | 0.9–2.5 | 1.25 | 1.19 | 10.42 | ||
| 59747.14 | F2 | 1700-3200 | 2.00–2.32 | 1.23 | 1.19 | ′′ | |||
| June 19 | 59749.11 | F2 | 200-1200 | 0.9–2.5 | 1.03 | 1.03 | 12.39 | — | |
| 59749.11 | F2 | 1700-3200 | 2.00–2.32 | 1.03 | 1.03 | ′′ | |||
| June 20 | 59750.47 | SpeX | 1200 | 0.7–2.55 | 1.65 | 1.55 | 13.75 | — | — |
| June 30 | 59760.08 | F2 | 200-1200 | 0.9–2.5 | 1.03 | 1.03 | 23.36 | ||
| 59760.08 | F2 | 1700-3200 | 2.00–2.32 | 1.03 | 1.03 | ′′ | |||
| July 5 | 59765.10 | F2 | 200-1200 | 0.9–2.5 | 1.19 | 1.19 | 28.38 | — | |
| 59765.10 | F2 | 1700-3200 | 2.00–2.32 | 1.27 | 1.32 | ′′ | |||
| July 16 | 59776.27 | GNIRS | 1200 | 0.9–2.5 | 1.29 | 1.26 | 39.55 | — | |
| July 22 | 59782.32 | GNIRS | 1200 | 0.9–2.5 | 1.34 | 1.32 | 45.60 | — | |
| ∗See http://www.gemini.edu/instrumentation/flamingos-2/components#Grisms for how for F2 varies across the spectral interval. | |||||||||
| was at MJD 59736.72. | |||||||||
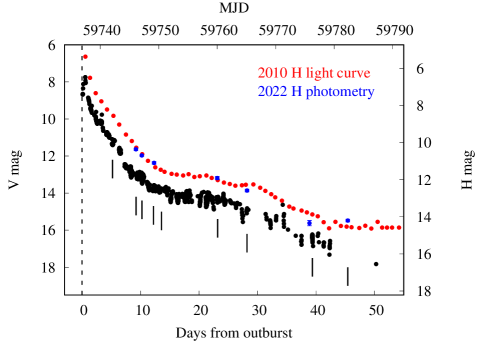
U Sco was reported to be in outburst on 2022 June 06.72 (MJD 59736.72; Moriyama, 2022), which we take as the time origin. The visual light curve from the AAVSO archive111https://www.aavso.org/ is shown in Fig 1.
The 2022 eruption has been extensively observed at radio (Sokolovsky et al., 2022), optical (Siviero & Munari, 2022; Woodward et al., 2022) and X-ray (Orio & Gendreau, 2022; Page et al., 2022; Page & Osborne, 2022) wavelengths. Preliminary descriptions of NIR observations were given by Banerjee et al. (2022) and Rudy et al. (2023). We present here the complete series of our NIR spectroscopic observations.
3 Observations
3.1 Gemini Observatory
Infrared spectra covering all, or portions, of the 0.9–2.5m wavelength interval were obtained at the Gemini South and North telescopes from 2022 June 12 to 2022 July 22 using the facility instruments FLAMINGOS-2 (F2; Eikenberry et al., 2004) and the Gemini Near-InfraRed Spectrometer (GNIRS; Elias et al., 2006). Observing details are provided in Table 1. Most of the spectra were obtained with the and grisms in F2, each of which provides resolving powers, , ranging from 200 to 1400 (corresponding to 200–1500 km s-1). Several higher resolution spectra of a large portion of the band were obtained with F2’s R3k grism. GNIRS in its cross-dispersed mode and its 32mm-1 grating was employed for the final two epochs. Observing times varied from one minute during the early epochs when U Sco was bright, to 32 minutes for the final epoch when it had faded considerably.
A0 dwarfs served as telluric standards. They were observed at air masses closely matching those of U Sco, either immediately before, or immediately after, U Sco. Data reduction utilizing both IRAF (Tody, 1986, 1993) and FIGARO (Currie et al., 2014) employed the standard procedures of spectrum extraction, spike removal, wavelength calibration (using spectra of argon arc lamps), removal of H i lines from the spectra of the standard star, cross-correlating the spectra of U Sco and the telluric standard star, shifting the spectrum of the former to align it with the spectra of the standard star, and ratioing the former by the latter.
3.2 IRTF
NASA Infrared Telescope Facility (IRTF) observations were obtained with SpeX (Rayner et al., 2003) in short-crossed dispersed (SXD) mode with a slit (spectral resolving power 1200, corresponding to km s-1), in sub-arcsec seeing (FWHM [] ) under photometric conditions. The source was nodded between two positions along the slit. These data (comprising 478 s of total on-source integration time) were reduced and corrected for telluric absorption(s), flux calibrated, and order merged with the SpexTool pipeline (Cushing et al., 2004). The A0V standard star (for telluric correction) HD 148968 was observed at comparable air mass. The accuracy of flux calibration of the resultant spectra is %.
Our time coverage is one of the longest over which an eruption of U Sco has been followed in the NIR. A difficulty with following this nova for longer periods is its very rapid fading, the time () to decline by 2 (3) magnitudes from maximum, being 1.2 (2.6) days (Schaefer, 2010).
Where possible, aperture photometry was carried out on acquisition frames obtained in the band to facilitate positioning of the object in the spectrograph slit. Calibration was achieved using multiple field stars with known magnitudes from the 2MASS (Skrutskie et al., 2006) and UKIDSS (Dye et al., 2006) surveys. These magnitudes are listed in Table 1, and included in Fig. 1. This figure also includes the -band light curve from the 2010 eruption (Pagnotta et al., 2015, see that paper for details), on which our band magnitudes are superposed. The 2022 photometry agrees well with the 2010 light curve, and there is excellent agreement between the shapes of the 2010 and 2022 light curves.
4 Overview of the spectra
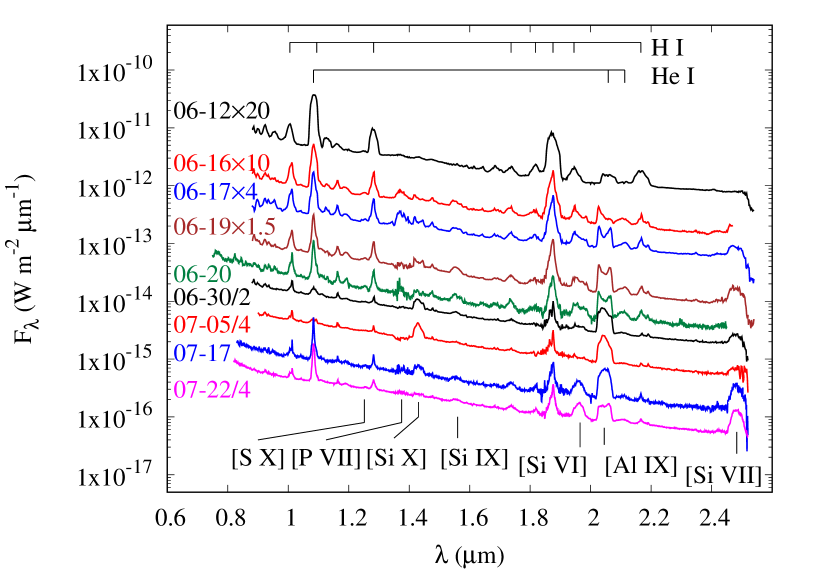
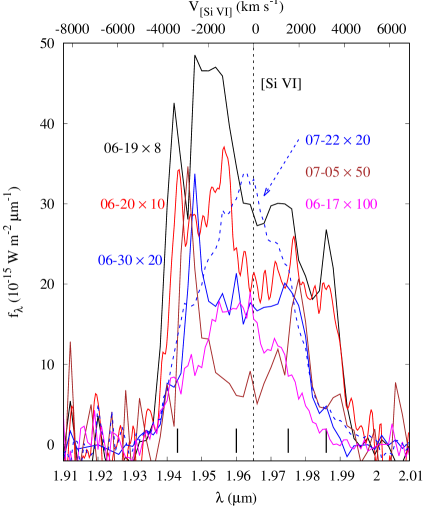
The lower resolution () spectra are shown in Fig. 2 (top panel). H i recombination lines are prominent, but they are not useful for analysis, because they coincide with He ii recombination lines. For example, six He ii lines are close in wavelength to Br at 2.1661m. The strongest of these is the 10–7 transition at 2.1891m, while He ii 14–8 (2.1652m) almost exactly coincides with Br (see Fig. 2, bottom panel).
Low excitation lines are often seen in the IR spectra of novae in eruption (see compilation in Banerjee & Ashok, 2012). However, other than the H i recombination lines, there were no low excitation lines in the IR spectra of U Sco. O i 1.1287m was present up to day 10.42, but the upper level of this transition is pumped by Ly fluorescence, thus pointing to a high excitation environment.
4.1 Coronal lines
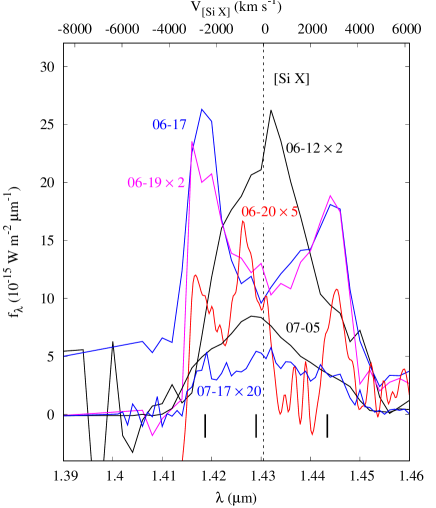
A preliminary account of our data was given by Banerjee et al. (2022), who reported the first identification of coronal lines in an outburst of U Sco. Seven coronal lines: [S ix] 1.252m, [P vii] 1.375m, [Si x] 1.431m, 1.560m, [Si vi] 1.965m, [Al ix] 2.045m and [Si vii] 2.483m were clearly present on day 9.41 (see Fig. 2). The last of these is at the extreme red end of the spectrum (where telluric correction is challenging), which limits its usefulness as a diagnostic. This is one of the earliest detection of coronal lines in any nova, classical or recurrent. Rudy et al. (2023) did not detect any of these coronal lines in a spectrum obtained only 20 hours earlier. We did not detect the [Ca viii] line at 2.321m, which is often seen in the coronal phase of novae.
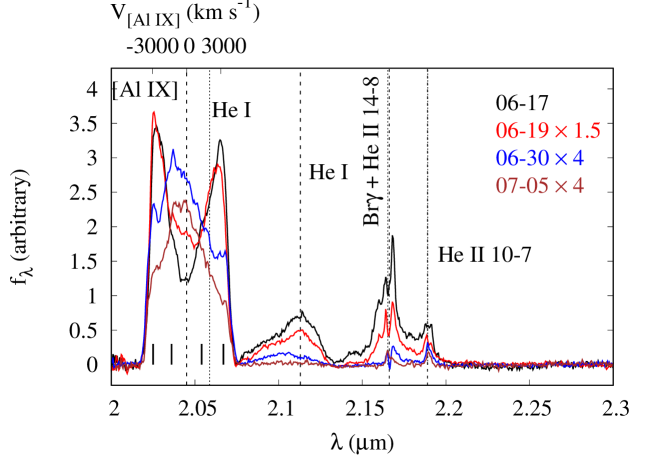
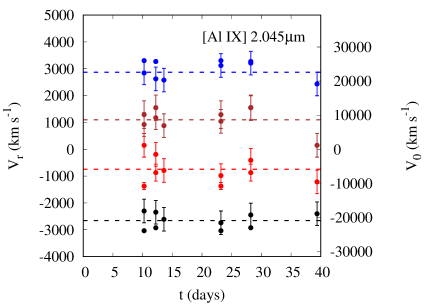
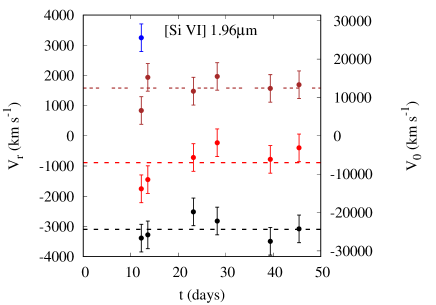
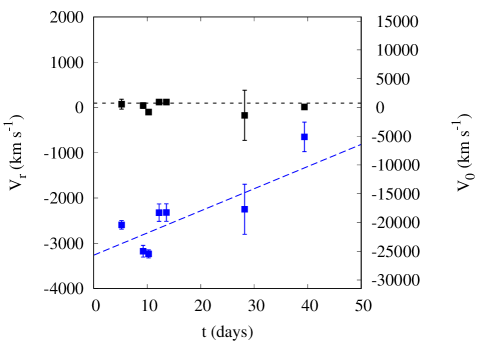
In the spectra of 16 June and later, we consider that the feature at m is mainly due to [Al ix] m. He i m contributed partially on that date, but faded in subsequent spectra. This feature was present in both the low and high resolution data. In all cases the line profile is complex, and can (in common with several other lines) be divided into four components. The evolution of the [Al ix] line, as revealed by the high-resolution data, is shown in Fig 2. Its profile on June 17 and 19 has a characteristic “horned” structure, typical of jets222By “jets” here we mean highly collimated outflows. emitted orthogonal to the binary plane (Menzel & Payne, 1933; Kato & Hachisu, 2003), together with two lower velocity components (the “core”) that likely arise in the binary plane. In time the horns decline in flux, while the core increases relative to the horns. There is no evidence that the velocities, as determined from the peak wavelengths of the lines, changed with time. The mean radial velocities, , for the four components are km s-1, km s-1, km s-1, and km s-1 (see Fig 3, left). Assuming that the horns do indeed arise in jets ejected perpendicular to the binary plane, the velocities, , implied by these components, allowing for the binary inclination of , are km s-1, and km s-1 (see Fig. 3, left).
The above uncertainties are the standard errors in the mean radial velocities; including the uncertainty in the inclination () gives km s-1, and km s-1 respectively. However as U Sco is an eclipsing system, the constraint that the binary inclination , where is the binary separation (6.5 R⊙; Thoroughgood et al., 2001) must be included, so that for a K2IV secondary. This means that the lowest value allowed by these uncertainties is a physical lower limit. Remarkably, such high velocities are comparable to those measured in supernovae in the NIR (e.g., Hsiao et al., 2019).
A further, and compelling reason, to associate the horns with a fast polar flow, orthogonal to the binary orbital plane that contains a material overdensity (Drake & Orlando, 2010), is that they are seen only in the coronal lines, not in the H i lines (see Fig. 2). Assuming geometric dilution of the electron density , the coronal lines are expected to be first seen from regions that have dispersed the most rapidly, allowing the electron density to fall below the critical density for each transition. The kinematics of a bipolar flow, which is collimated by an equatorial overdensity, are such that matter along the polar direction always has the highest velocity, and thus declines most rapidly in density, allowing the emergence of coronal lines. At later times, emission in the coronal lines may be expected to be seen from other regions of the ejecta (e.g., matter in the equatorial region), as it is expanding at lower velocities and will thus take more time to drop below the critical density. The H i lines are likley to have been emitted from all regions of the ejecta. Horned profiles were also seen in the coronal lines, but not in the H and He lines, in the classical nova V5668 Sgr (see Figure 16 of Gehrz et al., 2018), who also argued that they arise in fast flowing polar material.
In our early spectra of the 2022 eruption, the [Si vi] 1.965m line (which was observed at low resolution only) is overwhelmed by Br at 1.9451m, but as the latter fades the [Si vi] line predominates. Its profile over the period June 17 to July 22 is shown in Fig. 4. The mean implied velocities of the horned components, allowing for the binary inclination, are km s-1 and km s-1, where the uncertainties here are the standard errors of the means. Including the uncertainty in the binary inclination gives km s-1 and km s-1 respectively (see Fig. 3, right).
The temperature of the coronal gas can be determined using the iterative method outlined in Woodward et al. (2021) and Evans et al. (2022). We assume (cf. Schaefer, 2010), and use effective collision strengths (i.e., the collision strength averaged over a thermal electron energy distribution) from the Iron Project (Hummer et al., 1993; Lennon & Burke, 1994; Galavis et al., 1997; Badnell et al., 2006) online database333http://cdsweb.u-strasbg.fr/tipbase/home.html, as well from the literature (Brage et al., 2000). The values used are listed in Table 3.
In view of the complexities of the line profiles, one can not simply take ratios of total line fluxes, but must identify individual velocity components. The components most easily isolated are those that have the highest radial velocities, namely the “+2870 km s-1” and “-2660 km s-1” components (i.e., the horns/jets); we refer to these as the “red jet” and “blue jet” components respectively. We use the [Si vi] m and [Si x] 1.403m lines. The Si coronal line ([Si ix] m) is problematic as it is superimposed on higher order members of the hydrogen Brackett series.
The coronal temperatures for these components are listed in Table 2. There is no evidence for any temporal change in for either component, the mean values being ( in K) for the blue jet component, and for the red jet component; the overall mean is ( K, eV), which we use henceforth.
The critical electron densities (above which the upper levels are mainly collisionally rather than radiatively de-excited), are given in Table 3. They have been calculated at , except for [S ix] and [Si vii], for which K is the highest value available in the Iron Project database.
| Date | Day | (K) | |
|---|---|---|---|
| Blue jet | Red jet | ||
| June 16 | 9.41 | 6.03 | 6.01 |
| June 17 | 10.42 | 5.90 | 5.80 |
| June 19 | 12.39 | 5.82 | 5.76 |
| June 30 | 23.36 | 6.02 | 5.90 |
| July 5 | 28.38 | 5.77 | 5.70 |
| July 16 | 39.55 | 5.75 | 5.76 |
| July 22 | 45.60 | 5.90 | 5.83 |
| Line | (m) | IP (eV) | (eV) | (cm-3) | |
| [S ix] | 1.252 | 329 | 137 | 0.907∗ | |
| [P vii] | 1.375 | 220 | 93 | 0.315 | |
| [Si x] | 1.431 | 351 | 146 | 0.415 | |
| [Si ix] | 1.560 | 304 | 127 | 0.275∗ | |
| [Si vi] | 1.965 | 167 | 70 | 0.404 | |
| [Al ix] | 2.045 | 285 | 119 | 0.720 | |
| [Si vii] | 2.483 | 205 | 86 | 0.695∗ | |
| At K. | |||||
4.2 The He i lines
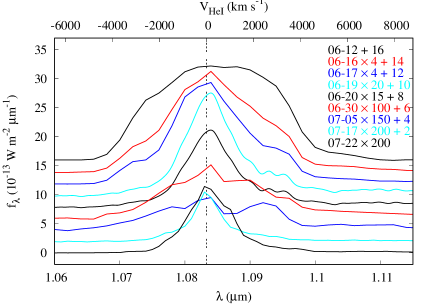
On June 12 (day 5.38), the He i 1.083m line was broad, with at least four components. Thereafter, it consisted of a strong core, with wings to the blue and red (see Fig. 5, top panel). In each spectrum there is almost certainly a contribution from Pa 1.094m, which is superimposed on the contribution from any red wing the He i line may have. For plasma temperatures up to K, the Pa flux is expected to be that of Pa for a wide range of electron densities if “Case B” applies. Thus, for example, on June 16 Pa would have had a peak flux above the adjacent continuum of W m, comparable with W m for the peak of the red wing of the observed feature, and much less than the W m for the peak of He i itself. Therefore, in our analysis below, we consider the blue wing only.
The central wavelengths of the core and blue wings have been converted to radial velocities, as shown in Fig. 5. There is no evidence that the radial velocity of the material responsible for the core component changes with time. The implied radial velocity is essentially zero (mean value km s-1). The mean FWHM of the core emission is km s-1. The wavelength of peak flux of the core is close to zero; thus we conclude that this component arises in material (e.g., a torus) ejected in the orbital plane, almost perpendicular to the plane of the sky.
On the other hand there is some evidence that the material emitting the blue wing decelerated as
where is in days. The implied deceleration is considerably less than that implied by the narrowing of H during the 2010 eruption (Munari et al., 1999), but is of the same order as the deceleration implied by the narrowing of Pa in the 2019 eruption of V3890 Sgr (Evans et al., 2022). The initial radial velocity of the blue wing ( km s-1) is close to that of the [Al ix] line ( km s-1; see Fig. 3, left panel), suggesting that the blue wing of the He i 1.0833m line arises in the same jets as the material responsible for [Al ix]. If this is the case the deprojected velocities approach 25000 km s-1.
| Swift filter: | ||||||
| Effective (Å) = | 5410 | 4321 | 3442 | 2486 | 2221 | 1991 |
| Day∗ | ||||||
| 4.93 | — | — | — | — | ||
| 9.49 | — | |||||
| 9.65 | — | — | — | — | — | |
| 10.49 | ||||||
| 10.63 | — | — | — | — | ||
| 12.49 | ||||||
| 12.71 | — | — | — | — | — | |
| 13.82 | ||||||
| 14.03 | — | — | — | — | ||
| 23.63 | ||||||
| 27.88 | ||||||
| 29.07 | — | — | — | — | ||
| 39.21 | ||||||
| 43.13 | ||||||
| 46.24 | — | — | — | — | ||
| ∗Day numbers, with at MJD 59736.72, are means of individual values. | ||||||
We attribute the feature at 2.116m to a blend of He i 1S–1Po m and 3Po–3S m (see Fig. 2). This feature is commonly seen in erupting novae (Raj, 2015, and references therein), and was present in the 2019 eruption of the RN V3890 Sgr (Evans et al., 2022). In the high resolution spectra, the feature is asymmetric at the earliest epoch, with a weak blue wing superposed on a stronger core. Although the line weakened considerably after day 12, making the properties of the two components difficult to measure, fitting two gaussians to it reveals a picture that is broadly similar to the He i 1.0833m line (see Fig. 5), supporting the view that it is due to He i (rather than [Ca ix]; see Evans et al., 2022). However, there is also a distinct possibility that this feature has a contribution from an unidentified coronal line at m, seen earlier in several classical novae, for example V1974 Cyg (Wagner & Depoy, 1996), V959 Mon (Banerjee et al., Banerjee, Ashok & Venkataraman2012), and V5668 Sgr (Gehrz et al., 2018).
The presence of a He i line in the coronal gas at temperature K is very surprising. At this temperature, essentially all the helium is doubly-ionised (see Arnaud & Rothenflug, 1985). This suggests that there is a region of the circumstellar environment in which the temperature is considerably lower. The data in Arnaud & Rothenflug (1985) suggest that, below K, helium is predominantly neutral, whereas between K and K it is primarily in the form of He ii. He iii predominates above K. We conclude that, in addition to the hot ( K) “coronal” region, there must exist a cooler ( K) region where the helium is neutral. We suggest that this material resides in the torus containing the 750 km s-1 gas, postulated above.
There may be some supporting evidence for the existence of the orbital plane torus in the Swift X-ray data, which imply a hydrogen absorbing column of cm-2 along the line of sight to U Sco. Using the conversion given by Liszt (2014) for the intersellar medium,
together with the assumed , suggests that only cm-2 of this is interstellar. The difference between these values, cm-2, presumably is due to H i in the circumstellar environment. Even allowing for the uncertainty in , the difference is at least cm-2.
To estimate the H i column density in the circumstellar gas, we assume wind density , ejected over a period ( days; Hachisu et al., 2000). The column density at time is
(cf., Evans et al., 2022) where is the mass ejection rate in the eruption and is the mean atomic mass. For a mass-loss rate M⊙ yr-1 (Hachisu et al., 2000), km s-1 for the core component (see above), and ,
where both and are in days, so that cm-2 after days. Given the crudeness of the analysis, and the uncertainty in converting to , this is surprisingly close to the estimated circumstellar contribution to .
4.3 The IR continuum
We have obtained photometry of U Sco from the AAVSO database. We also have UV/Optical Telescope (UVOT) photometry from the Neil Gehrels Swift Observatory (Gehrels et al., 2004), in the (5468Å), (4392Å), (3465Å), (2600Å), (2246Å), (1928Å) filters; the Swift photometry is given in Table 4.
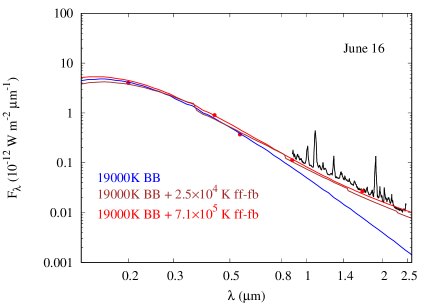
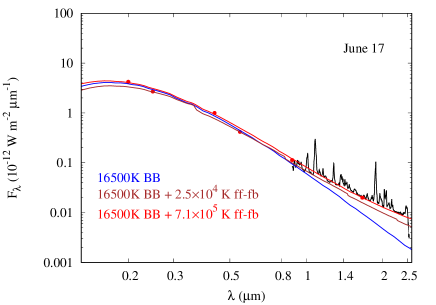
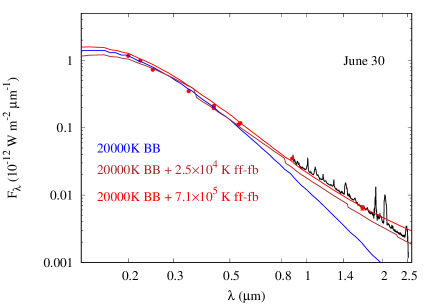
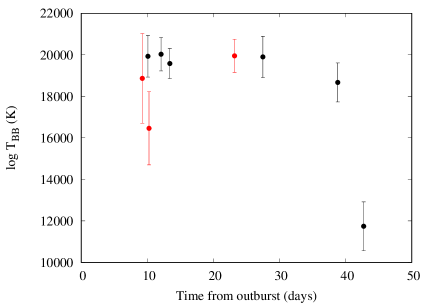
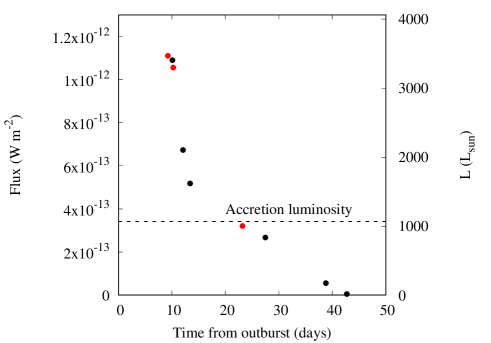
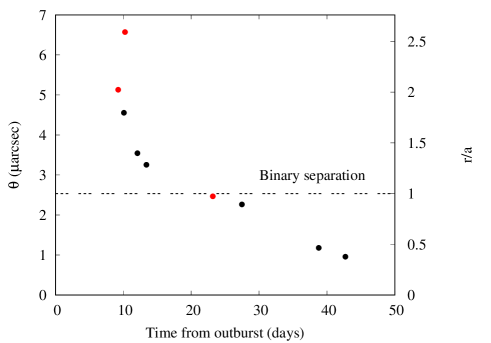
At the shortest (m) wavelengths, the data are reasonably fitted by a black body function. However, for a more satisfactory fit we require photometry at the shortest wavelength (uvw2), together with complementary photometry at longer wavelengths. We select UVOT and AAVSO data within min (% of the orbital period) of the IR spectroscopy. The datasets that satisfy these criteria are for June 16, June 17 and June 30 (see Fig. 6). We have fitted black body curves to the UVOT/ data; the black body temperatures, , are K (June 16), K (June 17), K (June 30). We have also fitted black body curves to Swift data that do not coincide closely with the IR data. Fig. 7 shows the time-dependence of , its bolometric flux and luminosity, and the angular diameter and linear size of the emitter. A distance of 10 kpc has been assumed. The temperature of the black body remained constant ( K) over the 40 days of our IR observations, but its flux/luminosity, and therefore its dimensions, declined significantly.
Evans et al. (2001) suggested that the black body might be the WD itself, but this can not be the case, as the nova is in the “Super Soft” X-ray phase444See e.g. Page, Beardmore & Osborne (2020) for an explanation., and therefore much hotter, at this time (see below). Neither can it be the accretion disc, the bolometric luminosity of which in U Sco is L⊙ for an accretion rate of M⊙ yr-1 (Hachisu et al., 2000) and a 1.37 M⊙ WD of radius 0.01 R⊙. This luminosity is of the same order as that of the black body; moreover, the dimensions are comparable with the binary separation. However, as the disc in U Sco is seen almost edge-on, the observed luminosity of the disc is less than the accretion luminosity. Using the formalism of Paczyński & Schwarzenberg-Czerny (1980) for a standard limb-darkened disc (i.e., one that has not been subject to a nova eruption), we find that the bolometric luminosity of a nearly-edge-on disc is fainter than that of one seen face-on by a factor . In any case it is very likely that the accretion disc is destroyed early in the eruption (Drake & Orlando, 2010).
Might the black body be the secondary star? The K2IV secondary has radius 2.1 R⊙ (Thoroughgood et al., 2001); assuming effective temperature K, typical of field K2 stars (Zombeck, 1990), the bolometric luminosity . Thus the black body can not be the pristine secondary. However, in the absence of the accretion disc (which is destroyed in the eruption), the secondary must be irradiated by the hot WD. We estimate this effect using the formalism of Kovetz, Prialnik & Shara (1988). For a WD temperature given by eV (see Fig. 8 below), the temperature of the irradiated secondary is K, with a corresponding luminosity L⊙. The observed black body temperature is therefore close to that expected for an irradiated secondary, while the luminosity is of the same order. Given the crude nature of our estimates, the irradiated secondary seems the least unlikely explanation.
Notwithstanding the nature of the black body seen in the NIR, the comparison of the Swift and NIR data shows that there is clear excess radiation in the NIR, as noted by Evans et al. (2001). We interpret this as free-free/free-bound emission. We have fitted the excess with a free-free/free-bound continuum, using the observed H flux of ergs s-1 cm-2 (Woodward et al., 2022), which provides an estimate of the continuum level. For simplicitly, we assume that the electrons arise from H and He only, and gas temperatures of K (corresponding to the coronal gas, in which the He is completely ionised) and K (in which the He is neutral). The calculation of the free-free/free-bound emission is done separately for the two temperatures. These are included in Fig. 6. There is essentially no difference between the hotter and the cooler free-free/free-bound emission for June 16 and 30. However the hotter continuum overshoots the UVOT data for June 17; the continuum coming from the cooler gas is in close agreement. We tentatively suggest that the free-free continuum arises in the cooler region from which the He i lines originate (see Section 4.2).
4.4 Coronal line excitation
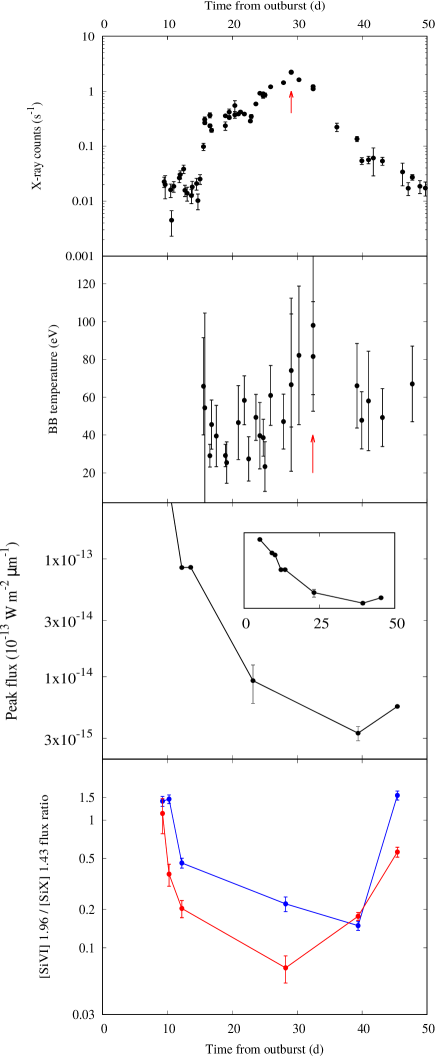
The spectra in Fig. 2 reveal the remarkable fall and rise of the He i 1.0833m line. The dependence of its peak flux (continuum-subtracted) is shown in the lower middle panel of Fig. 8 (estimating the total line flux is complicated due to variations in the line width). The variation in the He line are replicated in the evolution of the [Si vi] emission line at 1.965m, which is seemingly absent after day 23.36, only to reappear on day 39.55. This is demonstrated by the flux ratio [Si vi] 1.96m/[Si x] 1.43m, using the fluxes used to determine the coronal gas temperatures given in Table 2. This ratio, which gives a measure of the relative excitation of the gas, also reaches a minimum at days. These relationships are also shown in Fig. 8, in which the upper two panels are the Swift X-ray counts and black body temperature of the X-ray source. Given the relatively low cadence of our IR observations, the data are consistent with the He i line flux, and the [Si vi]/[Si ix] flux ratio, both reaching minima between days 29.38 and 39.55.
The X-ray counts reach a maximum on day 29.5. The black body temperature (; note the distinction between this black body temperature and that discussed in Section 4.3) of the Swift source, which we identify with that of the WD, peaks at eV ( K), on day 32.9. The X-ray counts and peak at around the same time. Thus there seems to be a correlation between the time of the minima in the fluxes of the He i and [Si vi] lines, and of the peaks in the X-ray counts and .
The behaviour of the flux ratio of the two Si lines (Fig. 8; [Si vi], eV; [Si x]), eV) clearly demonstrates that the degree of ionisation peaked around day , despite the fact that the black body temperature of the Swift X-ray source rarely exceeds eV.
Included in Table 3 are the ionisation potentials of the lower ionisation stages (e.g., the ionisation potential of Si v for [Si vi]), and the temperatures at which half the photons emitted by the corresponding black body can ionise the lower ion (see Woodward et al., 2022). The dependence of on time shows no value on day 5.38 (see Fig. 8), when the X-ray counts were too low to provide a solution. However, at the earliest times, eV, which seems too low to photoionise and produce any of the high-ionisation coronal lines seen (e.g., [Al ix], [Si vii], [Si x]).
We tentatively conclude that shock ionisation and excitation must be operating throughout the eruption, but that photoionisation also contributes, possibly significantly, at around the soft X-ray peak when the WD temperature was at its maximum.
In the absence of a secondary wind (as is present in the case of RNe with giant secondaries), presumably internal shocks arise in collisions between parcels of ejecta moving at different velocities. However a definitive conclusion must await a robust analysis of the dynamics of the eruption.
5 Conclusion
We have presented near-infrared spectra of the RN U Sco, covering the period 5.4 to 45.6 days after its 2022 eruption. This is the most intensive infrared observations of this object. We find that
-
1.
coronal lines were present at 9.41 days after the outburst, one of the earliest appearances of coronal lines in a nova, classical or recurrent;
-
2.
the temperature of the coronal gas was K, and there is evidence for the simultaneous presence of much cooler ( K) gas;
-
3.
there is evidence in the IR data for a 20000 K black body, which we tentatively identify with the secondary, irradiated by the hot white dwarf;
-
4.
the ejecta are distributed partly in polar “jets” in which the coronal lines largely arise, and an equatorial “torus” in the binary plane, from which line emission from the cooler gas originates;
-
5.
for orbital inclination 7, jet ejection velocities as high as km s-1 are implied. These are comparable with velocities seen in some supernovae.
These properties mark U Sco as a truly remarkable system.
Acknowledgements
We thank the referee for their careful and thorough review of the paper.
The Gemini observations were made possible by awards of Director’s Discretionary Time for programmes GS-2022A-DD-105 and GN-2022A-DD-105.
The international Gemini Observatory is a program of NSF’s NOIRLab, which is managed by the Association of Universities for Research in Astronomy (AURA) under a cooperative agreement with the National Science Foundation, on behalf of the Gemini Observatory partnership: the National Science Foundation (United States), National Research Council (Canada), Agencia Nacional de Investigación y Desarrollo (Chile), Ministerio de Ciencia, Tecnología e Innovación (Argentina), Ministério da Ciência, Tecnologia, Inovações e Comunicações (Brazil), and Korea Astronomy and Space Science Institute (Republic of Korea).
The IRTF observations were conducted under programme 2022A003. The Infrared Telescope Facility is operated by the University of Hawaii under contract 80HGTR19D0030 with the National Aeronautics and Space Administration.
CEW acknowledges partial support from NASA grant 80NSSC19K0868. DPKB is supported by a CSIR Emeritus Scientist grant-in-aid and is being hosted by the Physical Research Laboratory, Ahmedabad. RDG was supported by the United States Airforce. KLP acknowledges funding from the UK Space Agency. SS acknowledges partial support from an ASU Regents’ Professorship.
We acknowledge with thanks the variable star observations from the AAVSO International Database contributed by observers worldwide and used in this research.
Data availability
The raw infrared data in this paper are available from the Gemini Observatory
Archive, https://archive.gemini.edu/, and from the IRTF archive,
http://irtfweb.ifa.hawaii.edu/research/irtf_data_archive.php
The Swift data are available from
https://www.swift.ac.uk/swift_live/ and
https://heasarc.gsfc.nasa.gov/cgi-bin/W3Browse/w3browse.pl
References
- Anupama (2008) Anupama G. C., 2008, in RS Ophiuchi (2006) and the Recurrent Nova Phenomenon, Astronomical Society of the Pacific Conference Series, eds A. Evans, M. F. Bode, T. J. O’Brien, M. J. Darnley, vol. 401, p. 31, San Francisco
- Anupama et al. (2013) Anupama G. C., et al., 2013, A&A, 559,A121
- Arnaud & Rothenflug (1985) Arnaud M., Rothenflug R., 1985, A&AS, 60, 425
- Astropy Collaboration et al. (2018) Astropy Collaboration, Price-Whelan, A. M., Sipőcz, B. M., et al., 2018, AJ, 156, 123
- Badnell et al. (2006) Badnell N. R., Bautista M. A., Berrington K. A., et al. 2006, in IAU Symposium 234, Planetary Nebulae in our Galaxy and Beyond, ed. M. J. Barlow, R. H. Méndez (Cambridge: Cambridge University Press), 211
- Banerjee et al. (2010) Banerjee D. P. K., et al., 2010, MNRAS, 408, L71
- Banerjee & Ashok (2012) Banerjee D. P. K., Ashok N. M., 2012, BASI, 40, 243
- (8) Banerjee D. P. K., Ashok N. M., Venkataraman V., 2012, ATel, 4542
- Banerjee et al. (2022) Banerjee D. P. K., et al., 2022, ATel 15451
- Barlow et al. (1981) Barlow M. J., et al., 1981, MNRAS, 195, 61
- Brage et al. (2000) Brage T., Judge P. G., Jönsson P., Edwards D. P., 2000, ApJ, 540, 1114
- Currie et al. (2014) Currie M. J., Berry D. S., Jenness T., Gibb A. G., Bell G. S., Draper P. W., 2014, in Manset N., Forshay P., eds, Astronomical Society of the Pacific Conference Series Vol. 485, Astronomical Data Analysis Software and Systems XXIII. Astron. Soc. Pac., San Francisco, p. 391
- Cushing et al. (2004) Cushing M. C., Vacca W. D., Rayner J. T., 2004, PASP, 116, 362
- Darnley (2021) Darnley M. J., 2021, in The Golden Age of Cataclysmic Variables and Related Objects V. Proceedings of Science, 2-7 September 2019, Palermo, Italy, p. 44
- Drake & Orlando (2010) Drake J. J., Orlando S., 2010, ApJ Letters, 720, L195
- Dye et al. (2006) Dye S., et al.,2006, MNRAS, 372, 1227
- Eikenberry et al. (2004) Eikenberry S. S., et al., 2004, Proc. SPIE, 5492, 1196
- Elias et al. (2006) Elias J. H., Rodgers B., Joyce R., Lazo M., Doppmann G., Winge C., Rodrguez-Ardila A., 2006, Proc. SPIE, 6269, 14
- Evans et al. (2001) Evans A., et al., 2001, A&A, 378, 132
- Evans et al. (2022) Evans A., et al., 2022, MNRAS, 517, 6077
- Galavis et al. (1997) Galavis M. E., Mendoza C., Zeippen C. J., 1997, A&AS, 123, 159
- Gehrels et al. (2004) Gehrels N., et al., 2004, ApJ, 611, 1005
- Gehrz et al. (2018) Gehrz R. D., et al., 2018, ApJ, 858, 78
- Hachisu et al. (2000) Hachisu I., Kato M., Kato T., Matsumoto K., 2000, ApJ, 528, L97
- Hsiao et al. (2019) Hsiao E. Y., et al., 2019, PASP, 131, 014002
- Hummer et al. (1993) Hummer D. G., Berrington K. A., Eissner W., et al., 1993, A&A, 279, 298
- Iijima (2002) Iijima T., 2002, A&A, 387, 1013
- Kahabka et al. (1999) Kahabka P., Hartmann H. W., Parmar A. N., Negueruela I., 1999, A&A, 347, L43
- Kato & Hachisu (2003) Kato M., Hachisu I., 2003, ApJ, 587, L39
- Kovetz et al. (1988) Kovetz A., Prialnik D., Shara M. M., 1988, ApJ, 325, 828
- Lennon & Burke (1994) Lennon D. J., Burke V. M., 1994, A&AS, 103, 273
- Liszt (2014) Liszt H., 2014, ApJ, 783, 17
- Mason (2013) Mason E., 2013, A&A, 556, C2
- Mason et al. (2012) Mason E., Ederoclite A., Williams R. E., Della Valle M., Setiwan J., 2012, A&A, 544, A149
- Maxwell et al. (2012) Maxwell M. P., et al., 2012, MNRAS, 419, 1465
- Maxwell et al. (2015) Maxwell M. P., et al., 2015, MNRAS, 448, 3414
- Menzel & Payne (1933) Menzel D. H., Payne C. H., 1933, PNAS, 19, 641
- Moriyama (2022) Moriyama M., 2022, vsnet-alert 26798
- Munari et al. (1999) Munari U., et al., 1999, A&A, 347, L39
- Orio & Gendreau (2022) Orio M., Gendreau K., 2022, ATel 15436
- Paczyński & Schwarzenberg-Czerny (1980) Paczyński B., Schwarzenberg-Czerny A., 1980, Acta Astron., 30, 127
- Page et al. (2020) Page K. L., Beardmore, A. P., Osborne J. P., 2020, Adv. Sp. Res., 66, 1169
- Page et al. (2022) Page K. L., et al., 2022, ATel 15438
- Page & Osborne (2022) Page K. L., Osborne J. P., 2022, ATel 15465
- Pagnotta et al. (2015) Pagnotta A., et al., 2015, ApJ, 811, 32
- Raj (2015) Raj A., et al., 2015, AJ, 149, 136
- Rayner et al. (2003) Rayner J. T., et al., 2003, PASP, 115, 362
- Rudy et al. (2022) Rudy R. J., Sitko M. L., Russell R. W., Lynch D. K., 2022, RNAAS, 6, 179
- Rudy et al. (2023) Rudy R. J., Sitko M. L., Russell R. W., Lynch D. K., 2023, RNAAS, 7, 26
- Schaefer (2010) Schaefer B. E., 2010, ApJS, 187, 275
- Schaefer (2022) Schaefer B. E., 2022, MNRAS, 516, 4497
- Shara et al. (2018) Shara M. M., Prialnik D., Hillman Y., Kovetz A., 2018, ApJ, 860, 110
- Siviero & Munari (2022) Siviero A., Munari U., 2022, ATel 15417
- Skrutskie et al. (2006) Skrutskie M. F., et al., 2006, AJ, 131, 1163
- Sokolovsky et al. (2022) Sokolovsky K., et al., 2022, ATel 15502
- Starrfield et al. (2020) Starrfield S., Bose M., Iliadis C., Hix W. R., Woodward C. E., Wagner R. M., 2020, ApJ, 895, 70
- Thoroughgood et al. (2001) Thoroughgood T. D., et al., 2001, MNRAS, 327, 1323
- Tody (1986) Tody D., 1986, in Crawford D. L., ed., Proc. SPIE Conf. Ser. Vol. 627, Instrumentation in Astronomy VI. SPIE, Bellingham, p. 733
- Tody (1993) Tody D., 1993, in Hanisch R. J., Brissenden R. J. V., Barnes J., eds, Astronomical Society of the Pacific Conference Series, Vol. 52, Astronomical Data Analysis Software and Systems II, p. 173, Astronomical Society of the Pacific, San Francisco
- Wagner & Depoy (1996) WagnerR. M., Depoy D. L., 1996, ApJ, 467, 860
- Williams et al. (1981) Williams R. E., Sparks W. M., Gallagher J. S., Ney E. P., Starrfield S., Truran J. W., 1981, ApJ, 251, 221
- Woodward et al. (2021) Woodward C. E., et al., 2021, ApJ Letters, 922, L10
- Woodward et al. (2022) Woodward C. E., et al., 2022, ATel 15422
- Yoon & Langer (2005) Yoon S.-C., Langer N., 2005, A&A, 435, 967
- Zombeck (1990) Zombeck M. V., 1990, Handbook of Astronomy and Astrophysics, second edition. Cambridge University Press, Cambridge