Composite Biomarker Image for Advanced Visualization in Histopathology
Abstract
Immunohistochemistry (IHC) biomarkers are essential tools for reliable cancer diagnosis and subtyping. It requires cross-staining comparison among Whole Slide Images (WSIs) of IHCs and hematoxylin and eosin (H&E) slides. Currently, pathologists examine the visually co-localized areas across IHC and H&E glass slides for a final diagnosis, which is a tedious and challenging task. Moreover, visually inspecting different IHC slides back and forth to analyze local co-expressions is inherently subjective and prone to error, even when carried out by experienced pathologists. Relying on digital pathology, we propose “Composite Biomarker Image” (CBI) in this work. CBI is a single image that can be composed using different filtered IHC biomarker images for better visualization. We present a CBI image produced in two steps by the proposed solution for better visualization and hence more efficient clinical workflow. In the first step, IHC biomarker images are aligned with the H&E images using one coordinate system and orientation. In the second step, the positive or negative IHC regions from each biomarker image (based on the pathologists’ recommendation) are filtered and combined into one image using a fuzzy inference system. For evaluation, the resulting CBI images, from the proposed system, were evaluated qualitatively by the expert pathologists. The CBI concept helps the pathologists to identify the suspected target tissues more easily, which could be further assessed by examining the actual WSIs at the same suspected regions.
Index Terms:
immunohistochemistry biomarker, multi-stains visualization, cross-staining comparison, composite biomarker imageI Introduction
Wide adoption of whole slide image (WSI) analysis by the pathologists community helps them to improve and speedup their diagnostic process [1]. Immunohistochemistry (IHC) analysis is a pertinent tool for the detection of specific antigens in tissue sections [2]. It is one of the significant technique for determining the tissue distribution of an antigen of interest in health and disease using monoclonal and polyclonal antibodies [2]. In pathology, IHC is particularly essential in the subspecialties of oncologic pathology, neuropathology, and hematopathology. While basic histologic examination of tissue is considered a helpful and important component of autopsy pathology, IHC may provide more insight [3]. Many literature have discussed about the diagnostic utility of IHC in surgical pathology [4]. IHC’s uses have exploded in recent years as more and more molecules implicated in disease development, diagnosis, and treatment have been found [5]. Combined analysis of multiple antibody expressions and tissue morphology is important for diagnosis, treatment planning and drug discovery [6]. Cellular proteins, morphology, and IHC biomarkers are critical tools for determining if a malignancy is benign or malignant, determining the stage and grade of a tumour, and identifying the cell type and origin of a metastasis in order to locate the primary tumour [7].
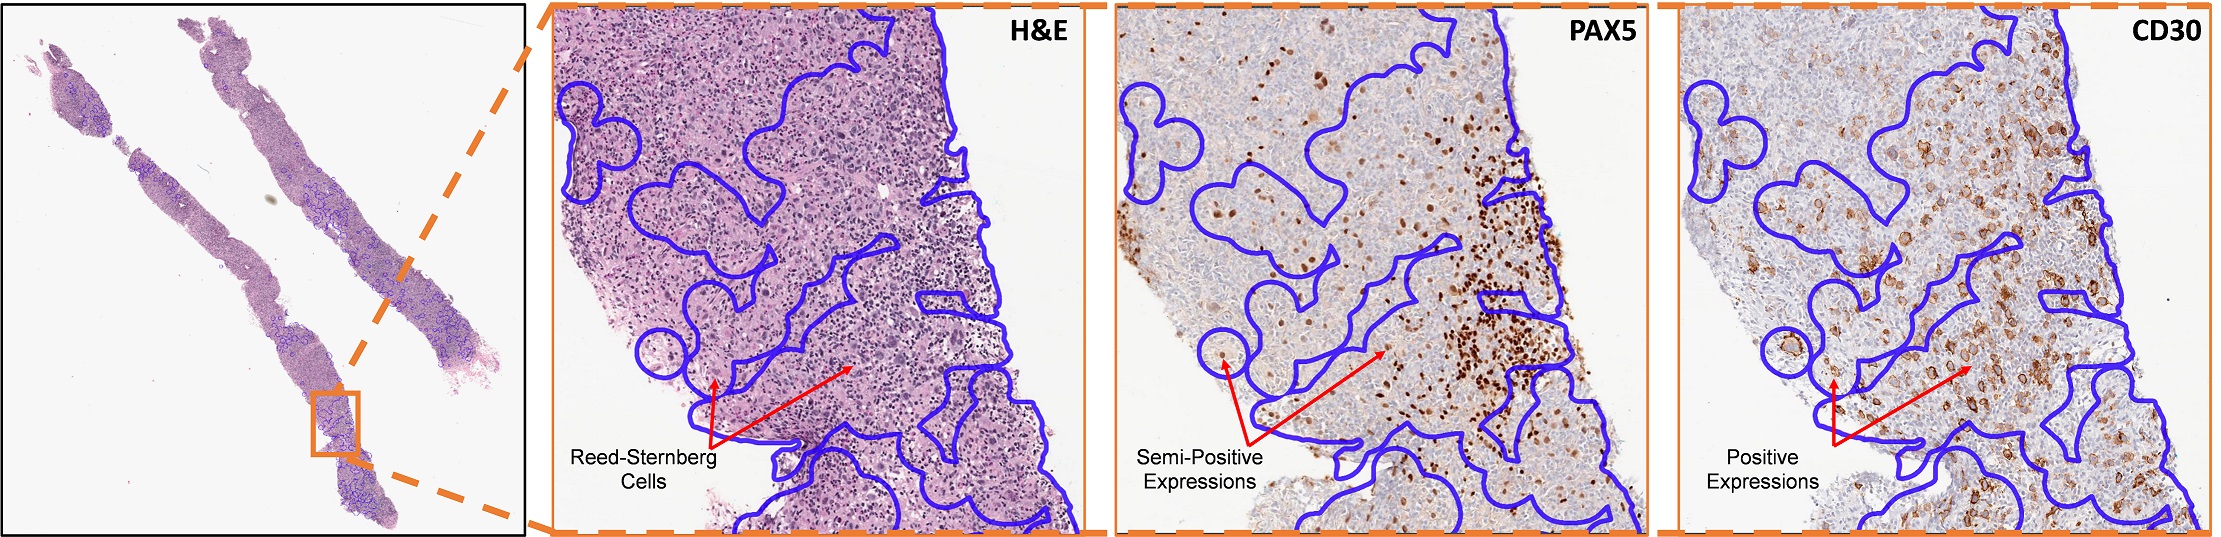
More than 8500 people are diagnosed with Hodgkin Lymphoma (HL) every year in United States, which is nearly 10.2% of all lymphoma cases [8]. Classical Hodgkin Lymphoma (CHL) represents the most common lymphoma sub-type in children and young adults [9]. CHL is prominent among lymphoid malignancies because of its histomorphological appearance [9]. It is important to identify the malignant Reed‐Sternberg cell, which is of follicular center B‐cell origin [10]. Previously, the diagnosis of HL was based on the morphologic identification of Reed-Sternberg cells and variants in the appropriate cellular milieu [11]. Now, the diagnosis of HL relies on the joint analysis of hematoxylin and eosin (H&E) and IHC biomarkers [11]. IHC biomarkers help pathologists to indicate the presence and expression of a chosen protein, which helps them for accurate diagnosis [12]. In the case of CHL, it could be identified when there is the presence of CD30 (+) Hodgkin and Reed-Sternberg cells with light expression of PAX5 (B-lymphocytes) [13]. IHC biomarkers also help the pathologists to distinguish confusing cases such as T-cell histiocyte-rich large B-cell lymphoma, peripheral T-cell lymphomas with CD30-positive cells, and reactive cases with CD30-positive immunoblasts [14, 15].
In literature, few studies are present which are using multiple IHC for analysis and also using them to examine H&E such as Bulten et al. [16] and Solorzano et al. [17]. They are using color deconvolution technique to separate Hematoxylin and Diaminobenzidine (H and DAB), which is not very accurate when it comes to the diagnosis of HL. On the other hand, technique such as multiplex IHC is used to examine co-localisation of expression of markers [11]. However, multiplexed IHC is a complex process and are available only in advanced laboratories [18].
In this study, we performed preliminary experiment on HL by proposing composite biomarker image (CBI) technique, which is composed by superimposing multiple IHC biomarker WSIs. The purpose of this CBI is to assist pathologists with diagnosis accuracy and speed up the process. Furthermore, the pathologists can visualize the selected information from multiple biomarker images in one single image and they don’t have to go back and forth to analyze different images, thus avoiding any confused diagnosis.
The rest of the paper is organized as follows: In Section II, the proposed method is presented along with the data that we used. In Section III, the results from the proposed method are presented. Section IV includes the conclusion and future work insight.
II MATERIALS & METHODS
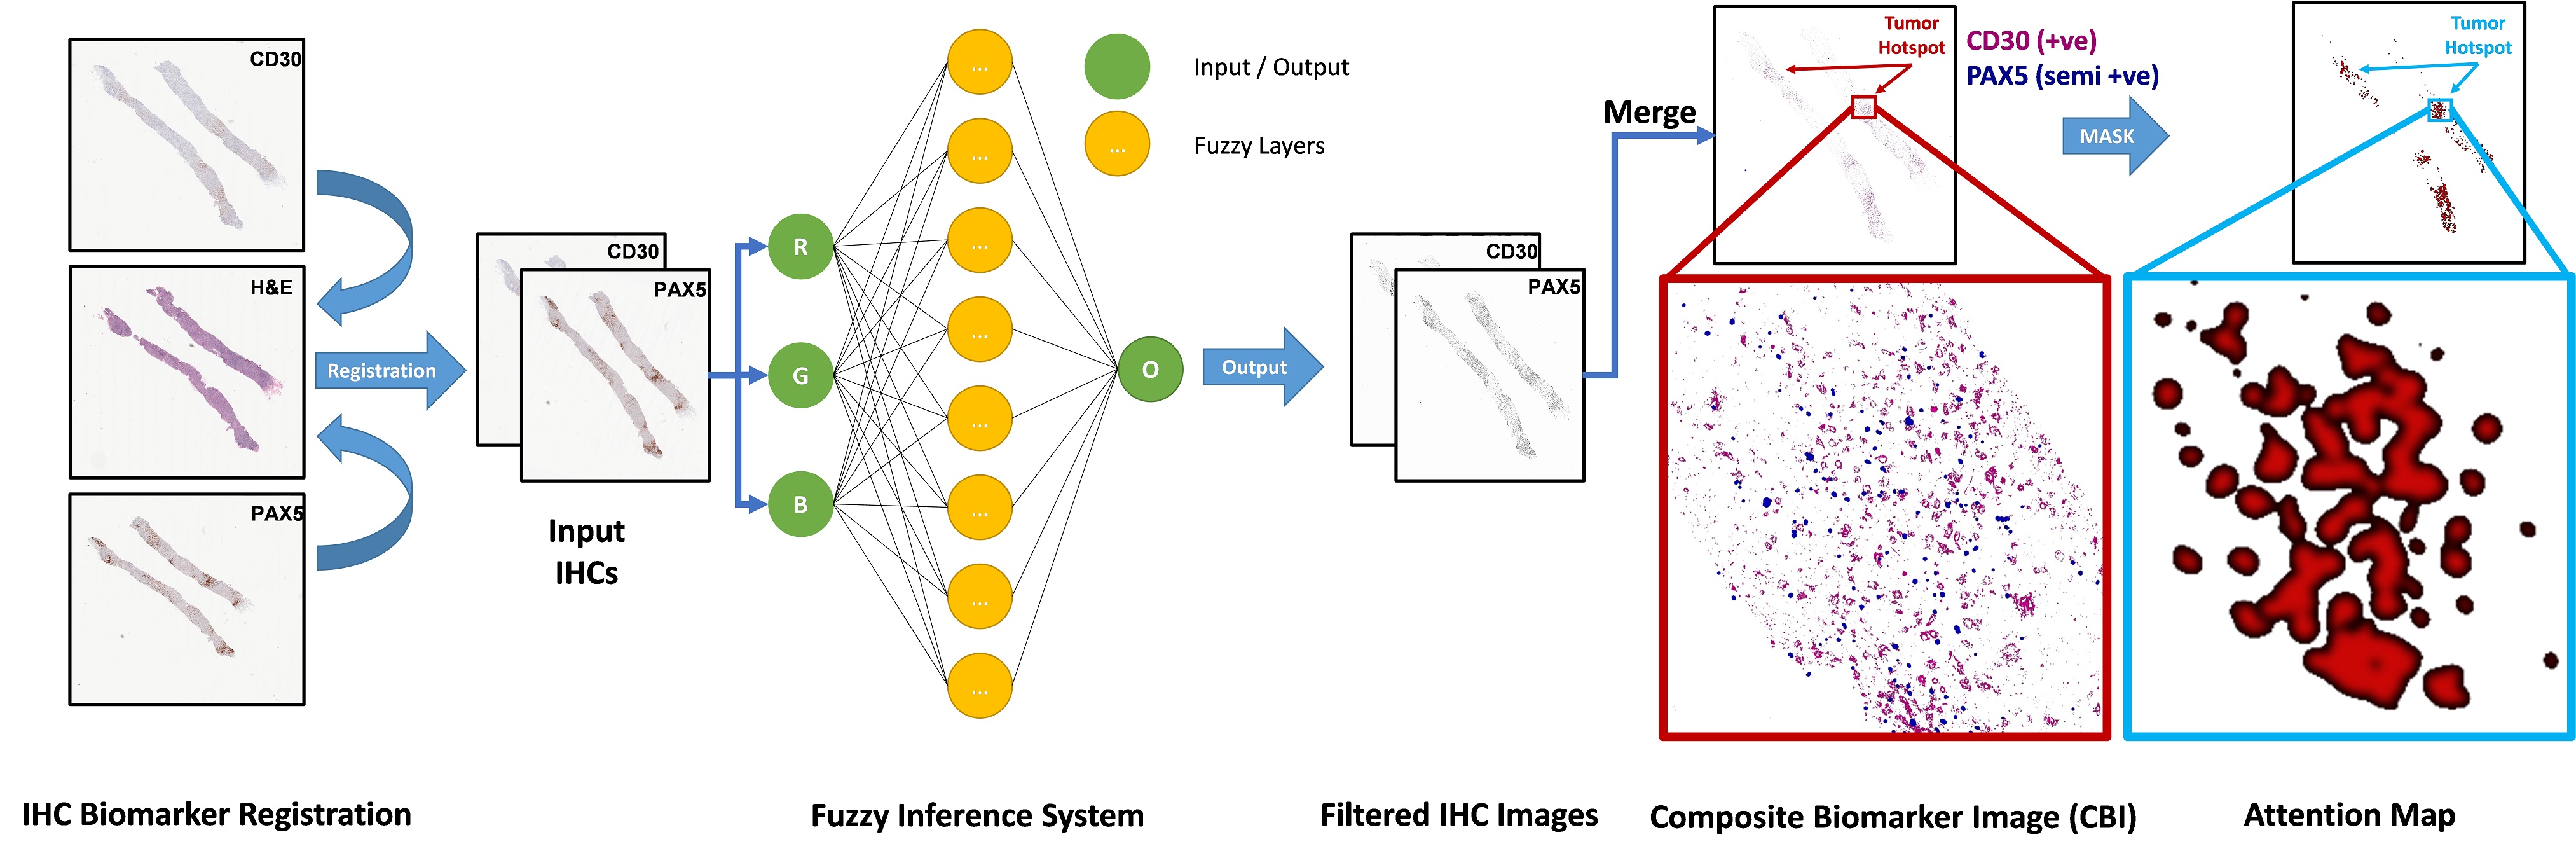
This paper presents a novel CBI image produced in two steps by the proposed system. In the first step, the source biomarker images are registered according to the target H&E image. Furthermore, in the second step, the specific regions (based on the pathologists’ recommendation) from each biomarkers are filtered using fuzzy inference system (FIS), and combined into one image. Fig. 1 illustrates the overall two step process followed by the proposed system to generate a CBI image and attention map.
Adaptive neuro-fuzzy inference system (ANFIS) – First of all, biomarker images are aligned together according to a single coordinate system so that the tissue could be aligned [6]. After aligning the biomarker images, FIS is used to filter and extract the positive or negative information from the biomarker images at single cell level. Here, we used Adaptive neuro-fuzzy inference system (ANFIS) to mimic the pathologists observation about each biomarker, about what they specifically look for in each WSI. ANFIS is the combination of neural networks (NN) and FIS which uses NNs learning algorithms to self tune the rules, parameters, and structure of FIS [19, 20]. For simplicity, we assume a network with three inputs (channels of an image) , and , and one output, [21, 20]. To present the ANFIS architecture, three fuzzy if–then rules based on a first-order Sugeno model are shown below:
Rule 1:
Rule 2:
Rule 3:
where , , and are the inputs, , , and are the fuzzy sets, is the output of the fuzzy system, and , , , and are the design parameters that are calculated during the training process.
In our experiment, FIS are used as a filter for the input IHCs (see Fig. 1 & Fig. 2). FIS filter the WSI at pixel level based on thee RGB color values, thus taking three inputs as R, G, and B and giving one output in the range of to as a gray scale image. The FIS uses biomarker specific models, which are trained using a range of RGB data collected randomly by our experts (see table I). For instance, in CD30, only positive regions (class 3, 4, 5 from table I) are to be extracted, and in PAX5 semi-positive tissues (class 4 only from table I) are to be retrieved, hence only the target tissues will get some dark grey levels and rest of the area will be assigned as background (white color). In the end, a gray image is generated as an output () containing only the gray impressions of target tissues (see fig 2).
|
Class | |||
|---|---|---|---|---|
| R | G | B | ||
| 214 - 247 | 214 - 247 | 213 - 247 | 0 = Background | |
| 24 - 208 | 44 - 217 | 79 - 228 | 1 = Blue | |
| 63 - 221 | 65 - 221 | 77 - 226 | 2 = Gray | |
| 163 - 251 | 124 - 218 | 107 - 214 | 3 = Light Brown | |
| 136 - 192 | 87 - 157 | 70 - 147 | 4 = Medium Brown | |
| 37 - 98 | 0 - 67 | 0 - 61 | 5 = Dark Brown | |
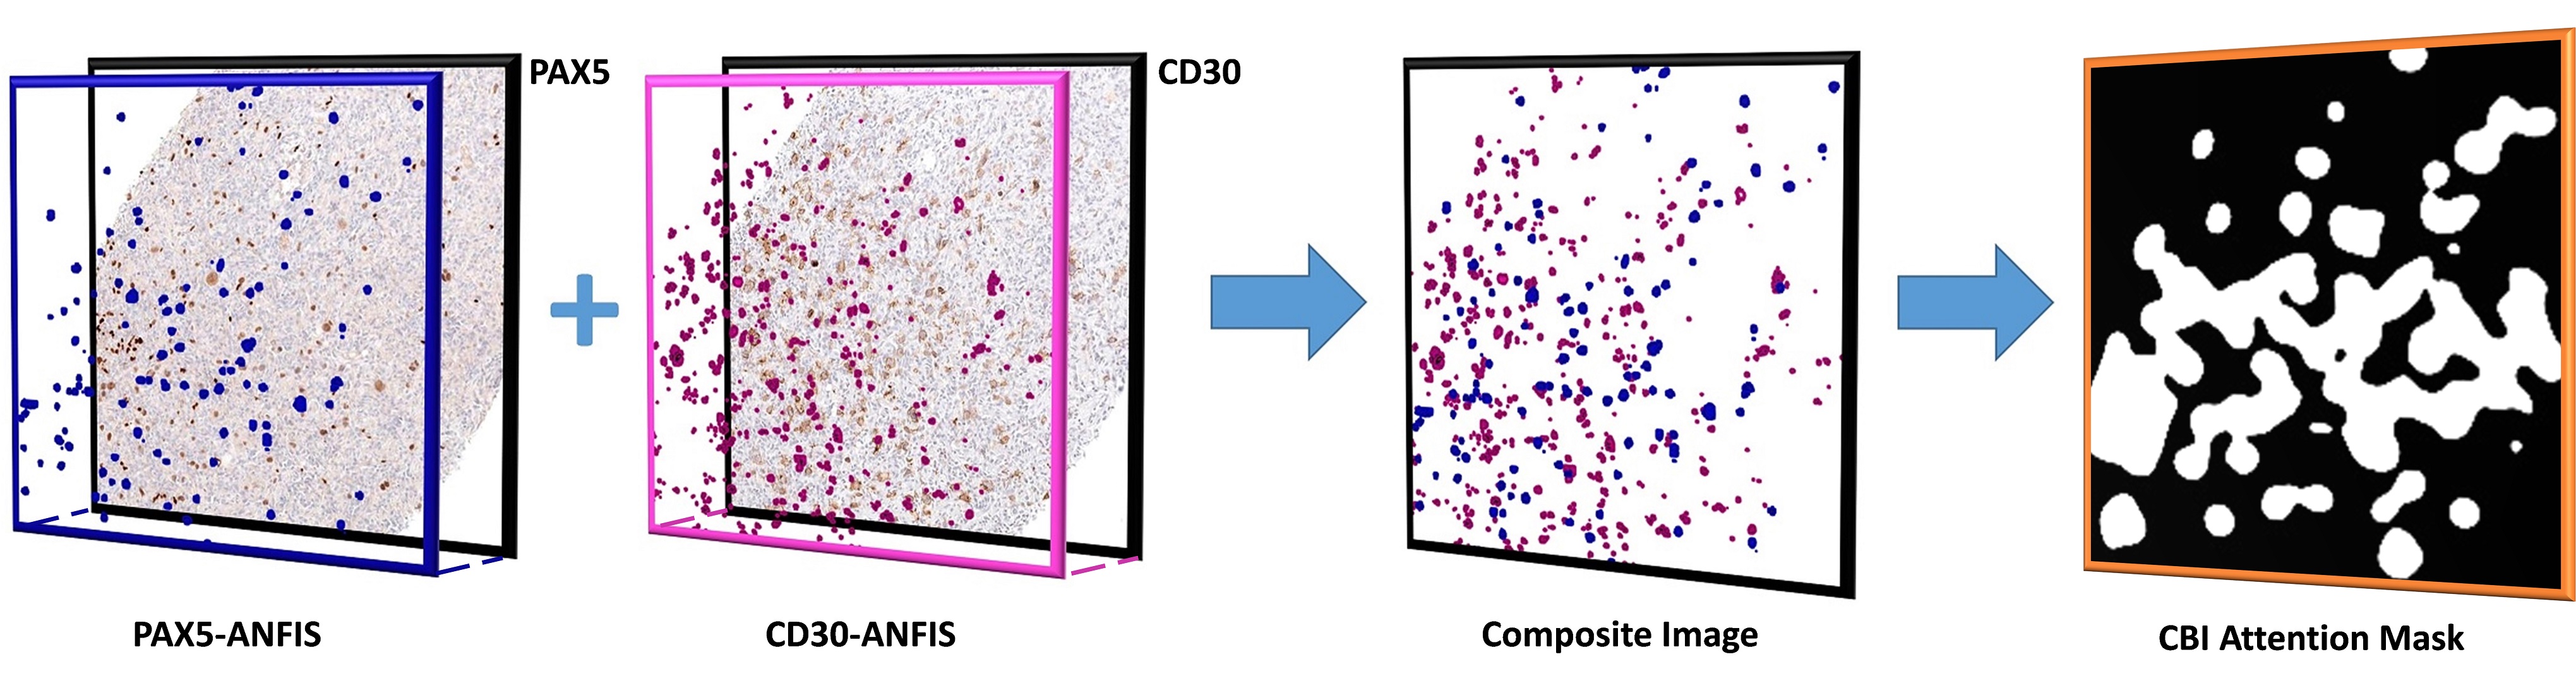
Composite Biomarker Image – Final Step of the proposed method, after FISs, is to generate a CBI image. After getting the gray level images of each biomarker with the tissues of interest, these images are morphologically processed and merged together to form a CBI image. Filtered biomarker images are arranged and overlayed on each other. In our experiment, we arranged CD30 as the first image, then PAX5 on top of CD30. A sample CBI image is shown in Fig. 2 for illustration. The overlay color of the biomarker images can be chosen as per convenience, and their overlay order in CBI image can also be adjusted according to the needs. Furthermore, an attention map (mask) can also be generated from the CBI image based on the common population density of the filtered tissues among multiple biomarkers (see Fig. 2).
Data – In the experiment, 12 cases (or 36 WSIs) of CHL are used, along with H&E and the relevant IHC biomarkers (CD30 and PAX5). The images were acquired from the Grand River Hospital, Kitchener, Ontario, Canada using Huron Tissue Scope LE scanner. The specimen are taken from different parts of the body. These specimens should be cut into small parts and each part will be fit to a paraffin cassette. From each cassette, H&E and the IHCs are prepared on a glass slide, which are further scanned at 40x magnification to obtain the digital WSI.
For the ANFIS training and testing data, 30 RGB values were randomly selected by the expert from the area of each class, so in total 180 x 3 (RGB) points were used in our experiment. From 30 points, 25 RGB points were used for the training, and 5 points were used for testing for each class. The range of RGB data for each class for training is shown in Table. I.
III Results
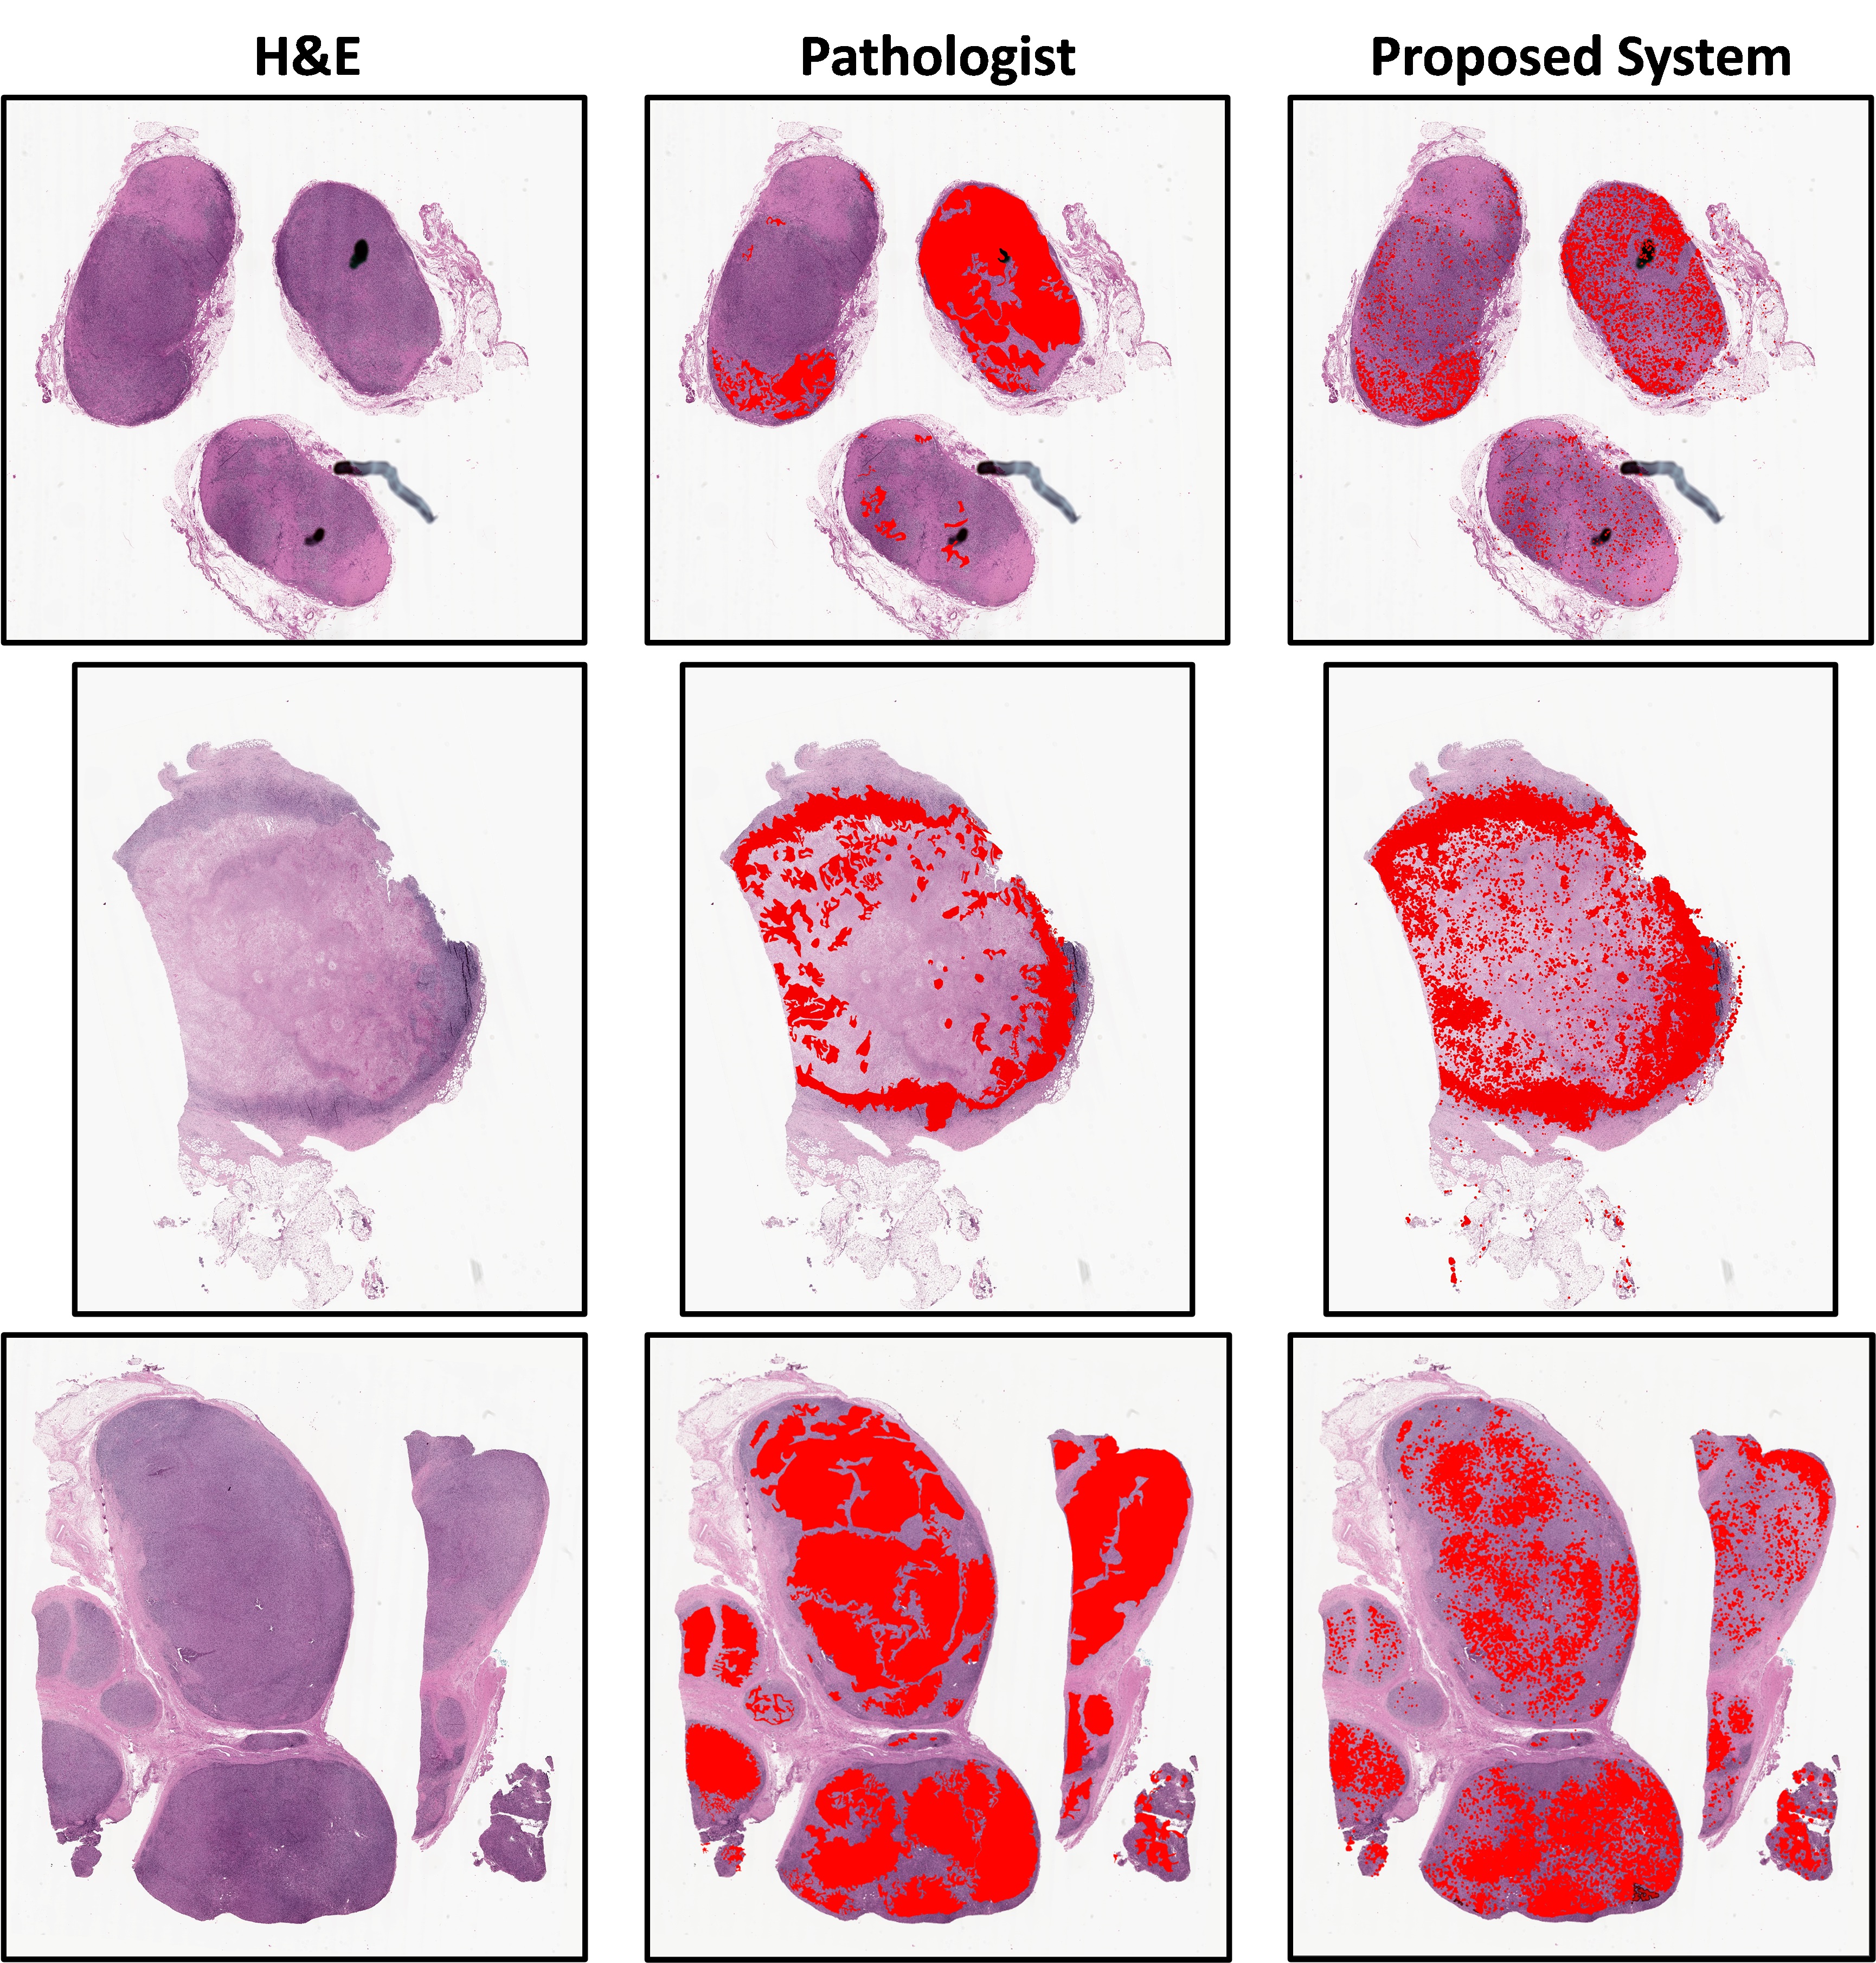
The proposed system was evaluated in this preliminary study and diagnosis of CHL. 12 CHL cases were selected and examined by the expert pathologists from the Grand River Hospital, Kitchener, Canada and the Mayo Clinic, Rochester, USA. The purpose of CBI is to aid the pathologists with their diagnosis with the help of multiple biomarkers and selected regions. Fig. 2 shows a sample CBI image produced by the proposed system using two IHCs which include CD30 positive, and PAX5 semi-positive. The number of biomarkers can vary according to the diagnosis requirements. However, in our experiment, we have used two biomarkers (CD30, and PAX5) for CHL. Moreover, our proposed system takes full advantage of registered IHCs and take the common region where the CD30 have positive tissue population and PAX5 have semi-positive tissue population to generate an attention map which shows the possible regions containing the CHL malignant cells (see Fig. 4). Furthermore, the results from the proposed system were analysed qualitatively by the expert pathologists, and the map generated by the proposed system seems to be more accurate and precise at cellular level when compared to the pathologists marked regions (as shown in Fig. 3). In this comparison, pathologists analyse the biomarkers (CD30, and PAX5) and annotated according to their findings. Pathologist’s delineation may include some human error, and some benign/healthy tissue. For our experiments, we were unable to generate a similarity indexes because the ground truth labelled by the pathologists and the maps generated by the proposed system were very different in terms of precision, but they majorly covered the same area as we can observe in Fig. 3. Therefore, in this case, the similarity index could be misleading. Thus, qualitatively evaluating the CHL maps from the proposed system.
IV Conclusions
In this paper, we introduced CBI as an advanced visualization modality, which can assist the pathologists to identify the key suspected areas, which otherwise would be a cumbersome task involving inspection of multiple IHC WSIs back and forth from one biomarker image to another. Moreover, IHC images are typically not aligned with each other, so pathologists also have to identify the co-localized areas visually. The proposed CBI enables the experts to read the entire information from a unified modality. For the future work, one should exploit CBI in applications where extensive annotations from the experts are required. Additionally, we need figure out how to quantitatively compare the results of the proposed system with those of the pathologists.
References
- [1] P. W. Hamilton, P. Bankhead, Y. Wang, R. Hutchinson, D. Kieran, D. G. McArt, J. James, and M. Salto-Tellez, “Digital pathology and image analysis in tissue biomarker research,” Methods, vol. 70, no. 1, pp. 59–73, 2014.
- [2] J. Duraiyan, R. Govindarajan, K. Kaliyappan, and M. Palanisamy, “Applications of immunohistochemistry,” Journal of pharmacy & bioallied sciences, vol. 4, no. Suppl 2, pp. S307–S309, Aug 2012.
- [3] J.-a. Roulson, E. Benbow, and P. S. Hasleton, “Discrepancies between clinical and autopsy diagnosis and the value of post mortem histology; a meta-analysis and review,” Histopathology, vol. 47, no. 6, pp. 551–559, 2005.
- [4] A.-Y. Leong and J. Wright, “The contribution of immunohistochemical staining in tumour diagnosis,” Histopathology, vol. 11, no. 12, pp. 1295–1305, 1987.
- [5] S.-W. Kim, J. Roh, and C.-S. Park, “Immunohistochemistry for pathologists: protocols, pitfalls, and tips,” Journal of pathology and translational medicine, vol. 50, no. 6, p. 411, 2016.
- [6] A. Shafique, M. Babaie, M. Sajadi, A. Batten, S. Skdar, and H. Tizhoosh, “Automatic multi-stain registration of whole slide images in histopathology,” in 2021 43rd Annual International Conference of the IEEE Engineering in Medicine Biology Society (EMBC), 2021, pp. 3622–3625.
- [7] A. L. Feldman and A. Dogan, “Diagnostic uses of pax5 immunohistochemistry,” Advances in Anatomic Pathology, vol. 14, no. 5, 2007.
- [8] S. M. Ansell, “Hodgkin lymphoma: 2018 update on diagnosis, risk-stratification, and management,” American Journal of Hematology, vol. 93, no. 5, pp. 704–715, 2018.
- [9] A. Mottok and C. Steidl, “Biology of classical Hodgkin lymphoma: implications for prognosis and novel therapies,” Blood, vol. 131, no. 15, pp. 1654–1665, 04 2018.
- [10] T. Marafioti, M. Hummel, H.-D. Foss, H. Laumen, P. Korbjuhn, I. Anagnostopoulos, H. Lammert, G. Demel, J. Theil, T. Wirth, and H. Stein, “Hodgkin and reed-sternberg cells represent an expansion of a single clone originating from a germinal center b-cell with functional immunoglobulin gene rearrangements but defective immunoglobulin transcription,” Blood, vol. 95, no. 4, pp. 1443–1450, 2000.
- [11] D. Hollman-Hewgley, M. Lazare, A. Bordwell, E. Zebadua, P. Tripathi, A. S. Ross, D. Fisher, A. Adams, D. Bouman, D. P. O’Malley, and L. M. Weiss, “A single slide multiplex assay for the evaluation of classical hodgkin lymphoma,” The American Journal of Surgical Pathology, vol. 38, no. 9, 2014.
- [12] N. Trahearn, D. Epstein, I. Cree, D. Snead, and N. Rajpoot, “Hyper-stain inspector: A framework for robust registration and localised co-expression analysis of multiple whole-slide images of serial histology sections,” Scientific Reports, vol. 7, no. 1, p. 5641, Jul 2017.
- [13] E. Vali Betts, D. M. Dwyre, H.-Y. Wang, and H. H. Rashidi, “Pax5-negative classical hodgkin lymphoma: A case report of a rare entity and review of the literature,” Case Reports in Hematology, vol. 2017, p. 7531729, Oct 2017.
- [14] A. Carbone, A. Gloghini, and R. Volpe, “Paraffin section immunohistochemistry in the diagnosis of hodgkin’s disease and anaplastic large cell (cd30+) lymphomas,” Virchows Archiv A, vol. 420, no. 6, pp. 527–532, Nov 1992.
- [15] E. Torlakovic, G. Torlakovic, P. L. Nguyen, R. D. Brunning, and J. Delabie, “The value of anti-pax-5 immunostaining in routinely fixed and paraffin-embedded sections: A novel pan pre-b and b-cell marker,” The American Journal of Surgical Pathology, vol. 26, no. 10, 2002.
- [16] W. Bulten, P. Bándi, J. Hoven, R. v. d. Loo, J. Lotz, N. Weiss, J. v. d. Laak, B. v. Ginneken, C. Hulsbergen-van de Kaa, and G. Litjens, “Epithelium segmentation using deep learning in h&e-stained prostate specimens with immunohistochemistry as reference standard,” Scientific Reports, vol. 9, no. 1, p. 864, Jan 2019.
- [17] L. Solorzano, G. M. Almeida, B. Mesquita, D. Martins, C. Oliveira, and C. Wählby, “Whole slide image registration for the study of tumor heterogeneity,” in Computational Pathology and Ophthalmic Medical Image Analysis, D. Stoyanov, Z. Taylor, F. Ciompi, Y. Xu, A. Martel, L. Maier-Hein, N. Rajpoot, J. van der Laak, M. Veta, S. McKenna, D. Snead, E. Trucco, M. K. Garvin, X. J. Chen, and H. Bogunovic, Eds. Springer International Publishing, 2018, pp. 95–102.
- [18] Y. Van Herck, A. Antoranz, M. D. Andhari, G. Milli, O. Bechter, F. De Smet, and F. M. Bosisio, “Multiplexed immunohistochemistry and digital pathology as the foundation for next-generation pathology in melanoma: Methodological comparison and future clinical applications,” Frontiers in oncology, vol. 11, pp. 636 681–636 681, Mar 2021.
- [19] M. Alizadeh, O. H. Maghsoudi, K. Sharzehi, H. Reza Hemati, A. Kamali Asl, and A. Talebpour, “Detection of small bowel tumor in wireless capsule endoscopy images using an adaptive neuro-fuzzy inference system,” Journal of biomedical research, vol. 31, no. 5, pp. 419–427, Sep 2017.
- [20] M. S. Hosseini and M. Zekri, “Review of medical image classification using the adaptive neuro-fuzzy inference system,” Journal of medical signals and sensors, vol. 2, no. 1, pp. 49–60, Jan 2012.
- [21] J. Jang, “Anfis: Adaptive-network-based fuzzy,” IEEE Trans Neural Netw, vol. 3, no. 889, p. 98, 1992.