Super-massive black hole wake or bulgeless edge-on galaxy?
van Dokkum et al. (2023) reported the serendipitous discovery of a thin linear object interpreted as the trail of star-forming regions left behind by a runaway supermassive black hole (SMBH) kicked out from the center of a galaxy. Despite the undeniable interest in the idea, the actual physical interpretation is not devoid of difficulty. The wake of a SMBH produces only small perturbations on the external medium, which has to be in exceptional physical conditions to collapse gravitationally and form a long (40 kpc) massive () stellar trace in only 39 Myr. Here we offer a more conventional explanation: the stellar trail is a bulgeless galaxy viewed edge-on. This interpretation is supported by the fact that its position–velocity curve resembles a rotation curve which, together with its stellar mass, puts the object right on top of the Tully-Fisher relation characteristic of disk galaxies. Moreover, the rotation curve (), stellar mass, extension, width (1.2 kpc), and surface brightness profile of the object are very much like those of IC 5249, a well-known local bulgeless edge-on galaxy. These observational facts are difficult to interpret within the SMBH wake scenario. We discuss in detail the pros and cons of the two options.
Key Words.:
Galaxies: halos — Galaxies: IC 5249 — Galaxies: kinematics and dynamics — Galaxies: fundamental parameters — Galaxies: peculiar — Galaxies: structure
1 Introduction
Recently, van Dokkum et al. (2023, hereafter VD23) discovered a remarkable thin extended object (025 5″; see Fig. 1a) roughly aligned with a nearby galaxy. It was interpreted as the stellar wake induced by the passage of a Super-Massive Black Hole (SMBH) kicked out from the galaxy by the slingshot effect of a 3-body encounter of SMBHs. This object would be the first example of its class as the ejection of SMBHs through this potential mechanism has never been observed so far. It would also provide a new discovery channel for rogue SMBHs and for the process of SMBH ejection from galaxies. In the scenario put forward by VD23, the SMBH producing the wake was ejected with a (projected) speed of and is observed 39 Myr after the 3-body encounter, creating a stellar linear structure 40 kpc long and 2 kpc wide, with a stellar mass of the order of . As it happens with the ejection, the formation of such a thin long massive stellar structure may conceptually occur but would be the first observation of this phenomenon. Despite the undeniable interest in this eye-catching idea, the actual physical interpretation is not devoid of difficulty.
The physical mechanism invoked for the creation of a stellar wake is not specific to SMBHs. It will work for any massive compact object wandering in the halo of a galaxy, including globular clusters, dark matter sub-halos (e.g., Buschmann et al., 2018), and intermediate-mass black holes (e.g., Di Matteo et al., 2022). Thus, if the physical conditions of the gas in the circum-galactic medium (CGM) that could potentially trigger the formation of a 40 kpc-long stellar trail were common, then long massive bright stellar trails around galaxies would be ubiquitous. Since this is not the case, the proposed creation of a stellar trail driven by the passage of a SMBH through the CGM of a galaxy is doubly exceptional: it requires the ejection of a SMBH from a galaxy surrounded by a large massive CGM about to self-collapse gravitationally.
Thus, in view of the potential difficulties and to broaden the range of possibilities, here we explore another more traditional explanation of the observation, namely, that the object is a bulgeless galaxy viewed edge-on. Indeed, this idea was mentioned in VD23 but not developed further. We use publicly available data (Sect. 2) to show that the stellar mass of the object plus the observed line-of-sight velocities interpreted as a rotation curve places the object on top of the baryonic Tully-Fisher relation (TRF), that characterizes disk galaxies (Sect. 3). In addition, we carry out a comparative analysis between the object and the local bulgeless edge-on galaxy IC 5249 (Sect. 3; Fig. 1b). IC 5249 has similar properties attributed to the object when interpreted as a bulgeless edge-on galaxy, namely, it has similar stellar mass, rotation curve, disk orientation, extension, and width. Evidence for and against the two scenarios (SMBH wake and bulgeless edge-on galaxy) is discussed in Sect. 4. Throughout this work, we adopt a cosmological model with km s-1 Mpc-1, , and . All magnitudes are in the AB magnitude system.
2 Data
We analyze two sources in this paper: the object and the bulgeless galaxy IC 5249. All used data are archival or from the literature, as declared below.
2.1 The object
The object was observed with the Advanced Camera for Surveys (ACS) WideField Channel (WFC) on board of the Hubble Space Telescope (HST) as part of the program GO-16912 (PI: van Dokkum) available through the MAST archive111https://mast.stsci.edu/portal/Mashup/Clients/Mast/Portal.html. The data consists of one orbit in the F606W band and one in the F814W band, corresponding to an exposure time of 2064 s in F606W and the same in F814W. The charge-transfer efficiency (CTE) corrected data were downloaded from MAST and flc files were used to build the final drizzled mosaics with Astrodrizzle (Gonzaga et al., 2012). Figure 1a shows a color stamp of 75 35 (60 kpc 30 kpc at z = ) centered in the object and generated from F606W and F814W.
Figure 1c shows the surface brightness profiles of the object in the F606W and F814W bands, extracted averaging kpc along the trace. The shaded areas represent 1- errors in the profiles, propagated from the photometric error of all the spaxel contributing to each surface brightness bin.
The position–velocity curve shown in Fig. 1e (the solid orange line) is a replica of the line-of-sight velocity of the object provided by VD23 in the top left panel of their Fig. 10. The velocities in VD23 Fig. 10 between the location of the host galaxy and 20 kpc are not used for our analysis as they do not represent real measurements but a simple interpolation. The velocities were measured in the [OIII]5007 emission line detected using the LIRIS spectrograph on Keck I (Oke et al., 1995). We interpret the position-velocity curve of the object as a rotation curve. In our rendering, was estimated as the average between the minimum and maximum velocities of the curve. Then the center of rotation is just the position where the observed is zero. The position thus determined sets the origin of distances in Fig. 1e, and so in Figs. 1a and 1c and in the top panel of Fig. 3.
According to VD23, the spatially integrated brightness of the object is of the brightness of the closest galaxy (the host from which the SMBH was escaping in their proposed scenario). This closest galaxy and the object have nearly identical colors, implying similar mass-to-light ratios. The stellar mass of the host is estimated in VD23 to be , therefore, the inferred mass of the object is .
2.2 IC 5249
IC 5249 is a well-known nearby (redshift 0.007) bulgeless galaxy (e.g., Karachentsev et al., 1999). In order to compare with the F606W and F814W bands of the object at its redshift, we retrieved the closest available images for this galaxy: NUV (GALEX, Martin et al., 2005) and (DECaLS, Dark Energy Survey Collaboration et al., 2016). Although the -band would be a better choice to replicate F814W, it is not available. Figure 1b shows a color image generated from the NUV and images. For ease of comparison, it is shown at the same physical scale and orientation as the object. The surface brightness profiles in the two bands are shown in Fig. 1d, extracted averaging along the trace of the galaxy. Although barely visible, errors derived in the same way as for the object are included too. The rotation curve of this galaxy shown in Fig. 1e (the blue solid line, with the light-blue region denoting errors) is taken from Banerjee & Bapat (2017) from HI observations by O’Brien et al. (2010) with the Australia Telescope Compact Array (ATCA). The distance of this galaxy ( Mpc) was taken from NED222https://ned.ipac.caltech.edu/ to set all physical scales. The value of was obtained directly from the rotation curve. To calculate the stellar mass of IC 5249, we use the integrated signals in the DECaLS and images with the mass-to-light ratio from Roediger & Courteau (2015) and assuming a Chabrier (2003) initial mass function. The mass of the galaxy thus computed is .
3 Interpretation as a bulgeless edge-on galaxy
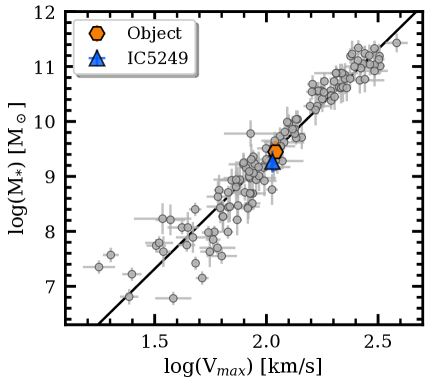
The baryonic TFR (Tully & Fisher, 1977) links the baryon mass with the maximum rotational velocity of a disk galaxy. In practice, it is a main signpost for being a galaxy, so fundamental as to be routinely employed to determine absolute distances to galaxies from the observed rotational velocities and apparent magnitudes (e.g., the textbooks by Phillipps, 2005; Harwit, 2006; Sparke & Gallagher, 2006). Figure 2 shows a recent rendering of the stellar TFR as worked out by Lelli et al. (2019) for local galaxies (the stellar masses are from Lelli et al. 2016). Using the stellar mass and the maximum rotational velocity derived in Sect. 2, the object happens to appear right on top of the TFR (see the orange hexagon). Repeating the same exercise for IC 5249 yields very similar results (the blue triangle in Fig. 2). Thus, the location of the object on the TFR provides solid support to our conjecture that it is a galaxy.
More evidence can be extracted from Fig. 1. The images of the object and the local galaxy are quite similar both in extension and width (cf. the two top panels of the figure). The image of the object is clumpier or more irregular, but this is to be expected because (1) high redshift galaxies are in general more actively forming stars and therefore clumpier (e.g., Elmegreen & Elmegreen, 2005; Elmegreen et al., 2005), and (2) the redder band used for the object (F814W, corresponding to restframe wavelengths between 3500 and 4700 Å) is significantly bluer than the color filter (from 4000 to 5500 Å) used for IC 5249. It is well known that star-forming galaxies appear more irregular in bluer bandpasses (e.g., Kuchinski et al., 2001; Mager et al., 2018).
The surface brightness profiles of IC 5249 and the object along the semi-major axes are also quite similar (Figs. 1c and 1d). These surface brightness profiles were obtained using an aperture of 2 kpc for both objects. Both profiles are fairly flat with a sharp drop in the outskirts. The radial position of the edges (where the sharp drops are located; see Trujillo et al., 2020; Chamba et al., 2022) are Redge=15 kpc for IC 5249 and 20 kpc for the object. The edges of both objects tend to be bluer (Figs. 1c and 1d). There are some differences in the global colors (IC 5249 is redder) and the presence of a small bulge in IC 5249 which is not visible in the object.
The position–velocity curve of the object provided by VD23 (their Fig. 10, top left panel) is plotted as a solid orange line in Fig. 1e. The same curve flipped both around and is also represented (the orange dashed lines) to highlight the anti-symmetry of the observed position–velocity curve, as expected from the rotation of a galaxy. The blue solid line represents the rotation curve of IC 5249 from Banerjee & Bapat (2017), and it was included without any scaling or adjustment. The agreement between the object and IC 5249 is remarkable, supporting that the position–velocity curve of the object is indeed the rotation curve of a galaxy. In addition to the overall agreement in shape and amplitude, we note the tendency of both curves to drop in the outskirts, a property often observed in high redshift galaxies (e.g., Genzel et al., 2017) that tells us about the relative importance of baryons to dark matter.
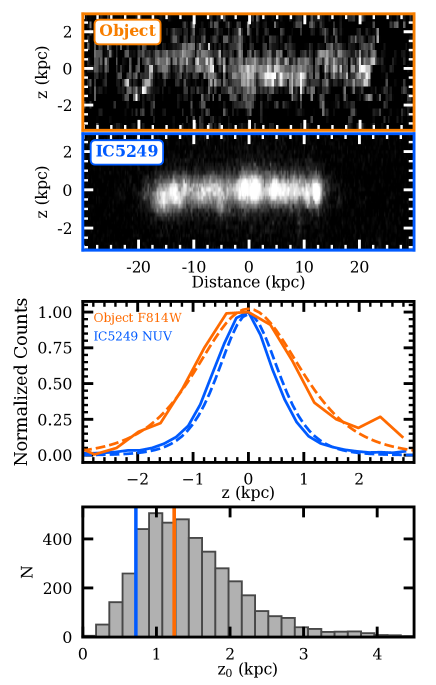
We have also investigated whether the width of the object is compatible with being a bulgeless galaxy. Figure 3 shows images of both the object (in the F814W band) and IC 5249 (in the NUV band). Visually, both have similar widths. To quantify this statement, the central panel of Fig. 3 shows the distribution of counts across the object and IC 5249. To create these profiles, the distribution of counts of both galaxies was collapsed along the long (horizontal in Fig. 3) axes. By fitting the vertical distribution of counts to the commonly used function , with z0 the scale-height, we obtain =0.72 kpc for IC 5249 (in very nice agreement with the value of 0.724 kpc reported by Banerjee & Bapat, 2017) and =1.24 kpc for the object. The fits are shown as dashed lines in the central panel of Fig. 3. The bottom panel of the same figure compares the derived values of with the scale-heights of the sample of edge-on disks from Bizyaev et al. (2014). The width of both IC 5249 and the object are perfectly normal in terms of scale-height, a result well known for bulgeless galaxies (see, e.g., Bizyaev et al., 2017).
4 Discussion
The main arguments for the object to be a bulgeless edge-on galaxy are: (1) its position–velocity curve resembles a rotation curve which, together with its stellar mass, puts the object right on top of the TFR (Fig. 2), and (2) the rotation curve, stellar mass, extension, width, and surface brightness profile of the object is very much like IC 5249 (Fig. 1), which without much forcing could be a local analog.
However, there are three additional observables mentioned by VD23 that require further analysis to be accommodated into the edge-on disk scenario. First, the object is not completely straight (Fig. 1, top panel), with variations of 0.5 kpc. This could be due to warps in the disk or simply because we are observing in the UV restframe, where galaxies are more irregular since the UV traces individual star-forming regions (see the discussion in Sect. 3). Second, the line ratio [OIII]/H exceeds the canonical limit for HII regions in two positions along the stellar trace, reaching the value of 10 expected for shocks or AGNs. However, the observed H line is extremely weak and noisy in these points, and a factor two uncertainty in its flux would bring the ratio back to HII region values. Moreover, some extreme star-forming galaxies (e.g., green peas and the like; Steidel et al., 2014; Leitherer, 2020) provide ratios very close to the largest found in the object. Another possibility is that the emission is tracing shocks created by star formation in HII regions, without the intervention of any SMBH. Those shocks are not uncommon when SN-driven bubbles meet the interstellar medium (ISM) or can be caused by the random motions associated with the ISM turbulence (e.g., Sánchez et al., 2014; Della Bruna et al., 2022). Third, the change of color along the stellar trace has a pattern that reproduces the evolution of a young single stellar population with time (Fig. 9 in VD23), indicating linearly increasing aging from left to right in Figs. 1a and 1c. Within the stellar disk scenario, the changes in color would have to be produced by the random mixture of younger and older populations that co-exist in the disk. This explanation avoids a serious issue of the systematic age variation explanation of colors, namely, the absence of a systematic surface brightness variation of the stellar trace (Fig. 1c). With some dependence on the details of the single-stellar population modeling and on the bandpass of observation, we should expect a systematic luminosity variation from the oldest stars (leftmost point in Fig. 1, panel a) to the youngest stars (rightmost point) of around 2 magnitudes (e.g., Leitherer et al., 1999; Conroy et al., 2009). This significant variation in magnitude is simply not observed.
The overdensity expected from the passage of a SMBH is not large which implies very special physical conditions in the IGM for the star formation to be triggered. If such conditions were regularly met it would imply that the passage of any massive compact object, like a globular cluster, will trigger star formation, and galaxies will be plagued with conspicuous stellar wakes. Thus, the scenario where the object is produced by the ejection of a SMBH is doubly exceptional: it requires the ejection of a SMBH from a galaxy that then encounters a huge massive gas cloud about to self-collapse gravitationally. In addition, the SMBH scenario does not explain the two main observational features supporting the galaxy hypothesis, namely, why the object fits in the TFR (Fig. 2) and why its main observational properties agree so well with those of a local bulgeless galaxy with similar stellar mass (IC 5249; Fig. 1). Other observables where the SMBH wake scenario seems to do a remarkably good job actually face problems too. These observables are the color variation of the trail and its transverse displacement according to time from the SMBH pass. If the change of color would be produced by the aging of the stellar population, the surface brightness should change systematically along the stellar trace, being some two magnitudes fainter in the older end (see the discussion above). As for the transverse displacement, the agreement relies on the implicit assumption that the gas cloud transverse velocity is zero in the older end of the stellar trace. Even if this might happen, it represents an ad-hoc assumption without which the agreement between the observed transverse displacement and line-of-sight velocity goes away.
In short, in this Letter we present a number of solid arguments supporting the scenario where the object discovered by VD23 could be a bulgeless edge-on galaxy. If it is, it would not be a common galaxy in the sense of being bulgeless and particularly long for its stellar mass and redshift. However, it is not very uncommon either since thousands of this kind of galaxies (often called thin galaxies or flat galaxies) are already known (e.g., Karachentsev et al., 1999). One of them, IC 5249, has been used here to highlight the close resemblance of the object with these galaxies.
Acknowledgements.
Thanks are due to María Benito for discussions on the formation of a stellar wake. Thanks are also due to an anonymous referee for useful suggestions to improve the clarity of our arguments. JSA acknowledges financial support from the Spanish Ministry of Science and Innovation, project PID2019-107408GB-C43 (ESTALLIDOS), and from Gobierno de Canarias through EU FEDER funding, project PID2020010050. MM acknowledges support from the Project PCI2021-122072-2B, financed by MICIN/AEI/10.13039/501100011033, and the European Union “NextGenerationEU”/RTRP and IAC project P/302302. IT acknowledges support from the ACIISI, Consejería de Economía, Conocimiento y Empleo del Gobierno de Canarias and the European Regional Development Fund (ERDF) under grant with reference PROID2021010044 and from the State Research Agency (AEI-MCINN) of the Spanish Ministry of Science and Innovation under the grant PID2019-107427GB-C32 and IAC project P/302300, financed by the Ministry of Science and Innovation, through the State Budget and by the Canary Islands Department of Economy, Knowledge and Employment, through the Regional Budget of the Autonomous Community.References
- Banerjee & Bapat (2017) Banerjee, A. & Bapat, D. 2017, MNRAS, 466, 3753
- Binney & Tremaine (2008) Binney, J. & Tremaine, S. 2008, Galactic Dynamics: Second Edition
- Bizyaev et al. (2014) Bizyaev, D. V., Kautsch, S. J., Mosenkov, A. V., et al. 2014, ApJ, 787, 24
- Bizyaev et al. (2017) Bizyaev, D. V., Kautsch, S. J., Sotnikova, N. Y., Reshetnikov, V. P., & Mosenkov, A. V. 2017, MNRAS, 465, 3784
- Buschmann et al. (2018) Buschmann, M., Kopp, J., Safdi, B. R., & Wu, C.-L. 2018, Phys. Rev. Lett., 120, 211101
- Chabrier (2003) Chabrier, G. 2003, ApJ, 586, L133
- Chamba et al. (2022) Chamba, N., Trujillo, I., & Knapen, J. H. 2022, A&A, 667, A87
- Chandrasekhar (1943) Chandrasekhar, S. 1943, ApJ, 97, 255
- Conroy et al. (2009) Conroy, C., Gunn, J. E., & White, M. 2009, ApJ, 699, 486
- Dark Energy Survey Collaboration et al. (2016) Dark Energy Survey Collaboration, Abbott, T., Abdalla, F. B., et al. 2016, MNRAS, 460, 1270
- de la Fuente Marcos & de la Fuente Marcos (2008) de la Fuente Marcos, R. & de la Fuente Marcos, C. 2008, ApJ, 677, L47
- Della Bruna et al. (2022) Della Bruna, L., Adamo, A., Amram, P., et al. 2022, A&A, 660, A77
- Di Matteo et al. (2022) Di Matteo, T., Ni, Y., Chen, N., et al. 2022, arXiv e-prints, arXiv:2210.14960
- Elmegreen & Elmegreen (2005) Elmegreen, B. G. & Elmegreen, D. M. 2005, ApJ, 627, 632
- Elmegreen et al. (2005) Elmegreen, D. M., Elmegreen, B. G., Rubin, D. S., & Schaffer, M. A. 2005, ApJ, 631, 85
- Genzel et al. (2017) Genzel, R., Förster Schreiber, N. M., Übler, H., et al. 2017, Nature, 543, 397
- Gonzaga et al. (2012) Gonzaga, S., Hack, W., Fruchter, A., & Mack, J. 2012, The DrizzlePac Handbook
- Harwit (2006) Harwit, M. 2006, Astrophysical Concepts
- Kalnajs (1971) Kalnajs, A. J. 1971, Ap&SS, 13, 279
- Karachentsev et al. (1999) Karachentsev, I. D., Karachentseva, V. E., Kudrya, Y. N., Sharina, M. E., & Parnovskij, S. L. 1999, Bulletin of the Special Astrophysics Observatory, 47, 5
- Kaur & Stone (2022) Kaur, K. & Stone, N. C. 2022, MNRAS, 515, 407
- Kuchinski et al. (2001) Kuchinski, L. E., Madore, B. F., Freedman, W. L., & Trewhella, M. 2001, AJ, 122, 729
- Leitherer (2020) Leitherer, C. 2020, Galaxies, 8, 13
- Leitherer et al. (1999) Leitherer, C., Schaerer, D., Goldader, J. D., et al. 1999, ApJS, 123, 3
- Lelli et al. (2016) Lelli, F., McGaugh, S. S., & Schombert, J. M. 2016, AJ, 152, 157
- Lelli et al. (2019) Lelli, F., McGaugh, S. S., Schombert, J. M., Desmond, H., & Katz, H. 2019, MNRAS, 484, 3267
- Leroy et al. (2008) Leroy, A. K., Walter, F., Brinks, E., et al. 2008, AJ, 136, 2782
- Mager et al. (2018) Mager, V. A., Conselice, C. J., Seibert, M., et al. 2018, ApJ, 864, 123
- Martin et al. (2005) Martin, D. C., Fanson, J., Schiminovich, D., et al. 2005, ApJ, 619, L1
- Mulder (1983) Mulder, W. A. 1983, A&A, 117, 9
- O’Brien et al. (2010) O’Brien, J. C., Freeman, K. C., & van der Kruit, P. C. 2010, A&A, 515, A62
- Oke et al. (1995) Oke, J. B., Cohen, J. G., Carr, M., et al. 1995, PASP, 107, 375
- Ostriker (1999) Ostriker, E. C. 1999, ApJ, 513, 252
- Phillipps (2005) Phillipps, S. 2005, The Structure and Evolution of Galaxies
- Roediger & Courteau (2015) Roediger, J. C. & Courteau, S. 2015, MNRAS, 452, 3209
- Sánchez et al. (2014) Sánchez, S. F., Rosales-Ortega, F. F., Iglesias-Páramo, J., et al. 2014, A&A, 563, A49
- Schutte et al. (2019) Schutte, Z., Reines, A. E., & Greene, J. E. 2019, ApJ, 887, 245
- Sparke & Gallagher (2006) Sparke, L. S. & Gallagher, John S., I. 2006, Galaxies in the Universe - 2nd Edition
- Steidel et al. (2014) Steidel, C. C., Rudie, G. C., Strom, A. L., et al. 2014, ApJ, 795, 165
- Trujillo et al. (2020) Trujillo, I., Chamba, N., & Knapen, J. H. 2020, MNRAS, 493, 87
- Tully & Fisher (1977) Tully, R. B. & Fisher, J. R. 1977, A&A, 54, 661
- van Dokkum et al. (2023) van Dokkum, P., Pasha, I., Buzzo, M. L., et al. 2023, arXiv e-prints, arXiv:2302.04888