LEAVE UNSET \jmlryear2023 \jmlrsubmittedLEAVE UNSET \jmlrpublishedLEAVE UNSET \jmlrworkshopConference on Health, Inference, and Learning (CHIL) 2023
Virus2Vec: Viral Sequence Classification Using Machine Learning
Abstract
Understanding the host-specificity of different families of viruses sheds light on the origin of, e.g., SARS-CoV-2, rabies, and other such zoonotic pathogens in humans. It enables epidemiologists, medical professionals, and policymakers to curb existing epidemics and prevent future ones promptly. In the family Coronaviridae (of which SARS-CoV-2 is a member), it is well-known that the spike protein is the point of contact between the virus and the host cell membrane. On the other hand, the two traditional mammalian orders, Carnivora (carnivores) and Chiroptera (bats) are recognized to be responsible for maintaining and spreading the Rabies Lyssavirus (RABV). We propose Virus2Vec, a feature-vector representation for viral (nucleotide or amino acid) sequences that enable vector-space-based machine learning models to identify viral hosts. Virus2Vec generates numerical feature vectors for unaligned sequences, allowing us to forego the computationally expensive sequence alignment step from the pipeline. Virus2Vec leverages the power of both the minimizer and position weight matrix (PWM) to generate compact feature vectors. Using several classifiers, we empirically evaluate Virus2Vec on real-world spike sequences of Coronaviridae and rabies virus sequence data to predict the host (identifying the reservoirs of infection). Our results demonstrate that Virus2Vec outperforms the predictive accuracies of baseline and state-of-the-art methods.
Data and Code Availability
We extracted the labeled Spike protein sequences for COVID-19 hosts dataset from GISAID 111https://www.gisaid.org/ and labeled Nucleotide genome sequences for rabies virus hosts dataset from RABV-GLUE 222http://rabv-glue.cvr.gla.ac.uk/#/home. Where the label is the name of the host for which we are classifying the sequences. Our preprocessed dataset and code are available online 333https://github.com/sarwanpasha/Virus2Vec.
Institutional Review Board (IRB)
This work does not require IRB approval.
1 Introduction
The global COVID-19 pandemic has drawn the attention of researchers to understand the origin of (zoonotic) viruses in humans. In the case of the coronaviruses (the family Coronaviridae), it has been established that SARS was transmitted to humans from civets and MERS-CoV from dromedary camels (Reusken et al., 2014). In contrast, it is widely thought that SARS-CoV-2 (which causes COVID-19) originated from bats (Zhou et al., 2020). However, numerous zoonotic diseases have been around for a while, and medical professionals have been attempting to combat them better. The rabies virus is one such illness with a near 100% death rate after symptoms appear (Taylor and Nel, 2015). All mammal species are susceptible to rabies. However, domestic dog bites account for up to 99% of human rabies cases (WHO — Rabies, 2021). There is frequent spillover from dogs into other carnivores, but typically this only results in transient chains of transmission. Therefore, it is crucial to locate and keep an eye on any potential wildlife reservoirs (Worsley-Tonks et al., 2020). It is crucial to understand the origins of such diseases to create effective prevention and mitigation measures as well as vaccines and therapeutics. Pathogen sequence data are readily available, and genomic monitoring is being used more and more frequently. To account for this, genomic tools and classification algorithms need to be updated. New genomic technologies (Gigante et al., 2020), machine learning and learning-based classification can improve disease control and epidemic response (Ali et al., 2023d; Chourasia et al., 2023b).
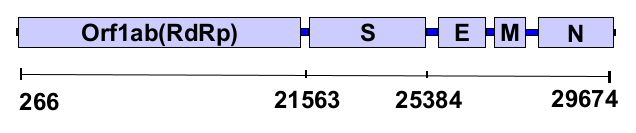
The coronaviruses (CoVs) are grouped into five genera, infecting different hosts, including humans, palm civets, bats, dogs, and monkeys, among others (Li et al., 2006). CoVs are known to mutate quickly and adapt to new environments. They have shown a capacity for animal-to-human, human-to-animal, and animal-to-animal transmission (Graham and Baric, 2010). There have been accounts of cross-species transmission and alteration in viral tropism resulting in new diseases in different hosts (Shi and Hu, 2008; Vijgen et al., 2006). The surface (S) protein or spike protein of different CoVs is key to the binding and entry of the virus into the host cell and determines the range of host specificity. It is composed of the receptor-binding domain or S1 subunit and S2 subunit (see Figure 1) that harbor sequences for viral fusion to the cell membrane (Li et al., 2006). The spike proteins of CoVs recognize different receptors across different hosts. Also, the sequences of the S1 subunit of CoVs has been reported to show differences across genera (Li, 2016).
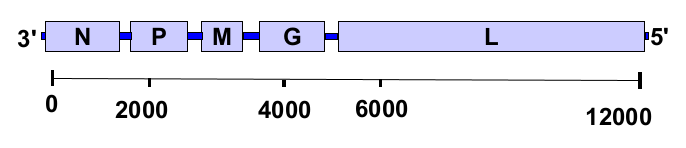
The rabies Lyssavirus (RABV), belongs to the genus Lyssavirus in the Rhabdoviridae family. Rhabdoviruses are simple viruses that encode five proteins and appear as bullet-shaped, enveloped virions with glycoprotein spikes on the surface. These virions have a helical nucleocapsid within the envelope that is symmetrically coiled into a cylindrical structure. The nucleocapsid is composed of one molecule of negative sense, single-stranded RNA about 12kb long. Even with only five proteins encoded, the virus can protect itself from ribonuclease digestion and retain a shape ideal for transcription. Five proteins (N, P, M, G, and L) are produced as shown in Figure 2.
Traditional methods based on phylogenetic tree construction are computationally expensive and do not scale to the large volume of sequence data (Hadfield et al., 2018). Employing machine learning on sequencing data is a viable alternative (Ali and Patterson, 2021). However, some of the existing sequence classification methods, such as the one proposed in (Kuzmin et al., 2020), require the sequences to be aligned (sequence characters must be in a one-to-one correspondence). Aligning large volumes of sequences is computationally expensive (if required) and utilizes expert knowledge that can potentially introduce bias in the data (Golubchik et al., 2007). Planning future endemic/pandemic protection measures on time may be aided by alignment-free embedding techniques (Ali et al., 2023b). They will be helpful in swiftly implementing machine learning solutions and work as excellent tools for healthcare professionals.
This paper proposes a feature vector generation named Virus2Vec. We depict the spike protein sequences of the SARS-CoV-2 and rabies viral nucleotide sequence data using Virus2Vec. It provides for improved host identification and downstream clustering and classification activities. Virus2Vec combines the use of minimizers and the position weight matrix (PWM) for a compact alignment-free representation of amino acid sequences. Although the notion of minimizer is previously used in metagenomics (Girotto et al., 2016; Chourasia et al., 2023a), it has not been used (to the best of our knowledge) for viral sequence classification. The main contributions of this work are:
-
1.
We propose Virus2Vec, a compact alignment-free embedding approach based on minimizers and the position weight matrix to generate a feature vector representation of different coronaviruses and rabies virus sequence data.
- 2.
-
3.
We show that without aligning the sequences and using a fraction of the information as compared to a more traditional -mers based approach (Ali et al., 2023d), we are still able to outperform the baselines and state-of-the-art (SOTA) methods.
-
4.
Virus2Vec is a compact sequence representation scheme that is scalable to “Big Data” and can also be used for many other sequence analysis tasks.
Our manuscript is organized as follows: Section 2 contains the previous work for sequence classification. Section 3 contains the detail about our proposed alignment-free method for sequence classification. Section 4 contains the experimental setup and dataset collection and statistics detail. The results for our proposed method are in Section 5. Finally, we conclude our paper in Section 6.
2 Related Work
After the spread of COVID-19, efforts have been made to study the virus’s behavior using machine-learning approaches to biological sequences. Using a trait-based approach, authors in (Worsley-Tonks et al., 2020) identified candidate wildlife species that may contribute to the transmission and maintenance of rabies Lyssavirus(RABV). This approach has a problem since the domestic dog (Canis lupus familiaris) is regarded as a key reservoir in many developing nations, particularly in African and Asian countries (Cleaveland and Hampson, 2017). Because of the vast number of canine cases and the absence of standard wildlife monitoring systems (Vercauteren et al., 2012) or diagnostic assays, most wildlife species’ contributions to the preservation of certain RABV variants are still largely unknown (Cordeiro et al., 2016). Considering modern approaches, some work is done using sequence data for machine learning-based solutions.
Authors in (Ali et al., 2023b) use -mers and a kernel-based approach to classifying the spike sequences. However, it can not scale on big data because of memory inefficiency. Authors in (Kuzmin et al., 2020) propose using one-hot encoding to classify the viral hosts of coronavirus using spike sequences only. Although they achieved higher predictive performance, authors in (Ali et al., 2023c) show that the -mers-based approach outperforms the one-hot. Authors in (Taslim et al., 2023; Ali et al., 2023a) propose a faster method for embedding generation but it mainly focuses on faster implementation as compared to generating a compact and effective embedding.
For the embedding generation of short reads data, authors in (Chourasia et al., 2023a) advise using a minimizer-based technique. Additionally, the classification of metagenomic data has been suggested in (Wood and Salzberg, 2014a; Kawulok and Deorowicz, 2015). To obtain accurate read binning for metagenomic data, the authors in (Girotto et al., 2016) use probabilistic sequence signatures. According to the theoretical work on minimizers (Zheng et al., 2020), there is a close relationship between universal hitting sets and minimizers schemes, where efficient (low-density) minimizers schemes match up with small-sized universal hitting sets. The main issue with all of these methods is that is intended for short reads data and they cannot be used in real-world situations where there may be millions of sequences because they cannot scale to larger datasets.
Sequence analysis, motif predictions, and identification investigations have effectively used position weight matrix (PWM) based techniques. A number of well-known software programs or web servers, such as the PWMscan software package (Ambrosini et al., 2018), and PSI-BLAST (Bhagwat and Aravind, 2007), have been developed based on the implementation of PWMs. The development of a PWM-based approach for protein function prediction and a justification for the PWM and its related characteristics’ high potential for protein sequence analysis are presented in (cheol Jeong et al., 2010). Although the aforementioned approaches are effective in these fields, they do not offer a universal approach for designing a feature embedding for the underlying sequence, which would contain rich information about the sequence and serve as input to various machine learning algorithms.
In another work a position weight matrix (PWM) based approach is proposed in (Ali et al., 2022a), which generates a fixed-length representation of spike sequences based on weights of -mers computed using a PWM. However, their method only works with aligned sequence data. Authors in (Girotto et al., 2016) propose the use of minimizers for metagenomic data. Since metagenomic data contains short reads, each can be represented by a single minimizer (-mer) (Chourasia et al., 2022b, 2023a). Their approach is not directly applicable to our scenario.
3 Proposed Approach
This section discusses our proposed alignment-free methods based on minimizers and the position weight matrix (PWM) to design a better feature vector representation from spike amino acid sequences and rabies virus nucleotide sequences. The problem of sequence classification is challenging due to the following points.
-
1.
Sequences can have different lengths. Designing a fixed-length numerical representation without loss of information becomes challenging.
-
2.
Mutations (changes in the sequence) do not happen randomly but rather due to selection pressures. For example, mutations happen disproportionately many in the spike region of coronaviruses due to their importance in interfacing with the host. Designing a model to capture those variations is challenging.
-
3.
Some of the existing method requires sequence alignment as a preprocessing step. Designing a scalable alignment-free method without compromising on predictive performance is challenging.
3.1 Virus2Vec
Although -mers-based frequency vectors are proven to be efficient and perform better than the traditional one-hot-encoding on aligned sequences (Ali et al., 2023b), a major problem with -mers is that there are too many (similar) -mers generated for a given sequence (Wood and Salzberg, 2014b). Counting these similar -mers can be an expensive — and redundant — task, as for each -mer, we need to check which “bin” of the frequency vector it will be placed. Another issue could be storing all -mers in memory, especially for longer sequences. Hence, we need memory efficient way to make the overall algorithm scalable. For a given -mer, a minimizer of length () is the -mer that is lexicographically smallest both in forward and reverse order of the -mer.
Remark 3.1.
Authors in (Singh et al., 2017) considered the first characters from -mers (to design ) rather than selecting the lexicographically smallest characters. However, we noted that we were getting better results by considering the smallest characters lexicographically. Thus, we use this approach.
See Figure 3 for an example of a set of -mers and the corresponding minimizers. To compute minimizer, sliding window is used on -mer to find minimizes from both directions(forward and reverse). And finally, the lexicographic smallest is selected as the minimizer for that -mer.In this way, minimizers ignore many amino acids in each -mer, only preserving a fraction of the -mers, for which binning of these -mers becomes much more efficient. Using the minimizers for , which is decided empirically using standard validation set approach (Devijver and Kittler, 1982), we generate a fixed-length feature vector of length . For each minimizer, we compute a weight using the “Position Weight Matrix” (PWM) method. Figure 4 shows the flow diagram for Virus2Vec.
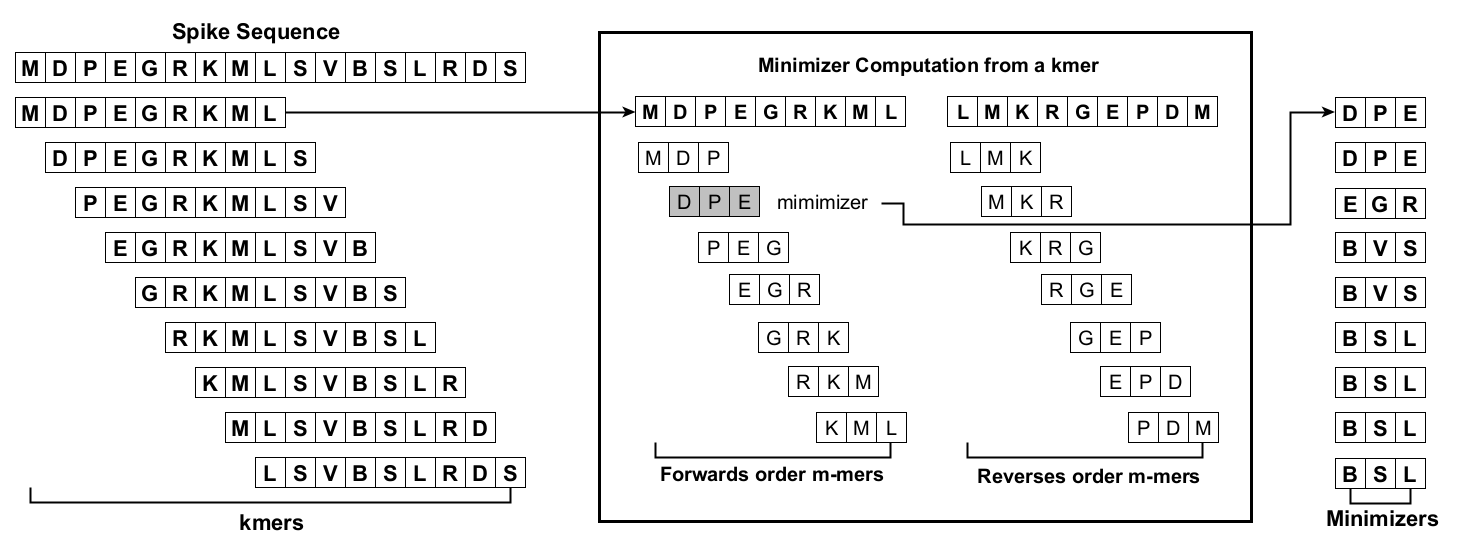
Figure 4, consists of the steps (a–g) as explained next. Given an input spike protein sequence, Figure 4 (a) extract the minimizers (-mers) of length (decided using a standard validation set approach (Devijver and Kittler, 1982)). A Position Frequency Matrix (PFM) is generated see in Figure 4 (b), which contains the frequency count for each character at each position. In our experiments, since we have unique amino acids in the spike protein sequence dataset, our PFMs have 20 rows and columns. Whereas for rabies virus sequence dataset we have unique nucleotide; our PFMs have 4 rows, and columns. In Figure 4 (c), we normalize the PFM matrix to create a Position Probability Matrix (PPM) containing the probability of each amino acid at each position.
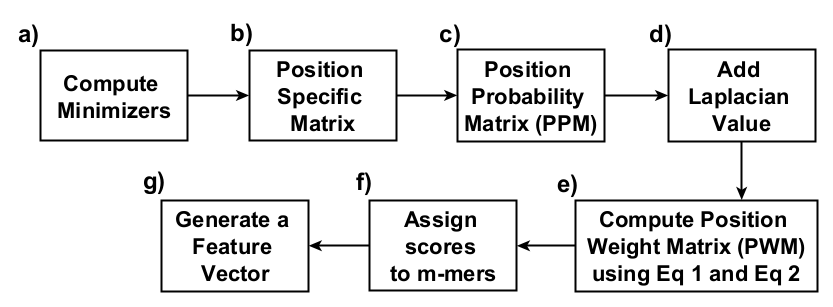
It is possible that the frequency (hence probability in the PPM) of a character at a certain position is 0. To avoid zeros, we add a Laplace estimator or a pseudocount to each value in the position probability matrix as shown in Figure 4 (d). We use a pseudocount of 0.1 in our experiments (Nishida et al., 2009). A position weight matrix (PWM)is then computed from the adjusted probability matrix (after adding laplacian). We make the PWM by computing the log-likelihood of each amino acid character , i.e., for spike sequences or for rabies virus sequences, appearing at each position according to the following expression:
| (1) |
where or and
| (2) |
The is the number of codons for each amino acid (i.e., 1 for MW, 2 for CFYHQNKDE, 3 for I, 4 for VPTAG, and 6 for RL) and is the number of sense codons.
As shown in Figure 4 (e), by using Equation 1, a scalar value to each Amino Acid (AA) for each position in -mer is assigned. After getting the PWM, we use it to compute the absolute scores for each individual minimizer generated from the sequence. It is the sum of the score of bases for the index.
After getting the score for each -mer, the final step as shown in Figure 4 (g) we generate a vector of length . We use the score of each -mer (computed using the PWM-based approach) to the corresponding bin to get the final feature vector representation. The pseudocode for Virus2Vec is given in Algorithm 1.
Remark 3.2.
Note that steps b to f in Figure 4 for our method are the same as given in PWM2Vec (Ali et al., 2022a). Our method differs in a way that it works with the minimizers instead of -mers (our input is different as given in step a). The idea of using minimizers is that they are proven to work better compared to the -mers in the metagenomic domain (Girotto et al., 2016). However, their use for full-length sequences is not well explored. Similarly, our feature embedding is “general” and can work for both aligned and unaligned sequences (see step g), unlike the PWM2Vec, which only works with aligned sequences. Our methods differ in the computation of likelihood weight for each amino acid, where we consider rather than the equal probability of each amino acid (which is ) as given in PWM2Vec method.
4 Experimental Setup
This section describes the setup we used for the experiments, followed by the dataset statistics in the 4.1. We also give a visual representation of the data using t-SNE plots and its discussion in the 4.2. Later, we discuss the baseline models in 4.3 and its detailed discussion in 4.4 followed by we discussion of the Ablation study in Section 4.5.
All experiments are conducted using an Intel(R) Xeon(R) CPU E7-4850 v4 @ GHz having Ubuntu bit OS ( LTS Xenial Xerus) with 3023 GB memory. The algorithm is implemented in Python, and the code is available online for reproducibility 444https://github.com/sarwanpasha/Virus2Vec. We use several algorithms and metrics for classification, as shown in Table 4. We are using the area under the curve (AUC) receiver operating characteristic curve AUC-ROC because it is prone to overestimation and pulls the false positive rate towards zero (Sofaer et al., 2019). Finally, we report each classifier’s training time (in seconds). We split the data into training and testing (held-out) sets, respectively. We run experiments with random initialization for train-test splits and report average results. We use fold cross-validation in the training set for hyperparameter tuning.
4.1 Dataset Collection and Statistics
In this work, we use two datasets: Spike Sequence from the SARS-CoV-2 virus, and Rabies sequences data. The statistics and details are provided in Table 1. The multiple sequence alignment (MSA) is conducted using Mafft Alignment software to get aligned sequences for Coronavirus Host Data that we use to evaluate the baseline approach, some of which require Aligned Sequences.
| Name | Type | Source | Sequence Count | Classes | Sequence Length | |||
|---|---|---|---|---|---|---|---|---|
| Min | Max | Avg | Mode | |||||
| Coronavirus Host Data | Spike protein sequences for COVID-19 hosts | GISAID (GISAID Website, 2021), ViPR (Pickett et al., 2012) | 5558 | 22 | 9 | 1584 | 1272.4 | 1273 |
| Rabies Virus Data | Nucleotide genome sequences for rabies virus hosts | RABV-GLUE (RABV GLUE Website, 2021) | 20051 | 12 | 90 | 11930 | 1948.4 | 1353 |
4.2 Data Visualization
In order to see if there is any natural (hidden) clustering in the data, we use t-distributed stochastic neighbor embedding (t-SNE) (Van and Hinton, 2008), which maps input sequences to 2D representation. Particularly in the natural sciences, t-SNE is well-liked because of its ability to handle vast volumes of data and its usage for dimensionality reduction while maintaining the structure of the data (Chourasia et al., 2022a). Here, we use t-SNE to analyze and contrast the ability of various embeddings to preserve the structure. The t-SNE plots for SARS-CoV-2 spike sequences for different embedding methods are shown in Figure 5 for Spike2Vec, Approx. Kernel, MFV, PWM2Vec, and Virus2Vec, respectively. We can observe that with Virus2Vec, t-SNE is able to preserve the structure of data in the same way as with the other existing embedding methods, which shows that Virus2Vec is preserving the overall structure of data. Similarly, Figure 6 shows the t-SNE plots for rabies virus data for mentioned embeddings. Similar results can be seen in spike data. Virus2Vec does not disturb the structure and even provides better clusters as compared to baseline embeddings.
fig:subfigex
\subfigure[Spike2Vec]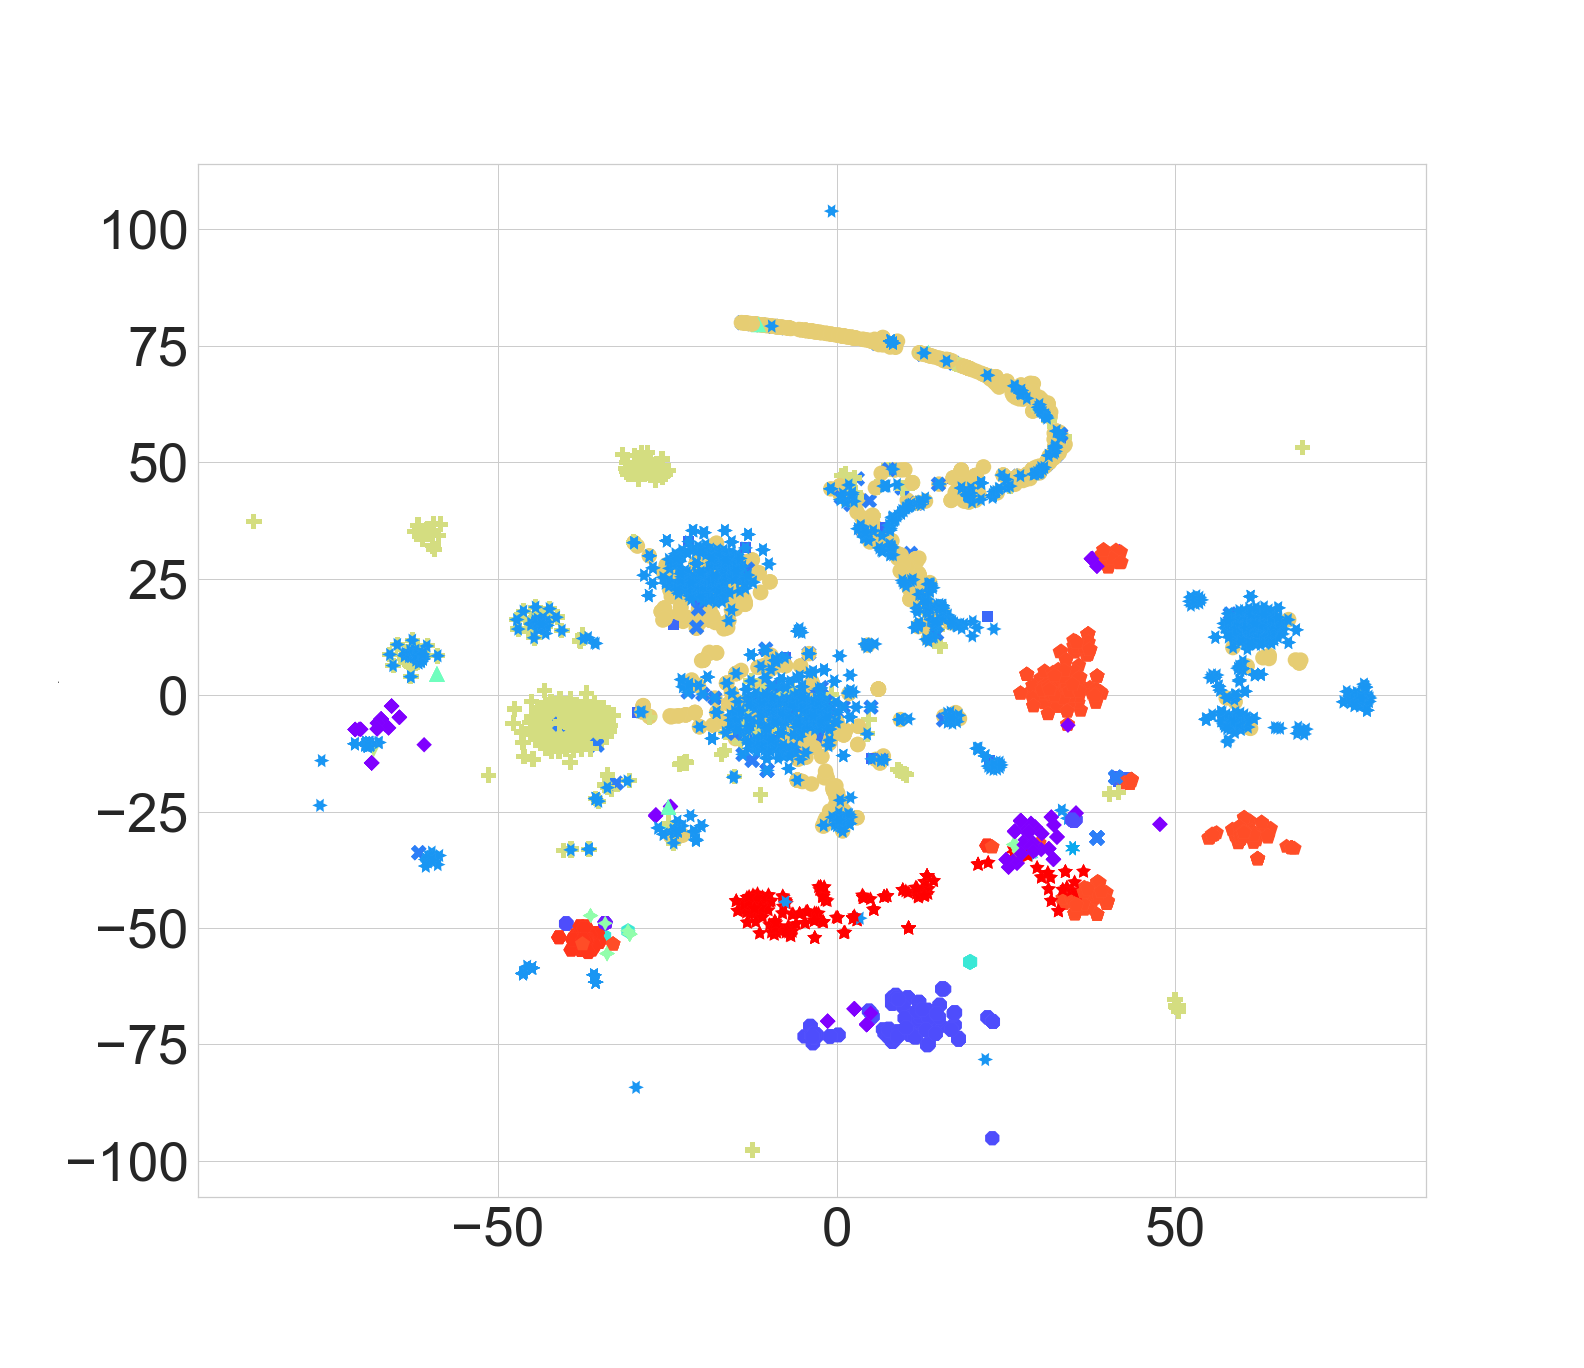 \subfigure[Approx. Kernel]
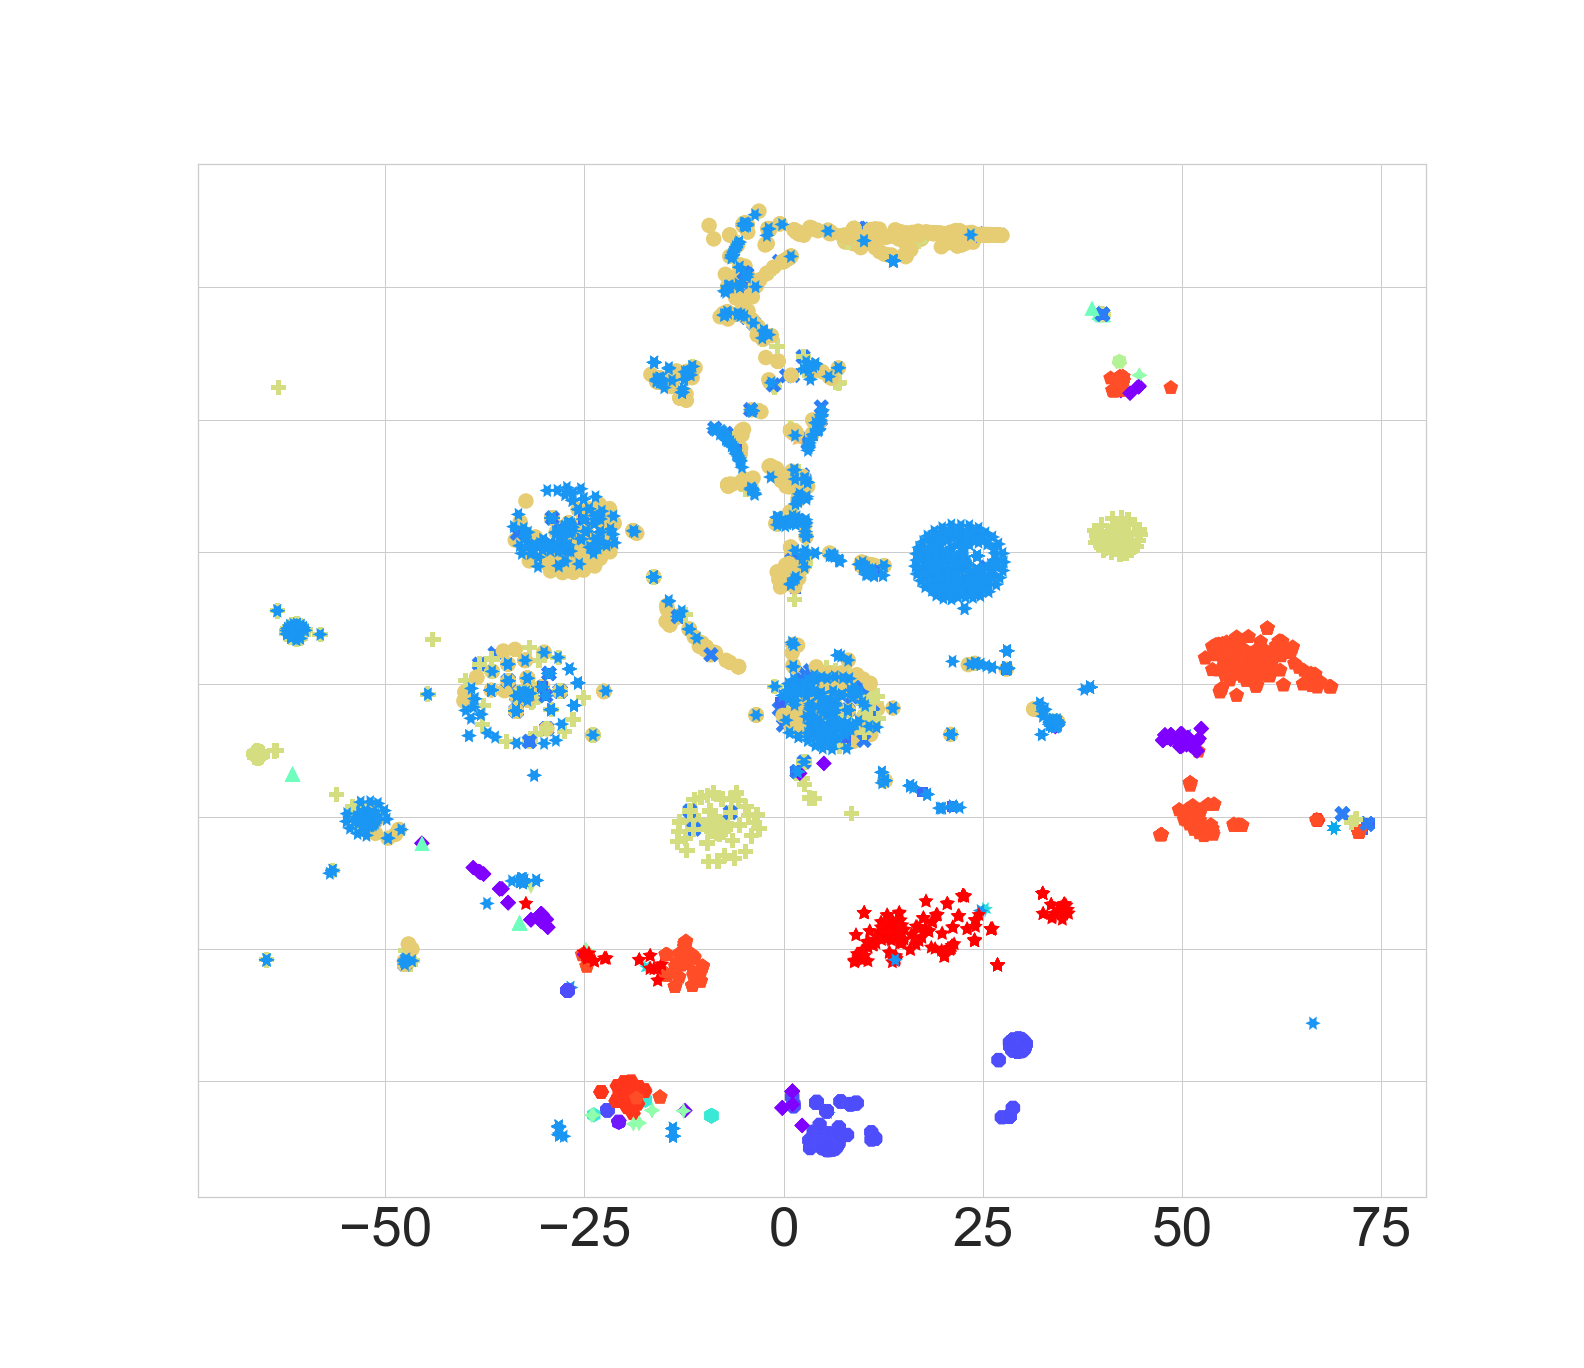 \subfigure[MFV]
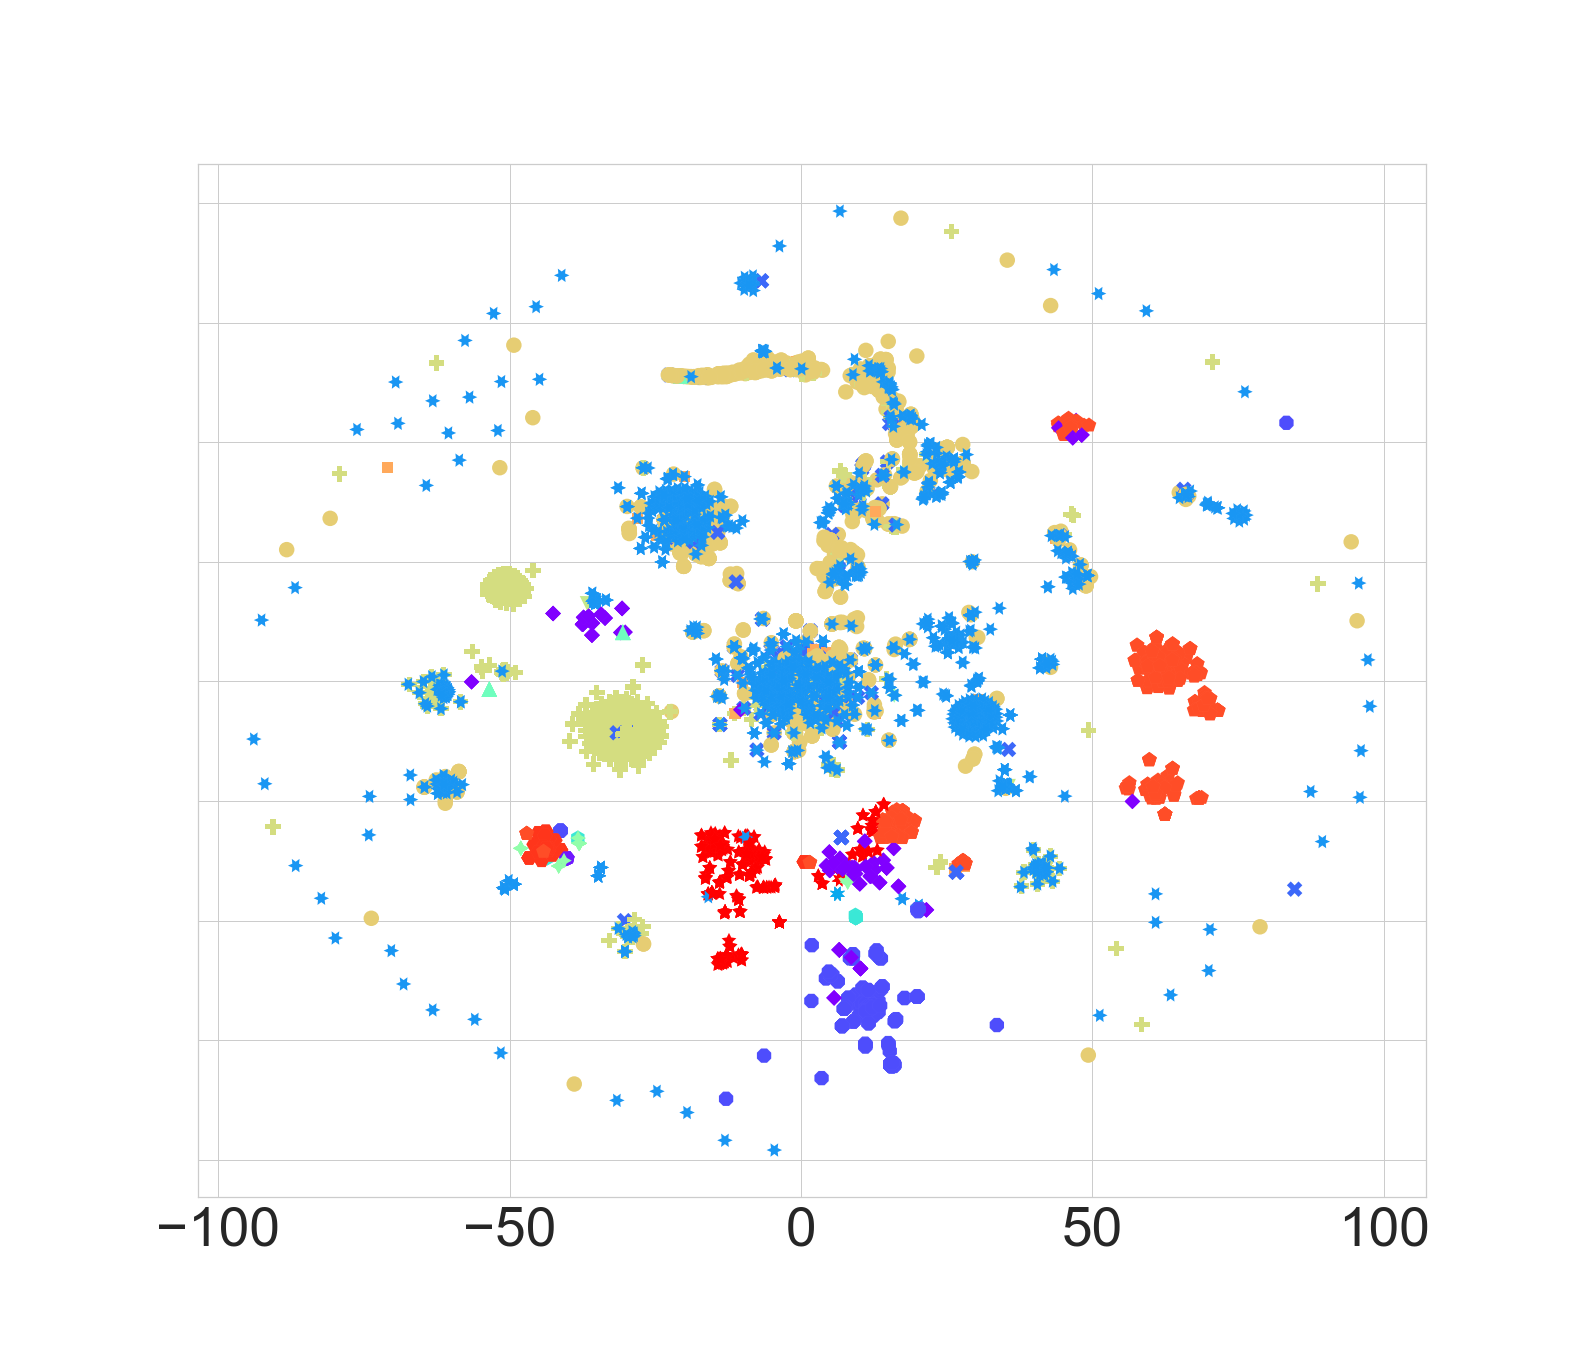 \subfigure[PWM2Vec]
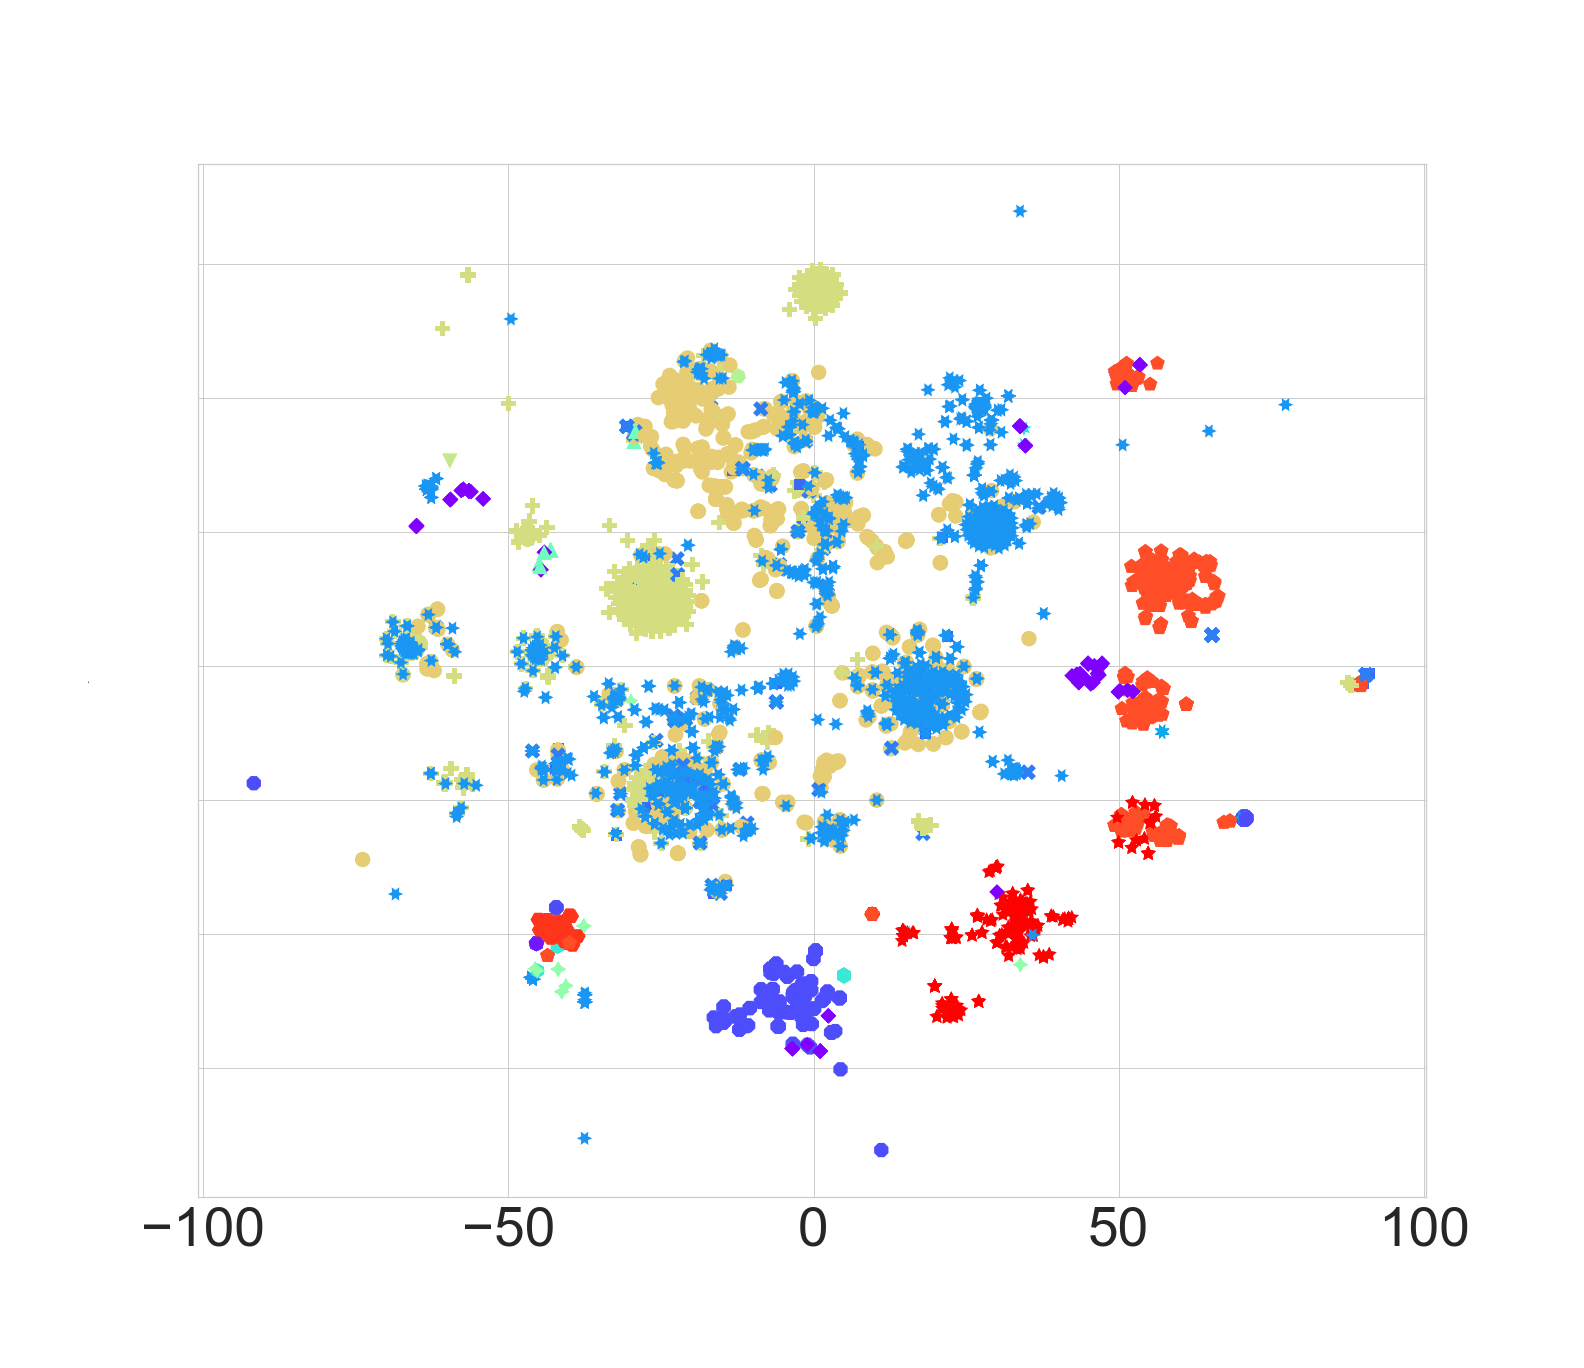 \subfigure[Virus2Vec]
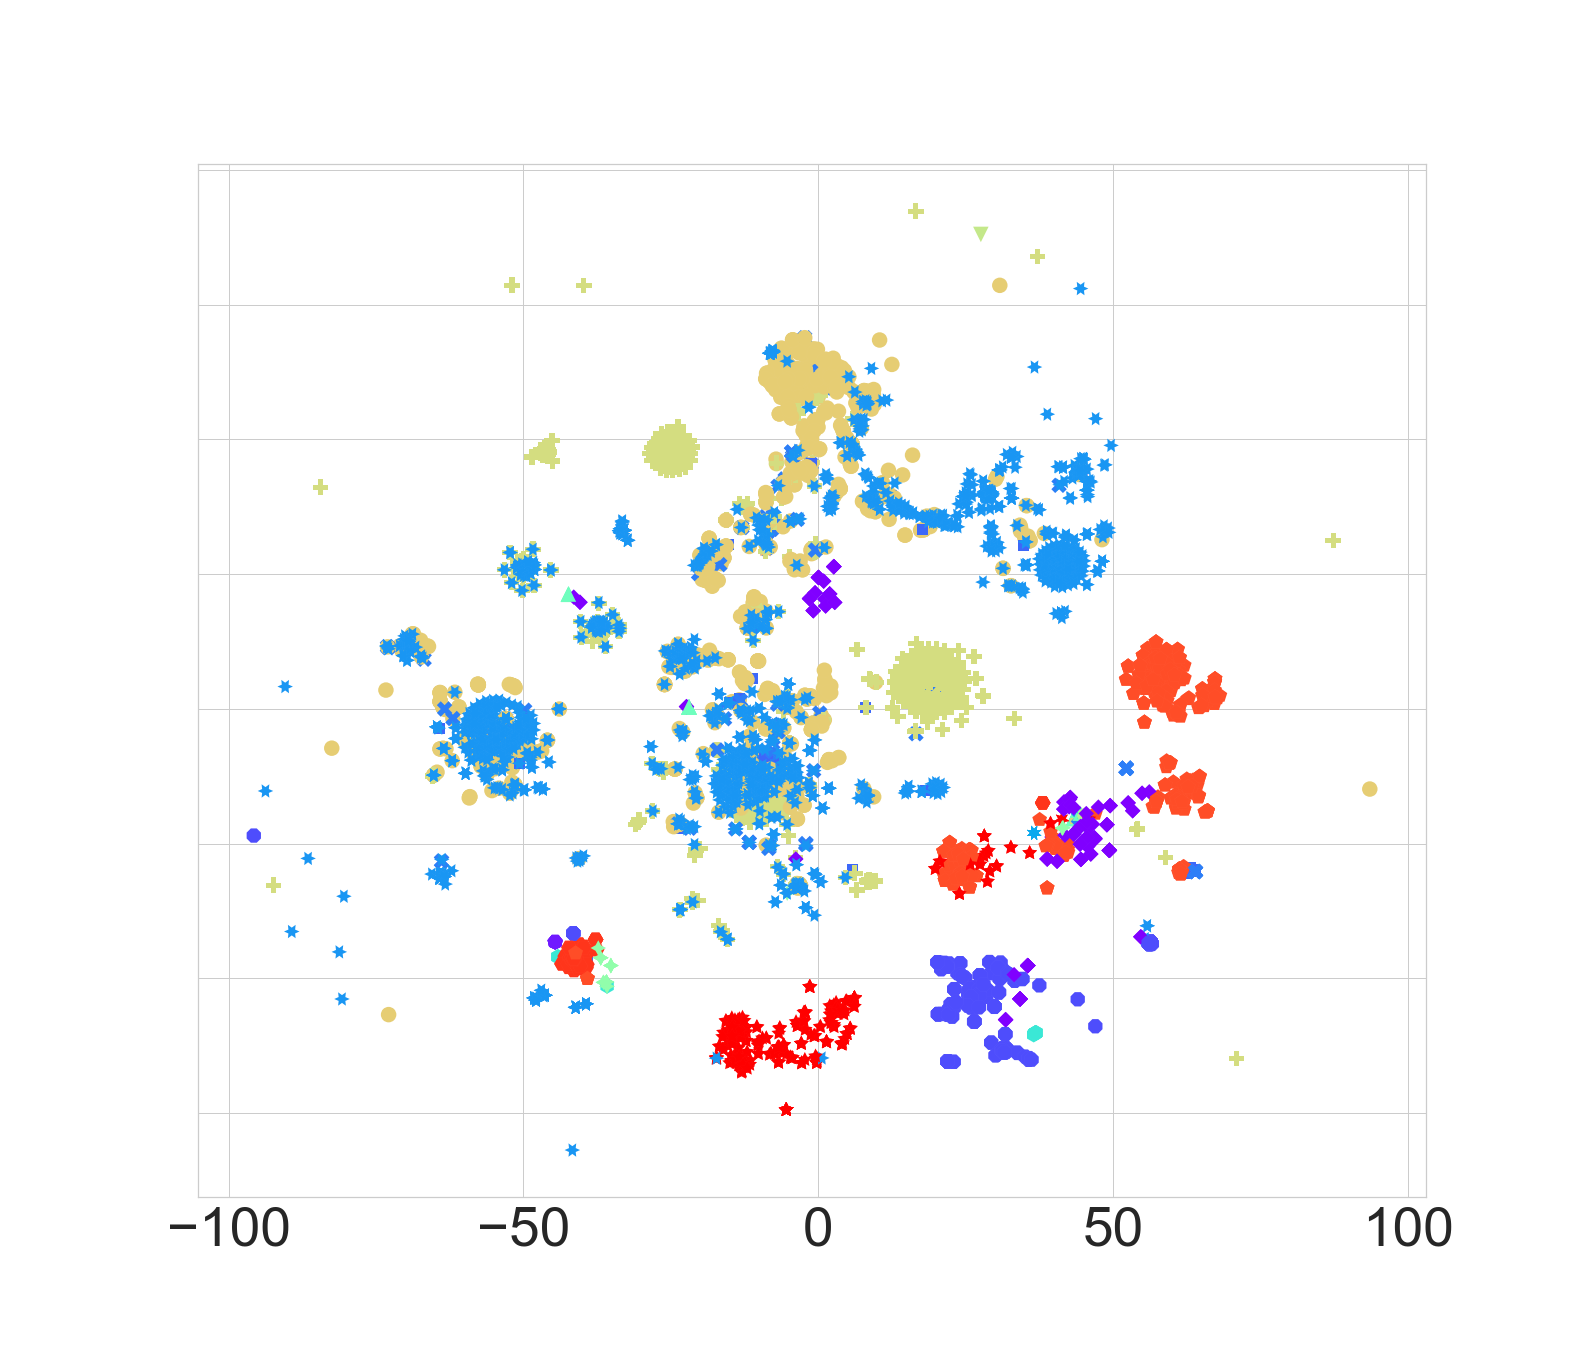

fig:subfigex
\subfigure[Spike2Vec]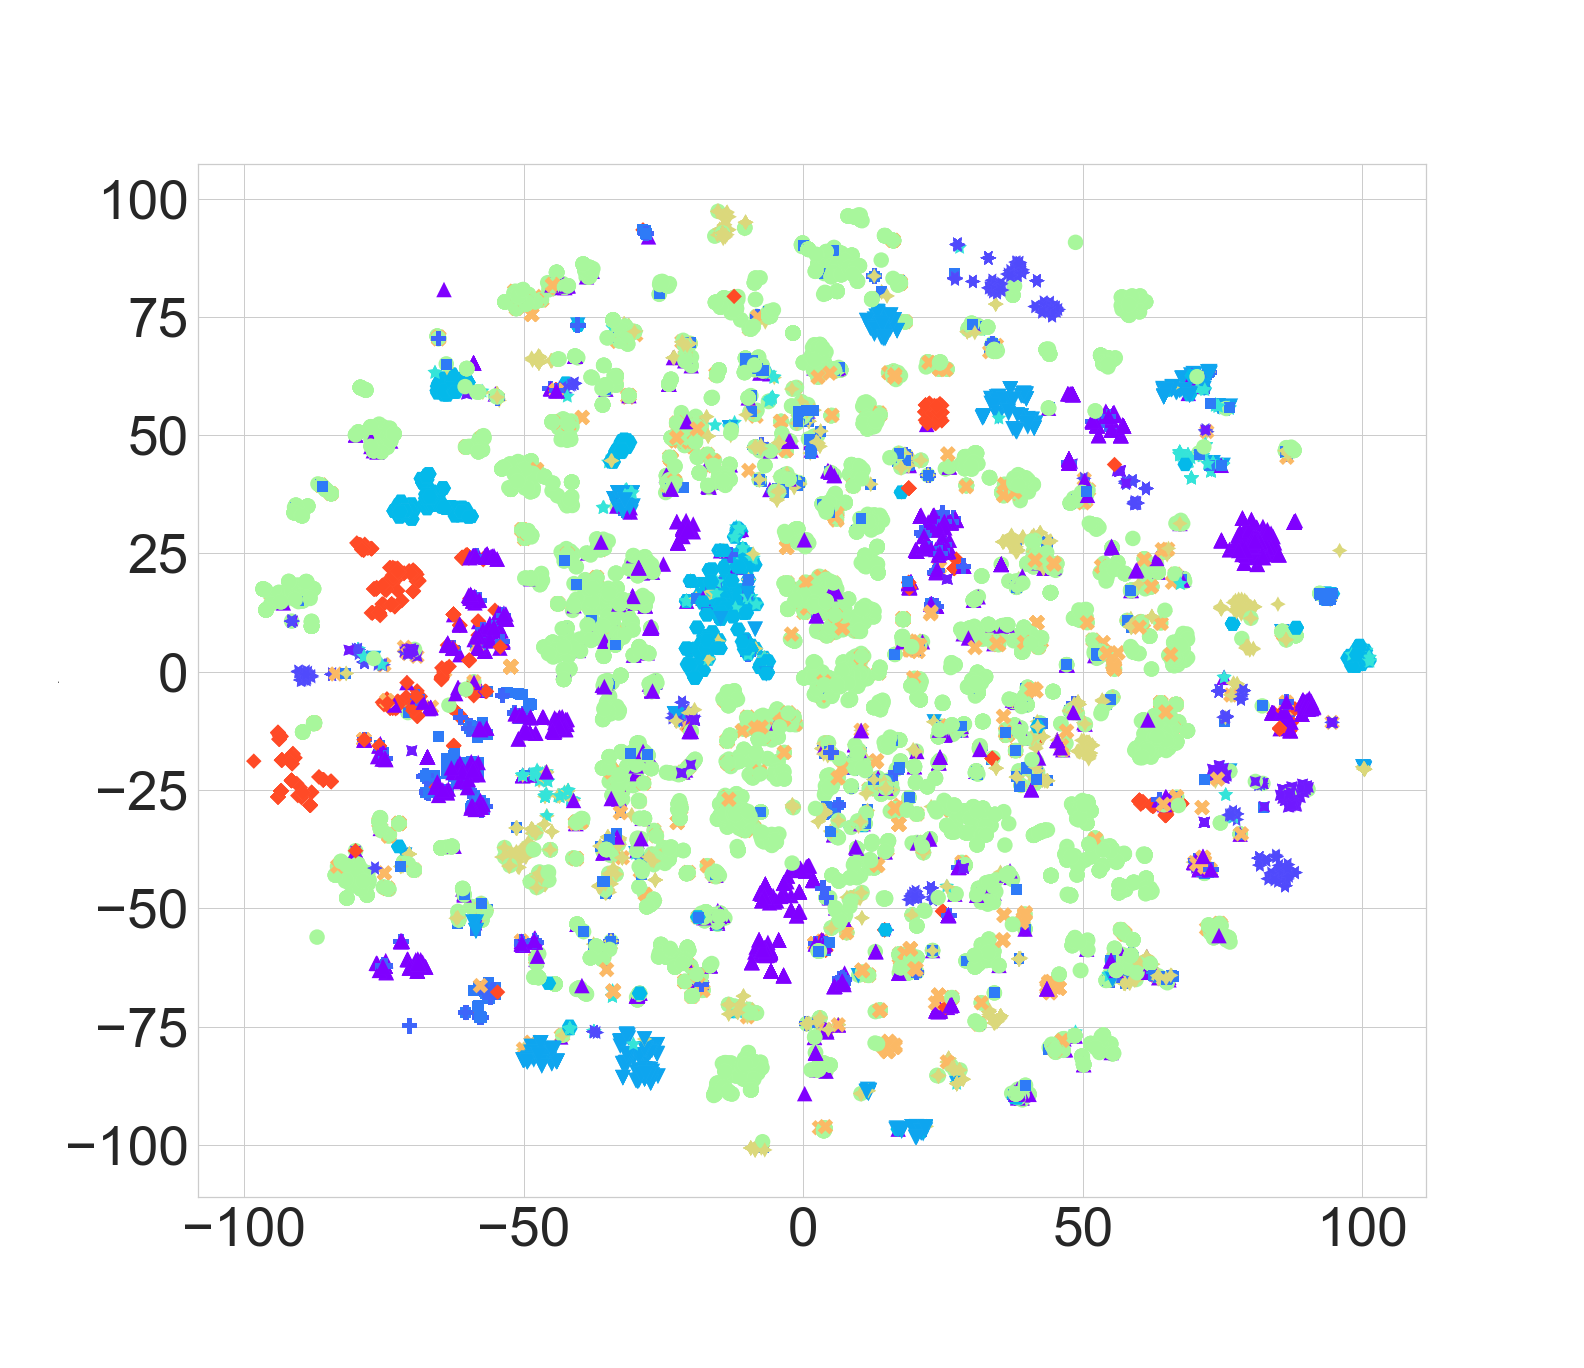 \subfigure[Approx. Kernel]
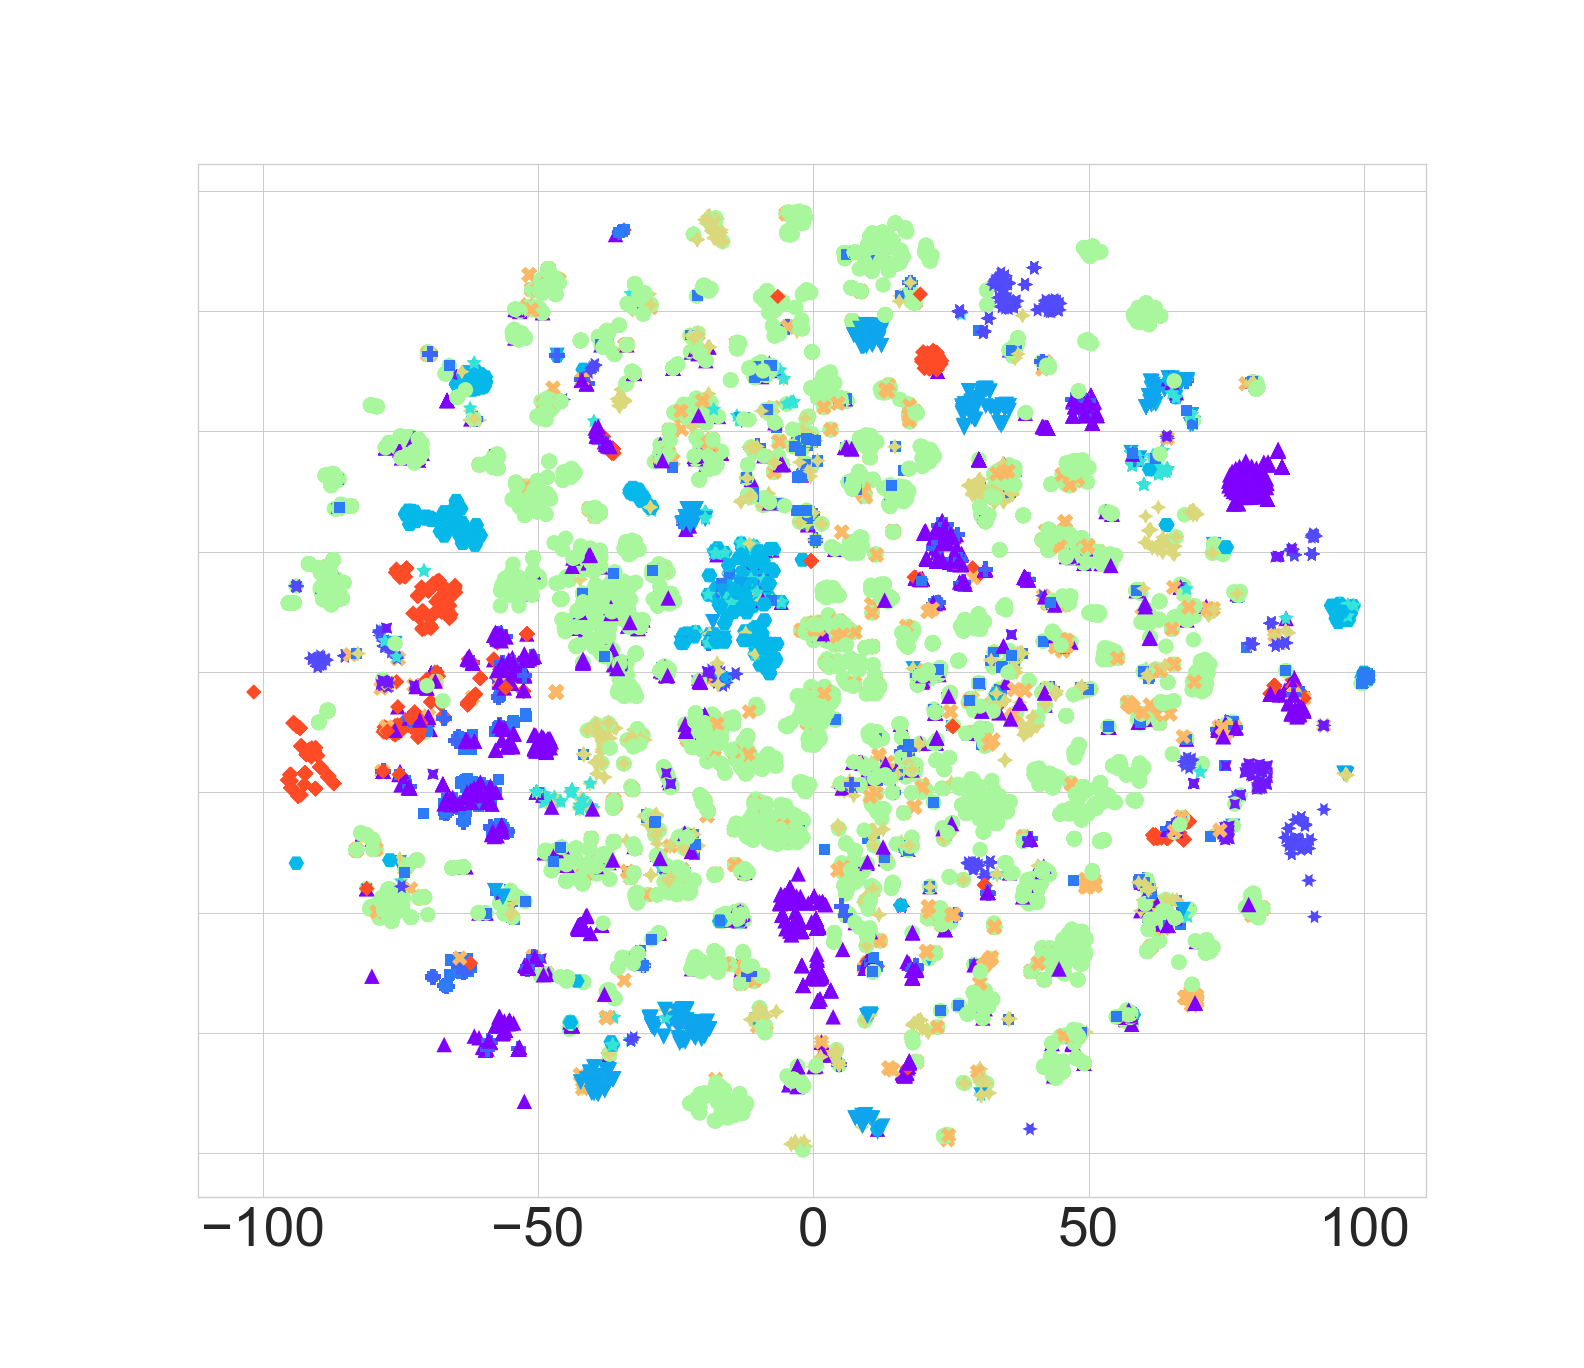 \subfigure[MFV]
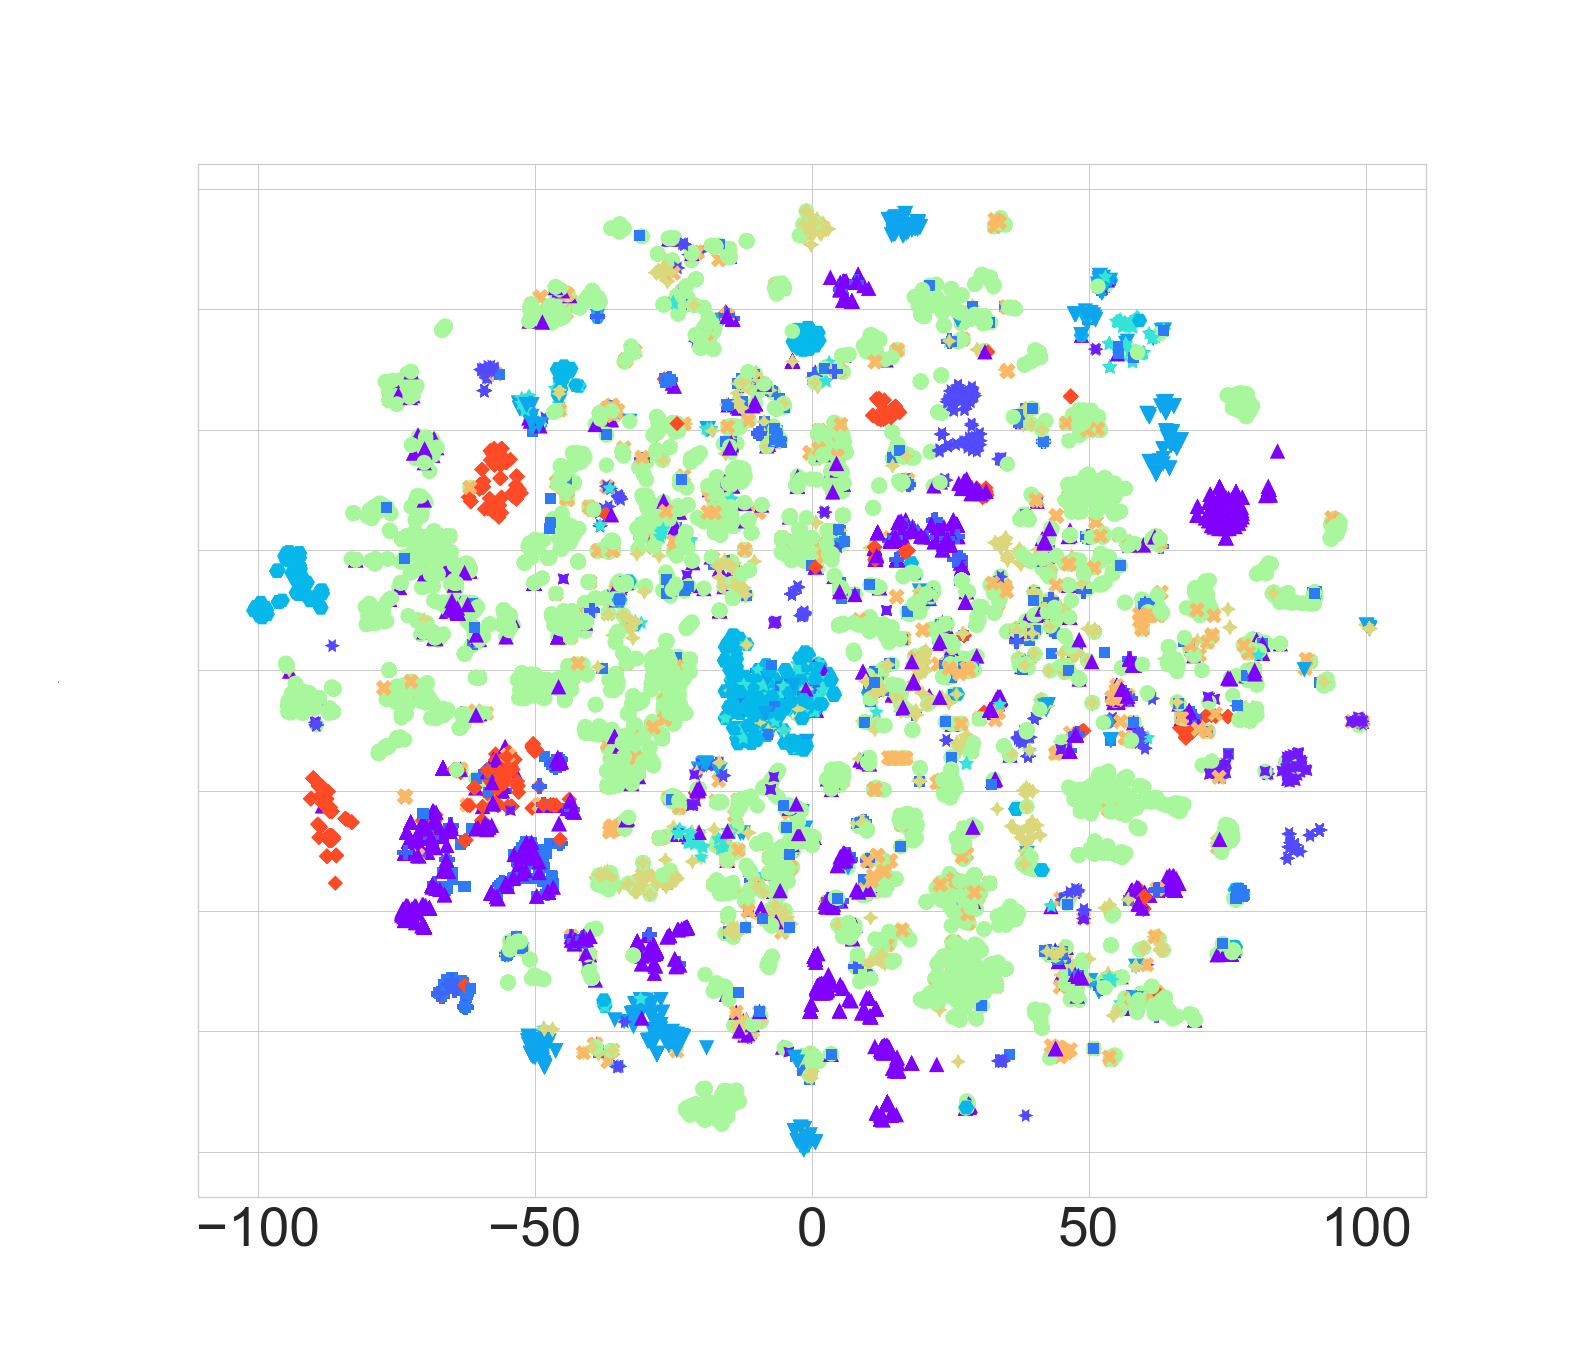 \subfigure[PWM2Vec]
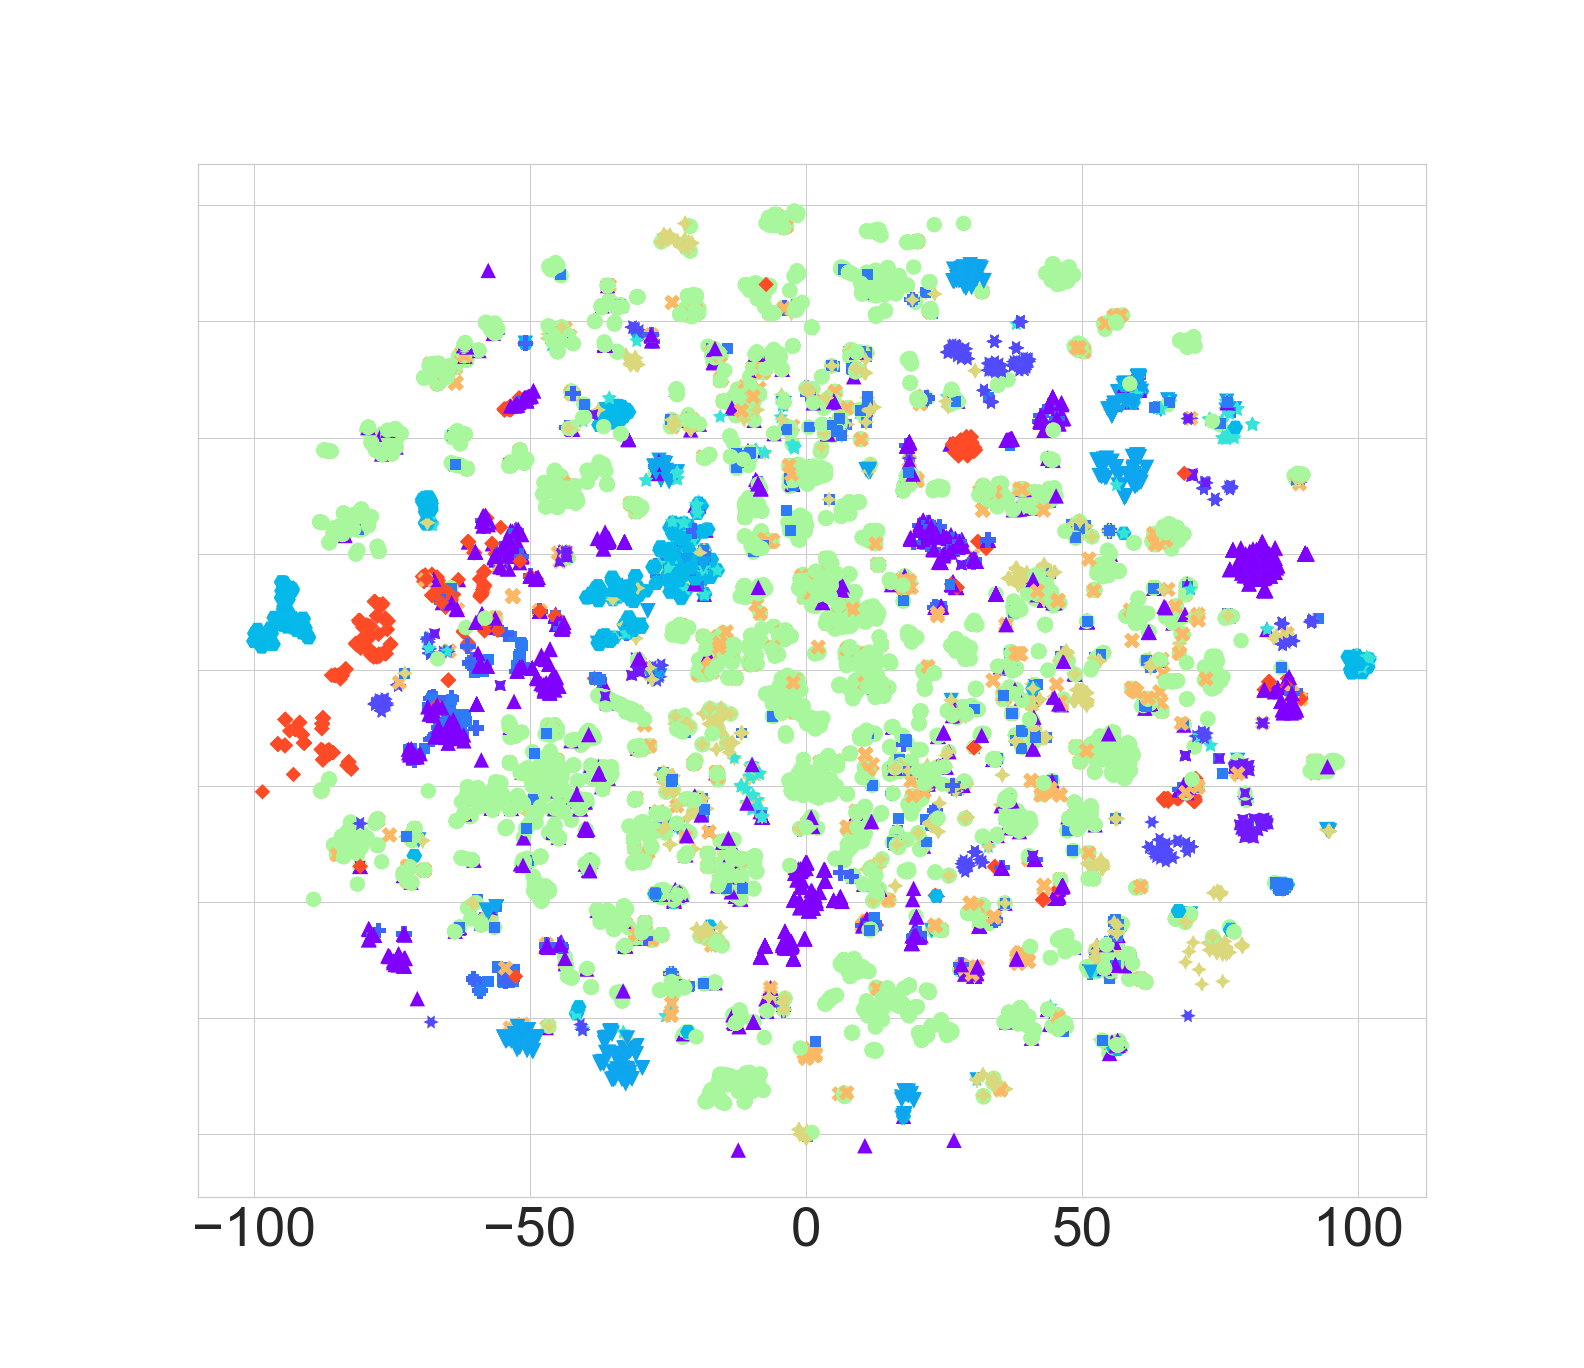 \subfigure[Virus2Vec]
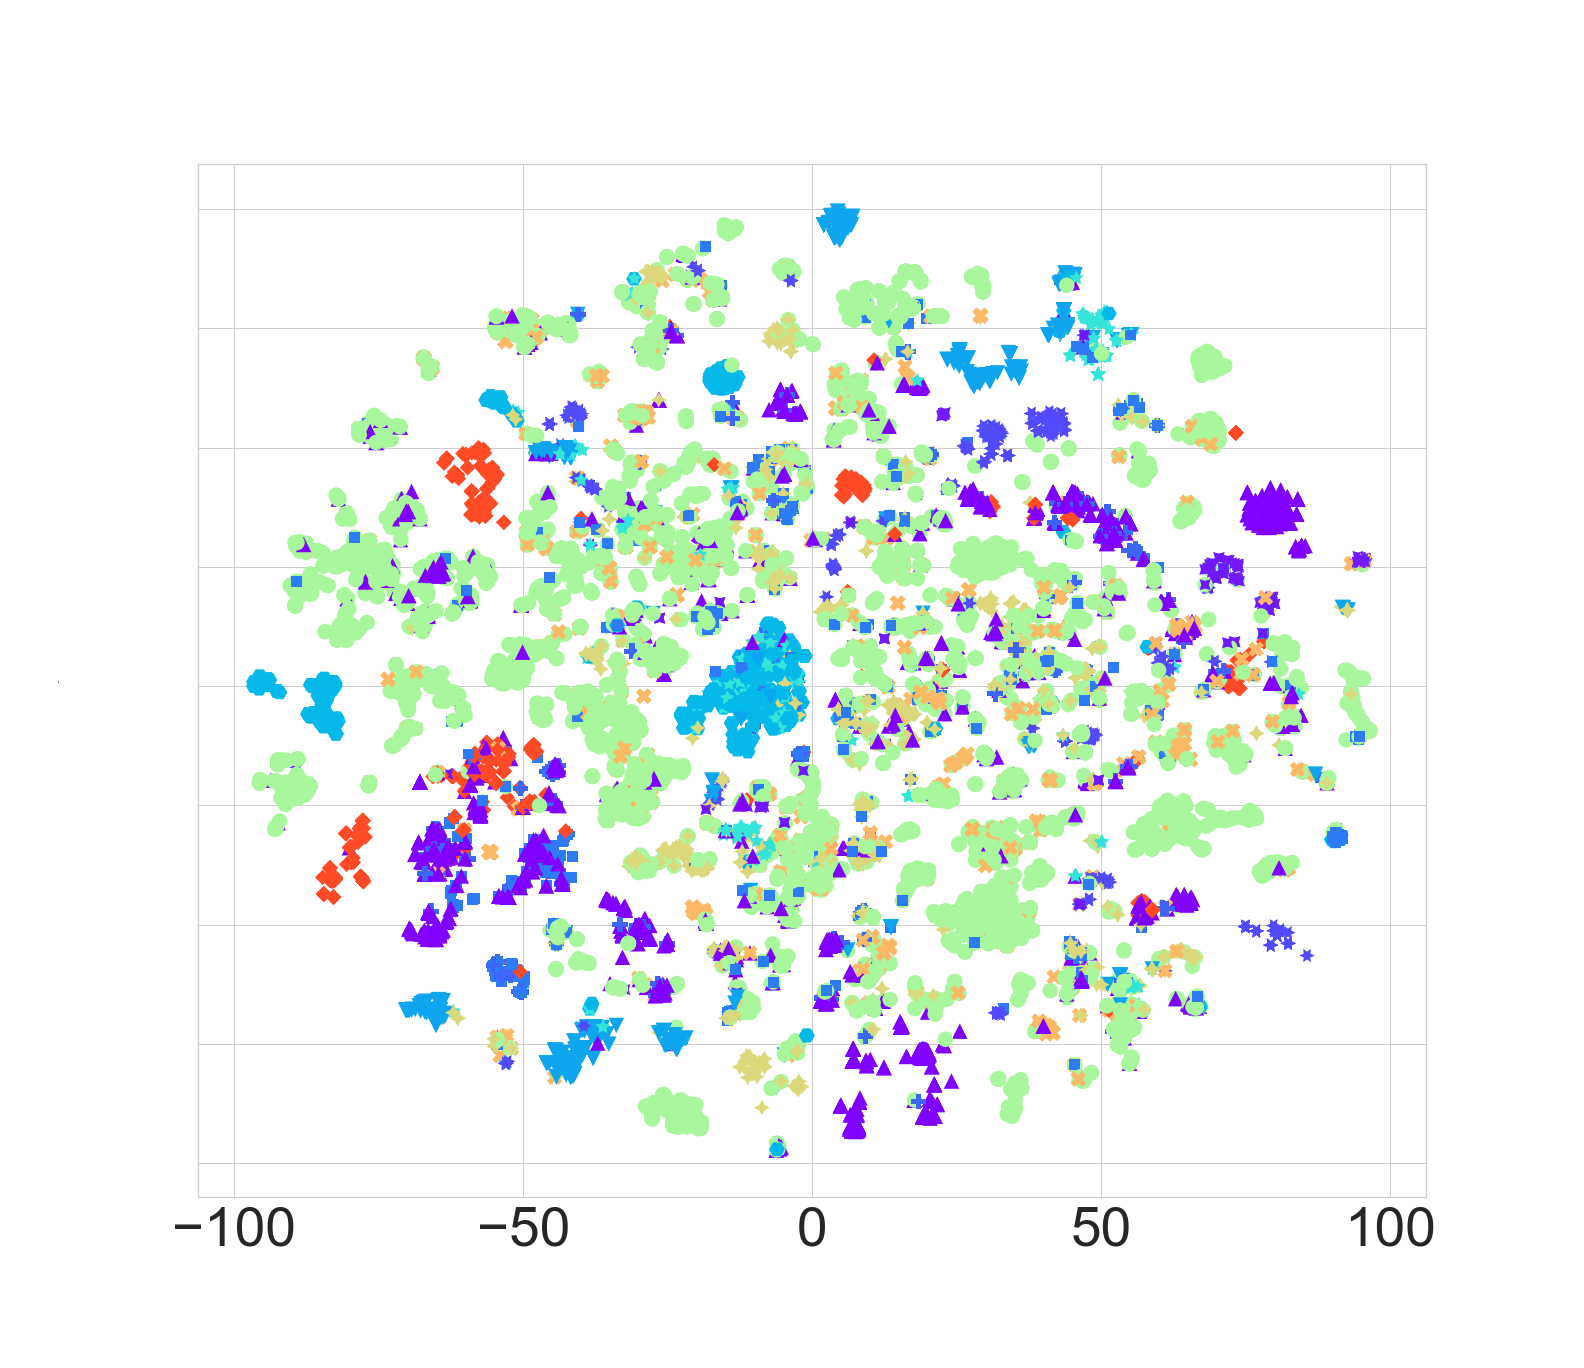

4.3 Baseline Models
A brief description of baselines and their comparison with the proposed model are provided in table 3. Detail description is given in section 4.4. We are using Neural Network models the configuration is provided in Table 2.
| Model | Embedding Layers | Custom Model Layer | Activation Function | Middle Layer | Dense Layer Dimension | Output Layer | Optimizer |
|---|---|---|---|---|---|---|---|
| Long Short-Term Memory (LSTM) (Hochreiter and Schmidhuber, 1997) | 500 | 2 LSTM layer 200 Units | Leaky Layer with alpha=0.05 | dropout with 0.2 | 500 | output layer Sigmoid Activation Function | ADAM Optimizer |
| Gated Recurrent Unit (GRU) (Cho et al., 2014) | 500 | A GRU layer 200 Units | Leaky Layer with alpha=0.05 | dropout with 0.2 | 500 | Sigmoid Activation Function | ADAM Optimizer |
| Convolutional Neural Network (CNN) (Lee et al., 2017) | 500 | convolutional layer(Conv1D) with 128 Filters and Kernel size 5 | Leaky Layer with alpha=0.05 | Batch Normalization, a max pooling layer of size 2 | 500 | Sigmoid Activation Function | ADAM Optimizer |
4.4 Baseline Methods Description
One-Hot Encoding (OHE)
A fixed-length numerical feature vector, called OHE is proposed in (Kuzmin et al., 2020). It generates a binary (0-1) vector based on the character’s position in the sequence given . Since the length of each spike sequence (after alignment) in our data is , the length of OHE for a spike sequence is then .
Spike2Vec
The spike sequence classification method, Spike2Vec, is recently proposed in (Ali and Patterson, 2021). Given a sequence, Spike2Vec computes -mers, where ( is the length of the spike sequence and as given in (Ali and Patterson, 2021)). After generating the -mer for a spike sequence, the count of each -mer is used to get the frequency vector.
Approximate Kernel
A kernel-based method for sequence classification is proposed in (Ali et al., 2022b) (for reference, we call this method “Approx. Kernel”). It computes the kernel value between two sequences using the dot product based on the matches and mismatches among the -mers spectrum. This kernel matrix is then used in our case as input to kernel PCA (Hoffmann, 2007) to acquire the feature vector representation.
PWM2Vec
PWM2Vec (Ali et al., 2022a) assigns different weights to each -mer in the feature vector depending on the values of the characters in the position weight matrix. The feature vector length equals the total number of -mers in an aligned sequence. The length of PWM2Vec-based embedding equals the number of -mers in a sequence. Since the number of -mers could be different for different length (unaligned) sequences, this method only applies to aligned sequences. Since the length of sequences in our dataset is (after alignment), the feature vector length for PWM2Vec is (which is equal to the total number of -mers in a sequence, where as mentioned in (Ali et al., 2022a)).
Spaced -mers
The feature embeddings generated by -mers suffer from sparsity and the curse of dimensionality, which negatively impacts analytical performance. To address these issues, the concept of spaced -mers was introduced (Singh et al., 2017). Spaced -mers are a set of non-contiguous substrings of length , also known as -mers. To generate an embedding using spaced -mers, the -mers of the sequence are first computed, and then -mers are extracted from these -mers. In our experiments, we use and , which were selected using a standard validation set approach.
We transform the raw sequence data into the numerical form that the machines can process to build the neural network (NN) models (for end-to-end training on the sequences). We use one hot encoding (with data padding) method considering 20 amino acids in the data. We use the following NN models as described below.
4.4.1 Long Short-Term Memory (LSTM)
The architecture of lstm scheme (Hochreiter and Schmidhuber, 1997) consists of an embedding layer (of embedding is ), an LSTM layer with memory units, a LeakyReLU layer with alpha = , an LSTM layer again with memory units followed by another LeakyReLU layer, a dropout with value , a Dense layer of dimensions followed by LeakyReLU layer, and finally an output layer and a sigmoid activation function. We use the ADAM (Diederik P. Kingma, 2015) optimizer.
4.4.2 Gated Recurrent Unit (GRU)
The GRU model (Cho et al., 2014) consists of an embedding layer (of embedding is ), a GRU layer with memory units, a LeakyReLU layer with alpha = followed by a Dropout layer with value , and finally a dense output layer and a sigmoid activation function. We also use the ADAM optimizer in the GRU architecture.
4.4.3 Convolutional Neural Network (CNN)
The CNN model (Lee et al., 2017) comprises an embedding layer (of embedding is ), a 1-D convolution layer (Conv1D) with filters with a kernel size of , a LeakyReLU layer with alpha = , a batch normalization layer, a 1-D convolution layer (Conv1D) again with filters and a kernel size of , a LeakyReLU layer with alpha = followed by batch normalization, a max pooling layer (pool size of ), a dense layer of 500 dimensions followed by a LeakyReLU layer with alpha = , and finally an output dense layer with a sigmoid activation function. For optimization, we use the ADAM optimizer.
| Embedding | Alignment Free | Low Dim Vectors | Vector (Spike/Rabies) | Space Efficient | Runtime Efficient | Details |
| One-Hot Encoding (Kuzmin et al., 2020) | ✗ | ✗ | 69960 / 5600 | ✗ | ✗ | length of OHE for a spike sequence |
| Spike2Vec (Ali and Patterson, 2021) | ✓ | ✓ | 8000 / 125 | ✓ | ✗ | and (for Spike data) |
| Approx. Kernel (Farhan et al., 2017) | ✓ | ✓ | 500 / 500 | ✗ | ✗ | Dimensionality depends on Num of sequences |
| PWM2Vec (Ali et al., 2022a) | ✗ | ✓ | 3490 / 125 | ✓ | ✓ | Length of Spike Seq after alignment and |
| LSTM (Hochreiter and Schmidhuber, 1997) | ✓ | _ | _ | ✗ | ✗ | End-to-End deep learning architectures that take one-hot encoding representation as input and perform classification |
| GRU (Cho et al., 2014) | ✓ | _ | _ | ✗ | ✗ | |
| CNN (Lee et al., 2017) | ✓ | _ | _ | ✗ | ✗ | |
| ProteinBert (Brandes et al., 2022) | ✓ | _ | _ | ✗ | ✗ | Pretrained Protein language model using Transformer |
| MFV | ✓ | ✓ | 8000 / 125 | ✓ | ✓ | and |
| Virus2Vec (ours) | ✓ | ✓ | 8000 / 125 | ✓ | ✓ | Proposed method |
4.5 Ablation Study
MFV
Minimizer-based feature vector is a method in which for a given -mer, a minimizer of length () is computed, called as -mer which is a lexicographically smallest in forward and reverse order of the -mer (See Figure 3 for an example). Fixed-length frequency vector from the set of minimizers, which contains each minimizer’s count in the frequency vector’s corresponding bin. The pseudocode for generating the frequency vectors is given in Algorithm 2. Given and length of minimizers (where ), the length of each vector is .
Input: Set of kmers(-mer) or Minimizers (m-mers) on alphabet , the size of mers (k for kmer or m for minimizer) n represents or
Output: Frequency Vector
PSWM2Vec
A method based on Position Specific Weight Matrix (PSWM) is similar to PWM2Vec with two differences. First, use minimizers instead of the -mers to initiate the PWM (as given in Figure 4). Secondly, after generating PWM, we flatten the matrix to get a feature vector whose length will equal the number of entries in PWM. The pseudocode for PSWM2Vec is given in Algorithm 3. The results for MFV, PSWM2Vec, and Virus2Vec for aligned data are given in Table 6 and for unaligned in Table 4. Virus2Vec outperforms the other two embeddings for all but one evaluation metric.
Input Set of Spike Sequences , alphabet , -mer length , m-mer length
Output Weighted Frequency Matrix
5 Results and Discussion
In this section, we present results for proposed embeddings and compare their performance with the baseline and SOTA methods (with and without sequence alignment).
Our results show that not only Virus2Vec outperforms the SOTA methods but also preserves structure when compared with subjective evaluation using t-SNE plots. The runtime to generate the embeddings makes it a huge factor in considering Virus2Vec over other embeddings.
Table 4, which shows the results for different embedding methods (on unaligned data) with different classification algorithms. We can observe that the Virus2Vec outperforms the SOTA methods in terms of different evaluation metrics. Note that since OHE and PWM2Vec work with aligned data only, we have not included those for unaligned data results. The performance of Virus2Vec is not very different for aligned and unaligned data. Other methods, such as Approx. the kernel has better ROC-AUC values for aligned data as compared to unaligned ones. Spike2Vec, on the other hand, was able to generalize better on unaligned data. We can observe that Virus2Vec outperforms not only the feature engineering-based baselines but also the neural network-based classifiers. The NN models are known for their application in image data. Also, since the data is of a smaller size it is likely that the NN models failed to learn the patterns in the sequences. The findings are reckoned by its visualization counterpart as well, as we saw in t-SNE plots also for Virus2Vec, it does not disrupt the general structure of the data because t-SNE is able to retain the structure of the data in the same way that the other embedding methods do.
| Host Spike Sequences | Rabies Virus | ||||||||||||||
| Method | Classifier | Acc. | Prec. | Recall | F1 (Weig.) | F1 (Macro) | ROC AUC | Train Time (sec.) | Acc. | Prec. | Recall | F1 (Weig.) | F1 (Macro) | ROC AUC | Train Time (sec.) |
| Spike2Vec | SVM | 0.84 | 0.84 | 0.84 | 0.83 | 0.77 | 0.87 | 45.36 | 0.72 | 0.70 | 0.72 | 0.69 | 0.58 | 0.76 | 22.76 |
| NB | 0.69 | 0.77 | 0.69 | 0.67 | 0.58 | 0.79 | 6.02 | 0.06 | 0.29 | 0.06 | 0.03 | 0.03 | 0.52 | 0.40 | |
| MLP | 0.81 | 0.83 | 0.81 | 0.81 | 0.63 | 0.83 | 46.14 | 0.58 | 0.45 | 0.58 | 0.48 | 0.23 | 0.60 | 1.46 | |
| KNN | 0.80 | 0.81 | 0.80 | 0.79 | 0.59 | 0.79 | 1.97 | 0.75 | 0.73 | 0.75 | 0.74 | 0.62 | 0.79 | 1.07 | |
| RF | 0.84 | 0.85 | 0.84 | 0.84 | 0.73 | 0.85 | 10.21 | 0.78 | 0.76 | 0.78 | 0.76 | 0.67 | 0.81 | 0.88 | |
| LR | 0.84 | 0.85 | 0.84 | 0.84 | 0.76 | 0.87 | 31.00 | 0.71 | 0.67 | 0.71 | 0.67 | 0.55 | 0.75 | 1.14 | |
| DT | 0.82 | 0.83 | 0.82 | 0.82 | 0.71 | 0.85 | 2.54 | 0.68 | 0.68 | 0.68 | 0.68 | 0.57 | 0.77 | 0.21 | |
| Approx. Kernel | SVM | 0.79 | 0.80 | 0.79 | 0.77 | 0.57 | 0.78 | 18.18 | 0.73 | 0.72 | 0.73 | 0.71 | 0.59 | 0.76 | 244.82 |
| NB | 0.60 | 0.66 | 0.60 | 0.57 | 0.51 | 0.73 | 0.07 | 0.14 | 0.51 | 0.14 | 0.13 | 0.20 | 0.60 | 0.33 | |
| MLP | 0.79 | 0.78 | 0.79 | 0.78 | 0.59 | 0.75 | 7.69 | 0.77 | 0.77 | 0.77 | 0.76 | 0.63 | 0.79 | 119.56 | |
| KNN | 0.86 | 0.85 | 0.86 | 0.86 | 0.60 | 0.76 | 0.21 | 0.83 | 0.82 | 0.83 | 0.82 | 0.69 | 0.83 | 5.57 | |
| RF | 0.82 | 0.82 | 0.82 | 0.81 | 0.67 | 0.78 | 1.80 | 0.83 | 0.83 | 0.83 | 0.82 | 0.71 | 0.83 | 22.17 | |
| LR | 0.76 | 0.77 | 0.76 | 0.74 | 0.64 | 0.76 | 2.36 | 0.66 | 0.64 | 0.66 | 0.64 | 0.55 | 0.73 | 80.32 | |
| DT | 0.78 | 0.78 | 0.78 | 0.77 | 0.55 | 0.75 | 0.24 | 0.76 | 0.76 | 0.76 | 0.76 | 0.65 | 0.80 | 4.44 | |
| Neural Network | LSTM | 0.32 | 0.10 | 0.32 | 0.15 | 0.02 | 0.50 | 21634.34 | 0.49 | 0.38 | 0.49 | 0.36 | 0.15 | 0.49 | 35026.49 |
| CNN | 0.44 | 0.10 | 0.11 | 0.08 | 0.07 | 0.53 | 17856.40 | 0.73 | 0.74 | 0.73 | 0.72 | 0.64 | 0.80 | 8164.93 | |
| GRU | 0.32 | 0.13 | 0.32 | 0.16 | 0.03 | 0.50 | 126585.0 | 0.59 | 0.54 | 0.59 | 0.51 | 0.28 | 0.60 | 16180.78 | |
| Spaced k-mer | SVM | 0.81 | 0.82 | 0.81 | 0.81 | 0.89 | 0.92 | 3.12 | 0.80 | 0.80 | 0.80 | 0.79 | 0.67 | 0.81 | 140.67 |
| NB | 0.66 | 0.69 | 0.66 | 0.66 | 0.61 | 0.78 | 0.03 | 0.28 | 0.56 | 0.28 | 0.27 | 0.35 | 0.69 | 0.11 | |
| MLP | 0.82 | 0.82 | 0.82 | 0.82 | 0.77 | 0.87 | 41.66 | 0.79 | 0.78 | 0.79 | 0.79 | 0.66 | 0.81 | 84.70 | |
| KNN | 0.79 | 0.80 | 0.79 | 0.80 | 0.77 | 0.87 | 0.40 | 0.83 | 0.82 | 0.83 | 0.82 | 0.71 | 0.84 | 2.54 | |
| RF | 0.84 | 0.85 | 0.84 | 0.84 | 0.91 | 0.94 | 2.84 | 0.84 | 0.84 | 0.84 | 0.83 | 0.72 | 0.84 | 24.28 | |
| LR | 0.82 | 0.83 | 0.82 | 0.82 | 0.89 | 0.93 | 2.31 | 0.79 | 0.78 | 0.79 | 0.78 | 0.66 | 0.81 | 14.08 | |
| DT | 0.80 | 0.80 | 0.80 | 0.80 | 0.85 | 0.93 | 0.64 | 0.76 | 0.76 | 0.76 | 0.76 | 0.65 | 0.81 | 6.36 | |
| Protein Bert | _ | 0.79 | 0.80 | 0.79 | 0.78 | 0.71 | 0.84 | 15742.95 | 0.79 | 0.78 | 0.79 | 0.76 | 0.64 | 0.80 | 35742.84 |
| MFV | SVM | 0.83 | 0.83 | 0.83 | 0.82 | 0.73 | 0.85 | 35.71 | 0.66 | 0.61 | 0.66 | 0.61 | 0.48 | 0.71 | 241.11 |
| NB | 0.63 | 0.75 | 0.63 | 0.63 | 0.49 | 0.72 | 5.80 | 0.06 | 0.34 | 0.06 | 0.05 | 0.08 | 0.54 | 0.41 | |
| MLP | 0.82 | 0.82 | 0.82 | 0.82 | 0.66 | 0.81 | 53.82 | 0.61 | 0.54 | 0.61 | 0.56 | 0.33 | 0.65 | 2.17 | |
| KNN | 0.79 | 0.80 | 0.79 | 0.78 | 0.63 | 0.81 | 1.60 | 0.74 | 0.72 | 0.74 | 0.72 | 0.61 | 0.79 | 1.12 | |
| RF | 0.84 | 0.85 | 0.84 | 0.84 | 0.74 | 0.85 | 10.79 | 0.78 | 0.77 | 0.78 | 0.76 | 0.66 | 0.80 | 0.81 | |
| LR | 0.83 | 0.84 | 0.83 | 0.83 | 0.74 | 0.85 | 9.24 | 0.59 | 0.55 | 0.59 | 0.54 | 0.36 | 0.64 | 0.70 | |
| DT | 0.83 | 0.83 | 0.83 | 0.82 | 0.74 | 0.85 | 1.15 | 0.69 | 0.68 | 0.69 | 0.69 | 0.58 | 0.77 | 0.19 | |
| PSWM2Vec | SVM | 0.81 | 0.82 | 0.81 | 0.80 | 0.80 | 0.90 | 3.46 | 0.48 | 0.28 | 0.48 | 0.33 | 0.08 | 0.48 | 1.10 |
| NB | 0.58 | 0.66 | 0.58 | 0.57 | 0.53 | 0.78 | 0.25 | 0.27 | 0.32 | 0.27 | 0.26 | 0.16 | 0.27 | 0.18 | |
| MLP | 0.82 | 0.82 | 0.82 | 0.81 | 0.72 | 0.87 | 8.44 | 0.57 | 0.50 | 0.57 | 0.50 | 0.33 | 0.57 | 2.33 | |
| KNN | 0.81 | 0.80 | 0.81 | 0.80 | 0.70 | 0.86 | 1.22 | 0.64 | 0.62 | 0.64 | 0.62 | 0.50 | 0.64 | 0.49 | |
| RF | 0.85 | 0.85 | 0.85 | 0.84 | 0.83 | 0.91 | 1.26 | 0.66 | 0.65 | 0.66 | 0.65 | 0.53 | 0.66 | 0.79 | |
| LR | 0.79 | 0.80 | 0.79 | 0.77 | 0.70 | 0.84 | 1.45 | 0.48 | 0.31 | 0.48 | 0.34 | 0.10 | 0.48 | 1.41 | |
| DT | 0.80 | 0.81 | 0.80 | 0.80 | 0.73 | 0.88 | 0.23 | 0.58 | 0.59 | 0.58 | 0.58 | 0.47 | 0.58 | 0.17 | |
| Virus2Vec | SVM | 0.85 | 0.86 | 0.85 | 0.85 | 0.87 | 0.932 | 151.5 | 0.66 | 0.62 | 0.66 | 0.62 | 0.50 | 0.72 | 15931.90 |
| NB | 0.67 | 0.78 | 0.67 | 0.65 | 0.65 | 0.83 | 5.67 | 0.07 | 0.34 | 0.07 | 0.05 | 0.10 | 0.55 | 0.17 | |
| MLP | 0.85 | 0.85 | 0.85 | 0.84 | 0.79 | 0.90 | 47.30 | 0.71 | 0.69 | 0.71 | 0.68 | 0.56 | 0.75 | 11.76 | |
| KNN | 0.84 | 0.85 | 0.84 | 0.83 | 0.76 | 0.88 | 78.79 | 0.71 | 0.73 | 0.74 | 0.71 | 0.59 | 0.78 | 8.54 | |
| RF | 0.86 | 0.86 | 0.86 | 0.85 | 0.84 | 0.91 | 13.36 | 0.84 | 0.83 | 0.84 | 0.83 | 0.74 | 0.85 | 3.13 | |
| LR | 0.87 | 0.87 | 0.87 | 0.87 | 0.88 | 0.93 | 8.29 | 0.59 | 0.54 | 0.59 | 0.53 | 0.34 | 0.63 | 13.94 | |
| DT | 0.81 | 0.82 | 0.81 | 0.81 | 0.76 | 0.88 | 2.49 | 0.77 | 0.77 | 0.77 | 0.77 | 0.68 | 0.82 | 0.55 | |
We show the runtime comparison for computing different feature embeddings in Table 5. It can be seen in the results that Virus2Vec takes the least time to generate for sequences as compared to other methods. It takes times less as compared to the Approximate Kernel method and 15 times less than PWM2Vec, which are comparable when accuracy is considered. Similarly for the Rabies virus-host dataset also embedding generation is very less in the case of Virus2Vec. Although One hot encoding is taking less time the pre-processing for sequence alignment is not considered here which will make it expensive.
| Method | Coronavirus data Runtime | Rabies virus data Runtime |
|---|---|---|
| OHE | 196.31 Sec. | 44.17 Sec. |
| Spike2Vec | 1179.66 Sec. | 259.86 Sec. |
| PWM2Vec | 1506.63 Sec. | 412.254 Sec. |
| Approx. Kernel | 379.47 Sec. | 179.47 Sec. |
| Virus2Vec | 90.65 Sec. | 105.78 Sec. |
Table 6 shows the results for different embedding (on aligned data) with different classifiers. Here also, Virus2Vec outperforms the feature engineering-based baselines and the neural network classifiers. We can see a significant improvement in accuracy when compared with the Approximate kernel and PWN2Vec. It is definitely an advantage but the reduced runtime for embedding generation, when compared with the closest comparable embeddings, is huge and makes it a better choice.
| DL Model | Method | Acc. | Prec. | Recall | F1 (Weig.) | F1 (Macro) | ROC AUC | Train Time (sec.) |
|---|---|---|---|---|---|---|---|---|
| OHE (Kuzmin et al., 2020) | SVM | 0.83 | 0.84 | 0.83 | 0.83 | 0.70 | 0.84 | 389.128 |
| NB | 0.67 | 0.80 | 0.67 | 0.65 | 0.64 | 0.82 | 56.741 | |
| MLP | 0.77 | 0.76 | 0.77 | 0.75 | 0.44 | 0.71 | 390.289 | |
| KNN | 0.80 | 0.79 | 0.80 | 0.79 | 0.55 | 0.78 | 16.211 | |
| RF | 0.84 | 0.84 | 0.84 | 0.83 | 0.66 | 0.84 | 151.911 | |
| LR | 0.84 | 0.85 | 0.84 | 0.83 | 0.71 | 0.85 | 48.786 | |
| DT | 0.83 | 0.84 | 0.83 | 0.82 | 0.64 | 0.82 | 21.581 | |
| Spike2Vec (Ali and Patterson, 2021) | SVM | 0.81 | 0.82 | 0.81 | 0.81 | 0.63 | 0.83 | 52.384 |
| NB | 0.65 | 0.77 | 0.65 | 0.64 | 0.46 | 0.74 | 9.031 | |
| MLP | 0.81 | 0.82 | 0.81 | 0.81 | 0.52 | 0.77 | 44.982 | |
| KNN | 0.80 | 0.80 | 0.80 | 0.79 | 0.54 | 0.75 | 2.417 | |
| RF | 0.83 | 0.84 | 0.83 | 0.82 | 0.63 | 0.82 | 17.252 | |
| LR | 0.82 | 0.84 | 0.82 | 0.82 | 0.68 | 0.83 | 48.826 | |
| DT | 0.81 | 0.82 | 0.81 | 0.81 | 0.62 | 0.81 | 4.096 | |
| PWM2Vec (Ali et al., 2022a) | SVM | 0.83 | 0.82 | 0.83 | 0.82 | 0.68 | 0.83 | 40.55 |
| NB | 0.37 | 0.68 | 0.37 | 0.33 | 0.43 | 0.69 | 1.56 | |
| MLP | 0.82 | 0.82 | 0.82 | 0.81 | 0.61 | 0.80 | 17.28 | |
| KNN | 0.82 | 0.80 | 0.82 | 0.81 | 0.57 | 0.78 | 2.86 | |
| RF | 0.84 | 0.84 | 0.84 | 0.84 | 0.69 | 0.83 | 5.44 | |
| LR | 0.84 | 0.84 | 0.84 | 0.83 | 0.69 | 0.83 | 43.35 | |
| DT | 0.82 | 0.81 | 0.82 | 0.81 | 0.62 | 0.82 | 3.46 | |
| Approx. Kernel (Farhan et al., 2017) | SVM | 0.78 | 0.79 | 0.78 | 0.77 | 0.53 | 0.78 | 16.67 |
| NB | 0.62 | 0.66 | 0.62 | 0.61 | 0.39 | 0.72 | 0.19 | |
| MLP | 0.79 | 0.77 | 0.79 | 0.77 | 0.52 | 0.80 | 8.34 | |
| KNN | 0.85 | 0.84 | 0.85 | 0.85 | 0.52 | 0.80 | 0.24 | |
| RF | 0.82 | 0.81 | 0.82 | 0.81 | 0.54 | 0.83 | 1.95 | |
| LR | 0.76 | 0.77 | 0.76 | 0.74 | 0.51 | 0.83 | 3.80 | |
| DT | 0.77 | 0.77 | 0.77 | 0.77 | 0.47 | 0.82 | 0.27 | |
| Neural Network | LSTM | 0.33 | 0.10 | 0.33 | 0.16 | 0.02 | 0.5 | 16724.06 |
| CNN | 0.26 | 0.11 | 0.26 | 0.13 | 0.08 | 0.55 | 41470.84 | |
| GRU | 0.31 | 0.10 | 0.31 | 0.15 | 0.03 | 0.5 | 444199.8 | |
| MFV | SVM | 0.79 | 0.80 | 0.79 | 0.78 | 0.71 | 0.86 | 46.219 |
| NB | 0.48 | 0.69 | 0.48 | 0.46 | 0.59 | 0.74 | 7.206 | |
| MLP | 0.76 | 0.79 | 0.76 | 0.76 | 0.57 | 0.78 | 101.491 | |
| KNN | 0.71 | 0.82 | 0.71 | 0.75 | 0.63 | 0.82 | 2.157 | |
| RF | 0.80 | 0.81 | 0.80 | 0.79 | 0.76 | 0.87 | 17.928 | |
| LR | 0.80 | 0.81 | 0.80 | 0.79 | 0.77 | 0.87 | 8.631 | |
| DT | 0.79 | 0.80 | 0.79 | 0.78 | 0.65 | 0.86 | 1.250 | |
| PSWM2Vec | SVM | 0.75 | 0.79 | 0.75 | 0.74 | 0.77 | 0.89 | 3.51 |
| NB | 0.59 | 0.66 | 0.59 | 0.57 | 0.53 | 0.80 | 0.22 | |
| MLP | 0.78 | 0.79 | 0.78 | 0.76 | 0.76 | 0.87 | 8.61 | |
| KNN | 0.77 | 0.78 | 0.77 | 0.77 | 0.68 | 0.84 | 1.39 | |
| RF | 0.80 | 0.82 | 0.80 | 0.80 | 0.79 | 0.88 | 1.11 | |
| LR | 0.75 | 0.76 | 0.75 | 0.73 | 0.70 | 0.85 | 1.54 | |
| DT | 0.77 | 0.78 | 0.77 | 0.76 | 0.70 | 0.88 | 0.17 | |
| Virus2Vec | SVM | 0.85 | 0.86 | 0.85 | 0.85 | 0.873 | 0.93 | 105.45 |
| NB | 0.67 | 0.78 | 0.67 | 0.65 | 0.65 | 0.83 | 3.98 | |
| MLP | 0.85 | 0.85 | 0.85 | 0.84 | 0.79 | 0.90 | 32.68 | |
| KNN | 0.84 | 0.85 | 0.84 | 0.83 | 0.76 | 0.88 | 54.72 | |
| RF | 0.86 | 0.86 | 0.86 | 0.85 | 0.84 | 0.91 | 7.53 | |
| LR | 0.87 | 0.87 | 0.87 | 0.86 | 0.877 | 0.94 | 5.57 | |
| DT | 0.81 | 0.82 | 0.81 | 0.81 | 0.76 | 0.88 | 1.11 |
6 Conclusion
We propose an efficient sequence embedding approach named Virus2Vec, which uses an alignment-free method based on minimizers and PWM to classify hosts of different coronaviruses using spike sequences. Virus2Vec not only performs better as compared to other methods requiring sequence alignment but also is better since it is an alignment-free approach. We show that our approach for unaligned sequences is efficient to generate compared to the popular alignment-free methods and has comparable predictive performance and better runtimes. In the future, we would focus on collecting more data to evaluate the scalability of Virus2Vec. Such an approach could also work even on unassembled (short read) data (not just unaligned), in a similar way that it works for metagenomics.
References
- Ali and Patterson (2021) Sarwan Ali and Murray Patterson. Spike2vec: An efficient and scalable embedding approach for covid-19 spike sequences. In IEEE International Conference on Big Data, pages 1533–1540, 2021.
- Ali et al. (2022a) Sarwan Ali, Babatunde Bello, Prakash Chourasia, Ria Thazhe Punathil, Yijing Zhou, and Murray Patterson. Pwm2vec: An efficient embedding approach for viral host specification from coronavirus spike sequences. MDPI Biology, 2022a.
- Ali et al. (2022b) Sarwan Ali, Bikram Sahoo, Muhammad Asad Khan, Alexander Zelikovsky, Imdad Ullah Khan, and Murray Patterson. Efficient approximate kernel based spike sequence classification. IEEE/ACM Transactions on Computational Biology and Bioinformatics, 2022b.
- Ali et al. (2023a) Sarwan Ali, Prakash Chourasia, and Murray Patterson. Anderson acceleration for bioinformatics-based machine learning. arXiv preprint arXiv:2302.00347, 2023a.
- Ali et al. (2023b) Sarwan Ali, Prakash Chourasia, Zahra Tayebi, Babatunde Bello, and Murray Patterson. Viralvectors: Compact and scalable alignment-free virome feature generation. arXiv preprint arXiv:2304.02891, 2023b.
- Ali et al. (2023c) Sarwan Ali, Taslim Murad, and Murray Patterson. Pssm2vec: A compact alignment-free embedding approach for coronavirus spike sequence classification. In Neural Information Processing: 29th International Conference, ICONIP 2022, Virtual Event, November 22–26, 2022, Proceedings, Part VII, pages 420–432. Springer, 2023c.
- Ali et al. (2023d) Sarwan Ali, Bikram Sahoo, Alexander Zelikovsky, Pin-Yu Chen, and Murray Patterson. Benchmarking machine learning robustness in covid-19 genome sequence classification. Scientific Reports, 13(1):4154, 2023d.
- Ambrosini et al. (2018) Giovanna Ambrosini, Romain Groux, and Philipp Bucher. Pwmscan: a fast tool for scanning entire genomes with a position-specific weight matrix. Bioinformatics, 34(14):2483–2484, 2018.
- Bhagwat and Aravind (2007) Medha Bhagwat and L Aravind. Psi-blast tutorial. In Comparative genomics, pages 177–186. Springer, 2007.
- Brandes et al. (2022) Nadav Brandes, Dan Ofer, Yam Peleg, Nadav Rappoport, and Michal Linial. Proteinbert: A universal deep-learning model of protein sequence and func. Bioinformatics, 38(8), 2022.
- Chatzou et al. (2016) Maria Chatzou, Cedrik Magis, et al. Multiple sequence alignment modeling: methods and applications. Briefings in bioinformatics, 17(6):1009–1023, 2016.
- cheol Jeong et al. (2010) Jong cheol Jeong, Xiaotong Lin, and Xue-Wen Chen. On position-specific scoring matrix for protein function prediction. IEEE/ACM transactions on computational biology and bioinformatics, 8(2):308–315, 2010.
- Cho et al. (2014) Kyunghyun Cho, Bart van Merriënboer, Dzmitry Bahdanau, and Yoshua Bengio. On the properties of neural machine translation: Encoder–decoder approaches. In Workshop on Syntax, Semantics and Structure in Statistical Translation, pages 103–111, 2014.
- Chourasia et al. (2022a) Prakash Chourasia, Sarwan Ali, and Murray Patterson. Informative initialization and kernel selection improves t-sne for biological sequences. arXiv preprint arXiv:2211.09263, 2022a.
- Chourasia et al. (2022b) Prakash Chourasia, Sarwan Ali, et al. Clustering sars-cov-2 variants from raw high-throughput sequencing reads data. In Computational Advances in Bio and Medical Sciences: 11th International Conference, ICCABS 2021, pages 133–148. Springer, 2022b.
- Chourasia et al. (2023a) Prakash Chourasia, Sarwan Ali, et al. Reads2vec: Efficient embedding of raw high-throughput sequencing reads data. Journal of Computational Biology, 2023a.
- Chourasia et al. (2023b) Prakash Chourasia, Taslim Murad, Zahra Tayebi, Sarwan Ali, Imdad Ullah Khan, and Murray Patterson. Efficient classification of sars-cov-2 spike sequences using federated learning. arXiv preprint arXiv:2302.08688, 2023b.
- Cleaveland and Hampson (2017) Sarah Cleaveland and Katie Hampson. Rabies elimination research: juxtaposing optimism, pragmatism and realism. Royal Society B: Biological Sciences, 284(1869):20171880, 2017.
- Cordeiro et al. (2016) R de A Cordeiro, NFH Duarte, et al. The importance of wild canids in the epidemiology of rabies in northeast brazil: a retrospective study. Zoonoses and public health, 63(6):486–493, 2016.
- Devijver and Kittler (1982) P. Devijver and J. Kittler. Pattern recognition: A statistical approach. In London, GB: Prentice-Hall, pages 1–448, 1982.
- Diederik P. Kingma (2015) Jimmy Ba Diederik P. Kingma. Adam: A method for stochastic optimization. arXiv, 2015. 10.48550/arXiv.1412.6980.
- Farhan et al. (2017) M. Farhan, J. Tariq, A. Zaman, M. Shabbir, and I. Khan. Efficient approximation algorithms for strings kernel based sequence classification. In Advances in neural information processing systems (NeurIPS), pages 6935–6945, 2017.
- Gigante et al. (2020) Crystal M Gigante, Gowri Yale, Rene Edgar Condori, Niceta Cunha Costa, et al. Portable rabies virus sequencing in canine rabies endemic countries using the oxford nanopore minion. Viruses, 12(11):1255, 2020.
- Girotto et al. (2016) Samuele Girotto, Cinzia Pizzi, and Matteo Comin. Metaprob: accurate metagenomic reads binning based on probabilistic sequence signatures. Bioinformatics, 32(17):i567–i575, 2016.
- GISAID Website (2021) GISAID Website. https://www.gisaid.org/, 2021. [Online; accessed 29-December-2021].
- Golubchik et al. (2007) Tanya Golubchik, Michael J Wise, et al. Mind the gaps: evidence of bias in estimates of multiple sequence alignments. Molecular biology and evolution, 24(11):2433–2442, 2007.
- Graham and Baric (2010) Rachel Graham and Ralph Baric. Recombination, reservoirs, and the modular spike: mechanisms of coronavirus cross-species transmission. Journal of virology, 84(7):3134–3146, 2010.
- Hadfield et al. (2018) J. Hadfield, C. Megill, et al. Nextstrain: real-time tracking of pathogen evolution. Bioinformatics, 34:4121–4123, 2018.
- Hochreiter and Schmidhuber (1997) Sepp Hochreiter and Jürgen Schmidhuber. Long short-term memory. Neural computation, 9(8):1735–1780, 1997.
- Hoffmann (2007) H. Hoffmann. Kernel pca for novelty detection. Pattern recognition, 40(3):863–874, 2007.
- Kawulok and Deorowicz (2015) J. Kawulok and S. Deorowicz. Cometa: Classification of metagenomes using k-mers. Plos One, 2015.
- Kuzmin et al. (2020) Kiril Kuzmin, Ayotomiwa Ezekiel Adeniyi, Arthur Kevin DaSouza Jr, Deuk Lim, Huyen Nguyen, Nuria Ramirez Molina, Lanqiao Xiong, Irene T Weber, and Robert W Harrison. Machine learning methods accurately predict host specificity of coronaviruses based on spike sequences alone. Biochemical and Biophysical Research Communications, 533(3):553–558, 2020.
- Lee et al. (2017) Song-Mi Lee, Sang Min Yoon, and Heeryon Cho. Human activity recognition from accelerometer data using convolutional neural network. In International conference on big data and smart computing (bigcomp), pages 131–134, 2017.
- Li (2016) Fang Li. Structure, function, and evolution of coronavirus spike proteins. Annual review of virology, 3:237–261, 2016.
- Li et al. (2006) Wenhui Li, Swee Wong, et al. Animal origins of the severe acute respiratory syndrome coronavirus: insight from ace2-s-protein interactions. Journal of virology, 80(9):4211–4219, 2006.
- Nishida et al. (2009) Keishin Nishida, Martin C Frith, and Kenta Nakai. Pseudocounts for transcription factor binding sites. Nucleic acids research, 37(3):939–944, 2009.
- Pickett et al. (2012) Brett Pickett et al. Vipr: an open bioinformatics database and analysis resource for virology research. Nucleic acids research, 40(D1):D593–D598, 2012.
- RABV GLUE Website (2021) RABV GLUE Website. http://rabv-glue.cvr.gla.ac.uk/#/home, 2021. [Online; accessed 10-October-2022].
- Reusken et al. (2014) C. Reusken, B.L. Haagmans BL, and M.P. Koopmans MP. Dromedary camels and Middle East respiratory syndrome: MERS coronavirus in the ship of the desert. Ned. Tijdschr. Geneeskd., 158, 2014.
- Shi and Hu (2008) Zhengli Shi and Zhihong Hu. A review of studies on animal reservoirs of the sars coronavirus. Virus research, 133(1):74–87, 2008.
- Singh et al. (2017) Ritambhara Singh, Arshdeep Sekhon, et al. Gakco: a fast gapped k-mer string kernel using counting. In Joint ECML and Knowledge Discovery in Databases, pages 356–373, 2017.
- Sofaer et al. (2019) Helen R Sofaer, Jennifer A Hoeting, and Catherine S Jarnevich. The area under the precision-recall curve as a performance metric for rare binary events. Methods in Ecology and Evolution, 10(4):565–577, 2019.
- Taslim et al. (2023) Murad Taslim, Chourasia Prakash, Ali Sarwan, and Patterson Murray. Hashing2vec: Fast embedding generation for sars-cov-2 spike sequence classification. In Asian Conference on Machine Learning, pages 754–769. PMLR, 2023.
- Taylor and Nel (2015) Louise H Taylor and Louis H Nel. Global epidemiology of canine rabies: past, present, and future prospects. Veterinary Medicine: Research and Reports, 6:361, 2015.
- Van and Hinton (2008) L. Van and G. Hinton. Visualizing data using t-sne. Journal of Machine Learning Research (JMLR), 9(11), 2008.
- Vercauteren et al. (2012) Kurt C Vercauteren, Christine Ellis, Richard Chipman, Thomas J DeLiberto, Stephanie A Shwiff, and Dennis Slate. Rabies in north america: A model of the one health approach. 2012.
- Vijgen et al. (2006) Leen Vijgen, Els Keyaerts, et al. Evolutionary history of the closely related group 2 coronaviruses: porcine hemagglutinating encephalomyelitis virus, bovine coronavirus, and human coronavirus oc43. Journal of virology, 80(14):7270–7274, 2006.
- WHO — Rabies (2021) WHO — Rabies. https://www.who.int/news-room/fact-sheets/detail/rabies, 2021. [Online; accessed 20-November-2022].
- Wood and Salzberg (2014a) D. Wood and S. Salzberg. Kraken: ultrafast metagenomic sequence classification using exact alignments. Genome Biol, 15, 2014a.
- Wood and Salzberg (2014b) Derrick Wood and Steven Salzberg. Kraken: ultrafast metagenomic sequence classification using exact alignments. Genome biology, 15(3):1–12, 2014b.
- Worsley-Tonks et al. (2020) Katherine EL Worsley-Tonks, Luis E Escobar, et al. Using host traits to predict reservoir host species of rabies virus. PLoS neglected tropical diseases, 14(12):e0008940, 2020.
- Zheng et al. (2020) Hongyu Zheng, Carl Kingsford, and Guillaume Marccais. Lower density selection schemes via small universal hitting sets with short remaining path len. In ICRCMB, pages 202–217. Springer, 2020.
- Zhou et al. (2020) Peng Zhou, Xing-Lou Yang, et al. A pneumonia outbreak associated with a new coronavirus of probable bat origin. Nature, 579:270–273, 2020.