Gaussian Boson Sampling with Pseudo-Photon-Number Resolving Detectors and
Quantum Computational Advantage
Abstract
We report new Gaussian boson sampling experiments with pseudo-photon-number-resolving detection, which register up to 255 photon-click events. We consider partial photon distinguishability and develop a more complete model for the characterization of the noisy Gaussian boson sampling. In the quantum computational advantage regime, we use Bayesian tests and correlation function analysis to validate the samples against all current classical spoofing mockups. Estimating with the best classical algorithms to date, generating a single ideal sample from the same distribution on the supercomputer Frontier would take years using exact methods, whereas our quantum computer, Jiǔzhāng 3.0, takes only to produce a sample. Generating the hardest sample from the experiment using an exact algorithm would take Frontier years.
Quantum computational advantage (QCA) [1, 2, 3, 4, 5] marks an important milestone in the development of quantum computers. By solving certain quantum sampling problems [6, 7] that are intractable for classical supercomputers, QCA experiments [8, 9, 10, 11, 12] have provided strong evidence for the long-anticipated quantum speed-up theoretically conceived years ago, Similar to Bell tests [13] which were designed to refute the local hidden variable theories [14], these QCA experiments offered evidence of the violations of the Extended Church-Turing thesis [3].
Interestingly, these QCA experiments have motivated growing study of faster classical simulations. For boson sampling, these efforts can be divided into three approaches. The first approach is reducing the classical simulation overhead of exactly simulating an ideal implementation of the Gaussian boson sampling protocol [15, 16, 17]. In this case, one expects that the exponential gap between the classical and the quantum persists, but it is possible to bring down the overhead. The leading result is Ref. [17] which uses photon collisions to achieve better exact classical simulation that could reduce the computational overhead by orders of magnitudes lower than brute-force algorithms. The second approach is using imperfections in the experimental setup [18, 19, 20], such as photon loss and partial photon distinguishability, to come to a faster simulation of the experimental data produced by an imperfect experiment. In this case, one can hope for more efficient classical simulation if the level of imperfections or experimental noise become strong enough. The final approach is spoofed distributions [17, 21, 22, 23], i.e., distributions which are not constructed to be close in variational distance to the ideal boson sampling distribution, but which are designed to reproduce some statistical aspect of the experiment. In particular, the recently proposed more competitive squashed state mockup [12] exhibits better agreement with the ground truth than the thermal state mockup. Moreover, the treewidth sampler [22], designed to spoof experiments with restricted circuit-connectivity, and the Independent Pairs and Singles (IPS) sampler [17], designed to emulate experiments of limited quantum interference, have not been reported to be ruled out in previous GBS QCA experiments.
In return, these new challenges from the classical counterparts motivate the development of higher-fidelity and larger-scale quantum computers, new methods for validation and characterization [24, 25, 26, 27], as well as better modeling and understanding of the increasingly complex system [28, 29, 30, 31, 32, 33, 34, 35, 36], which is a fundamental endeavor in its own right [37, 38, 39]. Indeed, only by such a continuous quantum-classical competition can the QCA milestone be progressively better established.

In this direction, we report in this Letter a new, higher-efficiency Gaussian boson sampling (GBS) [40, 41] machine with up to 255 photon clicks in the output using pseudo-photon-number-resolving detectors (PPNRD), which overcomes both the most powerful exact classical simulation algorithms and all known approximate algorithms and spoofing algorithms. The PPNRD scheme overcomes the shortcoming of threshold detection that it is incapable of resolving photon-number information, and significantly increases the exact sampling task’s computational complexity by more than six orders of magnitude. We validate the samples against all the emerging classical mockups, particularly including the squashed state [12], the treewidth sampler [22] and the IPS sampler [17] mentioned above. A new model that includes the partial photon indistinguishability is used to characterize the system, and exhibits better agreement with the experiment than previous modelling methods. The computational complexity of this new GBS device, Jiǔzhāng 3.0, is analyzed and a new QCA frontier is established.
The first GBS experiments [9, 10] in the QCA regime used threshold detectors to register the samples. In those cases, there was a possibility of photon collision, that is, the photons can bunch at the outputs. New classical algorithms [17] could exploit photon collision to reduce the simulation overhead. A recent work [12] has reported time-bin-encoded GBS with photon-number resolved detection, in a fiber loop-based configuration similar to an earlier single-photon boson sampling experiment [42]. However, the relatively high photon loss in the fiber loops has allowed only three loops in the implementation, restricting the depth and universality of the interferometer. Additionally, the long recovery time of the transition-edge sensors could render it an unsuitable choice for high-repetition-rate experiments.
A schematic of our GBS experiment is shown in Fig. 1. Transform-limited laser pulses double pass periodically poled potassium titanyl phosphate (PPKTP) crystals to create 25 pairs of two-mode squeezed state (TMSS) by a stimulated emission process [10]. The TMSSs have an average coupling efficiency of 88.4% and photon indistinguishability of 96.2%, simultaneously. In the experiment, the laser power is tuned to generate different squeezing parameters ranging from 1.2 to 1.6. The TMSSs are then fed into an ultralow-loss three-dimensional interferometer with full connectivity among all 144 modes. The transmission rate of the interferometer is 97% for each mode, and the average wave-packet overlap inside the interferometer is above 99.5%. The whole set-up is actively phase locked within a precision of 15 nm.
For detection, we implement pseudo-photon number resolution using one-to-eight demultiplexing of the optical modes (see Fig. 1). We conduct detector tomography [43] of each mode to validate the pseudo-photon-number-resolved detection (PPNRD) scheme [44]. As shown in Fig. S1(a), the probability of the nine photon-click number response of the PPNRD agrees well with the theoretical model. The positive-operator valued measures of the nine photon-click number measurement can be constructed from the data, which is shown in Fig. S1(c), together with its Wigner function and fidelity with the theoretical prediction. While we model the experiment with the PPNRD detection scheme in the following discussions, we address the question of how well our detection scheme emulates true photon number-resolving detection in [44].
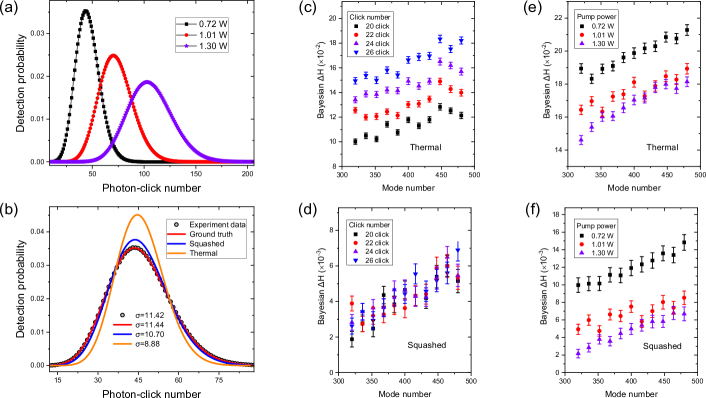
The overall linear efficiency of the whole experimental set-up is 43%, including the quantum light sources, transmission, and detection. This efficiency is much higher than that in ref. [12], which was 33% although involving only three loops. The photon-click number distribution under three laser powers is shown in Fig. 2(a). The maximum photon-click number reaches 255, which is higher than all the previous GBS experiments.
We analyze the obtained GBS samples and validate them against known classical hypotheses in the QCA regime. The most powerful method to spoof the GBS is to use classical states which can maximally approximate the experiment’s quantum light sources which, under photon loss, can be gradually degraded into squeezed thermal states [18]. Thus, in this work, in addition to the thermal state hypothesis which has been tested in Jiǔzhāng 1.0 and 2.0, we consider the more competitive hypothesis, namely the squashed state [12, 18]. The squashed state is a classical mixture of coherent states and has vacuum fluctuations in one quadrature and larger fluctuation in the other. It can be optimized to have the same mean photon number as the input lossy squeezed state [45], which is the convention we take in this work. Note that there are other plausible hypotheses such as using coherent light and distinguishable photons, which are much easier to be ruled out. As shown in [44], the validation strength against these other hypotheses is typically 2-4 orders of magnitude larger than the squashed states. Therefore, we will focus on the discussion of the latter in the main text.
We start by comparing the experimental photon number distribution with the ground-truth model and the possible mockups in Fig. 2(b). The GBS data set taken at laser power (dot) well overlaps with the ground truth (red), while obviously deviates from the classical mockups based on the thermal state (yellow) and the squashed state (blue). These distributions can be quantitatively distinguished by their standard deviation as labelled on the plot, where the experiment exhibits the best agreement with the ground truth.
Then, we continue with the Bayesian test, [46], where two hypothetical theoretical models are compared against each other based on the likelihood to generate the experimental samples. We define the Bayesian test score as the difference between the ground-truth model and the classical adversary model hypothesis on a set of -photon-click samples:
| (1) |
where is the number of samples, represents the th sample, represents the event probability of sample under the hypothesis , and is the coarse-grained probability for the -photon-click under hypothesis . When , it is proven that the experimental samples are more likely from the ground-truth GBS rather than the mockup. A higher Bayesian test score indicates larger confidence.
For the validation, each of the 144 modes is treated as 1-to-8 fan out, yielding a total mode number of 1152 for the ground truth. Further, in our model we consider the noise of the partial photon distinguishability for the Bayesian test, where the probability of the sample event is calculated by a modified version of the Torontonian [44]. We find that our model gives a closer description of the experiment than the previous ones. We use the Sunway TaihuLight supercomputer to calculate the probability of large photon number samples in the QCA regime.
The Bayesian test score of the ground truth against the mockups using the thermal state and the squashed state at pump power are shown in Fig. 2(c)-2(d). Due to the classical computational overhead, we first start from a subsystem with fewer output bosonic modes, and gradually increase the subsystem size. We observe not only all the Bayesian scores in Fig. 2(c)-2(d) are higher than zero, but also they show an evident increasing trend as the subsystem size ramps up. The positive scores demonstrate that the experimental GBS samples are more likely generated from the ground-truth distribution rather than these mockup distributions. More importantly, the rising trend of the Bayesian score indicates a higher score can be inferred for the full system. This increasing trend could be understood from that, as subsystem size increases, more complete information of the full system is incorporated into the Bayesian test, and therefore results in stronger validation strength. Therefore, we conclusively infer that for the full-mode system, though it is not directly computable, stronger Bayesian confidence for the ground-truth theory is expected.
We continue to investigate the power dependence of the Bayesian test. In Fig. 2(e)-2(f), the Bayesian validation strength is plotted for three different pump laser powers from to . The results show that the lower pump power can generate higher Bayesian score. This is expected because the thermal noise and photon loss become increasingly sensitive with larger squeezing parameters [18].
Another important tool for characterizing the GBS is the correlation function. The -order correlation function is recursively defined as
| (2) |
where represents the experimental measurement operator at the th output mode, and represent all partitions of the set excluding the universal set. Based on the correlation function, we validate our experimental samples against other recently proposed mockups based on approximating the experimental GBS through low-order marginal distributions [21].
Reference [21] proposed a greedy algorithm to sample from a distribution that approximates all first- and second-order correlations of the experiment, which we call a greedy sampler below. The same work also used the single-mode marginals and two-mode correlations to configure a Boltzmann machine for sampling under the Thouless, Anderson, and Palmer (TAP) mean field approximation. These methods can be generalized to higher orders in principle, but a full enumeration of all the marginal probabilities of the chosen order is required, which grow combinatorically, and thus limits it within the low-order regime. However, these mockups do not capture higher-order correlations, and can thus be ruled out from this aspect.
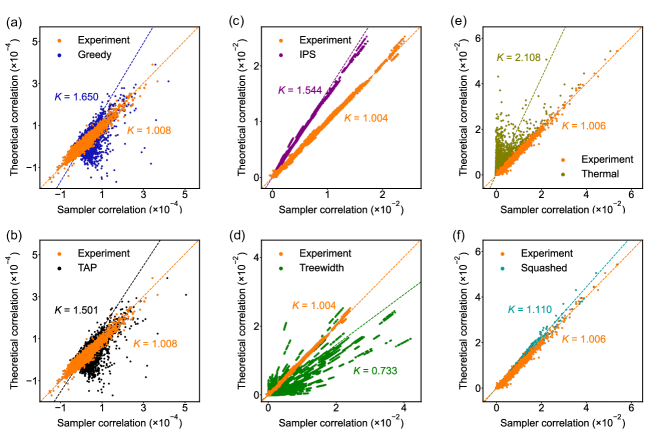
In Fig. 3(a)-3(b), we directly compare the third-order correlation functions between the experimental samples at the QCA regime and the mockup samplers from the order-2 greedy and the order-2 TAP samplers. The statistics of the experimental samples agree with the ground truth where they cluster around the identity line at , whereas the mockup samplers’ third-order correlations show significant divergence from the ground-truth predictions.
Additionally, Ref. [17] designed the IPS sampler, which was shown to yield higher heavy output generation (HOG) score than the mockups using the thermal states and distinguishable photons. We compare the second-order cumulants of the sampler with the experimental results in Fig. 3(c), where the IPS sampler shows an evident deviation from the results of the ground truth and the experimental data.
The last mockup to be ruled out is the recently proposed treewidth sampler [22] which can use local connectivity of the circuits to reduce the overhead of classical approximate sampling. The sampler could generate higher HOG score than some GBS experiments, which, however, is due to the limitation of HOG test itself. In fact, one can show that the treewidth mockup sampler can even yield a higher HOG score than an ideal ground-truth sampler (see Supplementary Materials [44]), therefore makes the test unreliable [23] (related arguments on the limitation of the cross-entropy benchmarking in random circuit sampling have also been reported [47, 48]). Thus, it is necessary to rule out the treewidth mockup in other ways. In Fig. 3(d), we show the second-order correlation of a treewidth mockup (with a propagation length of 65) and the experimental sampler. The former deviates significantly from the ground-truth theory, and is thus unambiguously ruled out.
As a complementary test, we also show in 3(e) the second order correlation of the experiment, the thermal state and the squashed state mockup. The correlation of the experiment, with two-norm distance and slope , clearly agrees with the ground truth better the thermal state mockup () and the squashed mockup ().
Having excluded all currently proposed mockups, we now benchmark the classical computational cost to simulate a noiseless version of our GBS experiment. Our pseudo-photon number resolving detection scheme can be modelled by treating all the 1152 fan-out bins as individual output modes, each with threshold detection. We can use results from [17] to exploit the fact that different output bins corresponding to the same optical mode result in repeated entries in the loop hafnian during the simulation, further reducing the dominant computational cost to:
| (3) |
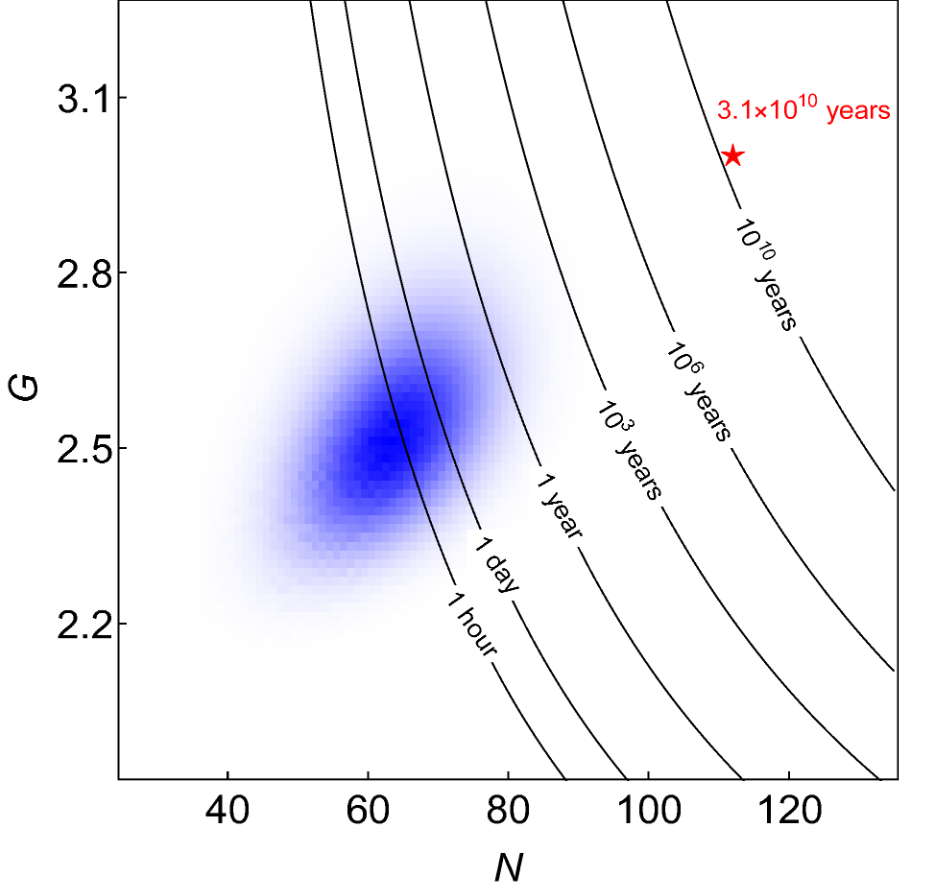
where represents the PPNRD sample with being the photon-click number of the th mode, is the number of clicked modes, is the mode number, , and is estimated based on [12]. The addition of PPNRD therefore substantially increases the computational complexity of our experiment compared to threshold detection (which always has ), due to the strong increase in the number of registered detection events.
We now estimate the time cost on Frontier, currently the most powerful supercomputer. For each sample of our high power experiment, we estimate it would on average take Frontier at least years to generate using the exact methods, while it only takes our machine to produce a sample, showing an overwhelming QCA of . Moreover, the hardest sample from our experiment would take Frontier more than years to generate using exact algorithm. We show in Fig. 4 the distribution of the estimated classical overhead of all the experimental samples. We hope future work will further consider the realistic experimental imperfection such as photon loss and partial photon distinguishability for a better benchmark [49].
Acknowledgements.
We thank Changhun Oh, Minzhao Liu and Liang Jiang for interesting discussions. We thank Z.-M. He, R.-X. Wang, X.-Y. Wu, Z.-M. Zhang and S.-T. Zheng for helpful assistance during the experiment. We thank Y. Liang and Q.-H. Shi for their help in preparation of the manuscript. This work was supported by the National Key R&D Program of China (2019YFA0308700), the National Natural Science Foundation of China, the Chinese Academy of Sciences, the Anhui Initiative in Quantum Information Technologies, the Science and Technology Commission of Shanghai Municipality(2019SHZDZX01), the Innovation Program for Quantum Science and Technology (No. ZD0202010000), the XPLORER PRIZE, the New Cornerstone Science Foundation, and NWO Veni. Y.-H. D., Y.-C. G., H.-L. L., S.-Q. G. and H. S. contributed equally to this work. The dataset of this experiment can be accessed via [50]. Note added - After submission, we became aware of a recent related theoretical proposal for balanced-fan-out PPNRD GBS [51].References
- Bernstein and Vazirani [1993] E. Bernstein and U. Vazirani, in Proceedings of the Twenty-Fifth Annual ACM Symposium on Theory of Computing - STOC ’93 (ACM Press, San Diego, California, United States, 1993) pp. 11–20.
- Preskill [2012] J. Preskill, arXiv:1203.5813 (2012).
- Harrow and Montanaro [2017] A. W. Harrow and A. Montanaro, Nature 549, 203 (2017).
- Lund et al. [2017] A. P. Lund, M. J. Bremner, and T. C. Ralph, npj Quantum Information 3, 15 (2017).
- Hangleiter and Eisert [2023] D. Hangleiter and J. Eisert, arXiv:2206.04079 (2023).
- Aaronson and Arkhipov [2011] S. Aaronson and A. Arkhipov, in Proceedings of the 43rd Annual ACM Symposium on Theory of Computing - STOC ’11 (ACM Press, New York, New York, USA, 2011) pp. 333–342.
- Boixo et al. [2018] S. Boixo, S. V. Isakov, V. N. Smelyanskiy, R. Babbush, N. Ding, Z. Jiang, M. J. Bremner, J. M. Martinis, and H. Neven, Nature Physics 14, 595 (2018).
- Arute et al. [2019] F. Arute, K. Arya, R. Babbush, D. Bacon, J. C. Bardin, et al., Nature 574, 505 (2019).
- Zhong et al. [2021a] H. S. Zhong, H. Wang, Y. H. Deng, M. C. Chen, L. C. Peng, et al., Science 370, 1460 (2021a).
- Zhong et al. [2021b] H.-S. Zhong, Y.-H. Deng, J. Qin, H. Wang, M.-C. Chen, et al., Physical Review Letters 127, 180502 (2021b).
- Wu et al. [2021] Y. Wu, W.-S. Bao, S. Cao, F. Chen, M.-C. Chen, et al., Physical Review Letters 127, 180501 (2021).
- Madsen et al. [2022] L. S. Madsen, F. Laudenbach, M. F. Askarani, F. Rortais, T. Vincent, J. F. F. Bulmer, et al., Nature 606, 75 (2022).
- Bell [1964] J. S. Bell, Physics Physique Fizika 1, 195 (1964).
- Einstein et al. [1935] A. Einstein, B. Podolsky, and N. Rosen, Physical Review 47, 777 (1935).
- Ágoston Kaposi et al. [2022] Ágoston Kaposi, Z. Kolarovszki, T. Kozsik, Z. Zimborás, and P. Rakyta, arXiv:2109.04528 (2022).
- Quesada et al. [2022] N. Quesada, R. S. Chadwick, B. A. Bell, J. M. Arrazola, T. Vincent, H. Qi, and R. García-Patrón, PRX Quantum 3, 010306 (2022).
- Bulmer et al. [2022] J. F. F. Bulmer, B. A. Bell, R. S. Chadwick, A. E. Jones, D. Moise, et al., Science Advances 8, eabl9236 (2022).
- Qi et al. [2020] H. Qi, D. J. Brod, N. Quesada, and R. García-Patrón, Physical Review Letters 124, 100502 (2020).
- Renema [2020] J. J. Renema, Physical Review A 101, 063840 (2020).
- Shi and Byrnes [2022] J. Shi and T. Byrnes, npj Quantum Information 8, 54 (2022).
- Villalonga et al. [2022] B. Villalonga, M. Y. Niu, L. Li, H. Neven, J. C. Platt, V. N. Smelyanskiy, and S. Boixo, arXiv:2109.11525 (2022).
- Oh et al. [2022a] C. Oh, Y. Lim, B. Fefferman, and L. Jiang, arXiv:2110.01564 (2022a).
- Oh et al. [2022b] C. Oh, L. Jiang, and B. Fefferman, arXiv:2210.15021 (2022b).
- Shchesnovich [2021] V. Shchesnovich, Quantum 5, 423 (2021).
- Dellios et al. [2022a] A. S. Dellios, M. D. Reid, B. Opanchuk, and P. D. Drummond, arXiv:2211.03480 (2022a).
- Seron et al. [2022] B. Seron, L. Novo, A. Arkhipov, and N. J. Cerf, arXiv:2212.09643 (2022).
- Giordani et al. [2023] T. Giordani, V. Mannucci, N. Spagnolo, M. Fumero, A. Rampini, E. Rodolà, and F. Sciarrino, Quantum Science and Technology 8, 015005 (2023).
- Drummond et al. [2022] P. D. Drummond, B. Opanchuk, A. Dellios, and M. D. Reid, Phys. Rev. A 105, 012427 (2022).
- Popova and Rubtsov [2021] A. S. Popova and A. N. Rubtsov, arXiv:2106.01445 (2021).
- Grier et al. [2022] D. Grier, D. J. Brod, J. M. Arrazola, M. B. d. A. Alonso, and N. Quesada, Quantum 6, 863 (2022).
- Lim and Oh [2022] Y. Lim and C. Oh, arXiv:2211.07184 (2022).
- Dellios et al. [2022b] A. Dellios, P. D. Drummond, B. Opanchuk, R. Y. Teh, and M. D. Reid, Physics Letters A 429, 127911 (2022b).
- Iosue et al. [2022] J. T. Iosue, A. Ehrenberg, D. Hangleiter, A. Deshpande, and A. V. Gorshkov, arXiv:2209.06838 (2022).
- Qiao et al. [2022] Y. Qiao, J. Huh, and F. Grossmann, arXiv:2210.09915 (2022).
- Liu et al. [2023] M. Liu, C. Oh, J. Liu, L. Jiang, and Y. Alexeev, Complexity of Gaussian boson sampling with tensor networks (2023).
- Oh et al. [2023a] C. Oh, L. Jiang, and B. Fefferman, arXiv:2301.11532 (2023a).
- Rahimi-Keshari et al. [2016] S. Rahimi-Keshari, T. C. Ralph, and C. M. Caves, Physical Review X 6, 021039 (2016).
- Deshpande et al. [2018] A. Deshpande, B. Fefferman, M. C. Tran, M. Foss-Feig, and A. V. Gorshkov, Physical Review Letters 121, 030501 (2018).
- Chabaud and Walschaers [2023] U. Chabaud and M. Walschaers, Physical Review Letters 130, 090602 (2023).
- Hamilton et al. [2017] C. S. Hamilton, R. Kruse, L. Sansoni, S. Barkhofen, C. Silberhorn, and I. Jex, Phys. Rev. Lett. 119, 170501 (2017).
- Quesada et al. [2018] N. Quesada, J. M. Arrazola, and N. Killoran, Phys. Rev. A 98, 062322 (2018).
- He et al. [2017] Y. He, X. Ding, Z.-E. Su, H.-L. Huang, J. Qin, C. Wang, et al., Physical Review Letters 118, 190501 (2017).
- Lundeen et al. [2009] J. S. Lundeen, A. Feito, H. Coldenstrodt-Ronge, K. L. Pregnell, Ch. Silberhorn, T. C. Ralph, J. Eisert, M. B. Plenio, and I. A. Walmsley, Nature Physics 5, 27 (2009).
- [44] See Supplemental Materials for detailed description of 1. Detector tomography of the pseudo-photon-number re- solving detectors, 2. Measurement for the matrix phase, 3. Partial photon indistinguishability model, 4. Bayesian test results against weaker classical hypotheses, 5. On HOG test with the treewidth mockup, which includes Ref. [52, 53].
- Martínez-Cifuentes et al. [2022] J. Martínez-Cifuentes, K. M. Fonseca-Romero, and N. Quesada, arXiv:2207.10058 (2022).
- Bentivegna et al. [2014] M. Bentivegna, N. Spagnolo, C. Vitelli, D. J. Brod, A. Crespi, et al., International Journal of Quantum Information 12, 1560028 (2014).
- Barak et al. [2020] B. Barak, C.-N. Chou, and X. Gao, arXiv preprint arXiv:2005.02421 (2020).
- Gao et al. [2021] X. Gao, M. Kalinowski, C.-N. Chou, M. D. Lukin, B. Barak, and S. Choi, arXiv:2112.01657 (2021).
- oh [2] After submission, we became aware of a newly developed faster classical approximate simulation algorithm which exhibits error level of the HOG score and up-to 5-order correlation function comparable to the experiment, by taking advantage of the photon loss [54]. Ref. [54] takes minutes to generate the tensor network state corresponding to a specific experiment, while in our experiment it takes to generate a sample and ms to reconfigure a new experiment (in Jiǔzhāng 2.0, only limited by the speed of the physical elements). In addition, Ref. [54] used a simplified model of ground truth for benchmarking of this work, without taking pseudo-photon detection and partial distinguishability into account. We expect future GBS experiments with higher efficiency, as well as better characterization of the experimental imperfections, in particular the calibration noise, could also help enhance the quantum advantage against the approximate simulation algorithms.
- JZ [3] Raw data of Jiuzhang 3.0.
- Bressanini et al. [2023] G. Bressanini, H. Kwon, and M. Kim, arXiv preprint arXiv:2305.00853 (2023).
- Akhlaghi et al. [2011] M. K. Akhlaghi, A. H. Majedi, and J. S. Lundeen, Optics express 19, 21305 (2011).
- Christ et al. [2011] A. Christ, K. Laiho, A. Eckstein, K. N. Cassemiro, and C. Silberhorn, New Journal of Physics 13, 033027 (2011).
- Oh et al. [2023b] C. Oh, M. Liu, Y. Alexeev, B. Fefferman, and L. Jiang, arXiv preprint arXiv:2306.03709 (2023b).