The temporal rich club phenomenon and its formation mechanisms in the international nitrogen fertilizer trade
Abstract
N-nutrients in nitrogen fertilizers are a critical resource for modern agricultural production, with most economies relying on imports to secure adequate supplies. The N-nutrient trade system is vital for global food security and ecological safety. We analyzed the N-nutrient trade network from 1991 to 2020, using the perspective of the temporal rich club (TRC), to identify the core functional groups of global N-nutrient trade. Our analysis revealed that the Netherlands, US, France, China, UK, Belgium, Germany, and Spain form the stable cornerstone group from which other economies derive the complete trade network. We found that simply increasing the volume of import and export trade is insufficient to create an extensive and stable trade structure. Instead, the most effective way to enter the core of the trade network is to increase upstream and downstream trade partners and enhance its own importance and reputation. Our mathematical model suggests that the generation mechanism of the TRC phenomenon in the N-nutrient trade network is due to the coexistence of the attraction of reputation in supply and demand and the path-dependence mechanism. By understanding these mechanisms, we can provide a new perspective on the evolution of the trade network and the stability of the system.
I Introduction
Fertilizer is a crucial input in agriculture and plays a significant role in ensuring food security and supporting economic growth [1]. The international trade of fertilizers has grown rapidly in recent decades, and the N-nutrients embedded in the nitrogen fertilizer trade is the largest segment of the global fertilizer industry [2]. Meanwhile, the N-nutrient trade is the most important part of the international N cycle [3], which is vital for ecology [4, 5]. However, the development and interaction do not change the fact that it is an oligopoly of a few big players [6]. While the potential risks of low N-nutrients availability are crucial for global food security [7], the oligopoly is practically the basis of global N-nutrient supply. The core economies in trade form a strong and effective alliance to keep the international N-nutrient flow system functioning. This is often described in complex systems in the form of the rich club phenomenon [8] or k-core [9]. Especially in the context of any industrialized country being able to produce its own N-nutrients, the formation of an oligopoly alliance is particularly intriguing. A closer look at the formation of this alliance requires an analysis based on the time dimension. Therefore, the temporal rich club (TRC) from network science [10], which refers to whether the prominent nodes will form a stable and tight association, could be an effective and novel tool to analyze the emergence of this alliance and explore the principles behind it in the temporal network setup [11]. The study of the patterns and characteristics of the TRC phenomenon in the international N-nutrient trade can provide valuable insights into the functioning of the global economy and food security.
The TRC phenomenon is based on the classical rich club phenomenon computed in static network [8], which refers to the existence of highly interconnected nodes in complex network. This phenomenon is widespread in various practical systems, such as internet topology [12], population mobility [13], brain [14, 15], ocean transport [16], and so on. Therefore, the analysis method of the rich club has been widely studied in various fields, such as sociology [17, 18], economics [19], neuroscience [15], and physics [20]. Methodological researchers have extended the basic rich club identification method into weighted networks [21, 22] and directed networks [23]. And the TRC extended from the time evolution dimension is a relatively new approach [10]. Since the temporal network setup stores more information [24], the TRC can capture the dynamic evolution of the rich club over time. In this paper, we will explore the TRC phenomenon in the international N-nutrient trade network using a multi-year trade dataset to figure out the intrinsic evolutionary mechanisms.
In terms of international trade, the intrinsic evolutionary mechanisms have many related explanations in economics. The explanations include the persistence of comparative advantage [25], the emergence of dominant firms [26], and the spatial organization of economic activity [27]. There is also a large effect from policy [28]. In this regard, the gravity model [29], one of the most frequently used frameworks for trade research, is able to portray the impact of various types of policies and distances [30, 31]. Computable general equilibrium models, such as the Global Trade Analysis Project (GTAP) [32], are widely used in trade studies to evaluate the impact of policy changes and external shocks on the economy [33, 34, 35]. Over the past decade, complex network models have been increasingly used to further analyze the mechanisms behind the evolution of international trade [36, 37], in a way that encompasses the economies’ latent variables in terms of their recorded behavior. In this paper, we aim to construct a mathematical model to explain why the TRC phenomenon occurs in the N-nutrient trade network. The results of our analysis will have some implications for understanding the structure and evolution of the global N-nutrient trade network.
The rest of the paper is organized as follows: Section II describes the database, explains the methodology of building networks, and and enumerates the calculations of TRC. Section III reports the TRC of the overall temporal network, the TRC with different starting points and different richness, and the theoretical model of the constitutive TRC phenomenon. A related summary discussion is conducted in Section IV, which provides some policy implications.
II Methods and data
II.1 Data
The trade data is sourced from the United Nations Commodity Trade Database (https://comtrade.un.org), and we have collected detailed trade flow data between economies for 30 years, from 1991 to 2020. The year-by-year inter-economy N-nutrient trade data are calculated based on the nutrient conversion concentrations in Table 1, which is the method provided by the Food and Agriculture Organization of the United Nations (https://fao.org). The basic unit is tons. Since every economy reports their import and export data, we have preprocessed the repeated trade data by using data reported by the importing economies as the basis, supplemented by data from the exporting economies [38]. The data reported by importing economies is considered more credible because it is directly related to import tariffs.
| Commodity | HS code | N-content |
|---|---|---|
| Urea | 310210 | 46% |
| Ammonium sulphate | 310221 | 21% |
| Ammonium nitrate | 310230 | 33.5% |
| Calcium ammonium nitrate and other mixtures with calcium carbonate | 310240 | 26% |
| Sodium nitrate | 310250 | 16% |
| Urea and ammonium nitrate solutions | 310280 | 32% |
| Ammonia, anhydrous | 281410 | 82% |
| Other nitrogenous fertilizers, n.e.c. | 281420, 310260, 282710, 283410, 310229, 310290, 310270 | 20% |
| NPK fertilizers | 310520 | 15% |
| Diammonium phosphate | 310530 | 18% |
| Monoammonium phosphate | 310540 | 11% |
| Other NP compounds | 310551, 310559 | 20% |
| Potassium nitrate | 283421 | 13% |
II.2 Network construction
The international N-nutrient trade network is a complex system composed of nodes (trading economies), links (trade), and link weights (trade volume). Its evolution over the course of 30 years can be completely captured by a temporal network , which is composed of 30 single-layer networks. For a single-layer network, this is an aggregation of all trade relations of all economies in a given year . It can be depicted as , where the set of nodes represents all economies (denoted by ) involved in the N-nutrient trade in year , and the set of links includes the trade relations (denoted by ) of N-nutrient trade exported from economy (or economy for simplicity) to economy (or economy for simplicity) in year .
For unweighted networks, is simplified to
| (1) |
where is the N-nutrient trade volume (unit in tons) exported from economy to economy in year . For weighted networks, is directly recorded:
| (2) |
Converging , the overall temporal network is described as , including the set of all temporal nodes and the set of all temporal links . A temporal link can be described as , denoting an interaction from node to node at time with weight .
II.3 The temporal rich club
Temporal rich club [10] is characterized by a coefficient defined as the maximal value of the density of links between nodes with a minimal required richness, which remain stable for a certain duration. The emergence of this phenomenon represents the well-connected nodes in a temporal network have a tendency to form simultaneous and stable structures. The definition of the TRC starts with the classical rich club of the static network [8]. For a static undirected network with according node richness , the rich club coefficient is defined as the density of the subgraph that only contains nodes whose richness is greater than and links between them:
| (3) |
where represents the cardinal number of set . Similarly, for a directed network, it’s rich club coefficient is
| (4) |
Extended to directed temporal networks, the TRC coefficients are expressed as
| (5) |
where is the set of nodes associated to the links in , which is usually a proper subset of . The intersection of subsets of the continuous network from to gives the set that remains stable from to . Its network density is the TRC coefficient . When , is the static rich club coefficient of the network . As increases, can analyze whether the core part of the network remain consistently related.
Further, considering the temporal network as a whole, the maximum density obtained from consecutive observations is the corresponding rich club coefficient of this temporal network under the parameter. The TRC coefficient without the starting time is defined as
| (6) |
is designed to quantify (1) whether the static rich club patterns correspond to a structure that existed at some instant, (2) how dense and stable such a structure is, or (3) whether the rich club is formed by links that appeared at unrelated times. An increasing with denotes that the richest nodes tend to be increasingly connected with each other in a simultaneous and stable way for a duration of at least . This is a different requirement from distinguishing stable and unstable hubs. Indeed, focuses on the links between hubs. The simultaneous association between hubs contributes the most to TRC.
However, it is inevitable that the effect of random effects in the network evolution needs to be taken into account. Only the structure evolution beyond the random network exhibits the real characteristics of the rich nodes. For example, in circuit networks, the circuits that have been built normally remain continuously connected, causing a high of the set of rich nodes. But this is actually a property of the overall network. Therefore, it is necessary to build a null model to calculate and compare it with the actual value [10]. Regarding the computation of the null model, a reshuffling procedure function [39] is used to permute the timestamps of all temporal links while maintaining the node indices and constant. This process generates a series of simple random networks that can analyze whether there are intrinsic forces between hubs in the actual system.
For the comparison of and , a ratio is usually used to judge the existence of the TRC phenomenon. It is convinced to exist when . But this alone may not be precise enough [40]. In this study, we refer to adding a statistical test as a basis for determining whether there is a TRC phenomenon. The null hypothesis is: is not larger than 1. The -value is calculated as follows:
| (7) |
where counts the number of whose values are not larger than 1. As , the estimated bootstrap -value will tend to the ideal bootstrap -value. In our case, is set to 1000. The smaller the -value, the stronger the evidence against the null hypothesis and favoring the alternative hypothesis that the presence of the TRC phenomenon is statistically significant. By adopting the conventional significance level of , the TRC phenomenon is statistically significant if . For the part that passes the statistical test, we use the value of as a characterization, with a larger indicating a stronger TRC phenomenon.
III Results
III.1 The identification of the TRC phenomenon
For the estimation of the TRC phenomenon, it is first necessary to determine what property of the node is representing the richness. The degree of the node is the main richness used in many studies [8]. This is because the preferential attachment (PA) model [41] is regarded as a reliable model for most realistic networks, where the probability of finding connected links between nodes is proportional to the degree of those links. Nodes with high degrees naturally form tight associations with each other, and researchers have given theoretical reference values. In temporal networks, degrees are naturally extended to temporal degrees [10]. Therefore, we first use the temporal degree as the richness to identify whether there is a TRC phenomenon in the N-nutrient trade network. Since the trade network is a directed network, here .
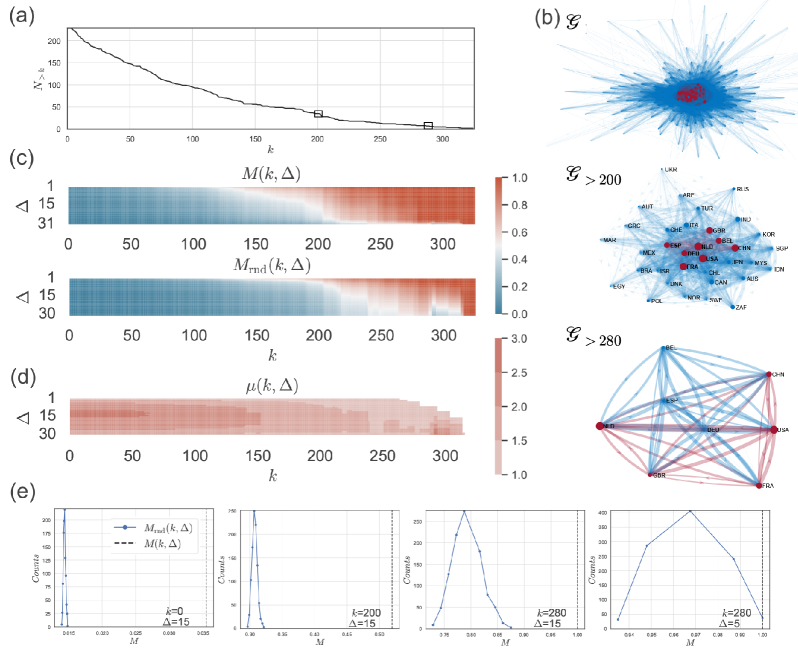
We first report in Figure 1(a) the trend in the number of club members as the richness threshold increases. There are only two nodes in that remain permanently stable and fully connected: the Netherlands and the United States. This membership is so small as to be meaningless. The club that can maintain a stable, fully connected state for more than 20 consecutive years is , which is the state we listed in the bottom plot of Figure 1(b). Club members include the Netherlands, the United States, France, China, the United Kingdom, Belgium, Germany, and Spain. These eight economies make up the core club of the N-nutrient trade network. Referring to the middle plot of Figure 1(b), this core club is completely central in a larger club with 35 members and would be the basis for network production. And is also the most central part of the overall network , as shown in the top plot of Figure 1(b).
For the TRC phenomenon, we report in Figure 1(c) the coefficients from the actual N-nutrient trade network and the coefficients from the null model, respectively. is a relatively obvious position for the coefficient change in . This change is earlier than in the random network. The increase in the TRC coefficient indicates that the association between club members is getting stronger and more stable. In the club , the result of reveals a high density of immediate association, but this association does not maintain a stable state in the long term. The central club has not only but also . This incredibly long-term stability in time certainly highlights the cornerstone role of this club for the system. Regarding the TRC coefficients of the random network generated by the null model, note that the is the mean of 1000 random simulations. An important point is that the start increasing later as increases and decay more rapidly as increases. Due to the null model’s preservation of permanently stable links, the TRC coefficients in the random network reaching a local maximum imply that the club is a steady-state core structure. For the club , further increase in would remove the nodes in the central position, Spain and Germany. This makes the stability within the club instead reduce. So we consider as the most central structure of the N-nutrient trade system. For this, we give the mathematical definition equation of the stable core club , which need to have
| (8) |
For the N-nutrient trade network, there is another core structure that fits this definition, which is the ultimate binary structure, Netherlands and USA. In a practical sense, the core structure with more club members will be more influential.
Combining and , we report the results of their ratio in Figure 1(d). We use bootstrap statistical tests in Eq. (7), and the fraction of statistical significance above 1% is identified as not having a significant TRC phenomenon, described as a blank. The value of is presented for the fraction of statistical significance less than 1%. We report four typical statistical results in Figure 1(e). The first three are statistically significant results. As increases, the more core clubs show a wider distribution. The fourth subplot shows a non-significant result, which is for the core club in a short-time simulated situation. Since the club is too closely linked, there is not a small probability of reaching the actual value under the null model. In terms of the overall results, the peripheral nodes in the system, i.e., those with , exhibit a more pronounced simultaneity in the trade relationships. This is due to the effects of globalization, where small economies are always in the process of integrating into the trade system. The apparent time trend has led to simultaneity among small economies. For the large economies in the core club, the impact of globalization is not as significant because it has remained highly interconnected. However, when the core group is destroyed at , we observe a pronounced simultaneity effect. The remaining club members no longer have permanent and stable trade relations with each other, and the time trend triggers a strong simultaneity. This causes to express relatively high values.
In summary, we complete the shaving of the TRC phenomenon of the N-nutrient trade network with the temporal degree as the richness in this section. By comparing the actual TRC coefficients and those simulated by the null model, we identified the central cornerstone club in the network. When this club is disrupted, there is a change from a stable state to an unstable state. It is found that small players are more affected by the trend of globalization to develop simultaneous trade relations. As globalization reaches a bottleneck, this part of the study can focus on whether the same synchronization phenomenon will occur when trade protectionism and counter-globalization are prevalent.
III.2 Comparison between the TRCs of different richness
In the previous section, we investigated the overall temporal network from 1991 to 2020 as a whole for the analysis of the TRC. But due to the strong time trend brought about by globalization, it is necessary to build a deeper analysis from a specific starting point . Meanwhile, we carried out the study of the TRC using the temporal degree as richness. While in the analysis starting from the static starting point , the various properties of the nodes in the static network can be used as the richness to construct the rich club. Centrality metrics of nodes such as degree, eigenvector, pagerank, betweenness, and closeness can be applied. Weighted network variables such as strength and average strength can be considered [22]. Variables outside the network can also be used, such as the classical GDP. Rich economies are considered to be the most influential nodes, and they tend to occupy the most central part of trade, forming the dominant roles. Specifically for the influence of the economy on N-nutrient trade, the total supply of the economy can be used as a valid reference. Without considering the stock changes and the content of the land, there is a basic nutrient balance for any economy:
| (9) |
is the amount of imports in the economy and is the amount of exports in the economy . The total supply is the sum of the amounts of N-nutrients imported and produced in the economy in one year. This indicator provides a measure of the availability of N-nutrients. The higher the , the more potential N-nutrients the economy is able to make decisions with, and the more naturally it can have a higher position in the N-nutrient trade system. From the perspective of the trade network, the total trade volume of the economy is regarded as the main network centrality in the weighted network and the most dominant measure of influence in the actual trade system. Summing up the above, we will use four indicators as the richness to construct the rich club. The four indicators are the economy’s GDP, the total supply of N-nutrients, the degree in the N-nutrient trade network, and the total trade volume . The degree here is the static indicator of and . Through the analysis of these four clubs, we intend to clarify the main reasons affecting the TRC phenomenon.
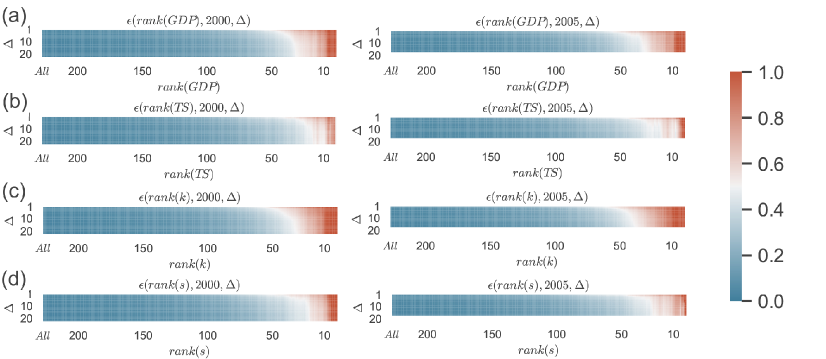
To account for the inevitable time trend, we focus on comparing the relationship between indicators and their endogenous meaning from a specific starting time . In Figure 2, we compare the results for two starting times, and , and use four different indicators as the richness. To allow for comparison between different metrics, we standardized the values and ranked them. This is a common approach in rich club studies [40, 12]. After analyzing the results for each starting time point, we find that for any starting point , there are
|
∑rank(k),Δϵ(rank(k), t, Δ) ¿ ∑rank(GDP),Δϵ(rank(GDP), t, Δ) ¿ ∑rank(s),Δϵ(rank(s), t, Δ) ¿ ∑rank(TS),Δϵ(rank(TS), t, Δ). |
(10) |
This is an empirical result to analyze what certain characteristics of nodes make them more likely to form long-term rich clubs. The finding shows that nodes with high degrees are most inclined to form stable and closely related clubs. This effect exists in wealthy economies with a little instability. When rich clubs are constructed based on trade volume , the TRC phenomenon weakens significantly. Major economies sorted by the sum of imports and exports are unlikely to generate the TRC phenomenon, indicating an unstable trade group. Consider that important economies rely more on their own domestic production, such as the US, which is a big net importer but still produces about 70% of its N-nutrients domestically. We use the sum of imports and production as a proxy, but find that the major economies sorted by are still unlikely to generate the TRC phenomenon. For example, India, despite being a global leader in N-nutrient production, neither occupies a central position in the trade network nor has it established a stable import-export structure. This underscores the instability of its foreign trade and may be one of the reasons why India, from being a self-sufficient country in N-nutrients, has become increasingly dependent on imports instead of increasing its production scale, as observed from 2000 to 2020. These show that trade volume or availability is not the most dominant factor in the formation of a stable rich club. Conversely, having more trading partners, which leads to a good reputation and a central position in the trade network, plays an important role in the formation of the rich club.
III.3 The evolution of the TRC of different richness
Our previous section has demonstrated that economies with high , which can be interpreted as having a strong reputation and influence, tend to form closer and more stable clubs. However, there is a concern that these economies may have a ”ticket” to the club based on historical factors such as geographic location, economic status, culture, and religion. To address this concern, we conducted an evolutionary analysis of the TRC phenomenon from 1991 to 2011 to determine whether high can assist economies in gaining entry to the club during the evolutionary process. This analysis provides a clearer understanding of the N-nutrient trade over the past 30 years.
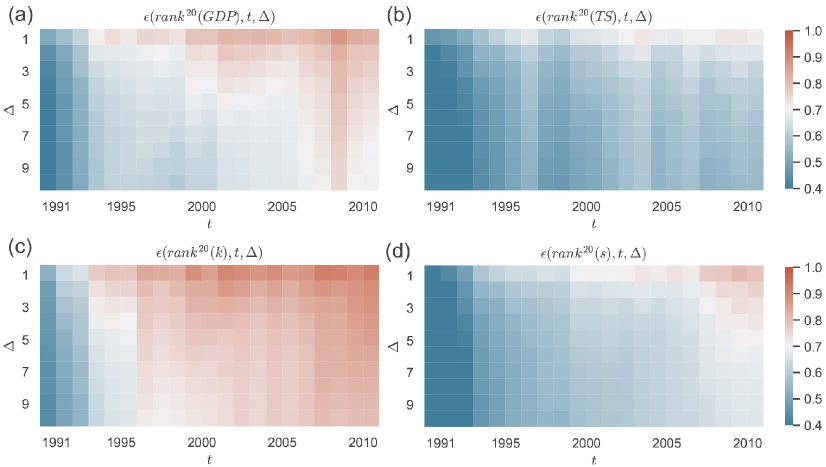
In Figure 3, we observe the TRC phenomenon for different richness and starting times, using the top 20 economies as the club. The maximum evolution time is set to . Overall, the results of all richness show increasing TRC coefficients over time, reflecting the increasingly dense trade relationships between economies brought about by globalization. For the top 20 club in Figure 3(a), the most stable state is formed in 2009, during the global economic crisis. The shock highlights the special characteristics of these economies, which may have played a role in protecting their during the crisis. The has the lowest TRC coefficient in Figure 3(b). For the top 20 economies ranked by degree in Figure 3(c), the highest TRC coefficient is observed. From 1991 to 1996, there is a significant increase in both stability and correlation. After that, the club maintains high stability while having a tight correlation. This suggests that nodes with high degree are better able to form stable structures in the network. While node strength is an important criterion for judging whether nodes are related to each other in a weighted network, it is not as significant in the analysis of TRC. In Figure 3(d), the overall TRC coefficient for the top 20 clubs ranked by is low, with only some tight relationships observed after 2008 in the static network, and relatively poor stability over time.
Through the comparison of the evolution of the TRC coefficient for the four richness, a clear pattern emerges: for the vast majority of and , it has
| (11) | ||||
This pattern confirms that nodes with high network degrees are able to form the most stable central structures, a feature that persists throughout the time evolution, indicating that reputation and network importance are the vital factors to the rich club.
Furthermore, there is an overall trend,
| (12) |
indicating that the core club maintains an expanding trend over time, for the sake of ensuring their status as core hubs in the growing system. This suggests that improving one’s participation in the trade network, even if just importing and re-exporting, is highly advantageous for an economy to build trust and reputation to join the rich club. In general, economies with high have more opportunity to join the club during the evolutionary process.
III.4 The formation mechanism of the TRC phenomenon
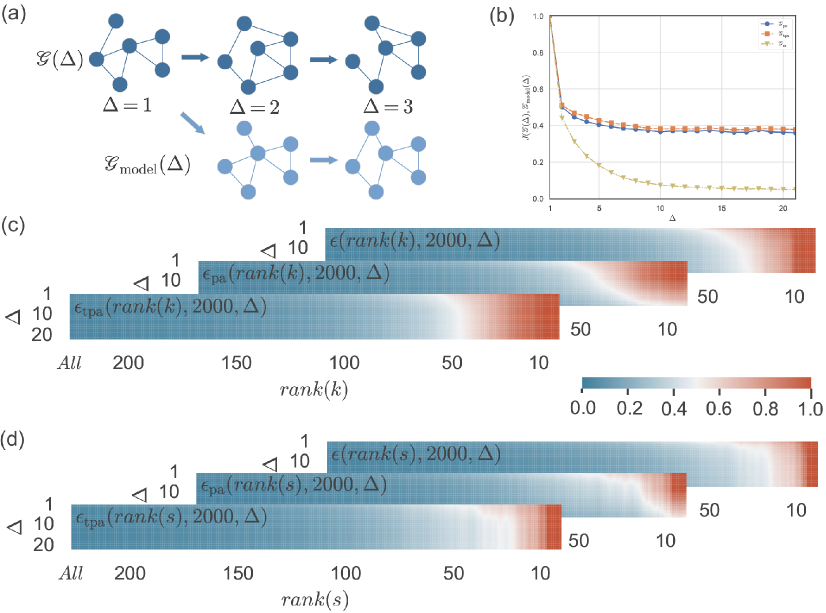
We have identified the TRC phenomenon that exists in the N-nutrient trade network, which makes oligopoly monopolies more stable. The node’s degree has been identified as the primary factor in the formation of a stable and tight structure that forms the TRC. To further understand the mechanism behind this phenomenon, we construct complex network models to investigate why TRC occurs. The network evolution model is denoted by , based on a certain mechanism from the actual trade network. In Figure 4(a), we show a schematic illustration of a simple model where the model network is constructed based on the actual network structure in and simulates the evolution in . When a model generates a TRC similar to the one in the actual system, the mechanism behind the evolution model can be considered a possible answer to why the TRC phenomenon occurs, or at least a mathematical explanation for it.
Research related to international trade often uses gravity models and computable general equilibrium models. The import and export of a particular commodity are seen as a vital factor affecting whether trade relations exist between two economies. Since we have found in our previous studies that the economies with high degrees are more likely to form the stable rich club than the economies with high trade volumes, we focus more on the perspective of complex networks. The degree can be seen as a measure of network importance and reputation. It is a simplification of supply and demand. The preferential attachment (PA) model is one of the most important network generation models. Its essence lies in the tendency of nodes to connect with highly connected nodes. For the emergence of new links in existing structures, the classical PA model is extended to the double-PA model. Political relations are another high-priority factor, but there are too many hidden variables to be simply incorporated into a mathematical model.
Regarding the mechanism behind the formation of the TRC phenomenon, we believe that highly developed economies are more likely to continue to have trade relations with each other, and nodes with high export degrees are more likely to export to nodes with high import degrees. The mathematical hypothesis given for this is that the probability of trade occurring between economies and is proportional to the product of their out-degree and in-degree, i.e., . Based on this, we constructed a network model based on the preferential attachment (PA) model [42]. To simulate the evolution of the network, we introduce two more variables, one of which is the death rate of links from to ,
| (13) |
another is the birth rate of links from to
| (14) |
And in order to make the evolution starting point the same as the real network , we let . refers to the part of at and before . The evolutionary process can be inscribed as
| (15) | ||||
while
| (16) |
and
| (17) |
Meanwhile,
| (18) |
However, the analysis of the TRC phenomenon in real systems reveals that the double-PA model only captures a partial picture of the TRC phenomenon. Although the probability of high-degree nodes being connected to each other is higher than that of low-degree nodes, this cannot create a stable core club similar to that observed in the real system. To further characterize why complex systems form stable TRC, we introduce another link formation mechanism, referred to as path-dependence, in which the longer a link persists, the higher the probability that it will continue to be reinforced. Here, the trade disruption probability between economies and from to , denoted by , is inversely proportional to the existing duration of the link in the previous temporal network , recorded as . We name this evolution model that incorporates this mechanism the temporal-preferential attachment (TPA) model, which is described as follows:
| (19) | ||||
while
|
^β_t^d(τ_ij,t) = (1-∑τij,t♯[Etpa(t, τij)]∑τij,t♯[Etpa(t, τij)]τij,t pdeath(t)τij,t) ♯[Etpa(t)]∑Etpa(t)ki,toutkj,tin, |
(20) |
and
| (21) |
is the existing duration of the link . refers to the sub-network of the links with a particular in the network , and similarly points to the set of links with a particular in the network .
We generated two evolutionary models, namely the PA model and the TPA model, based on to produce two networks and , respectively. In Figure 4(b), we compare these two simulated networks with the actual network at the same evolution time using the Jaccard index [43], calculated as . As a comparison, we include another evolutionary model that breaks or generates links with equal probability, similar to the Erdős–Rényi (ER) model. Results show that and preserved a similar proportion of links to the actual trade network as they evolved. After an initial decrease in similarity, both models maintain a stable portion of about 0.4 of the actual network. Note that the number of the same links increases over time as the network density increases. Comparing the two models, shows a slight advantage in maintaining similarity over time. In contrast, the similarity of with the actual network continuously decreased over time, approaching that of a completely independent distribution. Overall, the PA and TPA models preserve some properties of the actual network through the evolutionary process, allowing analysis of whether their mechanisms contribute to the formation of the TRC phenomenon.
Our goal in constructing the evolution networks and is to analyze the TRC phenomenon, which we report in Figure 4(c, d). Figure 4(c) uses node degree in the initial static network as the richness to construct the rich club, while Figure 4(d) uses node strength . The right graph shows the TRC phenomenon in the real system, which is presented here for comparison. In the middle graph, we depict the TRC results starting from year of the evolution model . It can be observed that when the system evolves strictly according to the PA mechanism, it does exhibit a TRC phenomenon. The higher the degree of economic entities, the easier it is for them to trade and maintain their trade relationships. However, as the evolution time increases, the TRC phenomenon in the PA model does not evolve in the same way as in the actual system. The core group will experience decay over a sufficiently long period of evolution, and the system will tend towards decentralization, where the core group will not maintain a permanent monopoly. This is a point that differs from the actual N-nutrient trade system, where the core club can form a stable and robust structure. Therefore, we recognize that the PA mechanism alone is not sufficient to explain the formation of the TRC phenomenon. The mechanism that increases the probability of link persistence as its existing duration lengthens is added to construct the TPA model. The relevant results are shown in the left graph. The TPA model exhibits the TRC phenomenon in a way that is close to that in the actual system and retains strong stability in the core structure over long periods of evolution, whether in or rich clubs. This suggests that the joint action of these two mechanisms in the TPA model can produce the TRC phenomenon that exists in the actual system. On the other hand, the TRC phenomenon in the TPA model may be stronger than in the actual system. This is because the model cannot capture the impact of various exogenous events on the system, such as the 2008 economic crisis and the COVID-19 pandemic, which can cause significant disruptions and lead to the collapse of stable rich clubs. The TPA model is a more ideal construction. At the same time, we have also constructed a model with only the temporal mechanism that increases the probability of link persistence as its duration lengthens and found that the results differ significantly from those in the actual system. This indicates that the TRC phenomenon in the actual system depends on both mechanisms and cannot be generated without either one.
IV Discussion and summary
Nitrogen is a vital component of modern agricultural production, and most economies depend on imports to ensure an adequate supply of N-nutrients. The stability of the N-nutrient trade system is crucial for global food security and ecological security. We analyzed the overall N-nutrient temporal trade network from 1991 to 2020 to decipher the core functional groups of global N-nutrients from the perspective of the TRC. Using a null model, we identified the Netherlands, the United States, France, China, the United Kingdom, Belgium, Germany, and Spain as the most stable cornerstone group, from which other economies derived a complete trade network. Due to the time trend of globalization, both unstable parts and small-scale economies exhibit temporal simultaneity.
At the same time, due to the influence of the time trend, we began to conduct TRC analysis on the evolution network starting from a specific year. Using the economy’s , total supply (), degree , and trade volume as richness, we found that the rich club composed of had the strongest static correlation and temporal stability, followed by , , and . It indicates that having a high supply in the N-nutrient system does not necessarily help an economy become the core of the N-nutrient trade network or form a stable trade structure. Simply increasing the volume of imports and exports cannot maintain stable long-term trade. The most effective way to enter the core of the trade network is to build more upstream and downstream trading partners to establish reputation and influence. By adjusting the starting point of the evolution network, we found that the association structure between highly connected nodes becomes tighter and more stable as time goes on. It shows that oligopoly alliance maintain an expanding trend to maintain the status of the core hub of the growing system. The general policy implication is that for an economy, increasing its participation in the trade network, even if it is only importing and processing for export, is beneficial for the ticket of the rich club.
When analyzing the formation mechanism of the TRC, we proposed two mechanisms in the mathematical evolution model. The first is that nodes with high export degrees tend to export to nodes with high import degrees, while the second is that the longer the trade lasts, the more stable it is. The former is a supply-demand and reputation attraction, characterized as the preferential attachment in complex networks and a kind of trade gravity in economics. The latter is similar to path dependence and can be explained by communication costs, comparative advantages, and scale effects. We confirmed through the model that only when these two mechanisms exist simultaneously will a TRC similar to the actual system appear in the theoretical model’s evolution. Therefore, it can be explained why the TRC phenomenon appears in the N-nutrient trade network. As long as these two mechanisms coexist, a TRC phenomenon will inevitably occur under long-term evolution to form an oligopoly alliance controlling the entire system.
The incorporation of the TRC into the global nitrogen (N) nutrient trade network offers a novel perspective to investigate the system’s evolution and elucidate the significance of stable interactions among increasingly interconnected nodes. Our research identified and analyzed the existing TRC in the N-nutrient trade network, revealing the intrinsic mechanisms driving the system through comparative analysis of different richness and mechanistic modeling. It provides a mathematical explanation for the emergence of an oligopoly monopoly. Our findings can provide insights for relevant economic research and assist in modeling international trade networks or related fields in the realm of complex networks.
References
- Foley et al. [2011] J. A. Foley, N. Ramankutty, K. A. Brauman, E. S. Cassidy, J. S. Gerber, M. Johnston, N. D. Mueller, C. O’Connell, D. K. Ray, P. C. West, C. Balzer, E. M. Bennett, S. R. Carpenter, J. Hill, C. Monfreda, S. Polasky, J. Rockstrom, J. Sheehan, S. Siebert, D. Tilman, and D. P. M. Zaks, Nature 478, 337 (2011).
- Ludemann et al. [2022] C. I. Ludemann, A. Gruere, P. Heffer, and A. Dobermann, Sci. Data 9, 501 (2022).
- Galloway et al. [2008] J. N. Galloway, A. R. Townsend, J. W. Erisman, M. Bekunda, Z. Cai, J. R. Freney, L. A. Martinelli, S. P. Seitzinger, and M. A. Sutton, Science 320, 889 (2008).
- Canfield et al. [2010] D. E. Canfield, A. N. Glazer, and P. G. Falkowski, Science 330, 192 (2010).
- Zhang et al. [2015] X. Zhang, E. A. Davidson, D. L. Mauzerall, T. D. Searchinger, P. Dumas, and Y. Shen, Nature 528, 51 (2015).
- Hernandez and Torero [2013] M. A. Hernandez and M. Torero, Agric. Econ. 44, 723 (2013).
- Cordell et al. [2009] D. Cordell, J.-O. Drangert, and S. White, Glob. Environ. Change-Human Policy Dimens. 19, 292 (2009).
- Colizza et al. [2006] V. Colizza, A. Flammini, M. Serrano, and A. Vespignani, Nat. Phys. 2, 110 (2006).
- Dorogovtsev et al. [2006] S. Dorogovtsev, A. Goltsev, and J. Mendes, Phys. Rev. Lett. 96, 040601 (2006).
- Pedreschi et al. [2022] N. Pedreschi, D. Battaglia, and A. Barrat, Nat. Phys. 18, 931 (2022).
- Holme and Saramäki [2012] P. Holme and J. Saramäki, Phys. Rep. 519, 97 (2012).
- Zhou and Mondragon [2004] S. Zhou and R. Mondragon, IEEE Commun. Lett. 8, 180 (2004).
- Wei et al. [2018] Y. Wei, W. Song, C. Xiu, and Z. Zhao, Appl. Geogr. 96, 77 (2018).
- Kim and Min [2020] D.-J. Kim and B.-K. Min, Comp. Struct. Biotechnol. J. 18, 1761 (2020).
- Bullmore and Sporns [2012] E. T. Bullmore and O. Sporns, Nat. Rev. Neurosci. 13, 336 (2012).
- Hu and Zhu [2009] Y. Hu and D. Zhu, Physica A 388, 2061 (2009).
- Leo et al. [2016] Y. Leo, E. Fleury, J. Ignacio Alvarez-Hamelin, C. Sarraute, and M. Karsai, J. R. Soc. Interface 13, 20160598 (2016).
- Tang et al. [2020] C. Tang, X. Dong, Y. Lian, and D. Tang, Futur. Gener. Comp. Syst. 105, 492 (2020).
- Chinazzi et al. [2013] M. Chinazzi, G. Fagiolo, J. A. Reyes, and S. Schiavo, J. Econ. Dyn. Control 37, 1692 (2013).
- Xu et al. [2010] X.-K. Xu, J. Zhang, and M. Small, Phys. Rev. E 82, 046117 (2010).
- Serrano [2008] M. A. Serrano, Phys. Rev. E 78, 026101 (2008).
- Opsahl et al. [2008] T. Opsahl, V. Colizza, P. Panzarasa, and J. J. Ramasco, Phys. Rev. Lett. 101, 168702 (2008).
- Smilkov and Kocarev [2010] D. Smilkov and L. Kocarev, Physica A 389, 2290 (2010).
- Li et al. [2017] A. Li, S. P. Cornelius, Y. Y. Liu, L. Wang, and A. L. Barabasi, Science 358, 1042 (2017).
- Kogut and Zander [1992] B. Kogut and U. Zander, Org. Sci. 3, 301 (1992).
- Teece et al. [1997] D. J. Teece, G. Pisano, and A. Shuen, Str. Manage. J. 18, 509 (1997).
- Baldwin and Robert-Nicoud [2014] R. Baldwin and F. Robert-Nicoud, J. Int. Econ. 92, 51 (2014).
- Helpman and Krugman [1987] E. Helpman and P. Krugman, Market structure and foreign trade: Increasing returns, imperfect competition, and the international economy (MIT press, 1987).
- McCallum [1995] J. McCallum, Am. Econ. Rev. 85, 615 (1995).
- Anderson and van Wincoop [2003] J. Anderson and E. van Wincoop, Am. Econ. Rev. 93, 170 (2003).
- Helpman et al. [2008] E. Helpman, M. Melitz, and Y. Rubinstein, Q. J. Econ. 123, 441 (2008).
- Hertel [1997] T. W. Hertel, Global trade analysis: Modeling and applications (Cambridge University Press, Cambridge, 1997).
- Anderson et al. [2011] K. Anderson, J. Cockburn, and W. Martin, World Econ. 34, 487 (2011).
- Fu et al. [2021] Y. Fu, G. Huang, L. Liu, and M. Zhai, Sci. Total Environ. 759, 143512 (2021).
- Hertel et al. [2007] T. Hertel, D. Hummels, M. Ivanic, and R. Keeney, Econ. Model. 24, 611 (2007).
- Chaney [2014] T. Chaney, Am. Econ. Rev. 104, 3600 (2014).
- Jun et al. [2020] B. Jun, A. Alshamsi, J. Gao, and C. A. Hidalgo, J. Evol. Econ. 30, 247 (2020).
- Feenstra et al. [2005] R. C. Feenstra, R. E. Lipsey, H. Deng, A. C. Ma, and H. Mo (2005), NBER Working Paper.
- Gauvin et al. [2022] L. Gauvin, M. Genois, M. Karsai, M. Kivelae, T. Takaguchi, E. Valdano, and C. L. Vestergaard, SIAM Rev. 64, 763 (2022).
- Jiang and Zhou [2008] Z.-Q. Jiang and W.-X. Zhou, New J. Phys. 10, 043002 (2008).
- Barabási and Albert [1999] A.-L. Barabási and R. Albert, Science 286, 509 (1999).
- Barabasi et al. [2002] A. Barabasi, H. Jeong, Z. Neda, E. Ravasz, A. Schubert, and T. Vicsek, Physica A 311, 590 (2002).
- Palla et al. [2007] G. Palla, A.-L. Barabási, and T. Vicsek, Nature 446, 664 (2007).