Machine learning modeling of the atomic structure and physical properties of alkali and alkaline-earth aluminosilicate glasses and melts
Abstract
The first version of the machine learning greybox model i-Melt was trained to predict latent and observed properties of K2O-Na2O-Al2O3-SiO2 melts and glasses. Here, we extend the model compositional range, which now allows accurate predictions of properties for glass-forming melts in the CaO-MgO-K2O-Na2O-Al2O3-SiO2 system, including melt viscosity (accuracy equal or better than 0.4 log10 Pas in the 10-1-1015 log10 Pas range), configurational entropy at glass transition ( 1 J mol-1 K-1), liquidus ( 60 K) and glass transition ( 16 K) temperatures, heat capacity ( 3 %) as well as glass density ( 0.02 g cm-3), optical refractive index ( 0.006), Abbe number ( 4), elastic modulus ( 6 GPa), coefficient of thermal expansion ( 1.1 10-6 K-1) and Raman spectra ( 25 %). Uncertainties on predictions also are now provided. The model offers new possibilities to explore how melt/glass properties change with composition and atomic structure.
Keywords glass melt machine learning properties viscosity density aluminosilicates
1 Introduction
Aluminosilicate melts that contain alkali and calc-alkaline metal cations serve as the base composition in the glass-making industry and also constitute the liquid fraction of most of the Earth’s magmas. The viscosity of these melts is critical as it determines their resistance to movement at high temperatures, thereby influencing their mobility. This property heavily impacts the fragmentation of magmas in volcanic edifices (e.g., see reviews of [1, 2]), and working temperatures in industrial glass-making furnaces. Other properties of melts and glasses, such as density or optical refractive index, may also be of significant interest because they can influence not only the mobility of the melt, for example through buoyancy effects, but also the weight and optical properties of glass objects. The prediction of such physical properties is, therefore, essential in addressing problems ranging from the dynamics of volcanic eruptions to the development of novel glass materials.
Viscosity predictions can be made using empirical [3, 4, 5, 6, 7, 8] or thermodynamic models [9, 10, 11]. These models offer direct and convenient estimations of viscosity for specific compositional systems, rendering them highly specialized. Besides, empirical models rely on predetermined functions, while thermodynamic models depend on our limited understanding of the thermodynamics of silicate melts. As a result, no universal viscosity model has been developed to predict viscosity for a wide range of temperatures and compositions in the field of glass-making and volcanic silicate melts. Alternatively, molecular dynamics (MD) simulations provide an alternative approach to overcome these limitations, offering valuable property predictions for glasses and melts [e.g., 12, 13, 14, 15, 16, 17, 18, 19]. These simulations are particularly useful as they can provide data for conditions that are challenging to replicate in experiments, such as pressures relevant to planetary magma oceans [e.g., 19] or for "exotic" compositions like pure MgO [20]. However, MD predictions are typically limited to relatively high temperatures due to computational costs. Consequently, it remains extremely challenging to systematically study melt properties across a wide temperature range, spanning from supercooled to superliquidus temperatures, for hundreds or even thousands of compositions at the present time."
To circumvent such limitations, a new set of models relying on machine learning have been proposed: greybox models. Those combine physical/thermodynamic equations with machine learning to predict melt/glass property, with good success to date [21, 22, 23, 24]. Among published greybox models, i-Melt [24, 25] is a multitask model that predicts not only melt viscosity through five different equations but also glass density, optical refractive index and Raman spectrum. It further provides access to latent properties such as melt fragility or configurational entropy at the glass transition. i-Melt thus allows the systematic exploration of the links between composition, structure (through Raman spectra predictions), and properties of melts and glasses. The downside of this model is that it currently is limited to the glass-forming domain of the Na2O-K2O-Al2O3-SiO2 quaternary system.
In this study, we present a new version of i-Melt that now includes CaO and MgO. i-Melt was trained on melt and glass compositions in the Na2O-K2O-MgO-CaO-Al2O3-SiO2 system, for which a fairly complete, albeit sparse, experimental dataset is available. In addition to the properties initially predicted by the first version of the model, it also now predicts melt liquidus temperatures and heat capacities, as well as glass coefficients of thermal expansion, elastic modulus, and Abbe numbers. In this communication, we present the new dataset, the improvements and the performance of the updated i-Melt model, and we discuss its possibilities and limits.
2 Methods
2.1 Datasets and data preparation
The original database of i-Melt was completed by collecting existing Raman spectra, optical refractive index, density, Abbe number, elastic modulus, coefficient of thermal expansion (CTE) of glasses and liquid heat capacity, viscosity and liquidus temperature of melts in the Na2O-K2O-MgO-CaO-Al2O3-SiO2 system. The data were selected via a review of the existing literature as well as of the SciGlass database, available at https://github.com/epam/SciGlass. Melt viscosity, and glass density, Raman spectra and optical refractive index were selected by hand following a review of the literature. Abbe number, elastic modulus, CTE and liquidus temperature data in the Na2O-K2O-MgO-CaO-Al2O3-SiO2 system were extracted from the SciGlass database thanks to the GlassPy python package (version 0.3, [26]). The data used to train the model as well as the associated references are provided in the database available in the Github software repository that hosts i-Melt and its online calculator (https://github.com/charlesll/i-Melt), as well as on Zenodo [27].
The different streams of data are:
-
•
Dviscosity (n = 790 compositions), the dataset of viscosity measurements, composed of Xviscosity chemical composition entries (mole fractions) as well as their associated temperatures (Kelvin) and yviscosity observations (log10 Pa·s);
-
•
Ddensity (n = 668 compositions), the dataset of glass density measurements, composed of Xdensity chemical composition entries (mole fractions) and ydensity observations (g cm-3);
-
•
DRaman (n = 252 compositions), the dataset of glass Raman spectra, composed of XRaman chemical composition entries (mole fractions) and yRaman spectra observations (normalised Raman intensities);
-
•
Doptical (n = 610 compositions), the dataset of glass optical refractive index, composed of Xoptical chemical composition entries (mole fractions) as well as their associated wavelength (m) and yrefractive index observations;
-
•
DCpl (n = 95 compositions), the dataset of liquid heat capacities , composed of XCpl chemical composition entries (mole fractions) as well as their associated temperatures (Kelvin) and yCpl observations (J mol-1 K-1);
-
•
DAbbe (n = 296 compositions), the dataset of glass Abbe Number, composed of XAbbe chemical composition entries (mole fractions) as well as their associated Abbe Numbers (no unit);
-
•
Delastic (n = 1006 compositions), the dataset of glass elastic modulus, composed of Xelastic chemical composition entries (mole fractions) as well as their associated elastic modulus (GPa);
-
•
DCTE (n = 2122 compositions), the dataset of glass coefficients of thermal expansion, composed of XCTE chemical composition entries (mole fractions) as well as their associated coefficients of thermal expansion (K-1);
-
•
Dliquidus (n = 4505 compositions), the dataset of liquidus temperatures, composed of Xliquidus chemical composition entries (mole fractions) as well as their associated liquidus temperatures (K).
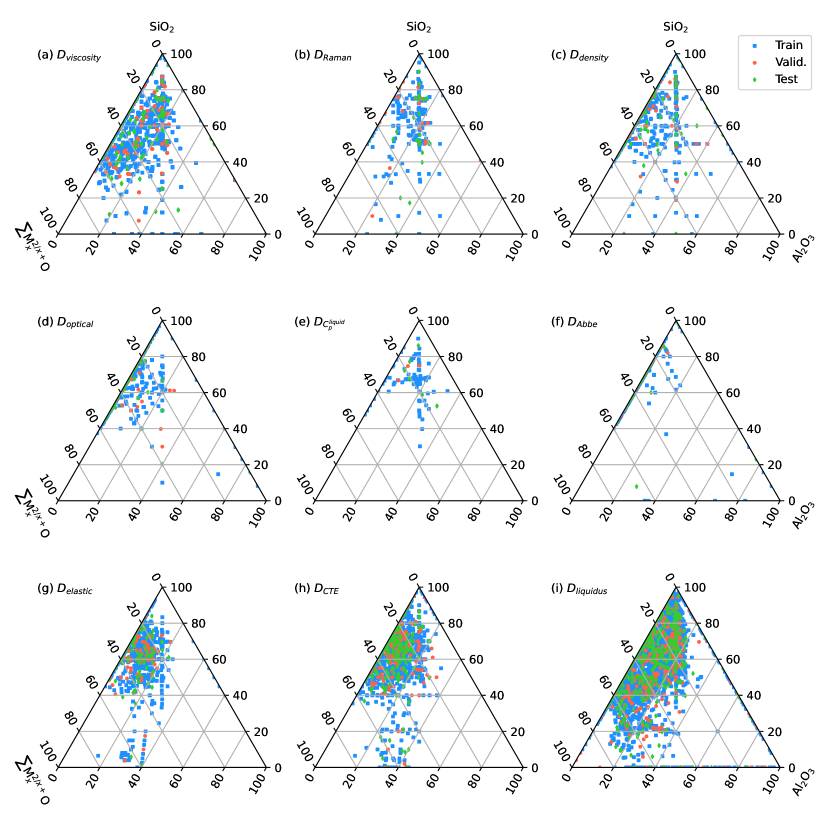
The size of the Dviscosity , Ddensity, Doptical , DCTE, Delastic and Dliquidus datasets allow training i-Melt with a “high performance” mindset, because those datasets cover an important part of the glass-forming domain of alkali and alkaline-earth aluminosilicates (Fig. 1). The liquid heat capacity dataset DCpl is small (Fig. 1e), but actually this is not a problem because good fits of viscosity data with the Adam-Gibbs theory already require the prediction of consistent liquid heat capacities (see Results section). However, having a DCpl dataset, even small, allowed fine-tuning the model and ensuring that predictions are consistent with existing data. DAbbe also is fairly limited (Fig. 1f), so non-negligible errors on Abbe number predictions may be expected. Regarding DRaman, it also covers a limited set of compositions (Fig. 1b ) and we also do not expect a very high precision on Raman spectra predictions. Raman data were actually used as a way of improving learning through a multitask approach [28], because they encode structural information that could assist the network in learning physical properties, embedding a shared representation of the composition-structure-property links in melts and glasses. This actually is one important basis underlying the i-Melt model: the use of datasets of different glass/melt properties should allow leveraging their different compositional coverage to ensure better predictive performance of the model overall.
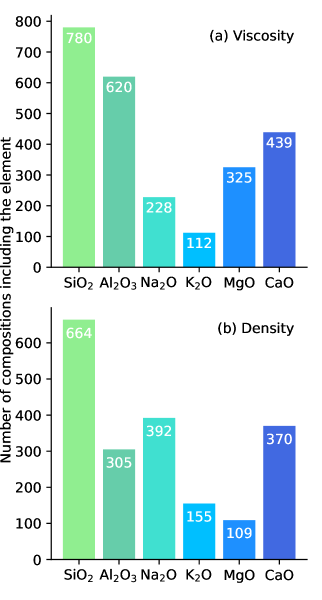
Following [24] and prior to training i-Melt, the datasets were split by composition into three different, randomly chosen training, validation and testing subsets. While the training subsets are used for training the model (i.e. tuning its internal parameters), the validation subsets are used for monitoring overfit and triggering early stopping when the latter occurs [29]. The final predictive abilities of the trained neural networks are evaluated using the testing data subsets. For performing the splits, we used a stratified group splitting approach. This approach was implemented because (i) we need to split the datasets by compositions to avoid data leakage [30], and (ii) we have imbalanced datasets. While the former point was taken into account in the original version of the model [24], the latter was not and becomes particularly important now. For instance, we have significantly less compositions including Na2O and K2O than other elements in the viscosity dataset, while the density dataset includes less MgO-bearing compositions (Fig. 2). A train-valid-test split by composition will work, but may not retain the proportions of each kind of composition (e.g. sodium silicate, magnesium aluminosilicate, etc.) in the different train-valid-test splits. To solve this problem, we assigned to each type of compositions a class (e.g., for sodium silicate class 1, for sodium aluminosilicates class 2, etc.), and used a stratified splitting approach that aims at retaining, as much as possible, the proportions of each class in the different train-valid-test data subsets. In practice, this approach is implemented via a hack of the StratifiedGroupKFold function of the scikit-learn library version 1.1.2 [31]. After data splitting, we systematically checked that there was no sign of data leakage (compositions in the train, valid and test subsets show differences larger than 0.1 mol%), and we visually checked that the coverage of the different splits was reasonable (Fig. 1). Train-valid-test splits were performed with 0.8/0.1/0.1 ratios for all datasets. Scaling of the datasets was done as described in [24]. After pre-processing, the different data subsets were saved in Hierarchical Data Format HDF5 files for their future use.
2.2 Machine learning model
The model i-Melt, implemented in the Python programming language using the Pytorch machine learning library [32], was presented in detail in [24]. We refer the reader to this publication for an extensive presentation of the model. Here, we briefly present the model and its general architecture, and focus on describing improvements and new features.
i-Melt combines an artificial neural network with various dynamic and thermodynamic equations to predict latent and observed melt/glass properties. The model takes six inputs: the mole fractions of SiO2, Al2O3, Na2O, K2O, MgO and CaO. From these, new chemical descriptors are now calculated, such as the glass optical basicity and NBO/T, the Al/M ratio (with M the sum of metal cations), and the ratio of each element to another. A total of 39 descriptors, including initial melt composition, are fed into a neural network composed of n hidden layers, each one having k activation units (a.k.a. neurons). The outputs of the hidden layers are fed into two different linear layers for outputs: the first one returns vectors that are Raman spectra, and the second one returns 34 different values:
- •
-
•
the partial molar volumes of each oxide components, for density calculations;
-
•
the partial liquid heat capacity of each oxide component as well as two temperature-dependent terms for Al2O3 and K2O (following [40]) for calculations;
-
•
the coefficients of the Sellmeier equation for optical refractive index calculation;
-
•
the melt liquidus temperature;
-
•
the glass Abbe number;
-
•
the glass elastic modulus;
-
•
and the coefficient of thermal expansion of the glass.
The artificial neural network allows us, therefore, to input chemical compositions and obtain predictions for:
-
•
melt viscosity, within five distinct theoretical or empirical frameworks,
-
•
melt heat capacity, including partial molar contributions of oxide components,
-
•
liquidus and glass transition temperatures,
-
•
latent variables such as configurational entropy and fragility,
-
•
glass density, including partial molar contributions of each oxide component,
-
•
glass refractive index as a function of wavelength, its Abbe number and elastic modulus,
-
•
and the glass Raman spectra.
The predictions depend on a large number of adjustable parameters integral to the neural network, as well as on the careful adjustment of the neural network hyper-parameters. Adjustment of model parameters (weights and bias of the activation units) was performed via batch training through gradient descent using the ADAM optimizer. The global loss function was calculated from a weighted sum of the root-mean square errors (RMSE) between measurements and predictions for viscosity as well as liquid heat capacity, density, optical refractive index, Raman spectra, liquidus temperature, elastic modulus, CTE, Abbe number and known glass configurational entropy values. The weights assigned to the different tasks in the global loss function were learned during the optimization process, following the method proposed by [41]. Back-propagation was performed using the automatic differentiation methods implemented in Pytorch [32].
Good predictive performance of the model can only be achieved upon finding optimal sets of model hyperparameters, including the optimizer learning rate, and the number of layers, the number of units per layer, and the type of activation functions in the artificial neural network. Regarding the activation functions, the initial version of i-Melt relied on Rectifier linear units (a.k.a. ReLU), but new tests showed that Gaussian error linear units (a.k.a. GELU, see [42]) yield better generalization performance (less overfitting and better estimates on unseen samples). Therefore, the new version of i-Melt uses GELU units. To further prevent overfitting and help model generalization, we also rely on early stopping [29] and dropout [43]. The dropout rate, the optimizer learning rate, the number of layers and that of activation units per layer in the artificial neural network were tuned using the hyperparameter optimization framework Ray Tune [44], which allows distributed model selection and training. In practice, we used the Optuna algorithm [45] that relied on monitoring the global loss on the validation datasets to guide the selection of the most promising models.
This approach allows obtaining a sample of trained models from which we can select the best ones. Typically, the architecture of the best models is slightly deep, with 3 to 4 layers, each containing 350 to 500 activation units. The use of GELU units allowed obtaining good model predictions with dropout rates of ~0.3. Best ADAM learning rates were generally in the - range. For final predictions, we average predictions of an ensemble of the 10 best models. As the dropout rates in the new model are generally high, uncertainties on model predictions can be estimated using the MC Dropout method [46]: for a given input, we leave the dropout active and ask for, e.g., 100 different samples for each one of the 10 neural networks. We thus obtain for each input a subset of 1000 predictions, each prediction being slightly different from the others because coming from a different neural network, or from a different part of a given neural network. From this subset, we can provide median values and confidence intervals, approximating a Bayesian sampling of the model posterior probability function [46].
3 Results
3.1 Predictive performance evaluation
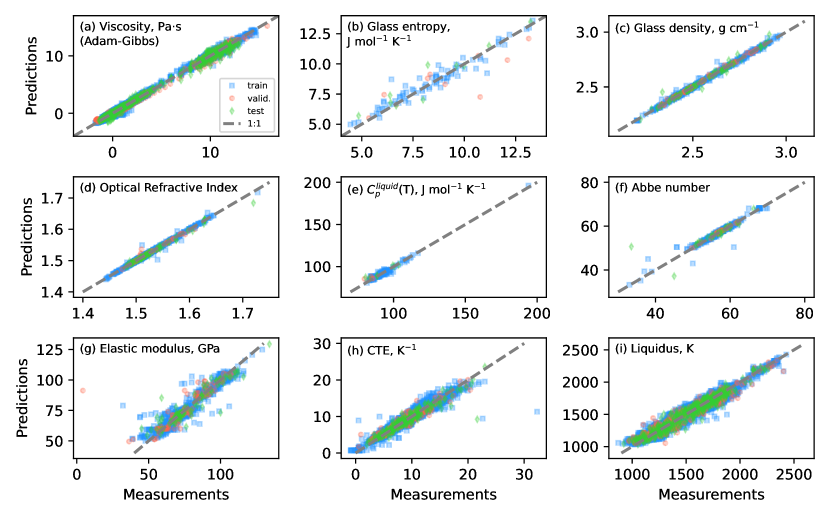
Over the very broad range of compositions we investigate (Fig. 1), viscosity of melts are predicted with a good precision (Fig. 3a). Regardless of the chosen theory, the root mean squared error (RMSE) values are lower than or equal to 0.4 log10 Pa·s on the testing data subset (Table 1). All the median absolute error (MAE) values, a metric more robust to outliers than RMSE, are equal to ~0.1 log10 Pa·s. In details, predictions in the supercooled temperature domain are affected by larger errors than predictions in the sub-liquidus to super-liquidus domain: testing RMSE values (all equations considered) are in the range 0.4-0.5 log10 Pa·s when considering only data in the 107-1015 Pa·s range, whereas they are in the range 0.2-0.3 log10 Pa·s for data below 107 Pa·s (Table 1). No significant differences are observed when comparing the predictive errors of the different equations and theories (Table 1).
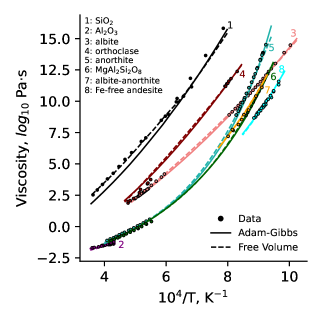
In figure 4, we further show viscosity predictions for specific compositions of interest for geology and industry, for which highly accurate viscosity data are available. For a given composition, model predictions compare very well with experimental data, regardless of melt compositional complexity. Indeed, the model predicts very well the viscosity of simple melts such as silica or alumina, but also of melts in the ternary and quaternary alkali and/or alkaline-earth aluminosilicate systems such as albite, orthoclase, anorthite or its magnesian equivalent. The viscosity of melts with compositions containing all oxides is also well predicted, as shown for example in figure 4 for a melt with an analogue Fe-free andesitic geologic composition.
Overall, the present model uncertainties on viscosity are comparable with, or lower than those of the previous version of i-Melt for alkali aluminosilicate melts (~0.4 log10 Pa·s) . They also are lower than those affecting existing thermodynamic models for quaternary alkali aluminosilicate melts [11, 47], or than those affecting empirical models such as that of Russell and Giordano [48] for albite-anorthite-diopside melts. The model RMSE on viscosity is lower than that of the more generalistic ViscNet machine learning model of melt viscosity [1.1 on its testing dataset, see 49]. The accuracy on viscosity predictions of the model actually approaches, despite a much broader compositional dataset, that of the thermodynamic model of the viscosity of alkali silicate melts of Le Losq and Neuville [10] (~0.2 log10 Pa·s).
| Data subset | Metric | Training | Validation | Testing |
| Viscosity, log10 Pa·s (Adam-Gibbs theory) | RMSE | 0.2 | 0.3 | 0.4 |
| MAE | 0.1 | 0.1 | 0.1 | |
| Viscosity, log10 Pa·s (Free Volume theory) | RMSE | 0.2 | 0.2 | 0.3 |
| MAE | 0.1 | 0.1 | 0.1 | |
| Viscosity, log10 Pa·s (Vogel-Tamman-Fulcher equation) | RMSE | 0.2 | 0.3 | 0.3 |
| MAE | 0.1 | 0.1 | 0.1 | |
| Viscosity, log10 Pa·s (MYEGA equation) | RMSE | 0.2 | 0.3 | 0.3 |
| MAE | 0.1 | 0.1 | 0.1 | |
| Viscosity, log10 Pa·s (Avramov-Milchev theory) | RMSE | 0.2 | 0.3 | 0.3 |
| MAE | 0.1 | 0.1 | 0.1 | |
| Density, g cm-3 | RMSE | 0.01 | 0.01 | 0.02 |
| MAE | 0.004 | 0.006 | 0.006 | |
| Raman spectra (%, Median Absolute Percentage Error) | MAPE | 17 | 17 | 25 |
| Refractive index | RMSE | 0.003 | 0.005 | 0.006 |
| MAE | 0.0009 | 0.0009 | 0.0013 | |
| CTE, 10-6 K-1 | RMSE | 1.0 | 0.9 | 1.1 |
| MAE | 0.4 | 0.5 | 0.5 | |
| Elastic Modulus, GPa | RMSE | 4 | 8 | 6 |
| MAE | 2 | 2 | 2 | |
| Abbe number | RMSE | 1.1 | 0.4 | 3.7 |
| MAE | 0.3 | 0.2 | 0.5 | |
| Liquidus temperature, K | RMSE | 61 | 66 | 60 |
| MAE | 38 | 39 | 39 | |
| Glass transition temperature (at 1012 Pa·s), K | RMSE | 13 | 16 | 12 |
| MAE | 5 | 6 | 9 | |
| Heat capacity, J mol-1 K-1 | RMSE | 2 | 3 | 3 |
| MAE | 1 | 3 | 1 | |
| Glass entropy, J mol-1 K-1 | RMSE | 0.5 | 1.4 | 0.8 |
| MAE | 0.3 | 0.8 | 0.3 |
Other melt/glass properties are also well predicted by i-Melt (Fig. 3 and Table 1). In general, training and validation error metrics are very similar, indicating that the model does not overfit. Known viscous glass transition temperatures and configurational entropy at , , are predicted within 16 K and 1 J mol-1 K-1, respectively. For , such an accuracy is better than that achieved by the first version of i-Melt (19 K), while for it is comparable. Melt liquidus temperatures are predicted to within ~60 K, an uncertainty that approaches those of dedicated polynomial and machine learning models [e.g., 50]. The melt heat capacities are predicted within ~3%, a precision better than that of 5% achieved when using the model of Richet and Bottinga [40] corrected with the Al2O3 partial value of Courtial and Richet [51], following Giordano and Russell [52]. Glass density and refractive index are predicted to within 0.02 g cm-3 and 0.006, respectively. Such values are comparable to, or better than those for the original i-Melt version for alkali aluminosilicate compositions [24]. For glass density, the model standard error further compares very well with those of dedicated parametric [e.g., 0.02 in 53] or machine learning [e.g., 0.02 to 0.03 in 54] models. Glass elastic modulus is predicted to within 6 GPa, an accuracy that approaches those achieved by topological models [e.g., 55] but is higher than that of dedicated machine learning models [e.g., 3 GPa in 54].
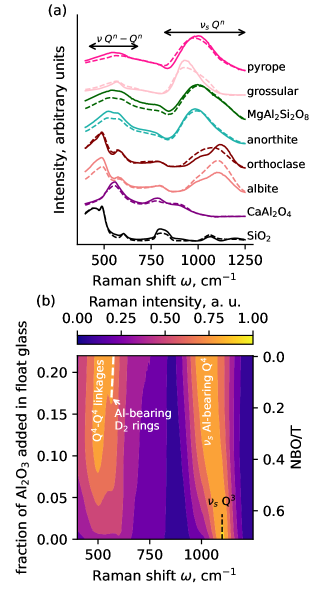
Global variations in glass Raman signals are well-captured despite the very small experimental Raman dataset (Fig. 1b): the median absolute percentage errors (MAPEs) on the training and validation subsets are both equal to ~16 %. The MAPE on the testing data subset is of 25 %. Such errors are comparable to those affecting the original version of i-Melt. Figure 5a shows examples of Raman spectra predictions for specific compositions, including silica, calcium aluminate, Ca-Mg silicates and aluminosilicates. The general shape of the spectra is well reproduced by the model. This indicates that the model captured well general relationships between glass Raman spectra and their composition. In detail, there remains visible deviations between predictions and observations, particularly for small features in the spectra such as small shoulders and peaks. To get better Raman spectra predictions, the model could benefit from a broader training dataset, as this actually is one of the smallest training dataset.
While the model shows small deviations from experimental Raman data, it still enables a detailed and systematic exploration of variations in Raman spectra as a function of glass composition. We demonstrate this capability by mapping the changes in Raman intensity upon the addition of Al2O3 into a typical float glass composition (Fig. 5b). At null or very low Al2O3 concentrations, a strong Raman signal intensity near 1100 cm-1 is observed, which can be assigned to Si-O stretching in units [56, 57, 58, 59, 60]. This suggests a dominant presence of units in the soda-lime silicate glass, This agrees with experimental Raman data [61] and molecular dynamic simulations [62], which both indicate a high fraction of units and lower fractions of and units in soda-lime silicate glasses.
Upon the addition of Al2O3 in the float glass composition, the average number of non-bridging oxygens per tetrahedral units (NBO/T) calculated from composition decreases. A significant increase in intensity near 475 cm-1 is observed (Fig. 5b), indicating the formation of more and more - bridges as the NBO/T approaches 0 (tectosilicate composition) [57, 63]. Simultaneously, the Raman signal in the 800-1300 cm-1 range undergoes a shift to approximately 1030 cm-1 while diminishing in intensity. This particular signal at 1030 cm-1 corresponds to the stretching of T-O (T = Si, Al) bonds within units containing both silicon and aluminum. In pure silica, this vibrational mode of units is typically observed at around 1200 cm-1, but here the presence of aluminum in units causes a decrease in its frequency [64, 65].
The model predictions also accurately reproduce structural details of Al-rich glasses. Above a fraction of approximately 0.18 Al2O3, a signal near 560 cm-1 emerges, corresponding to breathing vibrations of three-membered tetrahedral rings ( peak) in polymerized aluminosilicate glasses [63, 66, 67, 68]. Typically, this vibrational mode yields a signal near 606 cm-1 in silica [69, 66, 70, 71, 72, 73]. The model’s prediction of this signal in the SiO2 spectrum aligns well with experimental observations (Fig. 5a), along with the signal near 490 cm-1 assigned to breathing vibrations of four-membered rings [74, 69, 75, 76, 70, 71, 72, 73]. The addition of Al into the glass structure leads to a decrease in the frequency of the signal as Al replaces Si in the three-membered rings [63, 66]. This explains the observed signal frequency in the Al-rich soda-lime silicate glass (Fig. 5b).
Overall, this example illustrates that the model Raman predictions document the gradual change in glass structure as glass composition is modified. They also allow for the observation of specific signals, such as those assigned to vibrations in n-membered rings in polymerized glasses. These findings can be combined with property predictions to gain a better understanding of how chemical and structural changes influence the properties of melts and glasses.
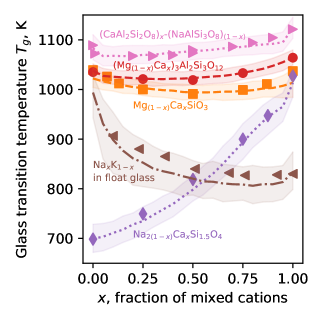
The versatility of i-Melt in capturing both global and specific variations of properties extends well beyond Raman spectra. Indeed, while the different metrics all demonstrate accurate predictions of overall melt and glass properties (Table 1), the model also successfully reproduces specific variations in transport and thermodynamic properties, such as the mixed modifier effect (MME). The latter is characterized by extrema in melt/glass properties, such as glass transition temperature or electrical conductivity, when different metal cations are mixed [e.g., see the reviews of 77, 78, 79]. In details, the MME exhibits some subtleties and is not necessarily easy to reproduce accross a broad range of compositions. For instance, mixing Na and K in silicate compositions results in a pronounced MME on and viscosity [80, 34], whereas mixing these cations in aluminum-rich melt series does not induce a significant MME [67, 68]. The MME on viscosity is not observed when mixing Na and Ca in silicate melts [81], but it is observed in feldspatic albite-anorthite aluminosilicate melts [82]. The earlier version of i-Melt already successfully captured such subtleties for Na-K aluminosilicate compositions [24], confirming that the introduction of aluminum leads to a change in the Na-K mixing behavior. In figure 6, we present the glass transition temperature () for different data series involving mixing of Ca-Mg, Ca-Na, and Na-K metal cations in silicate and more complex aluminosilicate compositions, including float glass. The model predictions closely match the data, all falling within the 95% predictive confidence intervals. The model accurately predicts the mixing effect of Ca and Mg on in silicate and aluminosilicate compositions, as well as the Na-K mixing effect in float glass. Additionally, the variations of upon mixing Na and Ca in silicate glasses or along the anorthite-albite binary are also well reproduced. i-Melt effectively captures the detailed variations of melt properties resulting from metal cation mixing. These capabilities prove valuable in exploring how phenomena like the MME systematically change with variations in melt/glass composition. The ability of i-Melt to successfully predict Raman spectra further provides structural insights for such analyses.
3.2 Model internal consistency
Among predicted parameters, i-Melt returns the melt fragility m, which corresponds to the derivative of melt viscosity against temperature at . Melt fragility is related to structural and thermodynamic melt properties, and allows distinguishing “strong” melts from “fragile” ones that show a strongly non-Arrhenian dependence of their viscosity against temperature [86]. In particular, melt fragility is expected to correlate with melt thermodynamic properties [87]. This can be explored within the framework of the Adam-Gibbs theory [33], which relates melt dynamic and thermodynamic properties through the equation [34]:
| (1) |
with T (K) the temperature, Ae (Pa·s) a high-temperature limit, Be (J mol-1) a term proportional to the energy barriers opposed to molecular rearrangements, and (J mol-1 K-1) and (J mol-1 K-1) the melt configurational entropy and heat capacity, respectively. is equal to [34]:
| (2) |
with the glass heat capacity at Tg and the liquid heat capacity at T. In the model, is well predicted via the Dulong and Petit limit (see discussion in [88]). is predicted from the ponderated sum of neural network predicted partial molar heat capacities of the oxide components, and neural network predicted temperature terms for Al2O3 and K2O (see for a discussion regarding those terms [40, 51]).
Following the relationship between melt viscosity and thermodynamic properties (eq. 1), melt fragility should be proportional to the ratio of the configurational heat capacity at over the configurational entropy at Tg, Cpconf(Tg)/Sconf(Tg), as [87]:
| (3) |
The correlation expected from eq. 3 has been experimentally observed for melts presenting relatively restrained compositional ranges [89, 90]. Therefore, if i-Melt is internally consistent, i.e. if it predicts physically realistic melt fragilities, heat capacities and configurational entropies, we should also observe the correlation expected from eq. 3. This is clearly the case, as observed in Figure 7. We observe a general trend located in between those reported in [89] and [90], the first study concerning sodium and calcium aluminosilicate melts and the second one iron-bearing aluminosilicate melts of geological compositions.
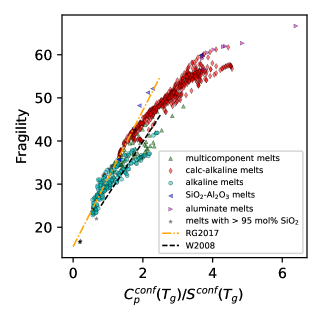
In the past version of i-Melt, focused on predictions in the Na2O-K2O-Al2O3-SiO2 system, the correlation expected from eq. 3 was observed but with a significant scatter (see Figure 6 in [24]). Here, the scatter is much more limited, despite the fact that predictions cover a broader compositional space. A systematic, albeit not fully linear trend between melt fragility and Cpconf(Tg)/Sconf(Tg) is observed (Fig. 7). The improvement in internal consistency is actually due to predicting through the artificial neural network. Indeed, we tried modeling using partial molar liquid heat capacity values for the different oxide components from several studies [e.g., 40, 51, 91, 89]. However, the present predictive range of the model covers a very wide compositional range (Fig. 1), including Na-rich and Mg-rich compositions for which non-linear dependence of partial molar has been reported [51, 91]. Artificial neural network predictions of partial molar for the different oxide components, and their associated temperature dependence for Al2O3 and K2O, allowed largely increasing the consistency of the model, while yielding good predictions of (Figs. 3e, 7 ).
In figure 7, we observe a clear compositional mapping between melt fragility and . Si-rich and alkali-bearing compositions systematically present low fragilities and , while calc-alkaline compositions present higher ones. Ca aluminate compositions present the highest fragilities and (magenta symbols in Fig. 7). The general trend between melt fragility and is almost linear, but deviates from linearity at high fragilities and ratios.
3.3 Uncertainty estimations and model extrapolation
Obtaining uncertainty estimations from machine learning models can be challenging. While several methods exist to address this issue, there is no one-size-fits-all approach for obtaining uncertainty estimations. In the case of artificial neural networks, there are at least three established methods for obtaining uncertainty estimations on model predictions. These include using Bayesian neural networks [92, 93], MC dropout [46] or conformal predictions [see 94, and references therein].
Here, we performed a systematic analysis of the confidence intervals provided using the MC Dropout method, which relies on the use of dropout. The latter consists in randomly turning off activation units of the artificial neural network during training, at each iteration with a probability p. This regularization method is recognized to help generalization in deep learning models. At inference, it is also possible to use dropout to generate multiple, slightly different predictions for a given input. The obtained sample of predictions can then be used to produce an estimate of uncertainties [46].
To assess the reliability of the uncertainties estimated using MC Dropout, we computed the 2.5th and 97.5th percentiles of the predictive distributions for the different test data subsets and compared them to the corresponding observed values (Table 2). Ideally, the calculated confidence intervals should encompass 95 % of the observations in the datasets. For all properties but Raman spectra, Elastic modulus and liquid heat capacity, the 95 % confidence intervals calculated with MC Dropout encompass between 84 and 90 % of the test data. The proportion of data included in the 95% confidence intervals is lower for Raman spectra, Elastic modulus and liquid heat capacity. This indicates that calculated confidence intervals using MC Dropout are generally too narrow. MC Dropout thus provides first-order estimates of confidence intervals, but those may not perfectly cover the true ones, particularly for Raman spectra, Elastic modulus and liquid heat capacity.
| Dataset | MC dropout | Conformal c.i. |
|---|---|---|
| Viscosity | 90 % | 94 % |
| Density | 87 % | 87 % |
| Raman spectra | 70 % | 97 % |
| Refractive index | 90 % | 97 % |
| CTE | 84 % | 97 % |
| Elastic Modulus | 76 % | 94 % |
| Abbe number | 81 % | 78 % |
| Liquidus temperature | 85 % | 96 % |
| Heat capacity | 57 % | 86 % |
Fortunately, for observed properties, it is possible to effectively scale MC Dropout confidence intervals using conformal predictions, following the Time-Test Dropout method proposed by Cortes-Ciriano and Bender [95]. Conformal prediction uses the observed deviations between predictions and observations from a calibration dataset to calculate reliable confidence intervals for new, unseen values. Here, we use the validation data subsets as calibration datasets. We estimate MC dropout confidence intervals on those calibration datasets, and forward them to a conformal regressor model. The latter will make use of the calibration data to effectively scale the confidence intervals provided by the MC dropout method.
Using this method, 95 % of the test data, or more in some cases, now fall within the 95% scaled confidence intervals (Table 2), with the exception of the Abbe number for which MC Dropout uncertainties appear to be best. Therefore, for most properties, the model conformal confidence intervals are reliable, even slightly conservative (i.e. the 95% confidence intervals actually encompass more than 95% of the data). Therefore, for observed properties, scaling the MC Dropout confidence intervals via conformal prediction allows an effective re-scaling of the confidence intervals. Unfortunately, such scaling is not possible for latent properties, for which MC Dropout still allows obtaining a reasonable approximation of their confidence intervals.
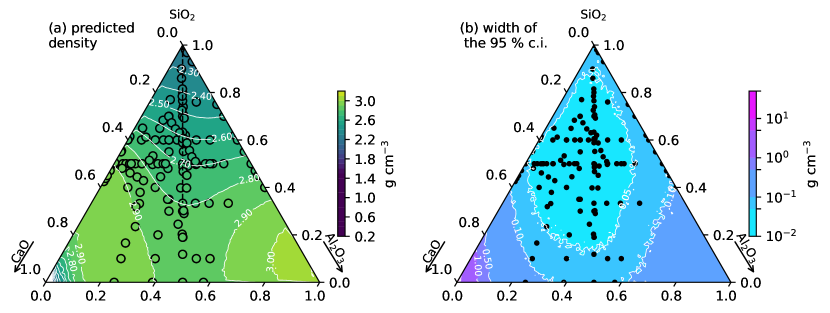
The ability of predicting confidence intervals is important, as of course it allows estimating model uncertainties, but maybe more importantly, it allows detecting model extrapolation. To illustrate this, we show in Figure 8 model predictions of glass density in the CaO-Al2O3-SiO2 ternary system., together with existing data. We observe that the 95 % predictive conformal confidence intervals are lower than 0.05 g cm-3 when the density of data is the highest, near the center of the ternary diagram (Fig. 8b). When the data become scarce, the 95% confidence intervals increase to values in between 0.05 and 0.1 g cm-3, while in regions where no data are present, i.e. at very high CaO or Al2O3 concentrations, the model 95 % predictive conformal confidence intervals quickly become high, with values that can reach more than 1 g cm-3 (Fig. 8b). This indicates that the model is in the extrapolative regime, and that predictions are subject to (very) significant uncertainties. Overall, the present results demonstrate that, in addition to delivering trustworthy interpolative uncertainties, the methodology incorporated into the updated version of i-Melt allows the identification of poor extrapolation performance by a considerable increase in predicted uncertainties.
Finally, the utilization of model predictive confidence intervals can offer valuable insights for designing future experiments, employing a similar approach to Bayesian experimental design [e.g., 96]. Specifically, high model confidence intervals often indicate regions with limited data (Fig. 8b). Therefore, compositional areas characterized by significant uncertainties in predictions are identified as prime candidates for further experimentation, as they hold the potential to refine and enhance the model’s accuracy. Consequently, these areas represent promising avenues for experimental investments. Models such as i-Melt, therefore, serve as valuable tools in maximizing the expected utility of the data obtained from future experiments.
4 Discussion
The inclusion of MgO and CaO in the i-Melt model has been accomplished without compromising its predictive accuracy. In fact, as shown in Table 1, the error metrics for the extended model are comparable to, or even better than those of the original version, which focused only on the Na2O-K2O-Al2O3-SiO2 system and predicted less melt/glass properties. This is attributed to several factors, including a significantly enlarged database, the incorporation of new chemical descriptors as inputs to the artificial neural network, and the use of GELU activation units with a larger dropout rate, enabling moderately deep artificial neural networks to generalize well and produce accurate predictions. Consequently, the updated model enables systematic predictions of properties for melts and glasses in the Na2O-K2O-MgO-CaO-Al2O3-SiO2 system. It covers a broad compositional range that encompasses the entire glass-forming domain of this system and its related sub-systems (Fig. 1). Furthermore, in addition to high predictive performances (Figs. 3, 5), the model provides reliable uncertainty estimates using MC Dropout and conformal predictions (Table 2, Fig. 8).
Future extension of the model may include the addition of new properties and oxide elements. However, it should be noted that the addition of a new oxide element may require significantly more compositions to be added to the database to maintain the achieved level of precision. At the moment, it is difficult to estimate how much data needs to be added to maintain the model precision when adding new elements. Despite this, the fact that the new version of i-Melt is as precise as, or better than the original one that focused on a quaternary system is very encouraging. This suggests that this problem may not be critical. One point will require a particular focus: the addition of Raman spectra. This dataset is currently the smallest, and higher predictive precision may be achieved by adding more Raman spectra. Data on heterogeneous samples, such as Raman maps along diffusion profiles, could largely benefit model predictions, and are very welcomed.
With the new version of i-Melt, it is possible to predict many different latent and observed thermodynamic, physical and structural properties of glasses and melts. This opens up a range of possibilities for studying alkali and calc-alkaline aluminosilicate melts and glasses, such as exploring correlations between structure and properties [see e.g. Figs. 4, 5 and other examples in 24], investigating properties in multicomponent systems (e.g., Fig. 8), and studying cation mixing effects (e.g., Fig. 6). These possibilities were highlighted in [24], and examples are provided in the i-Melt repository online. Here, for the sack of concision, we focus on the noteworthy ability of the new version to predict partial molar volumes and heat capacities of oxide components, which has important implications for understanding the thermodynamics and transport properties of melts and glasses.
Predicted partial molar volumes of oxide components fall close to those reported in previous publications (Table 3), but the model predicts that they depend on composition. A similar comment can be made for partial molar . Such a compositional dependence is not surprising, because it has been reported in several publications for density [e.g., 47, and references therein] and for heat capacity [51, 91].
| Partial molar volume, cm3 mol-1 | , J mol-1 K-1 | |||||
|---|---|---|---|---|---|---|
| Oxide | 2.5th | 50th | 97.5th | Literature values | Average model values | Literature values |
| SiO2 | 24.1 | 25.7 | 27.1 | 26.0-27.5 | 80 2 | 81.37 |
| Al2O3 | 34.5 | 37.8 | 38.4 | 37.0-39.0 | ||
| Na2O | 21.3 | 22.9 | 29.1 | 25.0-29.0 | 99 7 | 100.6 |
| K2O | 34.7 | 36.9 | 50.1 | 40.0-46.0 | ||
| MgO | 8.1 | 13.1 | 16.5 | 11.0-13.0 | 81 8 | 85.78 |
| CaO | 14.0 | 14.9 | 18.7 | 14.0-18.0 | 92 11 | 86.05 |
The model allows understanding of the potential origin of such non-linear dependence on composition. For partial , an explanation may come from changes in the average oxygen coordination number (CN) of the cations. For instance, increasing Al2O3/Mx+2/xO in aluminosilicate glasses induces a change in the role of the metal cation Mx+2/x, from network modifier (breaking Si-O-Si bonds) to charge compensator of Al3+ [100, 101, 102]. In sodium aluminosilicate glasses with 75 mol% SiO2, this correlates with an increase in Na+ CN as the Al2O3/(Na2O+Al2O3) ratio increases, as documented by 23Na Nuclear Magnetic Resonance (NMR) spectroscopy data [101]. A similar conclusion was drawn from calorimetry data on alkali aluminosilicate compositions by [103], who proposed an increase in Na+ CN from 6 to 9 as Al is introduced into the glass network. Therefore, for metal cations such as Na+, we may expect a distribution of partial and values as a function of glass composition, due to changes in the local environment of the cations.
To test this hypothesis, we explore how the partial molar and of Mx+2/x O, Al2O3 and SiO2 vary with the ratio XAl = Al2O3/(Mx+2/xO+Al2O3) in glasses containing 50 mol% SiO2 (Fig. 9). Upon increasing XAl , the partial molar of SiO2 barely varies (Fig. 9a,b,c,d). That of Al2O3 decreases from ~39 cm3 mol-1 down to ~35 cm3 mol-1 when XAl becomes larger than 0.3. Furthermore, Al2O3 appears to be slightly lower in calc-alkaline systems (Fig. 9c,d) than in alkaline ones (Fig. 9a,b) when XAl< ~0.3. The partial of Na2O and K2O both significantly increase by ~3 and ~5 cm3 mol-1 (Fig. 9a,b ), respectively, when XAl becomes higher than 0.3. The partial Vm of MgO does not vary significantly with XAl (Fig. 9c) while that of CaO slightly increases by ~2 cm3mol-1 (Fig. 9d).
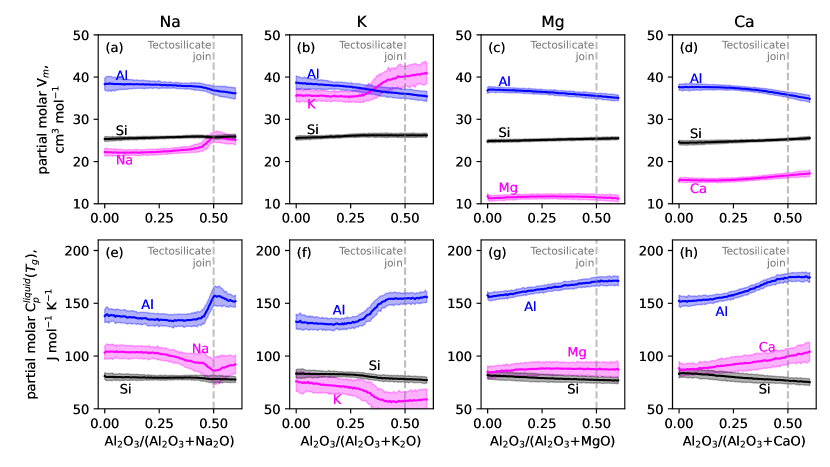
Similar observations can be made for partial values (Fig. 9). Whereas those of SiO2 (Fig. 9e,f,g,h) and MgO (Fig. 9g) barely vary, that of CaO slightly increases by ~15 J mol-1 K-1 as XAl increases (Fig. 9h). The partial values of Na2O and K2O show distinct decreases of ~11 and ~17 J mol-1K-1, respectively, as XAl increases (Fig. 9e,f). Turning to the partial of Al2O3, it increases by 20 to 25 J mol-1 K-1 as XAl increases in alkali melts, with a marked step at XAl ~ 0.4 (Fig. 9e,f). In calcalkaline melts, Al2O3 is significantly higher, and nearly linearly increases with XAl from ~151 J mol-1 K-1 to ~172 J mol-1 K-1.
Based on previous works [103, 104, 101], we hypothesize that the observed changes in alkali systems occur as K+ and Na+ forms compensating complexes with AlO45- tetrahedral units: this results in variations in the CNs of the alkali metal cations that may induce variations in their partial molar volume. For alkaline-earth metal cations, we expect limited variations in their CNs [104, 105, 106], explaining the relatively small variations in their partial . In parallel, the change, or lack of change in the local environments of alkali and alkaline-earth cations also seems related to the variations, or lack of variations of their partial values with XAl.
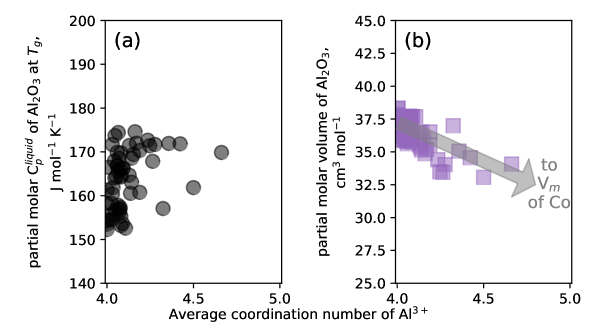
The case of Al2O3 is more complex. First, there is a large dependence of partial Al2O3 to temperature: the higher glass transition temperatures of Al-rich and alkaline-earth bearing melts naturally incur higher values of Al2O3 . Besides, Al in CN 5 and 6 is detected in aluminium-rich glasses [107, 108, 109, 110, 111, 112, 113, 114, 101, 115], and may further induce variations in its partial contributions to and . Indeed, such an effect was observed for instance for the heat capacity of calcium aluminosilicate glasses, in which the partial contributions of Al in CN 4, 5 and 6 to the were estimated to be of 80.3, 79.9 and 70.0 J mol-1 K-1, at 300 K respectively [116]. To test this hypothesis, we used the compilation of the fractions of Al in CN 4, CN 5 and CN 6 in magnesium and calcium aluminosilicate glasses made by [47], and we report the average coordination number of Al against Al2O3 partial molar and at (Fig. 10). While no systematic relationship is observed between partial Al2O3 and the fraction of [5]Al and [6]Al, a systematic trend is observed for Al2O3 partial molar volume. In general, Al2O3 seems to tend toward the value of 25.575 cm3 mol-1 for corundum, where Al is in CN 6 (Fig. 10b). This demonstrates that changes in CN of network-former cations also explain the variations in their partial molar . On the contrary, changes in polymerization resulting from variations in XAl do not seem to induce important variations in the SiO2 partial molar (Fig. 9). Indeed, as XAl increases, a marked change in the distribution of Si in different tetrahedral units is expected [e.g., 100, 101], as recorded for instance in Raman spectra of the float glass in figure 5b. Despite this, no large variations in SiO2 partial molar is observed (Fig. 9a,b,c,d). This may find an explanation in the fact that the difference in length between Si-BO and Si-NBO bonds is relatively small ( ~ 2 %, e.g. see [117]), and thus can only result in limited variations in SiO2 .
The above discussion indicates that changes in the partial molar of oxide components in glasses occur as the CNs of cations evolve with glass composition. This process also should be particularly important in melts, in which changes in the coordination numbers of cations are occurring not only as a function of composition, but also as a function of temperature [118, 119, 120, 101] and pressure [121, 122, 123, 124, 125, 126, 127, 128, 129]. Therefore, systematic and precise predictions of melt molar volume and density, a key area to solve questions related to the presence and behavior of deep silicate melts in the inner Earth near the mantle transition zone or the mantle-core boundary [e.g. 128], requires further knowledge regarding the links between cationic environment and molar volumes. For a given cation, combining i-Melt predictions of cationic with experimental data regarding the cationic environment may result in producing interesting data to better constrain the links between melt/glass composition, cation partial molar volumes, local atomic environments and glass/melt density.
5 Conclusion
The new implementation of i-Melt, a greybox model combining artificial neural networks with physical equations, allows systematic and precise predictions of the properties of alkali and alkaline-earth aluminosilicate melts and glasses, including configurational entropy, liquid heat capacity and partial molar contributions from the different oxide components, configurational heat capacity, glass transition temperature, fragility, viscosity, density and partial molar volumes of oxide components, optical refractive index and Raman spectra. Reliable uncertainty estimates are now provided using MC dropout and conformal prediction.
The new abilities of the model, i.e. the prediction of partial oxide values for glass molar volumes and liquid heat capacities, allow understanding the links between the role and environment of cations in glasses and melts, and variations in melt/glass properties. For instance, at fixed SiO2 but varying Al2O3/M2/xx+O, M2/xx+O and Al2O3 partial molar volumes and liquid heat capacities at can vary as a function of the role of metal cation M in the glass network (i.e., if acting as a network modifier or charge compensator), as well as a function of the fractions of Al in 4, 5 and 6 fold coordination. Such a demonstration is only a glimpse into the possibilities offered by machine-learning powered models such as i-Melt. Their development can help better understand the properties and structure of melts under various conditions pertinent for geologic and industrial problems, design new experiments, and new glass products The open source and free nature of i-Melt implies that future developments also can greatly benefit from user inputs. Contributions can range from sending new data for their integration in the database to code development.
Acknowledgement
The authors thank Bjorn O. Mysen (Carnegie Institution for Science), Tobias K. Bechgaard (Novo Nordisk), Lothar Wondraczek (University of Erlangen), and Daniel R. Neuville (CNRS-IPGP) for the provision of raw data for their inclusion in the database. CLL thanks Andrew Valentine (Durham University) for various discussions and advice regarding optimization and machine learning. Constructive comments from anonymous reviewers were highly appreciated. Numerical computations were performed on the S-CAPAD plateforme, IPGP, France.
Funding
CLL acknowledges funding from a Chaire d’Excellence from the IdEX Université de Paris ANR-18-IDEX-0001. CLL and BB acknowledge funding from the Data intelligence institute of Paris, IdEX Université de Paris ANR-18-IDEX-0001.
Author contributions
Charles Le Losq: Conceptualization, Methodology, Software, Validation, Formal analysis, Investigation, Resources, Data Curation, Writing - Original Draft, Writing - Review & Editing, Visualization, Supervision, Funding acquisition, Project administration.
Barbara Baldoni: Methodology, Software, Formal analysis, Investigation, Data Curation, Writing - Review & Editing, Visualization
Competing interests
Authors declare no competing interests.
Materials & Correspondence
All the data are available in the main text or the supplementary materials. The database and the computer code to reproduce the results of this study is available as a Python library at the web address https://github.com/charlesll/i-melt and on Zenodo [27]. Correspondence can be addressed to the corresponding author.
References
- [1] H. M. Gonnermann and M. Manga, “Dynamics of magma ascent in the volcanic conduit,” in Modeling Volcanic Processes: The Physics and Mathematics of Volcanism (S. A. Fagents, T. K. P. Gregg, and R. M. C. Lopes, eds.), pp. 55–84, Cambridge University Press, 2013.
- [2] H. M. Gonnermann, “Magma Fragmentation,” Annual Review of Earth and Planetary Sciences, vol. 43, pp. 431–458, May 2015.
- [3] Y. Bottinga and D. F. Weill, “The viscosity of magmatic silicate liquids: A model for calculation,” American Journal of Science, vol. 272, pp. 438–475, 1972.
- [4] H. R. Shaw, “Viscosities of magmatic silicate liquids: An empirical method of prediction,” American Journal of Science, vol. 272, pp. 870–893, 1972.
- [5] E. S. Persikov, “The viscosity of magmatic liquids : Experiment, generalized patterns. A model for calculation and prediction. Applications.,” Advances in Physical Geochemistry, vol. 9, pp. 1–40, 1991.
- [6] H. Hui and Y. Zhang, “Toward a general viscosity equation for natural anhydrous and hydrous silicate melts,” Geochimica et Cosmochimica Acta, vol. 71, no. 2, pp. 403–416, 2007.
- [7] D. Giordano, J. K. Russell, and D. B. Dingwell, “Viscosity of magmatic liquids: A model,” Earth and Planetary Science Letters, vol. 271, pp. 123–134, July 2008.
- [8] X. Duan, “A model for calculating the viscosity of natural iron-bearing silicate melts over a wide range of temperatures, pressures, oxygen fugacites, and compositions,” American Mineralogist, vol. 99, pp. 2378–2388, Nov. 2014.
- [9] A. Sehlke and A. G. Whittington, “The viscosity of planetary tholeiitic melts: A configurational entropy model,” Geochimica et Cosmochimica Acta, vol. 191, pp. 277–299, Oct. 2016.
- [10] C. Le Losq and D. R. Neuville, “Molecular structure, configurational entropy and viscosity of silicate melts: Link through the Adam and Gibbs theory of viscous flow,” Journal of Non-Crystalline Solids, vol. 463, pp. 175–188, May 2017.
- [11] K. Starodub, G. Wu, E. Yazhenskikh, M. Müller, A. Khvan, and A. Kondratiev, “An Avramov-based viscosity model for the SiO2-Al2O3-Na2O-K2O system in a wide temperature range,” Ceramics International, vol. 45, pp. 12169–12181, June 2019.
- [12] B. Guillot and N. Sator, “A computer simulation study of natural silicate melts. Part I: Low pressure properties,” Geochimica et Cosmochimica Acta, vol. 71, pp. 1249–1265, Mar. 2007.
- [13] F. J. Spera, M. S. Ghiorso, and D. Nevins, “Structure, thermodynamic and transport properties of liquid mgsio3: Comparison of molecular models and laboratory results,” Geochimica et Cosmochimica Acta, vol. 75, p. 1272–1296, Mar 2011.
- [14] B. B. Karki, J. Zhang, and L. Stixrude, “First principles viscosity and derived models for mgo-sio 2 melt system at high temperature: Viscosity of mgo-sio 2 melt,” Geophysical Research Letters, vol. 40, p. 94–99, Jan 2013.
- [15] M. Bauchy, B. Guillot, M. Micoulaut, and N. Sator, “Viscosity and viscosity anomalies of model silicates and magmas: A numerical investigation,” Chemical Geology, vol. 346, pp. 47–56, May 2013.
- [16] Y. Wang, T. Sakamaki, L. B. Skinner, Z. Jing, T. Yu, Y. Kono, C. Park, G. Shen, M. L. Rivers, and S. R. Sutton, “Atomistic insight into viscosity and density of silicate melts under pressure,” Nature Communications, vol. 5, p. 3241, 2014.
- [17] T. Dufils, N. Folliet, B. Mantisi, N. Sator, and B. Guillot, “Properties of magmatic liquids by molecular dynamics simulation: The example of a MORB melt,” Chemical Geology, vol. 461, pp. 34–46, 2017.
- [18] S. K. Bajgain and M. Mookherjee, “Carbon bearing aluminosilicate melt at high pressure,” Geochimica et Cosmochimica Acta, vol. 312, p. 106–123, Nov 2021.
- [19] S. K. Bajgain, A. W. Ashley, M. Mookherjee, D. B. Ghosh, and B. B. Karki, “Insights into magma ocean dynamics from the transport properties of basaltic melt,” Nature Communications, vol. 13, p. 7590, Dec 2022.
- [20] T. F. J. Bögels and R. Caracas, “Critical point and supercritical regime of mgo,” Physical Review B, vol. 105, p. 064105, Feb 2022.
- [21] A. Tandia, M. C. Onbasli, and J. C. Mauro, “Machine Learning for Glass Modeling,” in Springer Handbook of Glass (J. D. Musgraves, J. Hu, and L. Calvez, eds.), Springer Handbooks, pp. 1157–1192, Cham: Springer International Publishing, 2019.
- [22] H. Liu, Z. Fu, K. Yang, X. Xu, and M. Bauchy, “Machine learning for glass science and engineering: A review,” Journal of Non-Crystalline Solids: X, vol. 4, p. 100036, Dec. 2019.
- [23] J. Hwang, Y. Tanaka, S. Ishino, and S. Watanabe, “Prediction of viscosity behavior in oxide glass materials using cation fingerprints with artificial neural networks,” Science and Technology of Advanced Materials, vol. 21, pp. 492–504, Jan. 2020.
- [24] C. Le Losq, A. P. Valentine, B. O. Mysen, and D. R. Neuville, “Structure and properties of alkali aluminosilicate glasses and melts: Insights from deep learning,” Geochimica et Cosmochimica Acta, vol. 314, pp. 27–54, Dec. 2021.
- [25] C. Le Losq and A. Valentine, “i-Melt v1.2.1,” Zenodo, Aug. 2021.
- [26] D. R. Cassar, “Drcassar/glasspy: GlassPy 0.3.” Zenodo, July 2020.
- [27] C. Le Losq, B. Baldoni, and A. Valentine, “charlesll/i-melt: i-melt v2.0.0,” Apr 2023.
- [28] R. Caruana, “Multitask Learning,” Machine Learning, vol. 28, pp. 41–75, July 1997.
- [29] I. Goodfellow, Y. Bengio, and A. Courville, Deep Learning. MIT Press, 2016.
- [30] S. Kaufman, S. Rosset, C. Perlich, and O. Stitelman, “Leakage in data mining: Formulation, detection, and avoidance,” ACM Transactions on Knowledge Discovery from Data, vol. 6, pp. 1–21, Dec. 2012.
- [31] F. Pedregosa, G. Varoquaux, A. Gramfort, V. Michel, B. Thirion, O. Grisel, M. Blondel, P. Prettenhofer, R. Weiss, V. Dubourg, et al., “Scikit-learn: Machine learning in Python,” Journal of Machine Learning Research, vol. 12, no. Oct, pp. 2825–2830, 2011.
- [32] A. Paszke, S. Gross, F. Massa, A. Lerer, J. Bradbury, G. Chanan, T. Killeen, Z. Lin, N. Gimelshein, L. Antiga, A. Desmaison, A. Kopf, E. Yang, Z. DeVito, M. Raison, A. Tejani, S. Chilamkurthy, B. Steiner, L. Fang, J. Bai, and S. Chintala, “PyTorch: An Imperative Style, High-Performance Deep Learning Library,” Advances in Neural Information Processing Systems, vol. 32, pp. 8026–8037, 2019.
- [33] G. Adam and J. H. Gibbs, “On the temperature dependence of cooperative relaxation properties in glass-forming liquids,” The journal of chemical physics, vol. 43, no. 1, pp. 139–146, 1965.
- [34] P. Richet, “Viscosity and configurational entropy of silicate melts,” Geochimica et Cosmochimica Acta, vol. 48, pp. 471–483, Mar. 1984.
- [35] J. C. Mauro, Y. Yue, A. J. Ellison, P. K. Gupta, and D. C. Allan, “Viscosity of glass-forming liquids,” Proceedings of the National Academy of Sciences, vol. 106, no. 47, pp. 19780–19784, 2009.
- [36] I. Avramov and A. Milchev, “Effect of disorder on diffusion and viscosity in condensed systems,” Journal of Non-Crystalline Solids, vol. 104, pp. 253–260, Sept. 1988.
- [37] G. S. Fulcher, “Analysis of Recent Measurements of the Viscosity of Glasses,” Journal of the American Ceramic Society, vol. 8, no. 6, pp. 339–355, 1925.
- [38] M. H. Cohen and G. S. Grest, “Liquid-glass transition, a free-volume approach,” Physical Review B, vol. 20, no. 3, p. 1077, 1979.
- [39] M. H. Cohen and G. S. Grest, “The nature of the glass transition,” Journal of Non-Crystalline Solids, vol. 61–62, pp. 749–759, Jan. 1984.
- [40] P. Richet and Y. Bottinga, “Heat capacity of aluminum-free liquid silicates,” Geochimica et Cosmochimica Acta, vol. 49, pp. 471–486, Feb. 1985.
- [41] A. Kendall, Y. Gal, and R. Cipolla, “Multi-Task Learning Using Uncertainty to Weigh Losses for Scene Geometry and Semantics,” arXiv:1705.07115 [cs], Apr. 2018.
- [42] D. Hendrycks and K. Gimpel, “Gaussian Error Linear Units (GELUs),” arXiv:1606.08415, July 2020.
- [43] N. Srivastava, G. Hinton, A. Krizhevsky, I. Sutskever, and R. Salakhutdinov, “Dropout: A Simple Way to Prevent Neural Networks from Overfitting,” Journal of Machine Learning Research, vol. 15, pp. 1929–1958, 2014.
- [44] R. Liaw, E. Liang, R. Nishihara, P. Moritz, J. E. Gonzalez, and I. Stoica, “Tune: A Research Platform for Distributed Model Selection and Training,” arXiv:1807.05118, July 2018.
- [45] T. Akiba, S. Sano, T. Yanase, T. Ohta, and M. Koyama, “Optuna: A Next-generation Hyperparameter Optimization Framework,” in Proceedings of the 25th ACM SIGKDD International Conference on Knowledge Discovery & Data Mining, KDD ’19, (New York, NY, USA), pp. 2623–2631, Association for Computing Machinery, July 2019.
- [46] Y. Gal and Z. Ghahramani, “Dropout as a Bayesian Approximation: Representing Model Uncertainty in Deep Learning,” in International Conference on Machine Learning, pp. 1050–1059, PMLR, June 2016.
- [47] D. R. Neuville and C. Le Losq, “Link between Medium and Long-range Order and Macroscopic Properties of Silicate Glasses and Melts,” Reviews in Mineralogy & Geochemistry, vol. 87, pp. 105–162, 2022.
- [48] J. K. Russell and D. Giordano, “A model for silicate melt viscosity in the system CaMgSi2O6-CaAl2Si2O8-NaAlSi3O8,” Geochimica et Cosmochimica Acta, vol. 69, pp. 5333–5349, Nov. 2005.
- [49] D. R. Cassar, “ViscNet: Neural network for predicting the fragility index and the temperature-dependency of viscosity,” Acta Materialia, vol. 206, p. 116602, 2021.
- [50] C. Dreyfus and G. Dreyfus, “A machine learning approach to the estimation of the liquidus temperature of glass-forming oxide blends,” Journal of Non-Crystalline Solids, vol. 318, pp. 63–78, Apr. 2003.
- [51] P. Courtial and P. Richet, “Heat capacity of magnesium aluminosilicate melts,” Geochimica et Cosmochimica Acta, vol. 57, pp. 1267–1275, Mar. 1993.
- [52] D. Giordano and J. K. Russell, “The heat capacity of hydrous multicomponent natural melts and glasses,” Chemical Geology, vol. 461, pp. 96–103, 2017.
- [53] A. Fluegel, “Global Model for Calculating Room-Temperature Glass Density from the Composition,” Journal of the American Ceramic Society, vol. 90, pp. 2622–2625, Aug. 2007.
- [54] Y.-J. Hu, G. Zhao, M. Zhang, B. Bin, T. Del Rose, Q. Zhao, Q. Zu, Y. Chen, X. Sun, M. de Jong, and L. Qi, “Predicting densities and elastic moduli of SiO2-based glasses by machine learning,” npj Computational Materials, vol. 6, p. 25, Mar. 2020.
- [55] C. J. Wilkinson, Q. Zheng, L. Huang, and J. C. Mauro, “Topological constraint model for the elasticity of glass-forming systems,” Journal of Non-Crystalline Solids: X, vol. 2, p. 100019, June 2019.
- [56] B. O. Mysen, L. W. Finger, D. Virgo, and F. A. Seifert, “Curve-fitting of Raman spectra of silicate glasses,” American Mineralogist, vol. 67, pp. 686–695, 1982.
- [57] P. F. McMillan, “Structural studies of silicate glasses and melts - Applications and limitations of Raman spectroscopy,” American Mineralogist, vol. 69, pp. 622–644, 1984.
- [58] N. Zotov, I. Ebbsjö, D. Timpel, and H. Keppler, “Calculation of Raman spectra and vibrational properties of silicate glasses: Comparison between Na2Si4O9 and SiO2 glasses,” Physical Review B, vol. 60, no. 9, p. 6383, 1999.
- [59] G. Spiekermann, M. Steele-MacInnis, P. M. Kowalski, C. Schmidt, and S. Jahn, “Vibrational properties of silica species in MgO–SiO2 glasses obtained from ab initio molecular dynamics,” Chemical Geology, vol. 346, pp. 22–33, May 2013.
- [60] C. Le Losq, B. O. Mysen, and G. D. Cody, “Water solution mechanism in calcium aluminosilicate glasses and melts: Insights from in and ex situ Raman and 29 NMR spectroscopy,” Comptes Rendus. Géoscience, vol. 354, no. S1, pp. 1–27, 2022.
- [61] Z. Shan, C. Li, and H. Tao, “Mixed alkaline-earth effect on the mechanical and rheological properties of ca-mg silicate glasses,” Journal of the American Ceramic Society, vol. 100, p. 4570–4580, Oct 2017.
- [62] L. Cormier, G. Calas, and B. Beuneu, “Structural changes between soda-lime silicate glass and melt,” Journal of Non-Crystalline Solids, vol. 357, p. 926–931, Feb 2011.
- [63] S. K. Sharma, J. A. Philpotts, and D. W. Matson, “Ring distributions in alkali- and alkaline-earth aluminosilicate framework glasses- a raman spectroscopic study,” Journal of Non-Crystalline Solids, vol. 71, pp. 403–410, May 1985.
- [64] D. R. Neuville and B. O. Mysen, “Role of aluminium in the silicate network: In situ, high-temperature study of glasses and melts on the join SiO2-NaAlO2,” Geochimica et Cosmochimica Acta, vol. 60, pp. 1727–1737, 1996.
- [65] D. R. Neuville, L. Cormier, and D. Massiot, “Al environment in tectosilicate and peraluminous glasses: A 27Al MQ-MAS NMR, Raman, and XANES investigation,” Geochimica et Cosmochimica Acta, vol. 68, pp. 5071–5079, Dec. 2004.
- [66] J. D. Kubicki and D. Sykes, “Molecular orbital calculations of vibrations in three-membered aluminosilicate rings,” Physics and Chemistry of Minerals, vol. 19, pp. 381–391, Jan. 1993.
- [67] C. Le Losq and D. R. Neuville, “Effect of the Na/K mixing on the structure and the rheology of tectosilicate silica-rich melts,” Chemical Geology, vol. 346, pp. 57–71, 2013.
- [68] C. Le Losq, D. R. Neuville, W. Chen, P. Florian, D. Massiot, Z. Zhou, and G. N. Greaves, “Percolation channels: A universal idea to describe the atomic structure and dynamics of glasses and melts,” Scientific Reports, vol. 7, p. 16490, Dec. 2017.
- [69] F. L. Galeener, “Planar rings in vitreous silica,” Journal of Non-Crystalline Solids, vol. 49, pp. 53–62, 1982.
- [70] A. Pasquarello, J. Sarnthein, and R. Car, “Dynamic structure factor of vitreous silica from first principles: Comparison to neutron-inelastic-scattering experiments,” Physical Review B, pp. 14133–14140, 1998.
- [71] P. Umari and A. Pasquarello, “Modeling of the Raman spectrum of vitreous silica: Concentration of small ring structures,” Physica B, vol. 316–317, pp. 572–574, 2002.
- [72] P. Umari, X. Gonze, and A. Pasquarello, “Concentration of small ring structures in vitreous silica from a first-principles analysis of the Raman spectrum,” Physical Review Letters, vol. 90, no. 2, pp. 1–4, 2003.
- [73] A. Rahmani, M. Benoit, and C. Benoit, “Signature of small rings in the Raman spectra of normal and compressed amorphous silica: A combined classical and ab initio study,” Physical Review B, vol. 68, no. 18, p. 184202, 2003.
- [74] S. K. Sharma, J. F. Mammone, and M. F. Nicol, “Raman investigation of ring configurations in vitreous silica,” Nature, vol. 292, pp. 140–141, 1981.
- [75] F. L. Galeener, “Planar rings in glasses,” Solid State Communications, vol. 44, no. 7, pp. 1037–1040, 1982.
- [76] F. L. Galeener, R. A. Barrio, E. Martinez, and R. J. Elliott, “Vibrational decoupling of rings in amourphous solids,” Physical Review Letters, vol. 53, pp. 2429–2432, 1984.
- [77] J. O. Isard, “The mixed alkali effect in glass,” Journal of Non-Crystalline Solids, vol. 1, pp. 235–261, 1969.
- [78] D. E. Day, “Mixed alkali glasses - Their properties and uses,” Journal of Non-Crystalline Solids, vol. 21, pp. 343–372, 1976.
- [79] G. N. Greaves and S. Sen, “Inorganic glasses, glass-forming liquids and amorphizing solids,” Advances in Physics, vol. 56, pp. 1–166, Jan. 2007.
- [80] J. P. Poole, “Low-temperature viscosity of alkali silicate glasses,” Journal of the American Ceramic Society, vol. 32, no. 7, pp. 230–233, 1949.
- [81] D. R. Neuville, “Viscosity, structure and mixing in (Ca, Na) silicate melts,” Chemical Geology, vol. 229, pp. 28–41, May 2006.
- [82] W. Hummel and J. Arndt, “Variation of viscosity with temperature and composition in the plagioclase system,” Contributions to Mineralogy and Petrology, vol. 90, no. 1, pp. 83–92, 1985.
- [83] D. R. Neuville and P. Richet, “Viscosity and mixing in molten (Ca, Mg) pyroxenes and garnets,” Geochimica et Cosmochimica Acta, vol. 55, pp. 1011–1019, Apr. 1991.
- [84] D. R. Neuville, L. Cormier, and D. Massiot, “Al coordination and speciation in calcium aluminosilicate glasses: Effects of composition determined by 27Al MQ-MAS NMR and Raman spectroscopy,” Chemical Geology, vol. 229, no. 1-3, pp. 173–185, 2006.
- [85] J. Kjeldsen, M. M. Smedskjaer, J. C. Mauro, and Y. Yue, “On the origin of the mixed alkali effect on indentation in silicate glasses,” Journal of Non-Crystalline Solids, vol. 406, pp. 22–26, Dec. 2014.
- [86] C. A. Angell, “Relaxation in liquids, polymers and plastic crystals—strong/fragile patterns and problems,” Journal of Non-Crystalline Solids, vol. 131, pp. 13–31, 1991.
- [87] M. J. Toplis, D. B. Dingwell, K.-U. Hess, and T. Lenci, “Viscosity, fragility, and configurational entropy of melts along the join SiO2-NaAlSiO4,” American Mineralogist, vol. 82, no. 9, pp. 979–990, 1997.
- [88] P. Richet, “Heat capacity of silicate glasses,” Chemical Geology, vol. 62, pp. 111–124, Apr. 1987.
- [89] S. L. Webb, “Configurational heat capacity of Na2O–CaO–Al2O3–SiO2 melts,” Chemical Geology, vol. 256, pp. 92–101, Nov. 2008.
- [90] J. K. Russell and D. Giordano, “Modelling configurational entropy of silicate melts,” Chemical Geology, vol. 461, pp. 140–151, 2017.
- [91] J. A. Tangeman and R. A. Lange, “The effect of Al3+, Fe3+, and Ti4+ on the configurational heat capacities of sodium silicate liquids,” Physic and Chemistry of Minerals, vol. 26, pp. 83–99, 1998.
- [92] I. Kononenko, “Bayesian neural networks,” Biological Cybernetics, vol. 61, pp. 361–370, 1989.
- [93] P. Izmailov, S. Vikram, M. D. Hoffman, and A. G. Wilson, “What Are Bayesian Neural Network Posteriors Really Like?,” in International Conference on Machine Learning, pp. 4629–4640, PMLR, 2021.
- [94] A. N. Angelopoulos and S. Bates, “A Gentle Introduction to Conformal Prediction and Distribution-Free Uncertainty Quantification,” arXiv, vol. 2107.07511, pp. 1–50, 2021.
- [95] I. Cortes-Ciriano and A. Bender, “Reliable Prediction Errors for Deep Neural Networks Using Test-Time Dropout,” Journal of Chemical Information and Modeling, vol. 59, pp. 3330–3339, July 2019.
- [96] K. Chaloner and I. Verdinelli, “Bayesian experimental design: A review,” Statistical Science, vol. 10, p. 273–304, Aug 1995.
- [97] Y. Bottinga, D. F. Weill, and P. Richet, “Density calculations for silicate liquids. I. Revised method for aluminosilicate compositions,” Geochimica et Cosmochimica Acta, vol. 46, pp. 909–919, 1983.
- [98] R. A. Lange and I. S. E. Carmichael, “Densities of Na2O-K2O-CaO-MgO-FeO-Fe2O3-Al2O3-TiO2-SiO2 liquids: New measurements and derived partial molar properties,” Geochimica et Cosmochimica Acta, vol. 51, pp. 2931–2946, Nov. 1987.
- [99] Q. Liu, “The partial molar volume of Fe2O3 in alkali silicate melts: Evidence for an average fe3+ coordination number near five,” American Mineralogist, vol. 91, pp. 385–393, Feb. 2006.
- [100] B. O. Mysen, A. Lucier, and G. D. Cody, “The structural behavior of Al3+ in peralkaline melts and glasses in the system Na2O-Al2O3-SiO2,” American Mineralogist, vol. 88, pp. 1668–1678, 2003.
- [101] C. Le Losq, D. R. Neuville, P. Florian, G. S. Henderson, and D. Massiot, “The role of Al3+ on rheology and structural changes of sodium silicate and aluminosilicate glasses and melts.,” Geochimica et Cosmochimica Acta, vol. 126, pp. 495–517, Feb. 2014.
- [102] T. K. Bechgaard, J. C. Mauro, M. Bauchy, Y. Yue, L. A. Lamberson, L. R. Jensen, and M. M. Smedskjaer, “Fragility and configurational heat capacity of calcium aluminosilicate glass-forming liquids,” Journal of Non-Crystalline Solids, vol. 461, pp. 24–34, Apr. 2017.
- [103] P. Richet, R. A. Robie, and B. S. Hemingway, “Entropy and structure of silicate glasses and melts,” Geochimica et Cosmochimica Acta, vol. 57, pp. 2751–2766, June 1993.
- [104] L. Cormier and D. R. Neuville, “Ca and Na environments in Na2O-CaO-Al2O3-SiO2 glasses: Influence of cation mixing and cation-network interactions,” Chemical Geology, vol. 213, no. 1-3, pp. 103–113, 2004.
- [105] E. Gambuzzi, A. Pedone, M. C. Menziani, F. Angeli, P. Florian, and T. Charpentier, “Calcium environment in silicate and aluminosilicate glasses probed by 43Ca MQMAS NMR experiments and MD-GIPAW calculations,” Solid State Nuclear Magnetic Resonance, vol. 68–69, pp. 31–36, June 2015.
- [106] B. Deng, Y. Shi, Q. Zhou, and M. Bauchy, “Revealing the structural role of MgO in aluminosilicate glasses,” Acta Materialia, vol. 222, p. 117417, Jan. 2022.
- [107] P. F. McMillan and R. J. Kirkpatrick, “Al coordination in magnesium aluminosilicate glasses,” American Mineralogist, vol. 77, pp. 898–900, 1992.
- [108] J. F. Stebbins, S. Kroeker, S. K. Lee, and T. J. Kiczenski, “Quantification of five- and six-coordinated aluminum ions in aluminosilicate and fluoride-containing glasses by high-field, high-resolution 27Al NMR,” Journal of Non-Crystalline Solids, vol. 275, pp. 1–6, 2000.
- [109] J. F. Stebbins, E. V. Dubinsky, K. Kanehashi, and K. E. Kelsey, “Temperature effects on non-bridging oxygen and aluminum coordination number in calcium aluminosilicate glasses and melts,” Geochimica et Cosmochimica Acta, vol. 72, pp. 910–925, Feb. 2008.
- [110] M. J. Toplis, S. C. Kohn, M. E. Smith, and J. F. Poplett, “Fivefold-coordinated aluminum in tectosilicate glasses observed by triple quantum MAS NMR,” American Mineralogist, vol. 85, pp. 1556–1560, 2000.
- [111] D. R. Neuville, L. Cormier, V. Montouillout, P. Florian, F. Millot, J. C. Rifflet, and D. Massiot, “Structure of Mg and Mg/Ca aluminosilicate glasses: 27Al NMR and Raman spectroscopy investigations,” American Mineralogist, vol. 83, pp. 1721–1731, 2008.
- [112] L. M. Thompson and J. F. Stebbins, “Non-bridging oxygen and high-coordinated aluminum in metaluminous and peraluminous calcium and potassium aluminosilicate glasses: High-resolution 17O and 27Al MAS NMR results,” American Mineralogist, vol. 96, pp. 841–853, 2011.
- [113] L. M. Thompson and J. F. Stebbins, “Non-stoichiometric non-bridging oxygens and five-coordinated aluminum in alkaline earth aluminosilicate glasses: Effect of modifier cation size,” Journal of Non-Crystalline Solids, vol. 358, pp. 1783–1789, Aug. 2012.
- [114] L. M. Thompson and J. F. Stebbins, “Interaction between composition and temperature effects on non-bridging oxygen and high-coordinated aluminum in calcium aluminosilicate glasses,” American Mineralogist, vol. 98, pp. 1980–1987, Nov. 2013.
- [115] S. Y. Park and S. K. Lee, “Probing the structure of fe-free model basaltic glasses: A view from a solid-state 27al and 17o nmr study of na-mg silicate glasses, na2o-mgo-al2o3-sio2 glasses, and synthetic fe-free klb-1 basaltic glasses,” Geochimica et Cosmochimica Acta, vol. 238, p. 563–579, Oct 2018.
- [116] P. Richet, A. Nidaira, D. R. Neuville, and T. Atake, “Aluminum speciation, vibrational entropy and short-range order in calcium aluminosilicate glasses,” Geochimica et Cosmochimica Acta, vol. 73, no. 13, pp. 3894–3904, 2009.
- [117] S. Ispas, T. Charpentier, F. Mauri, and D. Neuville, “Structural properties of lithium and sodium tetrasilicate glasses: Molecular dynamics simulations versus NMR experimental and first-principles data,” Solid State Sciences, vol. 12, pp. 183–192, Feb. 2010.
- [118] J. R. Allwardt, B. T. Poe, and J. F. Stebbins, “The effect of fictive temperature on Al coordination in high-pressure (10 GPa) sodium aluminosilicate glasses,” American Mineralogist, vol. 90, pp. 1453–1457, 2005.
- [119] K. Kanehashi and J. F. Stebbins, “In situ high temperature 27Al NMR study of structure and dynamics in a calcium aluminosilicate glass and melt,” Journal of Non-Crystalline Solids, vol. 353, pp. 4001–4010, Nov. 2007.
- [120] D. R. Neuville, L. Cormier, D. de Ligny, J. Roux, A.-M. Flank, and P. Lagarde, “Environments around Al, Si, and Ca in aluminate and aluminosilicate melts by X-ray absorption spectroscopy at high temperature,” American Mineralogist, vol. 93, pp. 228–234, Jan. 2008.
- [121] J. L. Yarger, K. H. Smith, R. A. Nieman, J. Diefenbacher, G. H. Wolf, B. T. Poe, and P. F. McMillan, “Al Coordination Changes in High-Pressure Aluminosilicate Liquids,” Science, vol. 270, pp. 1964–1967, Dec. 1995.
- [122] S. K. Lee, G. D. Cody, Y. Fei, and B. O. Mysen, “Nature of polymerization and properties of silicate melts and glasses at high pressure,” Geochimica et Cosmochimica Acta, vol. 68, pp. 4189–4200, Oct. 2004.
- [123] S. K. Lee, “Structure of Silicate Glasses and Melts at High Pressure: Quantum Chemical Calculations and Solid-State NMR,” The Journal of Physical Chemistry B, vol. 108, pp. 5889–5900, May 2004.
- [124] J. R. Allwardt, J. F. Stebbins, B. C. Schmidt, D. J. Frost, A. C. Withers, and M. M. Hirschmann, “Aluminum coordination and the densification of high-pressure aluminosilicate glasses,” American Mineralogist, vol. 90, pp. 1218–1222, July 2005.
- [125] C. Sanloup, J. W. E. Drewitt, Z. Konôpková, P. Dalladay-Simpson, D. M. Morton, N. Rai, W. van Westrenen, and W. Morgenroth, “Structural change in molten basalt at deep mantle conditions,” Nature, vol. 503, pp. 104–107, Nov. 2013.
- [126] C. Sanloup, J. W. E. Drewitt, C. Crépisson, Y. Kono, C. Park, C. McCammon, L. Hennet, S. Brassamin, and A. Bytchkov, “Structure and density of molten fayalite at high pressure,” Geochimica et Cosmochimica Acta, vol. 118, pp. 118–128, Oct. 2013.
- [127] J. W. E. Drewitt, S. Jahn, C. Sanloup, C. de Grouchy, G. Garbarino, and L. Hennet, “Development of chemical and topological structure in aluminosilicate liquids and glasses at high pressure,” J. Phys.: Condens. Matter, no. 27, p. 105103, 2015.
- [128] C. Sanloup, “Density of magmas at depth,” Chemical Geology, vol. 429, pp. 51–59, July 2016.
- [129] S. K. Lee, K. Y. Mun, Y.-H. Kim, J. Lhee, T. Okuchi, and J.-F. Lin, “Degree of Permanent Densification in Oxide Glasses upon Extreme Compression up to 24 GPa at Room Temperature,” The Journal of Physical Chemistry Letters, vol. 11, pp. 2917–2924, Apr. 2020.