Timing analysis of Swift J0243.6+6124 with NICER and Fermi/GBM during the decay phase of the 2017–2018 outburst
Abstract
We present a timing and noise analysis of the Be/X-ray binary system Swift J0243.6+6124 during its 2017–2018 super-Eddington outburst using NICER/XTI observations. We apply a synthetic pulse timing analysis to enrich the Fermi/GBM spin frequency history of the source with the new measurements from NICER/XTI. We show that the pulse profiles switch from double-peaked to single-peaked when the X-ray luminosity drops below erg s-1. We suggest that this transitional luminosity is associated with the transition from a pencil beam pattern to a hybrid beam pattern when the Coulomb interactions become ineffective to decelerate the accretion flow, which implies a dipolar magnetic field strength of G. We also obtained the power density spectra (PDS) of the spin frequency derivative fluctuations. The red noise component of the PDS is found to be steeper () than the other transient accreting sources. We find significantly high noise strength estimates above the super-Eddington luminosity levels, which may arise from the torque fluctuations due to interactions with the quadrupole fields at such levels.
keywords:
accretion, accretion discs – pulsars: individual: Swift J0243.6+6124 – methods: data analysis1 Introduction
A new transient binary system in our galaxy, Swift J0243.6+6124, was discovered at the onset of the outburst phase (Kennea et al., 2017). Initial analyses showed that the system consists of a pulsar with a 9.8 s spinning period (Kennea et al., 2017) and an O9.5Ve type companion with long-term optical and infrared variabilities similar to the common Be/X-ray binary systems (Kouroubatzakis et al., 2017; Reig et al., 2020). Using optical observations, Reig et al. (2020) estimated the distance of the system to be 5 kpc, whereas the Gaia EDR2 estimated distance was 6.8 kpc (Bailer-Jones et al., 2018). Adopting the Gaia EDR2 distance, the maximum brightness of Swift J0243.6+6124 was estimated to be 2 1039 erg s-1 at the peak of the outburst (Tsygankov et al., 2018; Doroshenko et al., 2020). On the other hand, the source distance (id: 465628193526364416) is revised as kpc in the Gaia EDR3 catalogue (Bailer-Jones et al., 2021). When the distance of 5 kpc is taken into account, the peak luminosity would be 1 1039 erg s-1, which is still higher than the Eddington limit for such a neutron star (Reig et al., 2020); thus, Swift J0243.6+6124 is classified as an ultraluminous X-ray Pulsar (ULXP), the first ever detected in our own galaxy.
Numerous studies regarding the temporal and spectral properties of Swift J0243.6+6124 have been conducted in attempt to comprehend the physical dynamics of this unique source (Wilson-Hodge et al., 2018; Tsygankov et al., 2018; van den Eijnden et al., 2018; Jaisawal et al., 2018; Tao et al., 2019; Doroshenko et al., 2020; Sugizaki et al., 2020; Kong et al., 2020; Wang et al., 2020; Kong et al., 2022; Liu et al., 2022b; Bykov et al., 2022). Detailed investigations revealed that both temporal and spectral features, including shape of the power spectra, pulse profiles and energy spectra, change systematically at two different transitional luminosity levels (for 6.8 kpc), erg s-1 and erg s-1 (Wilson-Hodge et al., 2018; Doroshenko et al., 2020; Kong et al., 2020). Thus, these transitional luminosity levels and are interpreted as transitions of subcritical to supercritical accretion regime and supercritical to radiation pressure dominated disc (RPD) accretion regime, respectively (Doroshenko et al., 2020). As a reminder for the discussions throughout the paper, using the new Gaia distance of 5.2 kpc, the transitional luminosity levels are calculated as = erg s-1 and = erg s-1, respectively.
Despite the extensive studies, the magnetic field configuration of Swift J0243.6+6124 is not yet clear. Initial studies have demonstrated that the source pulsations are still detectable at luminosities as low as 10 erg s-1, which indicates that the propeller regime has not yet been attained at such low luminosities; consequently, the pulsar should have a very compact magnetosphere to allow accretion to continue, which confines the upper limit of the magnetic field strength to 3 1012 G (Tsygankov et al., 2018; Doroshenko et al., 2020). Phase-resolved spectral analysis of NuSTAR observations at different luminosity levels hints for a thick super-Eddington disc with an inner radius of 2–3 107 cm and a weakly variable reflection component, signifying a magnetic field strength G if the field is dipolar (Bykov et al., 2022). On the other hand, the discovery of a cyclotron resonance scattering feature (CRSF) in the spectrum of Swift J0243.6+6124 at 120–146 keV, which is only visible in certain phases around the peak of the outburst (Kong et al., 2022) implies a magnetic field strength of 1.6 1013 G near the surface of the pulsar. Nevertheless, it is suggested that the observed CRSF is actually associated with multipole fields (Kong et al., 2022) and the dipolar component of the field strength should be in the range of 3–9 1012 G in order to describe the observed properties of the source coherently (Doroshenko et al., 2020). The accretion disc possibly penetrates into the magnetosphere more than expected, and the disc interactions are dominated by multipole components of the field at high luminosities (Doroshenko et al., 2020; Kong et al., 2022).
With its ultraluminous episode and unique properties, the source has been the target of many studies, especially in probing the nature of neutron star accretion at very high luminosities (van den Eijnden et al., 2018; Doroshenko et al., 2018; Wilson-Hodge et al., 2018; Jaisawal et al., 2019; Kong et al., 2020, 2022; Bykov et al., 2022). In this study, we investigate the timing properties of Swift J0243.6+6124, focusing mostly on its moderately luminous stages (10 erg s-1) towards the end of the outburst in 2017–2018, during which the source remained in a subcritical accretion state. We describe the data and the relevant screening processes used for timing analysis in Section 2. In Section 3, we represent the pulse timing analyses that are used for measuring spin frequencies and generating pulse profiles. In addition, we also demonstrate our results on the torque fluctuations on different timescales and luminosities. Lastly, in Section 4, we review and discuss the results of our study in the light of the systematic luminosity-dependent evolution of pulse profiles.
2 Data
Neutron Star Interior Composition Explorer (NICER) is stationed on International Space Station (ISS) since 2017 June and operated by NASA. Its primary instrument, X-Ray Timing Instrument (XTI), consists of an aligned array of 56 X-ray concentrators and focal plane modules (FPM) collecting photons from a 30 arcmin2 field onto silicon field detectors in each FPM. These detectors are capable of soft X-ray spectroscopy with 0.2–12 keV energy range and <300 ns timing precision with 1900 cm2 cumulative effective area at 1.5 keV (Gendreau et al., 2016).
Swift J0243.6+6124 has 214 NICER/XTI observations in the NICER master catalogue between 2017 October 03 and 2019 June 07 (MJD 58029–58641), corresponding to the outbursts in this study. Among those, we utilise the observations prior to the rapid decline of the source luminosity at the end of 2019 February. Data reduction of the observations is done with heasoft v6.29 using the most recent calibration files at the time (CALDB release xti20210707) for NICER. The clean events and filter files for screening data are reproduced by employing the standard level 2 data processing steps provided by the nicerl2 tool. Good time intervals (GTI) are selected adopting the default screening parameters recommended by the NICER team111https://heasarc.gsfc.nasa.gov/lheasoft/ftools/headas/nicerl2.html: ISS is outside the predefined Southern Atlantic Anomaly (SAA) region, a minimum of 38 of the 56 detectors are enabled, the pointing offset is less than 0.015∘, the source is at least 15∘ away from the dark Earth limb and 30∘ away from the bright Earth limb. The event files between MJD 58029–58531 are merged using the nimpumerge tool, event time-series are barycentered using barycorr with the JPL ephemeris DE430, and the light curves with a time resolution of 0.1 s are extracted with XSELECT. We also corrected the photon arrival times of the generated NICER/XTI light curve prior to the timing analyses described below with the orbital solution provided by the Fermi/GBM Accreting Pulsars Program (APP) team (See Table 1).
| 27.698899 | days | |
| 58116.097 | MJD | |
| sin | 115.531 | lt-s |
| -74.05 | degrees | |
| 0.1029 | – |
Additionally, we make use of the pulse frequency history of Swift J0243.6+6124 which is publicly shared through Fermi/GBM (Gamma-ray Burst Monitor) monitoring program website222https://gammaray.nsstc.nasa.gov/gbm/science/pulsars/lightcurves/swiftj0243.html (Malacaria et al., 2020) and the regularly updated Swift/BAT light curves maintained by the Swift/BAT team333https://swift.gsfc.nasa.gov/results/transients/weak/SwiftJ0243.6p6124 (Krimm et al., 2013). The compiled Fermi/GBM frequency history is orbit-corrected and encapsulates the range between 2017 October 01 and 2019 January 14 (MJD 58027–58497). We used the Swift/BAT daily average light curve, which has an energy range of 15–50 keV, from the discovery of the source in 2017 October up to 2019 February. Doroshenko et al. (2020) argued that 2–150 keV count rates for Insight-HXMT appear to be consistent with those measured by Swift/BAT, and the Swift/BAT count rates can be roughly converted to bolometric luminosity using a scaling factor 8.2 1038, assuming a source distance of 6.8 kpc. In this article, we utilise the Gaia EDR3 distance (5.2 kpc) and revise scaling factor for the Swift/BAT count rate–luminosity conversion to 4.8 1038 to estimate the bolometric luminosity, unless otherwise stated.
3 Timing Analysis and Results
3.1 Synthetic pulse timing
During its outburst phase in 2017–2018, the X-ray luminosity of Swift J0243.6+6124 varies by five orders of magnitude. At the same time, the accretion geometry, and consequently the pulse profiles, drastically alter at different accretion regimes (Wilson-Hodge et al., 2018; Doroshenko et al., 2020). In particular, the pulse profiles are shown to be double-peaked at subcritical regime () and evolve into a single-peaked shape at supercritical regime (), then again transform into a double-peaked structure at the highest luminosities () (Doroshenko et al., 2020). Moreover, the spin-up rate during the initial stages of the outburst is very strong, reaching up to 2.2 10-10 Hz s-1 (Doroshenko et al., 2018). The frequency derivative leads to a phase shift of one cycle on a timescale of (Acuner et al., 2014); and with the reported high spin-up rate during the outburst (Wilson-Hodge et al., 2018; Doroshenko et al., 2018), this timescale becomes as short as 1.1 days. Combined with the pulse profile variations, employing phase-coherent timing technique becomes unfavourable at the luminous stages of the outburst.
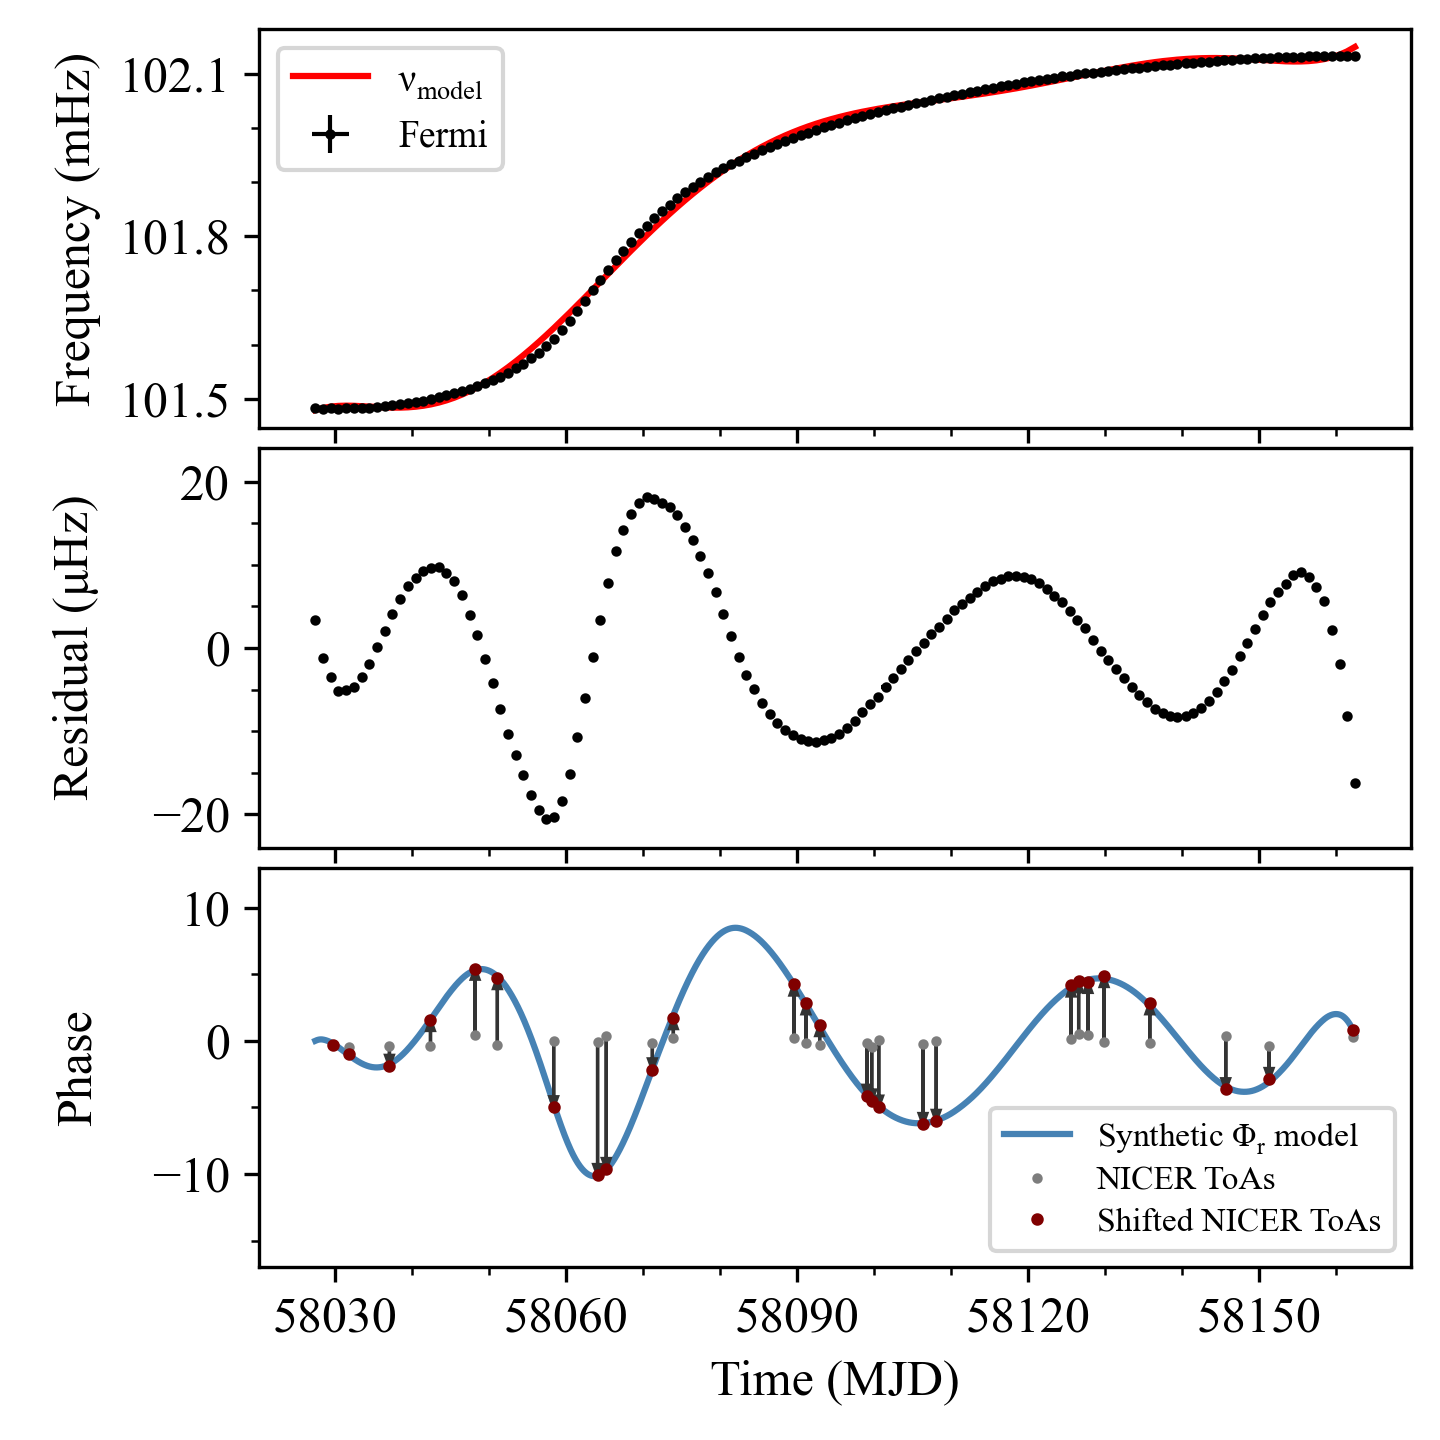
Making use of the refined orbital solution provided by Fermi/GBM team, we used the following approach to measure the pulse frequencies from the NICER data, which reside within the same time interval as the Fermi/GBM measurements: We first divide the Fermi/GBM pulse frequency measurements into three different segments, each of which is fitted with a different polynomial model to represent the frequency evolution over time, and obtain a synthetic timing solution444At this stage, it should be noted that the choice of a polynomial model order is rather arbitrary; nonetheless, the synthetic residual reconstruction compensates for the possible deviations from the model. In principle, the procedure can be applied for any polynomial order, provided that the reconstructed pulse profiles are compatible with the actual profiles. (see Table 2). Using these timing solutions, we then calculate the deviations of the Fermi/GBM frequencies from the model to extract its residuals. Utilising a linear spline interpolation of the Fermi/GBM frequency residual data set , we convert them to a synthetic phase residual model using integration:
| (1) |
where indicates the start time of the segment. Next, we fold the orbitally-corrected NICER light curve with the same synthetic timing solution to generate its phase residuals. Finally, we shift the NICER phase residuals to match with the synthetic phase residual model obtained from Fermi/GBM (see Figure 1).
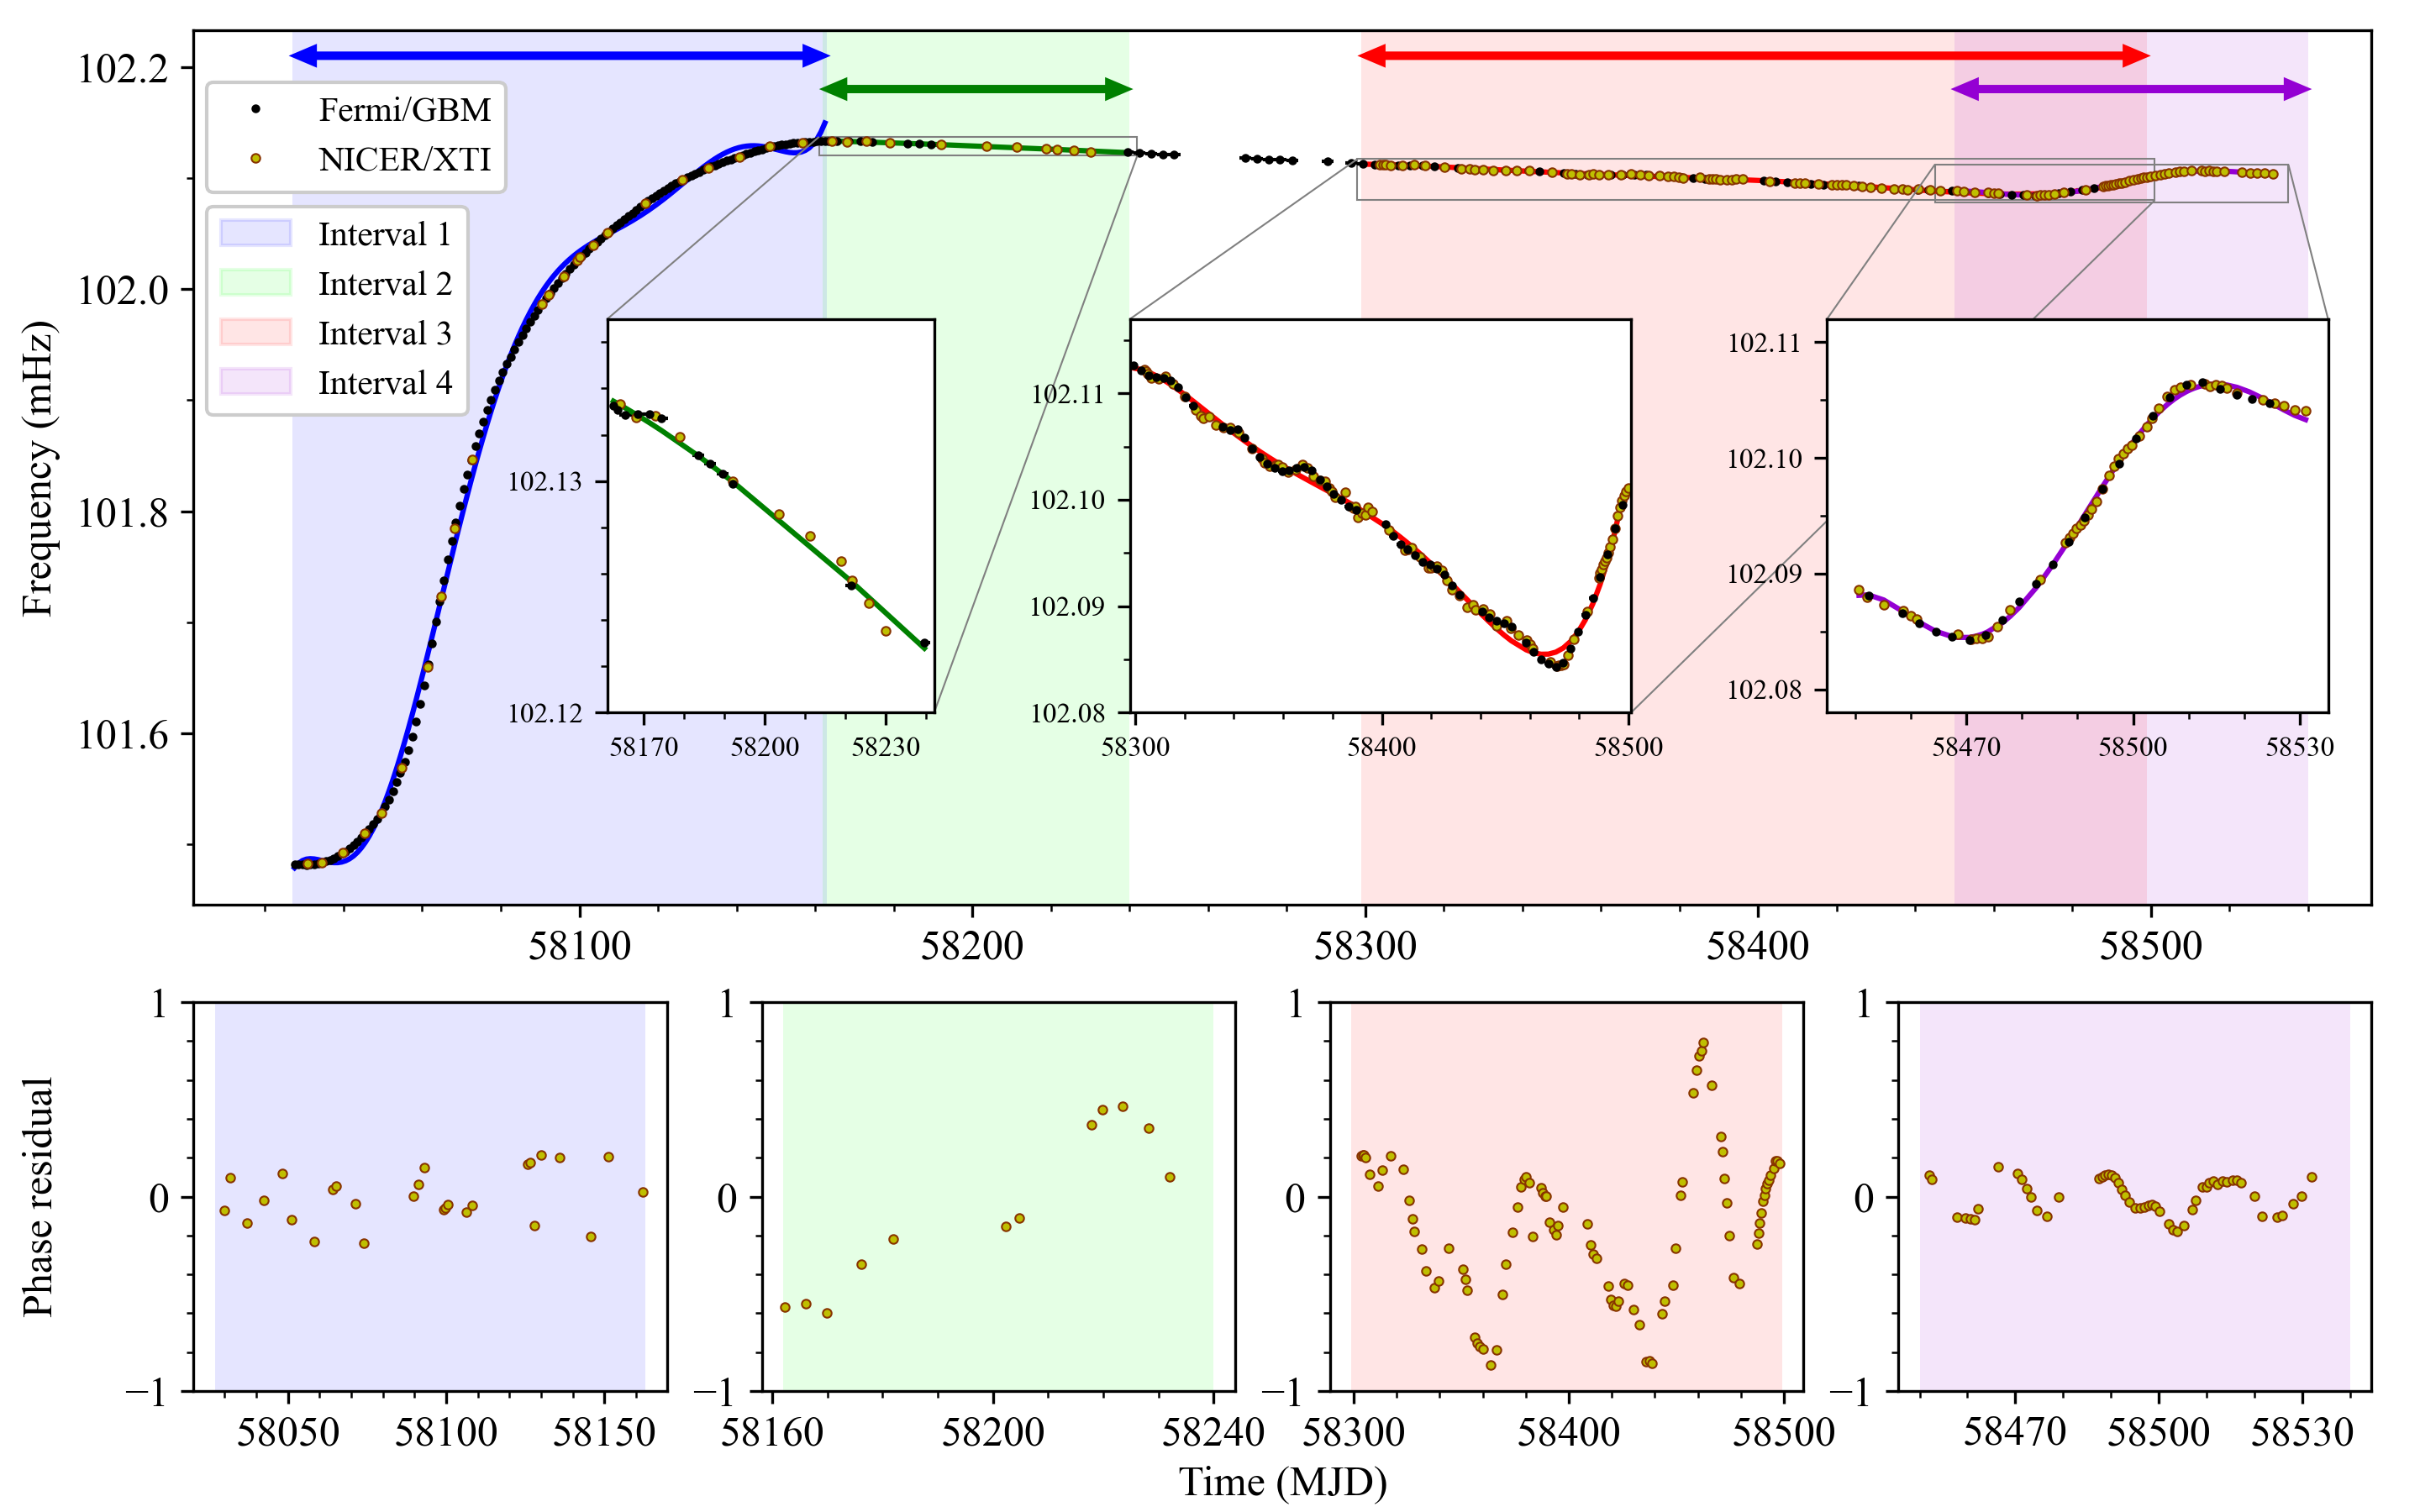
In the first interval, the luminosity of the source changes substantially, resulting in significant deviations from the polynomial description of the rapid frequency evolution. However, the phase residuals of NICER observations become compatible with the synthetic residual model when they are shifted with expected integers in phase domain. The only exceptions are the pulse profile variations at different episodes (Doroshenko et al., 2020) that are needed to be taken into account. Thus, we further allow phase shifts for the pulses in the supercritical regime by , corresponding to the phase difference between the peaks of the double-peaked and one-peaked profiles (see Figure 4 of Doroshenko et al. (2020)) to accord them with the expected synthetic phase residuals (See Figure 1, bottom panel). On the other hand, during the late stages of the outburst (at the interval 2, 3 and 4), the source luminosity is rather low ( erg s-1), and Swift J0243.6+6124 continues to accrete only in subcritical regime (i.e. ). Therefore, the synthetic phase residuals reside within a single cycle for the corresponding synthetic timing solutions given in Table 2.
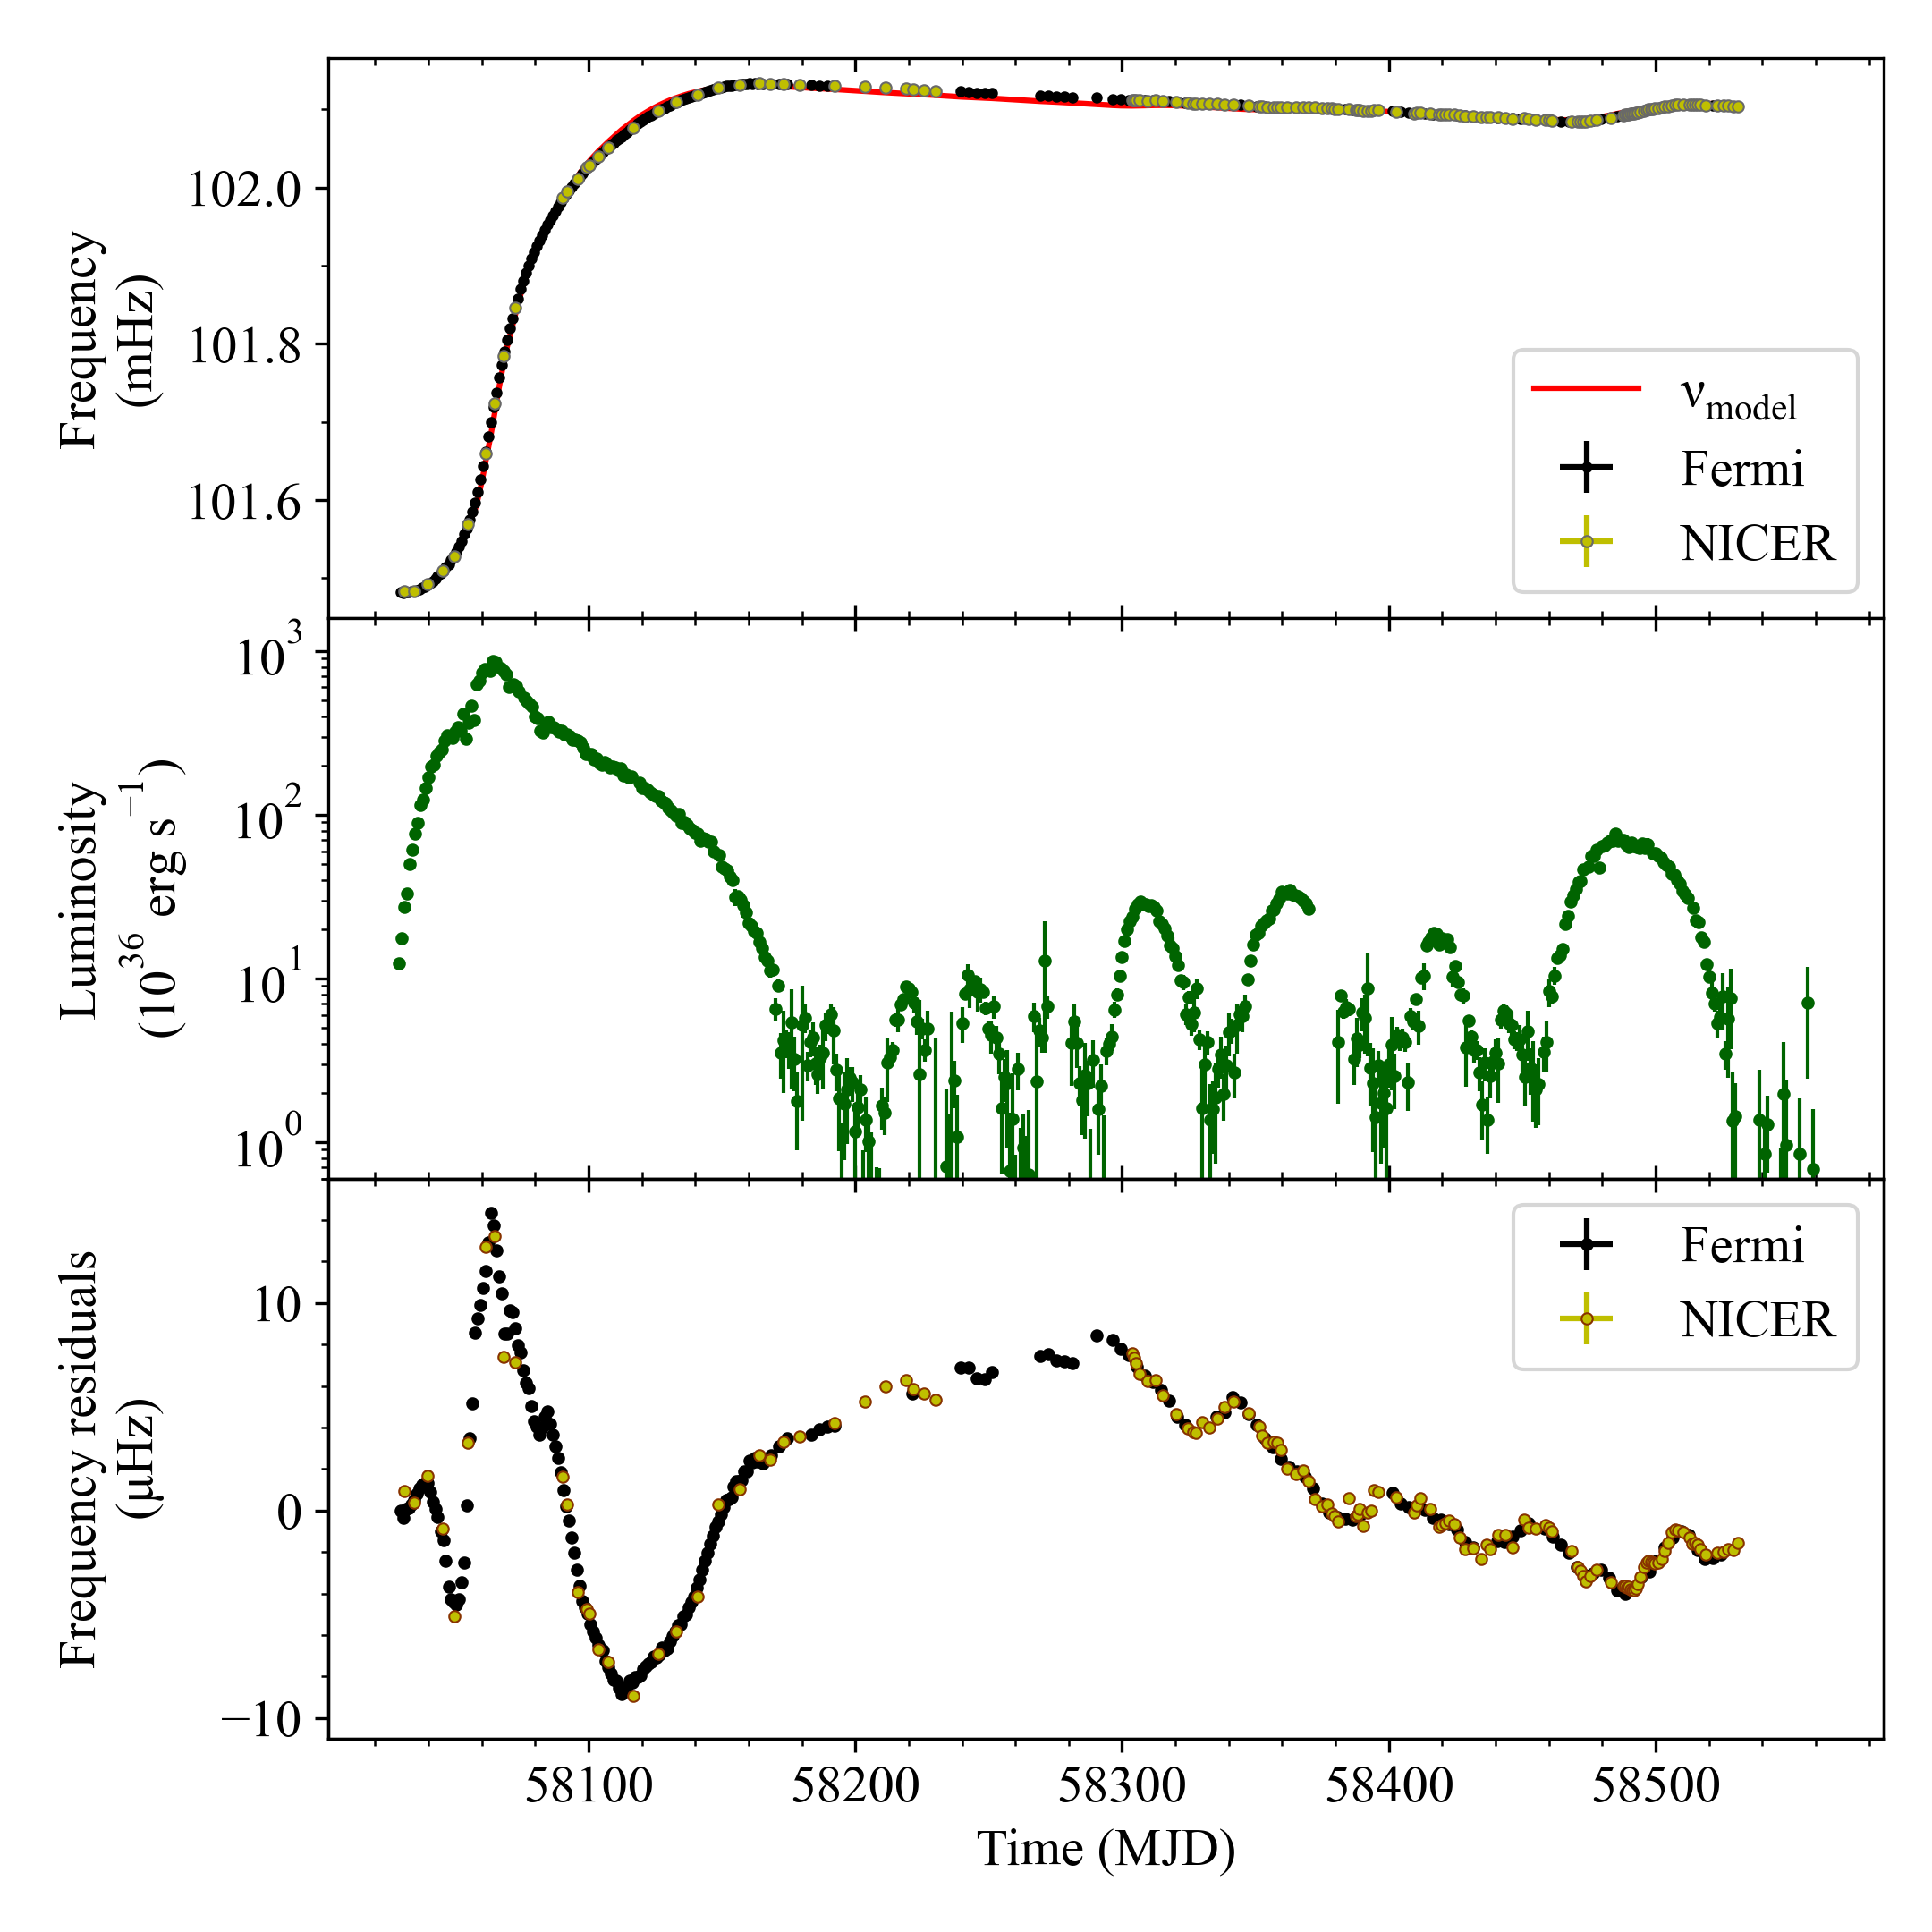
Finally, in order to convert synthetic timing solutions to pulse frequency measurements, we use each consecutive pair of pulse arrivals in the NICER residual set. Each pair is fitted with a linear function where and are the arrival times of the first and second pulses in the pair, and is the phase difference between the pair used for fitting. Each fit is transformed into a spin frequency measurement at the corresponding interval’s midpoint by using the frequency correction over the synthetic timing solutions (for applications, see Çerri-Serim et al. (2019); Serim et al. (2022)). The 1 error ranges of the slope are used as a gauge of the uncertainty in the spin frequency measurements. Figure 2 demonstrates the spin frequency history measured from NICER observations whose results are consistent with the spin frequency history shared by the Fermi/GBM APP team.
As it can be seen from the frequency history presented in Figure 2, apart from the initial stages of the Type II outburst, Swift J0243.6+6124 also spins up between MJD 58470–58510. Afterwards, as the flux diminishes over time, the frequency evolution trend returns back to the spin-down stage with an average frequency derivative of Hz s-1, which is comparable to the average spin-down rate Hz s-1 observed between MJD 58150–58460.
| Interval 1 | Interval 2 | Interval 3 | Interval 4 | |
|---|---|---|---|---|
| Timing range (MJD) | 58027–58162 | 58162–58239 | 58299–58497 | 58450–58531 |
| Epoch (MJD) | 58050 | 58200 | 58350 | 58500 |
| (Hz) | 0.1015335(20) | 0.1021289(2) | 0.1021046(2) | 0.10210146(7) |
| d/dt (10-10 Hz s-1) | 1.02(2) | 0.0161(4) | 0.0180(9) | 0.0730(10) |
| d/dt2 (10-17 Hz s-2) | 9.85(31) | 0.0109(45) | 0.0265(36) | 0.408(13) |
| d/dt3 (10-24 Hz s-3) | 49.4(35) | - | 0.0158(32) | 4.52(23) |
| d/dt4 (10-31 Hz s-4) | 9.86(90) | - | 0.0139(22) | 35.9(29) |
| d/dt5 (10-36 Hz s-5) | 158.2(109) | - | 0.0556(51) | 3.69(41) |
| d/dt6 (10-41 Hz s-6) | 9.77(66) | - | - | 0.114(59) |
| d/dt7 (10-47 Hz s-7) | 2.41(17) | - | - | - |
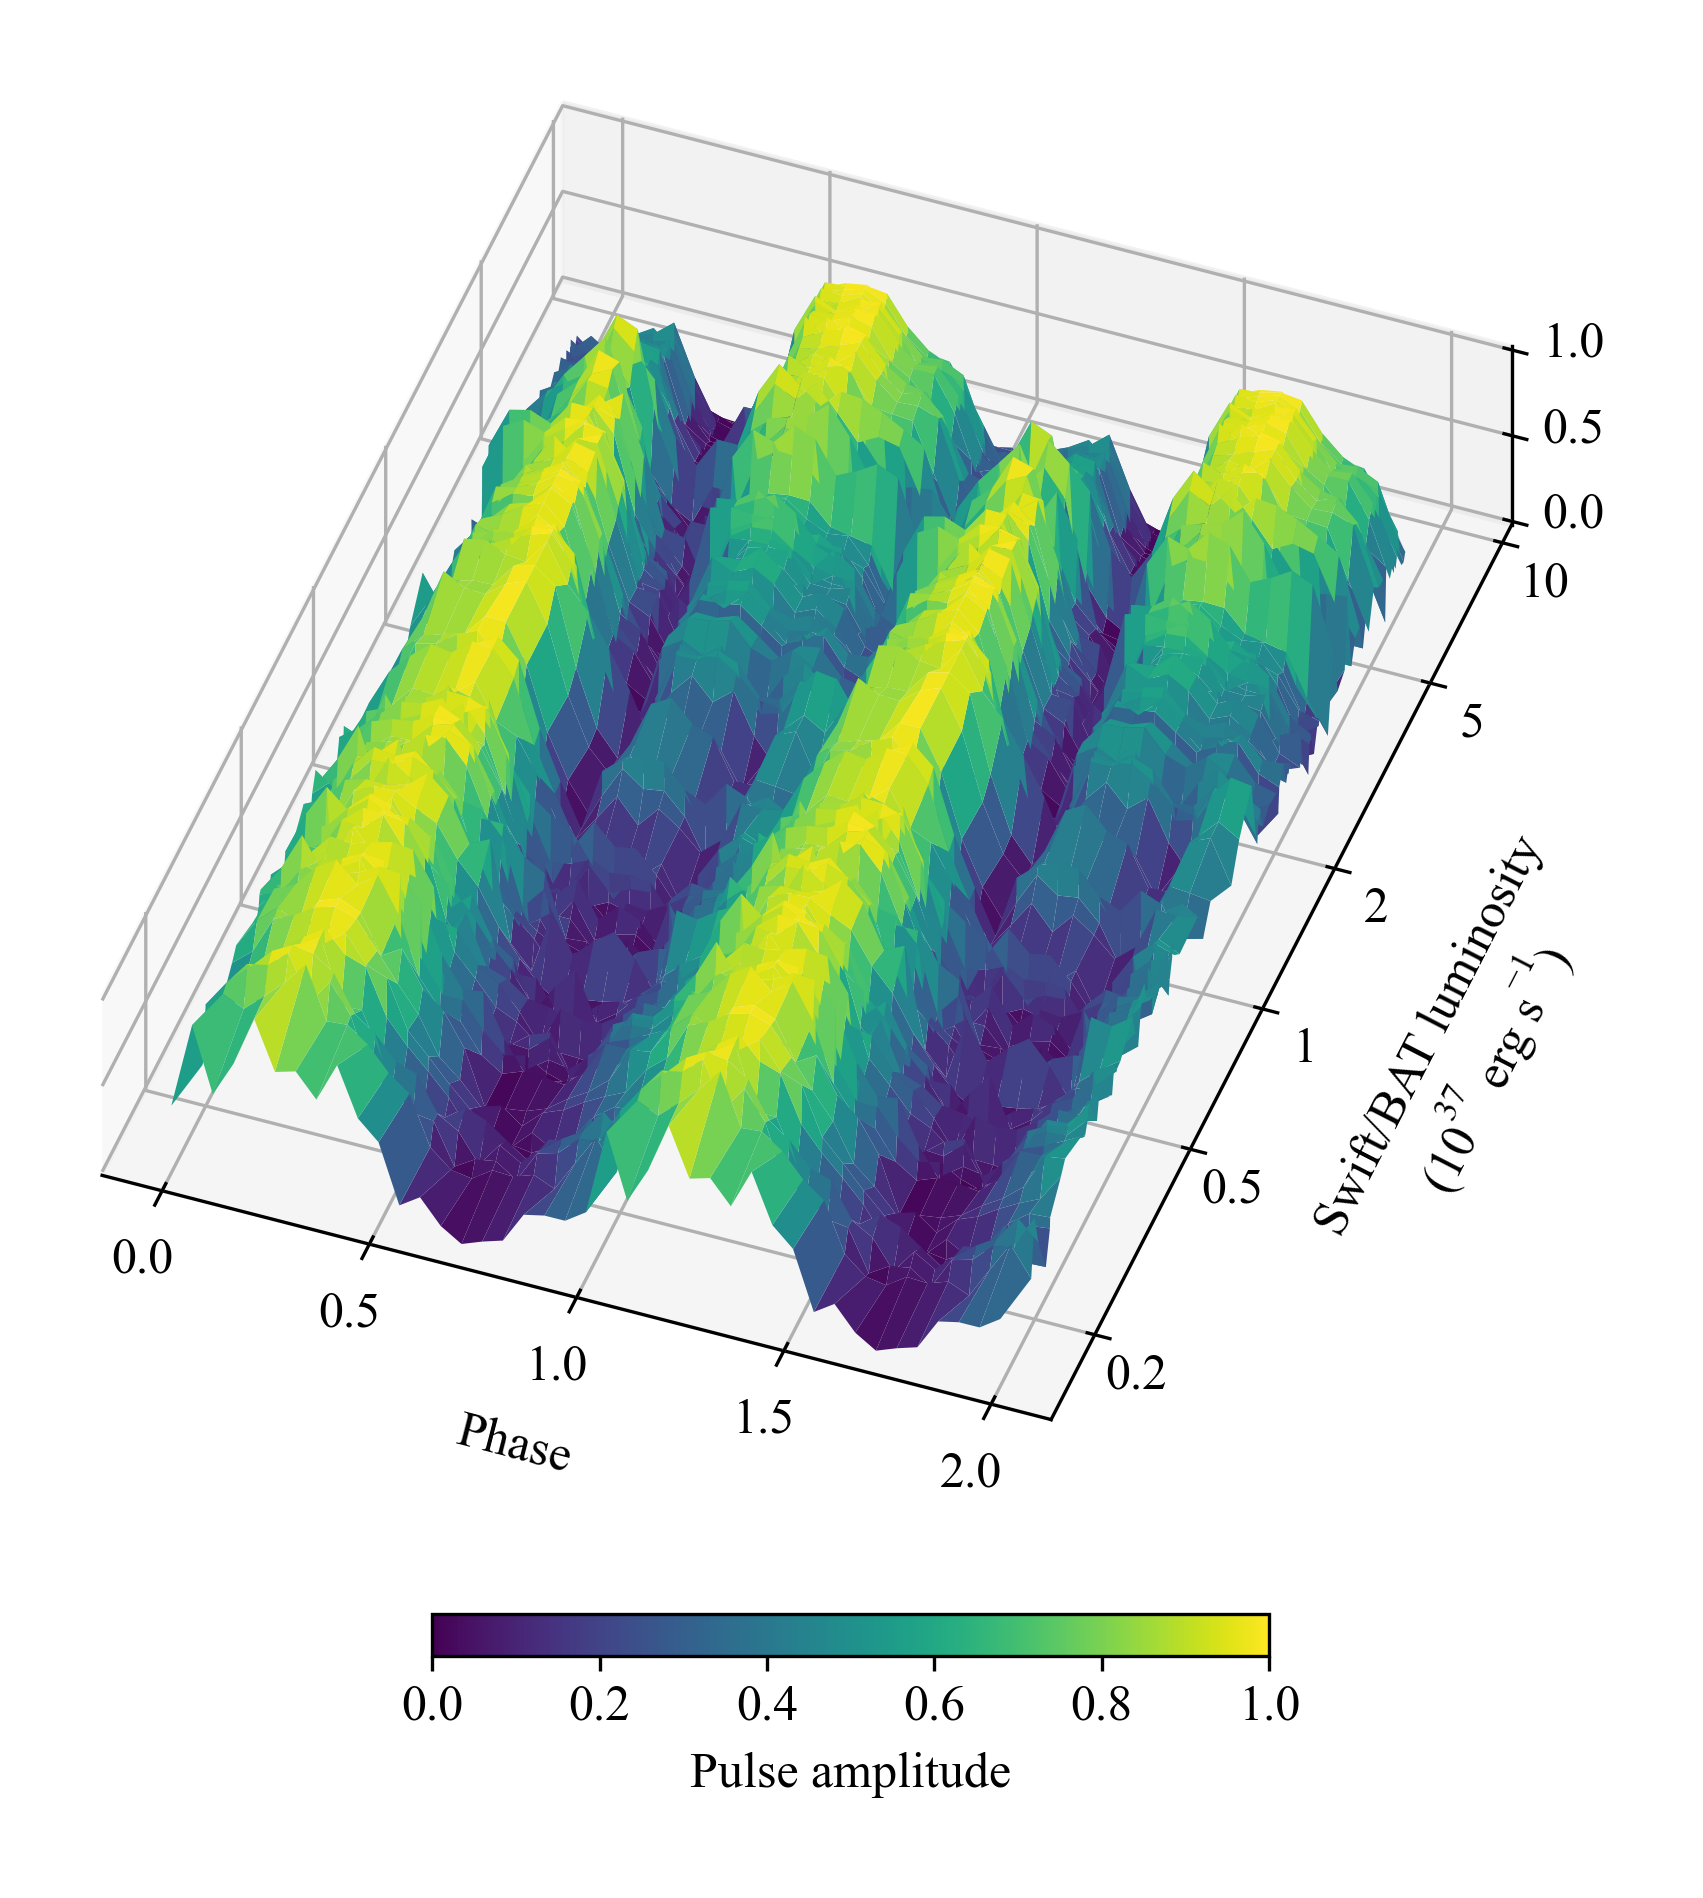
Interestingly, when the pulse profiles obtained from the timing analysis at low flux states are examined, the pulses seem to exhibit single-peaked profiles at very low flux levels. To illustrate this behaviour more clearly, we present the luminosity-sorted pulse profiles (normalized to [0, 1] range) of all observations after MJD 58300 in Figure 3. A systematic change in the profiles emerges at a luminosity level of erg s-1, marking a potential new transitional level for the alteration of the accretion geometry. As the luminosity decreases, the main peak gradually fades away and the secondary peak grows stronger. It is also interesting to note that the source tends to exhibit spin-down episodes below this luminosity level.
3.2 Timing noise
Using the whole frequency history enriched with NICER measurements, we investigate the temporal noise behaviour of Swift J0243.6+6124. To estimate the amplitude of the timing noise at different timescales, we proceed with the rms-value technique developed by Boynton et al. (1972); Deeter (1984); Cordes & Downs (1985). This technique utilises the rms values of the timing residuals that are acquired after eliminating the polynomial trend of order from the data set of duration . Then, the associated noise strength can be calculated via:
| (2) |
where specifies the red noise order, and denotes the unit noise strength normalization factor for d and . Our calculations are performed with the associated normalization factors gauged through direct evaluations (Deeter, 1984, Table 1). We start by estimating the noise strength of the maximal time span of the data and iterate the calculations for halved timescales ( for ). Then, we aggregate the noise strength measurements in each timescale into logarithmically-binned power density estimates. The uncertainties of power density estimates are determined from 1 confidence intervals, depending on the number of independent noise strength estimates enclosed during generation of the power density estimate in each timescale, as described in Deeter et al. (1987). The distribution of the power density estimates as a function of timescale (or analysis frequency ) generates a power density spectrum (PDS) of the spin frequency derivative fluctuations . We check for the stability of the PDS profile for different polynomial orders and proceed with the lowest stable order, , quadratic polynomial trends, for the input frequency series to characterize the regular spin evolution of Swift J0243.6+6124, assuming the residues after the removal of the trend constitute the timing noise. In order to check the validity of the power density estimates in each time scale, we also present the corresponding measuremental noise levels by taking the measuremental uncertainties of the frequency data set () into account (green crosses in Figure 5), which are calculated via . The measuremental noise level provides a precursor to a noise level at which the measuremental error range becomes dominant over the fluctuations in the data set.
In addition to the aforementioned standard method for PDS generation for torque fluctuations, we also follow the approach described in Serim et al. (2022) to see the effects of the accretion torques on the PDS. In principle, this approach offers a different perspective on the same PDS, with the only distinction being the minimization of torque fluctions arising from disk accretion. It should be noted that in both cases, the input frequency data set is already decoupled from orbital Doppler delays using the orbital parameters given in Table 1. Therefore, we assume that the orbital modulations in the frequencies are completely removed and they no longer contribute to the noise strength measurements. In this case, we utilise a simple power law relation between the spin-up rate and the luminosity, which is modified with a constant spin-down rate () to account for the stable spin-down episodes observed in the frequency history of the source. Then, the luminosity-dependent frequency evolution model is built as (Serim et al., 2022):
| (3) |
where is the spin frequency at the time of the burst onset . Instead of polynomial driven residuals built in the standard approach, the residuals obtained from the elimination of is assumed to inherit the noise component for this case (see Figure 4).
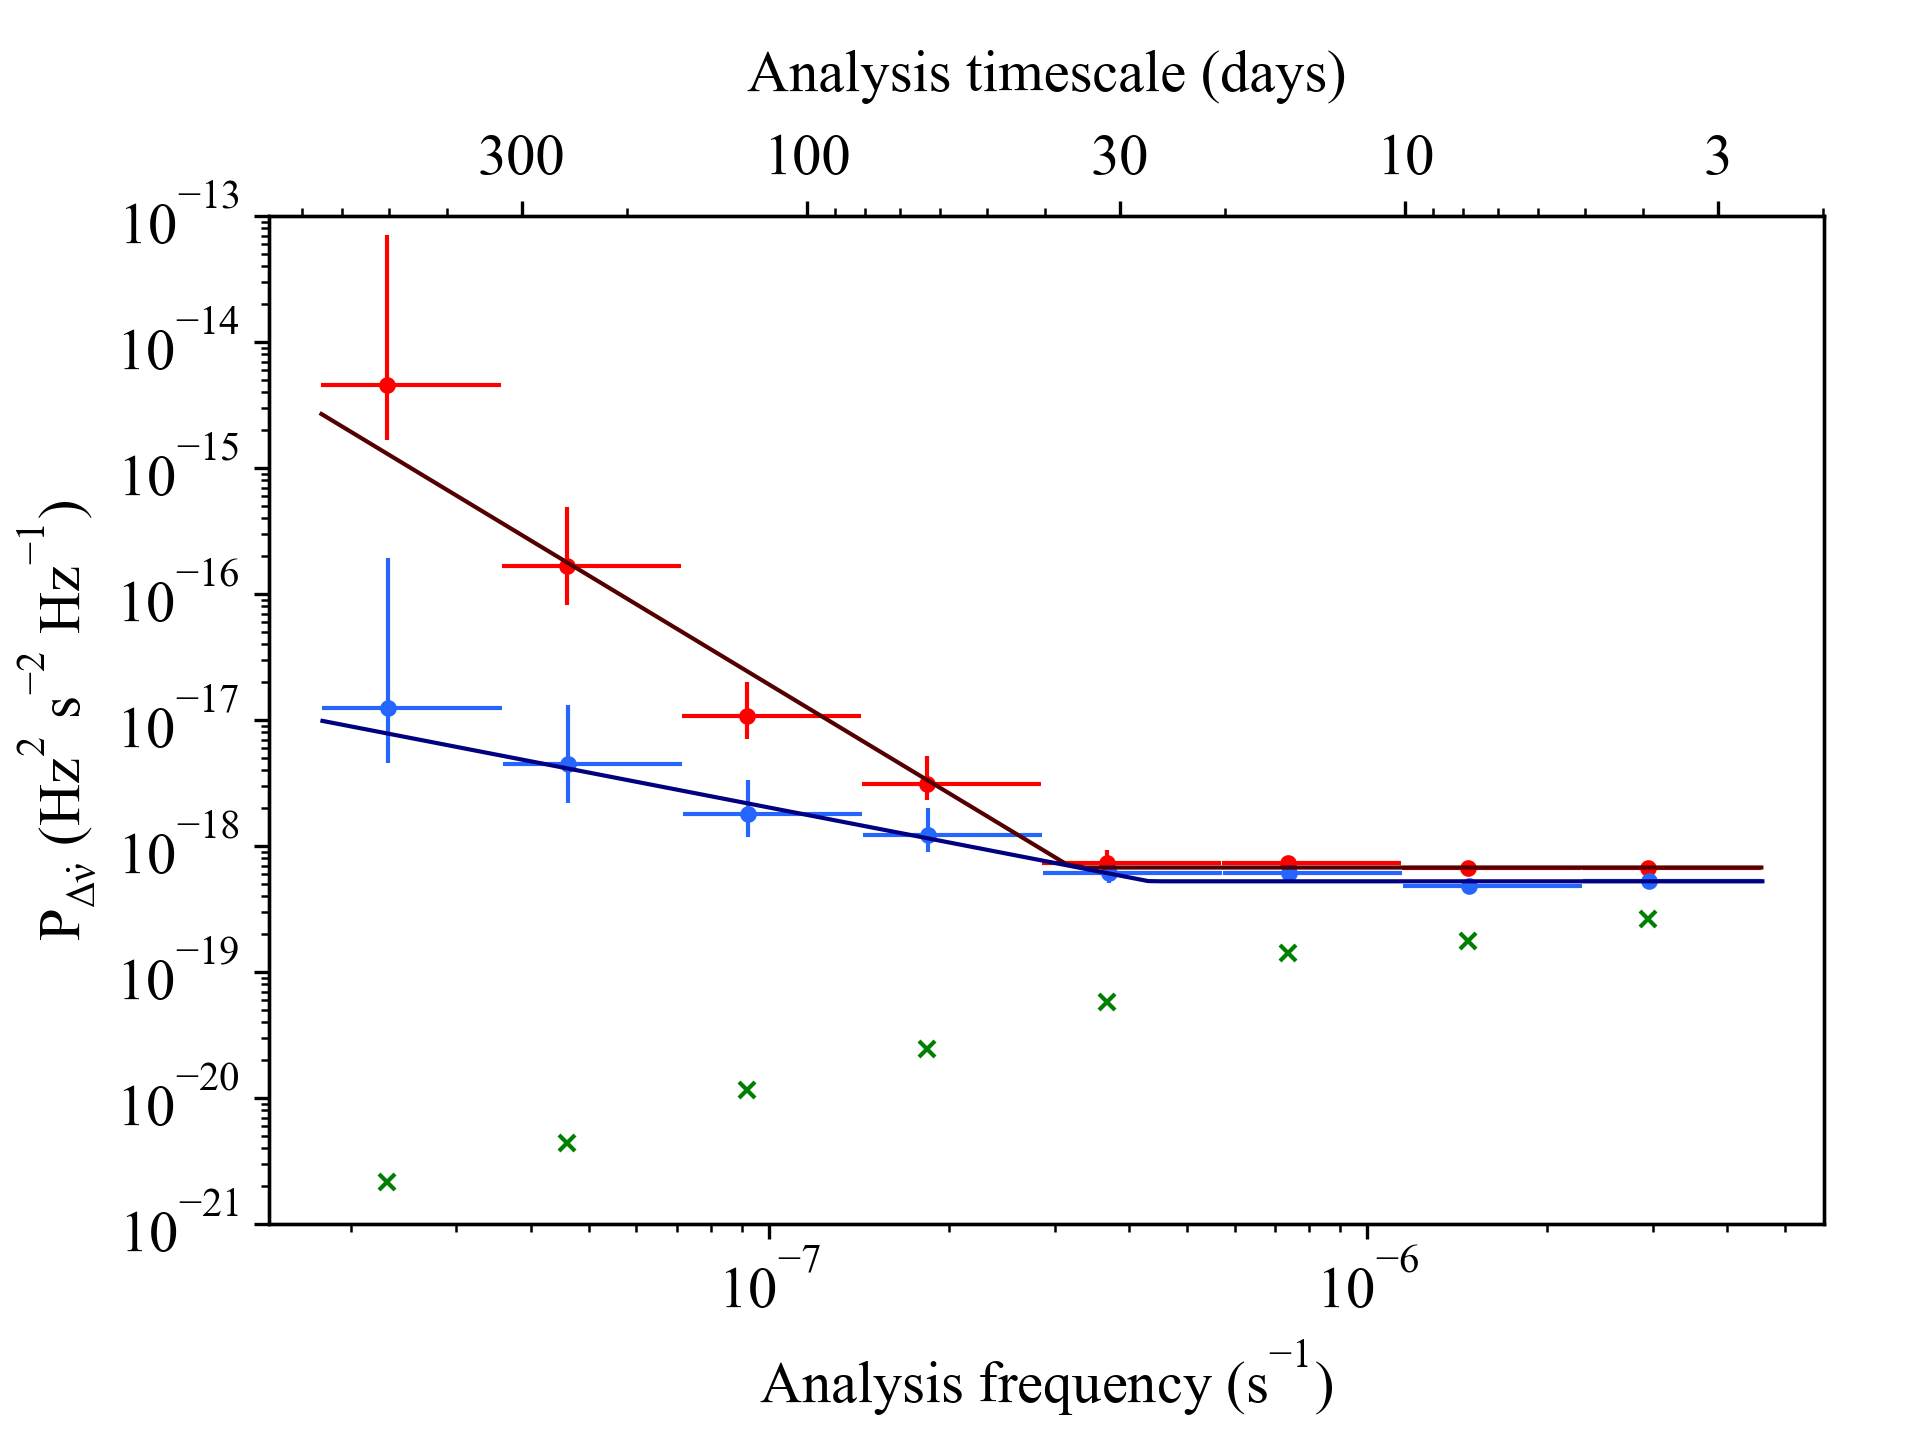
In both cases, generated PDSs of spin frequency derivative fluctuations are modeled with a broken power law model:
| (4) |
where is the break analysis frequency and is the power law index of the red noise component (Figure 5). The fitting procedure is carried out by orthogonal distance regression (ODR) using the Python library of SciPy. We report the uncertainties of the best fit parameters with confidence level.
For the standard approach, in which polynomial trends are used, we find that the PDS of the frequency derivatives is evolving as within the range days-1, which points out a steeper red noise component when compared with the other accreting sources (Bildsten et al., 1997; Baykal et al., 2007; Serim et al., 2022, 2023). The steepness of this red component is comparable to the case of 4U 1626–67 (Bildsten et al., 1997; Serim et al., 2023); however, the timescales within which they are observed are dissimilar. The PDS continuum break occurs at days-1 and evolves toward a flatter continuum at higher analysis frequencies (i.e., becomes a white noise component, S Hz2 s-2 Hz-1), implying uncorrelated torque fluctuations at shorter timescales. When the regular frequency evolution model is substituted for the luminosity-dependent model, the power density estimate at the longest timescale is reduced by a factor of 100. The steepness of the red noise component is also reduced to but it does not completely vanish unlike the case of 2S 1417–624 (Serim et al., 2022). It implies that either the luminosity-dependent model (at least through a simple power law relation) does not remove all of the red noise component of the PDS, or merely the standard disc component, which generally contributes to PDS spectra as (Bildsten et al., 1997; Serim et al., 2023), is subtracted from the PDS continuum. At higher analysis frequencies ( days-1), the PDS carries the same structure as the former case, with the white noise normalization S Hz2 s-2 Hz-1.
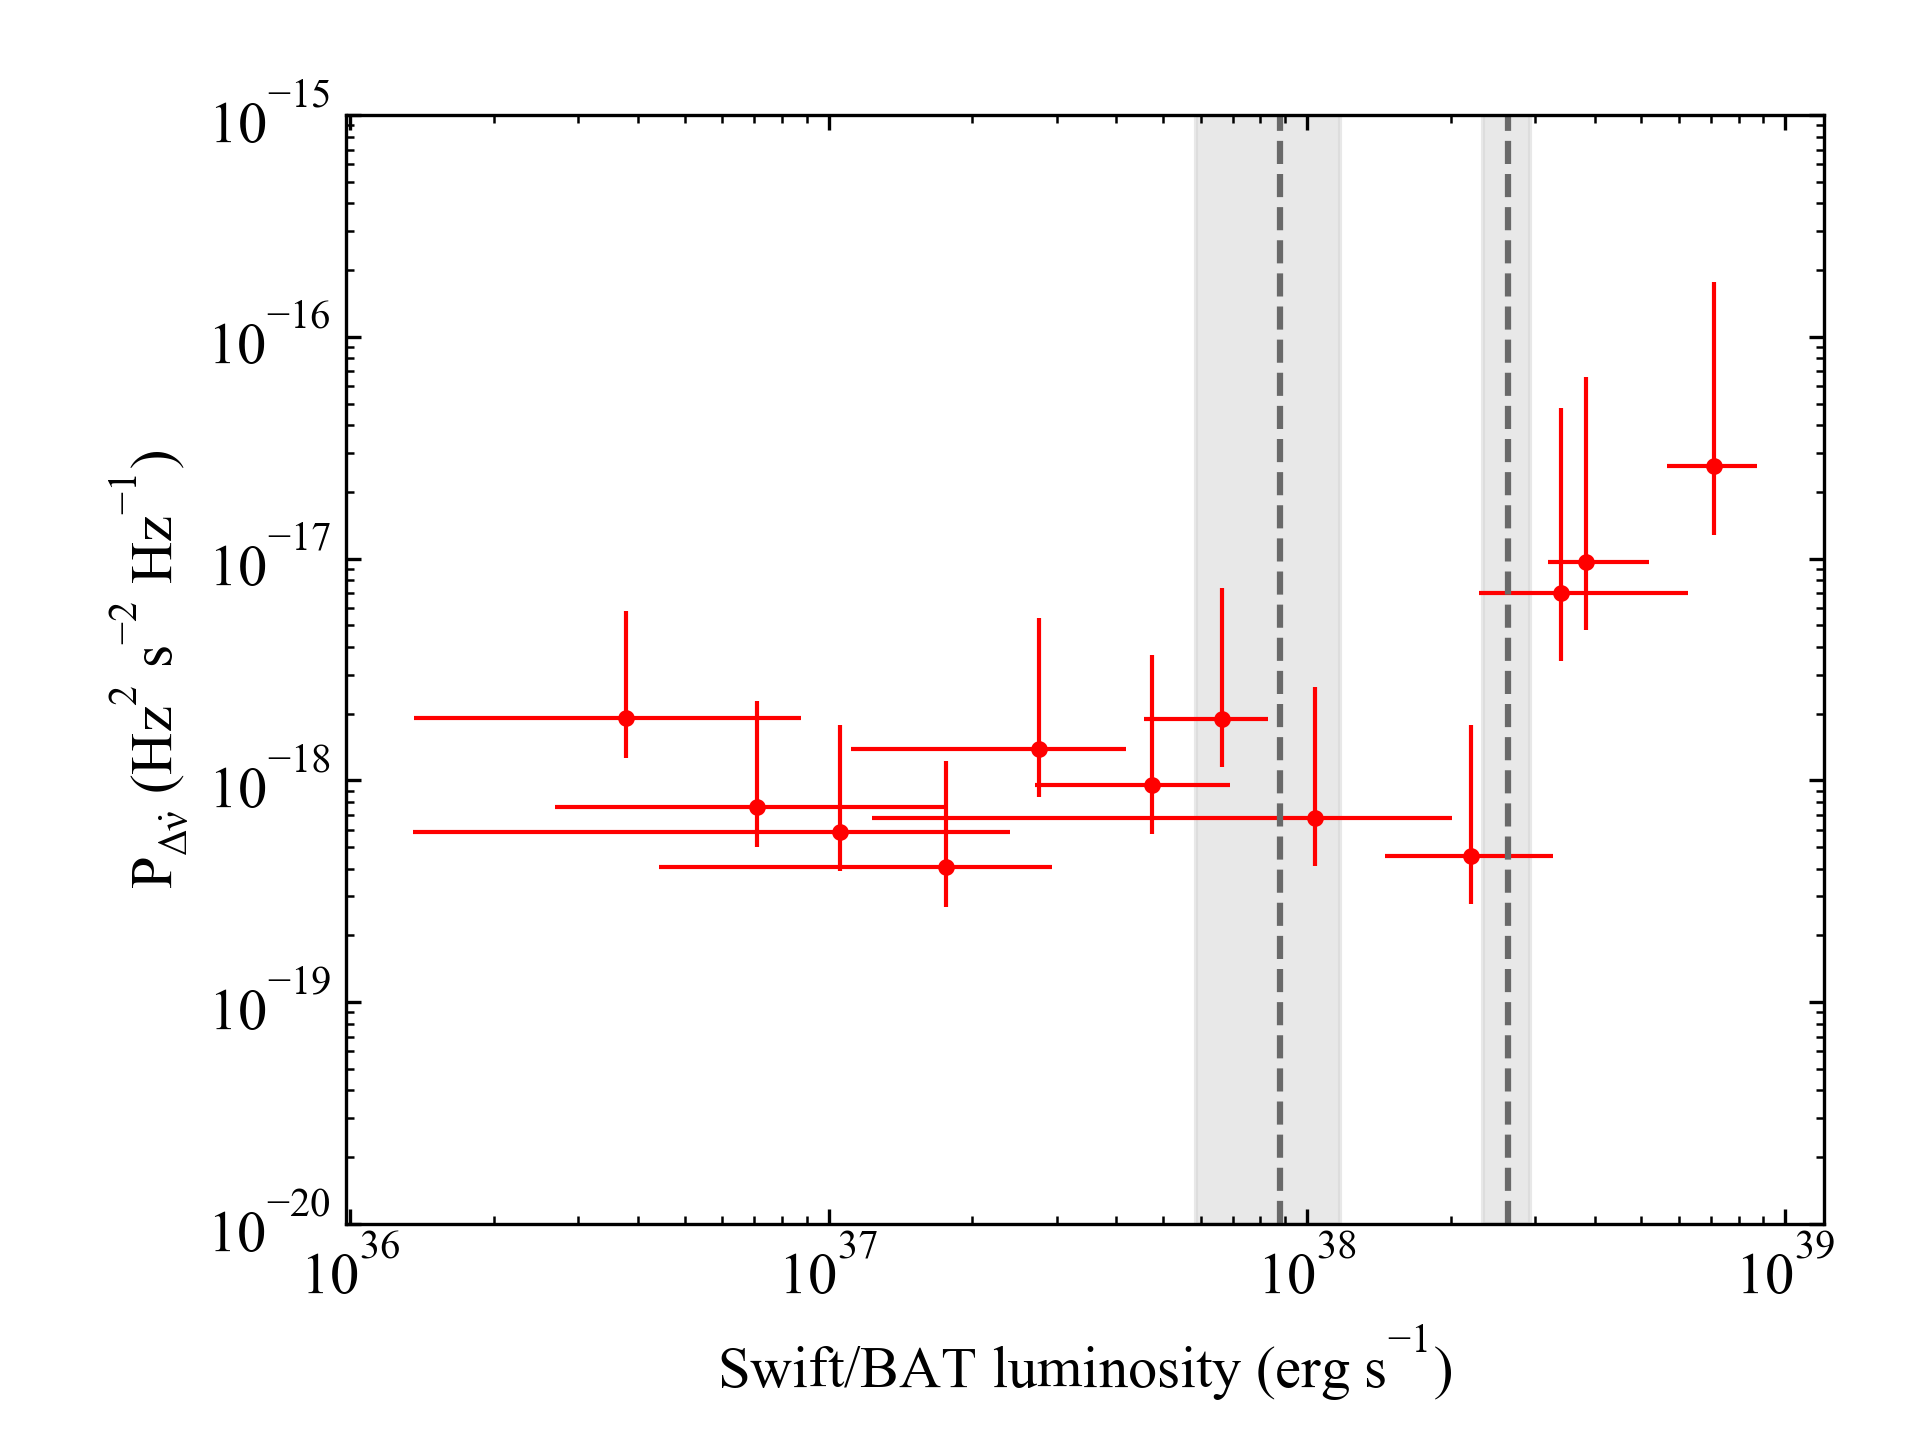
In order to understand the nature of the strong red noise component in the PDS of torque fluctuations, we further check the luminosity dependence of the timing noise strengths. Hence, we split the frequency history into 15 days long segments and calculate the noise strengths for each of them using the standard method described above. Next, using the Swift/BAT count rates, we calculate the luminosity range for each interval555See Section 2 for the conversion of Swift/BAT count rates to luminosity.. The distribution of the noise strength estimates as a function of luminosity is illustrated in Figure 6. The luminosity dependence of the noise strength estimates yields an intriguing distribution. The noise strength amplitudes remain more or less constant up to the transitional luminosity level with a slight de-escalation between and . The values significantly rise (by a factor of 10) above . It indicates a possible change in the nature of torque fluctuations above .
4 Discussion and Conclusion
We analyse the NICER/XTI data set and enrich the spin frequency history of Swift J0243.6+6124 with new measurements. The late-stage evolution of spin frequency indicates another torque reversal around MJD 58510, after which the source entered a new spin-down phase. When the frequency evolution of Swift J0243.6+6124 is examined, the spin-down phases seem to occur systematically at luminosities below erg s-1. It has already been shown that the source pulsations were observable at luminosities down to 1034–1035 erg s-1, implying that propeller stage is not yet attained at such low levels (Tsygankov et al., 2018; Doroshenko et al., 2020), and therefore the spin-down phase is not associated with propeller regime.
The pulse profile evolution of Swift J0243.6+6124 is very intriguing. At luminosities below erg s-1, the pulse profiles are single peaked. Between 7 1036 erg s, a secondary peak component emerges and gains strength with increasing luminosity; thus, the profiles become double peaked. Furthermore, when , the pulse profiles become single-peaked again. The transformation of the pulse profiles around erg s-1 indicates a new transition in the accretion geometry. According to Becker et al. (2012), the critical X-ray luminosity () specifies the onset of the transition from fan beam to pencil beam; however, the transition does not immediately take place. There is an intermediate accretion regime where the final phase of the deceleration of the accreted material is experienced through Coulomb braking in the plasma. In such a regime, a hybrid combination of both fan and pencil beam patterns is expected (Becker et al., 2012; Blum & Kraus, 2000). They specify a limiting luminosity below which Coulomb interactions are no longer effective enough to stop the accretion flow. This transition luminosity is given by:
| (5) |
where G is the dipolar magnetic field strength of the pulsar, is a dimensionless parameter accounting for various physical processes such as the possible role of plasma shielding, is the Thomson optical depth, is the pulsar mass, and km is the pulsar radius. Below this luminosity, the accretion flow is suggested to be decelerated via gas-mediated shock near the stellar surface and the radiation from the polar caps fully transforms to a pencil beam pattern. In addition, according to this model, the pencil beam pattern should also persist at lower luminosity levels (). Actually, such a single-peaked pulse profile was observed by Doroshenko et al. (2020) with an 80 ks NuSTAR observation around the luminosity level of 3 1034 erg s-1. If we consider the transition at erg s-1 as , neglecting the normalized dimensionless parameters of about unity and using typical neutron star parameters, then the magnetic field of the source can be estimated as G. Furthermore, when the previously reported critical luminosity level (Wilson-Hodge et al., 2018; Doroshenko et al., 2020), , of the onset of the transition from hybrid pattern to fan beam is updated for the same distance, it results in a magnetic field strength of G. Thus, magnetic field strength estimations obtained from both transitional levels become consistent at 5.2 kpc. Therefore, we suggest that the dipolar magnetic field strength of Swift J0243.6+6124 can be confined to a range of G.
On the other hand, we also investigated the PDS of the spin frequency derivative fluctuations using the fairly sampled spin frequency data set which is improved with new measurements obtained from NICER/XTI observations. We extract two different PDSs using different models to describe regular rotational evolution. The first one utilizes the standard polynomial-driven approach, and the second one makes use of a luminosity-dependent spin frequency evolution model. Both PDSs exhibit bimodal behaviour in which the high analysis frequency ( days-1 for the former, days-1 for the latter case) noise components are flat while the low analysis frequency components carry red noise. It should be noted that the observed break frequencies are rather close to the orbital period of the source (27.7 d). The white noise components in the PDS of the spin frequency derivative fluctuations are generally attributed to the uncorrelated torque fluctuations generated via wind accretion from the companion (Boynton et al., 1972; Deeter & Boynton, 1985; Bildsten et al., 1997; Serim et al., 2023). Hence, the high analysis frequency white noise component of Swift J0243.6+6124 may hint at the accretion from the stellar wind of its companion, which is effective on timescales less than the orbital period of the source. Nevertheless, the long-term spin evolution and fluctuations are governed by the disc interactions.
In general, for the sources that are presumed to have an accretion disc, the red noise continuum with dependence sets in at low timescales, which are possibly saturated at viscous timescales (Bildsten et al., 1997; Serim et al., 2023). Even though the number of studies is limited, the PDSs of the torque fluctuations of transient accreting sources demonstrate that steepness of red noise components also seem to occur as (e.g., SAX J2103.5+4545, Baykal et al. (2007); 2S 1417–624, Serim et al. (2022)). Utilizing the standard PDS generation method, we find that the steepness of the red noise component of Swift J0243.6+6124 is significantly higher () when compared with other accreting sources (Serim et al., 2023). Such a steep red noise component is only observed in ultra-compact binary system 4U 1626–67 (Bildsten et al., 1997; Serim et al., 2023) and in several magnetars (Woods et al., 2002; Çerri-Serim et al., 2019); however, the timescales in which the component arise are different than the case of Swift J0243.6+6124. To be more specific, the red noise component of the PDS of Swift J0243.6+6124 develops approximately on the orbital timescales, whereas the red noise in 4U 1626–67 is present on timescales longer than 1000 days (Bildsten et al., 1997; Serim et al., 2023). In the case of SGR 1806–20 and SGR 1900+14, the red noise components are observed on timescales longer than 100 days and the onset timescale of the red noise components are attributed to a threshold for which these magnetars become burst active (Woods et al., 2002). Therefore, we believe that the strong red noise component observed in Swift J0243.6+6124 originates from different physical processes than the aforementioned cases. To understand the nature of this component, we used the procedure described in (Serim et al., 2022) where the rotational evolution is prescribed by a simple torque model. In the case of 2S 1417–624 (Serim et al., 2022), this model almost completely eliminates the red noise component associated with disc accretion; however, for Swift J0243.6+6124, the results are slightly peculiar. The steepness is reduced from to but the red noise structure does not entirely vanish. This situation may originate from different factors. First, it is possible that the model used in Figure 4 provides an oversimplistic view for – correlation, thus more complex models (e.g., Karaferias et al. (2022)) are required to eliminate this component. Secondly, if the dependence has a physical origin, then it may indicate that dependence observed for the disc component is subtracted. Noting that the steepness and strength of the torque fluctuations are generally attributed to the nature of the magnetic field (Woods et al., 2002; Çerri-Serim et al., 2019), it is possible that the remaining red noise component might be of magnetic origin. Therefore, we further investigate the luminosity dependence of the noise strength estimations to inspect the nature of torque fluctuations at different levels (see Figure 6). We find that the noise strengths remain roughly constant up to the critical luminosity level , above which the RPD accretion disc regime sets in (Doroshenko et al., 2020). When the source luminosity exceeds , the noise strength estimates suddenly increase by a factor of 10, which suggest a possible change in the nature of torque fluctuations above this level. Moreover, it is recently shown that that the torque–luminosity relation of Swift J0243.6+6124 flattens at the RPD regime (Karaferias et al., 2022; Liu et al., 2022a). Hence, as the luminosity increases, the torque exertions become less efficient and more noisy, which may originate from the interactions with the quadruple components of the field (Long et al., 2007). In addition, the observed CRSF was evident only in certain pulse phases at the peak of the outburst, and it is attributed to the multipole component of the field (Kong et al., 2022). Thus, the excess noise strength above the transitional level bolsters the idea that multipole components should play an important role in torque interactions at super-Eddington luminosity levels (Doroshenko et al., 2020; Kong et al., 2022).
Acknowledgements
The authors thank the referee for their valuable remarks that assisted in the improvement of this manuscript. Authors acknowledge the support from TÜBİTAK (The Scientific and Technological Research Council of Turkey) through the research project MFAG 118F037. The authors also thank Prof. Dr. Sıtkı Çağdaş İnam for his insightful comments.
Data Availability
Whole X-ray data used in this study are publicly available. NICER/XTI data can obtained through the High Energy Astrophysics Science Archive Research Center (https://heasarc.gsfc.nasa.gov). Swift/BAT count rates can be acquired via Swift transient monitoring project (https://swift.gsfc.nasa.gov/results/transients/weak/) and Fermi/GBM frequency measurements are available at GBM Accreting Pulsars Project website (https://gammaray.msfc.nasa.gov/gbm/science/pulsars.html).
References
- Acuner et al. (2014) Acuner Z., İnam S. Ç., Şahiner Ş., Serim M. M., Baykal A., Swank J., 2014, MNRAS, 444, 457
- Bailer-Jones et al. (2018) Bailer-Jones C. A. L., Rybizki J., Fouesneau M., Mantelet G., Andrae R., 2018, AJ, 156, 58
- Bailer-Jones et al. (2021) Bailer-Jones C. A. L., Rybizki J., Fouesneau M., Demleitner M., Andrae R., 2021, AJ, 161, 147
- Baykal et al. (2007) Baykal A., Inam S. Ç., Stark M. J., Heffner C. M., Erkoca A. E., Swank J. H., 2007, MNRAS, 374, 1108
- Becker et al. (2012) Becker P. A., et al., 2012, A&A, 544, A123
- Bildsten et al. (1997) Bildsten L., et al., 1997, ApJS, 113, 367
- Blum & Kraus (2000) Blum S., Kraus U., 2000, ApJ, 529, 968
- Boynton et al. (1972) Boynton P. E., Groth E. J., Hutchinson D. P., Nanos G. P. J., Partridge R. B., Wilkinson D. T., 1972, ApJ, 175, 217
- Bykov et al. (2022) Bykov S. D., Gilfanov M. R., Tsygankov S. S., Filippova E. V., 2022, MNRAS, 516, 1601
- Cordes & Downs (1985) Cordes J. M., Downs G. S., 1985, ApJS, 59, 343
- Deeter (1984) Deeter J. E., 1984, ApJ, 281, 482
- Deeter & Boynton (1985) Deeter J. E., Boynton P. E., 1985, in S. Hayakawa and F. Nagase ed., Inuyama Workshop on timing analysis of X-ray sources. p. 29
- Deeter et al. (1987) Deeter J. E., Boynton P. E., Shibazaki N., Hayakawa S., Nagase F., Sato N., 1987, AJ, 93, 877
- Doroshenko et al. (2018) Doroshenko V., Tsygankov S., Santangelo A., 2018, A&A, 613, A19
- Doroshenko et al. (2020) Doroshenko V., et al., 2020, MNRAS, 491, 1857
- Gendreau et al. (2016) Gendreau K. C., et al., 2016, in den Herder J.-W. A., Takahashi T., Bautz M., eds, Society of Photo-Optical Instrumentation Engineers (SPIE) Conference Series Vol. 9905, Space Telescopes and Instrumentation 2016: Ultraviolet to Gamma Ray. p. 99051H, doi:10.1117/12.2231304
- Jaisawal et al. (2018) Jaisawal G. K., Naik S., Chenevez J., 2018, MNRAS, 474, 4432
- Jaisawal et al. (2019) Jaisawal G. K., et al., 2019, ApJ, 885, 18
- Karaferias et al. (2022) Karaferias A. S., Vasilopoulos G., Petropoulou M., Jenke P. A., Wilson-Hodge C. A., Malacaria C., 2022, arXiv e-prints, p. arXiv:2211.16079
- Kennea et al. (2017) Kennea J. A., Lien A. Y., Krimm H. A., Cenko S. B., Siegel M. H., 2017, The Astronomer’s Telegram, 10809, 1
- Kong et al. (2020) Kong L. D., et al., 2020, ApJ, 902, 18
- Kong et al. (2022) Kong L.-D., et al., 2022, ApJ, 933, L3
- Kouroubatzakis et al. (2017) Kouroubatzakis K., Reig P., Andrews J., ) A. Z., 2017, The Astronomer’s Telegram, 10822, 1
- Krimm et al. (2013) Krimm H. A., et al., 2013, ApJS, 209, 14
- Liu et al. (2022a) Liu J., Vasilopoulos G., Ge M., Ji L., Weng S.-S., Zhang S.-N., Hou X., 2022a, MNRAS, 517, 3354
- Liu et al. (2022b) Liu W., et al., 2022b, A&A, 666, A110
- Long et al. (2007) Long M., Romanova M. M., Lovelace R. V. E., 2007, MNRAS, 374, 436
- Malacaria et al. (2020) Malacaria C., Jenke P., Roberts O. J., Wilson-Hodge C. A., Cleveland W. H., Mailyan B., GBM Accreting Pulsars Program Team 2020, ApJ, 896, 90
- Reig et al. (2020) Reig P., Fabregat J., Alfonso-Garzón J., 2020, A&A, 640, A35
- Serim et al. (2022) Serim M. M., Özüdoğru Ö. C., Dönmez Ç. K., Şahiner Ş., Serim D., Baykal A., İnam S. Ç., 2022, MNRAS, 510, 1438
- Serim et al. (2023) Serim D., Serim M. M., Baykal A., 2023, MNRAS, 518, 1
- Sugizaki et al. (2020) Sugizaki M., Oeda M., Kawai N., Mihara T., Makishima K., Nakajima M., 2020, ApJ, 896, 124
- Tao et al. (2019) Tao L., Feng H., Zhang S., Bu Q., Zhang S., Qu J., Zhang Y., 2019, ApJ, 873, 19
- Tsygankov et al. (2018) Tsygankov S. S., Doroshenko V., Mushtukov A. A., Lutovinov A. A., Poutanen J., 2018, MNRAS, 479, L134
- Wang et al. (2020) Wang P. J., et al., 2020, MNRAS, 497, 5498
- Wilson-Hodge et al. (2018) Wilson-Hodge C. A., et al., 2018, ApJ, 863, 9
- Woods et al. (2002) Woods P. M., Kouveliotou C., Göǧüş E., Finger M. H., Swank J., Markwardt C. B., Hurley K., van der Klis M., 2002, ApJ, 576, 381
- Çerri-Serim et al. (2019) Çerri-Serim D., Serim M. M., Şahiner Ş., Inam S. Ç., Baykal A., 2019, MNRAS, 485, 2
- van den Eijnden et al. (2018) van den Eijnden J., Degenaar N., Russell T. D., Wijnands R., Miller-Jones J. C. A., Sivakoff G. R., Hernández Santisteban J. V., 2018, Nature, 562, 233