Interplay of viscosity and wettability controls fluid displacement in porous media
Abstract
Direct numerical simulations are used to elucidate the interplay of wettability and fluid viscosities on immiscible fluid displacements in a heterogeneous porous medium. We classify the flow regimes based using qualitative and quantitative analysis into viscous fingering (low ), compact displacement (high ), and an intermediate transition regime (). We use stability analysis to obtain theoretical phase boundaries between these regimes, which agree well with our analyses. At the macroscopic (sample) scale, we find that wettability strongly controls the threshold (at which the regimes change). At the pore scale, wettability alters the dominant pore-filling mechanism. At very small (viscous fingering regime), smaller pore spaces are preferentially invaded during imbibition, with flow of films of invading fluid along the pore walls. In contrast, during drainage, bursts result in filling of pores irrespective of their size. As increases, the effect of wettability decreases as cooperative filling becomes the dominant mechanism regardless of wettability. This suggest that for imbibition at a given contact angle, decreasing is associated with change in effective wetting from neutral-wet (cooperative filling) to strong-wet (film flow).
Keywords: Multiphase flow, Displacement patterns, Direct Numerical Simulations, Viscosity ratio, Wettability
I Introduction
Fundamental understanding of immiscible fluid-fluid displacements in porous media is vital for the safe and efficient operation of a large number of engineering applications. Examples include sequestration of carbon dioxide [1, 2], the fate of non-aqueous phase liquid contaminants (NAPLs) in groundwater [3, 4] and their remediation [5], geothermal energy [6, 7] and extraction of hydrocarbons [8, 9]. The displacement patterns are controlled by the interplay of capillary, viscous, inertial and gravitational forces, which in turn are controlled by a wide range of parameters, including flow rates, fluid properties (viscosity, density, surface tension), wettability, and medium properties (pore sizes, shapes and connectivity) [10].
The classical phase diagram of fluid displacement regimes predicts the transition between compact displacements, viscous fingering and capillary fingering patterns considering the capillary number (ratio of viscous to capillary forces) and viscosity ratio [11, 12]. These seminal works did not consider however the effect of wettability—the affinity of one fluid relative to another to adhere to the solid surface, measured via the contact angle . Instead, they considered only the extreme cases of drainage and imibibition for perfect wetting, that is the displacement of a perfectly nonwetting and wetting fluid, respectively. Recent works however expose the crucial impact of wettability, showing it substantially affects the pore filling mechanisms and thus the displacement patterns [13, 14, 15, 16, 17, 18, 19, 20].
To fill this gap, a few studies used numerical simulations to include the effect of wettability on displacement morphology. Primkulov et al. [21] used dynamic pore network modelling to decipher the interplay between wettability, viscosities and flow rates, extending the classical phase diagram in [11]. The authors considered an idealized porous medium made of cylindrical pillars, for which analytical expressions providing the advancement of the meniscus via various filling mechanisms can be established [22]. Lattice Boltzmann (LB) simulations were used to study the impact of wettability and viscosity on the displacement efficiency for viscous fingering, on a similar idealized medium [23]. A more realistic 3-D pore geometry, extracted from from micro-CT images of sandstone, was used in LB simulations to study how wettability and geometrical pore-scale heterogeneity affects the displacement, for two different viscosity ratios, favorable and unfavorable ( and , respectively) [24]. These works showed a transition from viscous fingering (VF) to compact displacement (CD) with increasing , and the existence of an intermediate (VF/CD) regime, akin to the transition regime between CF and CD found earlier at lower flow rates (lower ) by Hu et al. [18].
Here, we systematically explore the synergistic relationships between wettability and fluid viscosities in a geologically realistic medium under viscous-dominated flow. We use Direct Numerical Simulations (DNS), which allow consideration of the physics (solving the fundamental flow equations) for the intricate pore geometry derived from a micro-CT image of a sand pack. The high spatial and temporal resolution provided by DNS can capture sub-pore scale events such as interfacial readjustments [25, 19], cooperative filling [26], flow of films along the solid surfaces [27], and non monotonic behaviour of the capillary pressure [28, 29, 26]. This allows us to relate the large-scale features of invasion patterns and displacement efficiency to the pore-scale mechanisms controlling it. Our simulations capture the different displacement regimes (VF, CD and VF/CD) showing that the threshold for the crossover between the regimes increases with the wettability. We also establish the dependence of the dominant pore filling mechanisms on the combination of and wettability. In particular, we show that for imbibition at a given contact angle, the effective wettability changes with viscosity: from neutral-wetting (cooperative filling) to strongly-wetting (film flow) with decreasing .
II Mathematical Model
II.1 Governing equations
In DNS, the isothermal flow dynamics of immiscible and incompressible multiphase flow systems are governed by the Navier-Stokes equations, solved for each fluid phase, where the fluid-fluid interfaces boundary conditions that ensure continuity in the velocity field are set. The stress gradients can be computed via the Young-Laplace equation [30]. Though this approach provides the interface dynamics, it is computationally demanding as it requires solving for a complex moving boundary problem. The Volume of Fluid (VOF) method simplifies the computations by considering the two fluid phases as a single mixture [31]. This is done by defining a colour function which indicates the volume occupied by a specific fluid in a control volume: when is equal to 0 or 1 the volume is occupied by a single phase, whereas indicates the co-existence of two fluids seperated by at least one fluid-fluid interface. VOF then solves for conservation of both mass
| (1) |
and momentum
| (2) |
In Eqs. 1–2, U is the velocity, is time, is pressure, and are the external body (for example: gravity) and capillary forces, respectively. Superscript denotes a transpose. Considering a single mixture, its properties are assumed to be a linear combination of the two fluids comprising it; for example, denoting the wetting phase by , the density and the dynamic viscosity of the mixture are
| (3) | |||
The capillary forces are
| (4) |
where is the surface tension, is the interface curvature, is the unit normal to the interface and is a Dirac delta function, which is used to restrict the capillary forces to act only at the interface. Various VOF formulations can be used to define how the normal to the interface and the Dirac delta function are discretized, see Pavuluri et al. [32]. In this work we use the conventional Continuum Surface Force (CSF) formulation [33], in which from Eq. (4) are approximated by the gradient of the color function , providing
| (5) |
The interface curvature is computed as,
| (6) |
Closure to the system of equations is provided by the following advection equation for the color function:
| (7) |
II.2 Numerical Implementation
We use the VOF method implemented in OpenFOAM® (https://openfoam.org) with the interFoam solver, where the domain is discritized in space using the finite volume method, using an Eulerian mesh. The field variables such as velocity U, pressure and color function are stored at the cell centers. Time is discritized by first order Euler scheme. The gradient terms are discritized using Gauss linear scheme, of second order accuracy. The advection term in the Navier-Stokes equation (second term in the left hand side of Eq. (2)) is solved using the limited linear difference scheme. As the color function is required to be bounded, vanLeer scheme [34] is used for the advection of the color function in Eq. (7). As many other numerical schemes, VOF suffers from numerical diffusion and smearing of interfaces, that arises from solving the discretized advection equation of the color function. To reduce this numerical artefact, an additional term is added to Eq. (7), where the so-called compression velocity is approximated as [35]. is the compression coefficient set to one based on the studies of Deshpande et al. [36], Hoang et al. [37], Ferrari and Lunati [38], refers to the velocity in a specific control volume and max() refers to the maximum velocity in the entire porous medium. The term restricts the compression velocity to act only at the interfaces.
The pressure-velocity coupling in the Navier-Stokes equations are solved using the Pressure Implicit with Splitting of Operators (PISO) algorithm [39]. To generate the discretized pore space for the simulations, we first use a rectangular mesh with cell size of , and then re-meshed using the snappyHexMesh library of OpenFOAM®. The time step size is chosen based on the Brackbill number where is the average density of fluids in the domain and is the cell size [33]. To reduce computational runtime, we set the time step size , which for our settings provides . The parameters describing the physical properties are provided in Section II.3.
II.3 Settings and parameter Values
We simulate displacement in a geologically-realistic medium, obtained from a 2-D cross section of micro-CT image of a sand pack [40] Fig. 1. While our 2-D model geometry can represent sub-pore pore filling mechanisms in the plane, such as film flow along solid surfaces of the particles (filling the entire gap thickness in the direction), it cannot represent flows in the out-of-plane () direction, where only part of the gap is filled. Thus, our model excludes corner flows [41, 42] and wetting layer formation along the top and bottom plates. These mechanisms become important for the invasion of strongly wetting fluid (“strong imbibition”) and strongly non-wetting fluids (“strong drainage”, at high ) at [15, 21]. The simulated sample has a porosity of and dimensions are 6.75 mm and 14.05 mm in the and direction. It is discretized into 145000 cells using the snappyHexMesh library of OpenFOAM®. The zoom-in shows the intricate nature of the geological media, with highly nonuniform pore bodies and throats, and dead ends (Fig. 1b). The mesh contains both Cartesian and non-Cartesian cells; non-Cartesian cells are used close to the boundaries with the solid grains, to capture the orientation of the pore spaces.
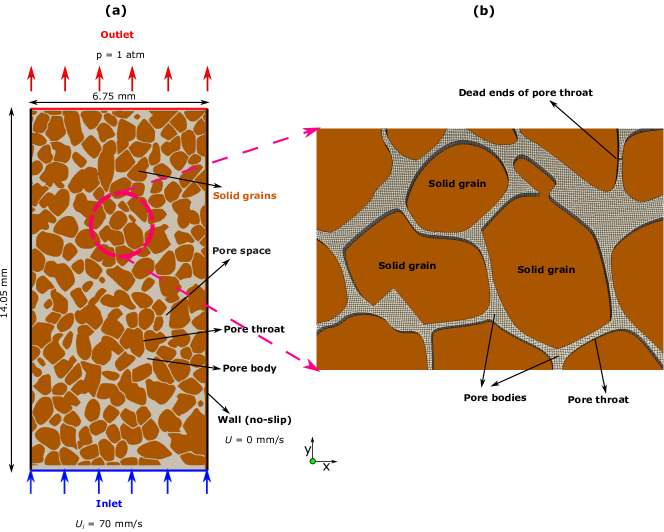
The boundary conditions are fixed injection velocity of the invading fluid at the inlet face at , fixed pressure atm at the outlet, and no-flow at the other two (lateral) boundaries (Fig. 1a). The surfaces of solid grains are subjected to no-slip boundary conditions. The interface normal pointing towards the invading phase orients the interface according to , where is the normal to the solid grain surfaces, is the tangent to the solid grain surfaces and is the equilibrium contact angle that the injected phase makes with the solid surfaces [33].
We vary the contact angle in the range of with increments. Here, refers to the equilibrium contact angle that the injected fluid makes with the solid surfaces. Imbibition and drainage refer to and , respectively. At (“strong imbibition”), the injected fluid perfectly wets the solid surfaces. At (“strong drainage”), the injected fluid is perfectly nonwetting, such that it repels from the solid surfaces. The viscosity ratio, , was varied between 0.01 and 100, by setting the maximum viscosity of one fluid to and tuning the viscosity of the other. Here and are the viscosities of the invading and defending fluids, respectively. We set the density of both fluids to , and the surface tension to . The capillary number, defined here as was fixed at . We chose this value in order to focus on viscous-dominated flow, vs. the capillary-dominated flow at investigated elsewhere [11, 43, 44]. The total number of simulations were 90: 10 values of and 9 values of . Simulations were run using parallel computations with 16 Intel Xeon E5-2690 processors (clock speed 2.60 GHz). With that, simulating 1 physical second of flow requires runtime of 3.5 hours.
II.4 Image processing for quantitative analysis of patterns
Quantitative analysis of the observed patterns at breakthrough is done using two characteristics: (i) the displacement efficiency , which is the volume of the displaced defending fluid normalized by the total pore volume; and (ii) the fractal dimensions , an estimation of the roughness of the interface, which we compute using the box-counting method [45]. The fractal dimensions in 2-D is bounded at , where and represent the highest possible roughness and a completely compact interfacial morphology, respectively. These computations are done on a binary format (white for the injected fluid, black for everything else). Conversion of the invasion images into binary format was done using Fiji software [46].
III Results
III.1 Displacement Patterns
We begin with a qualitative analysis based on the visual appearance of the patterns, followed by quantitative characterization using fractal dimension. Figure 2 shows the simulated patterns at breakthrough for the 90 conditions (varying independently and ) considered here. The displacement patterns change from viscous fingering (VF) to compact displacement (CD), with an intermediate regime (VF/CD) exhibiting a mix of features from both. VF, characterized by long and narrow fingers, emerges at irrespective of . This was also observed in [21], however at . At , the invading fluid fills most of the pore space leading to CD, again irrespective of . At intermediate values of , a transition between VF and CD occurs; the value for the transition among the regimes depends on . The fluid fingers in imbibition are slightly wider compared to those in drainage, also observed in [23]. This is due to the increased tendency of the invading fluid to minimize contact with the solid surfaces in drainage.
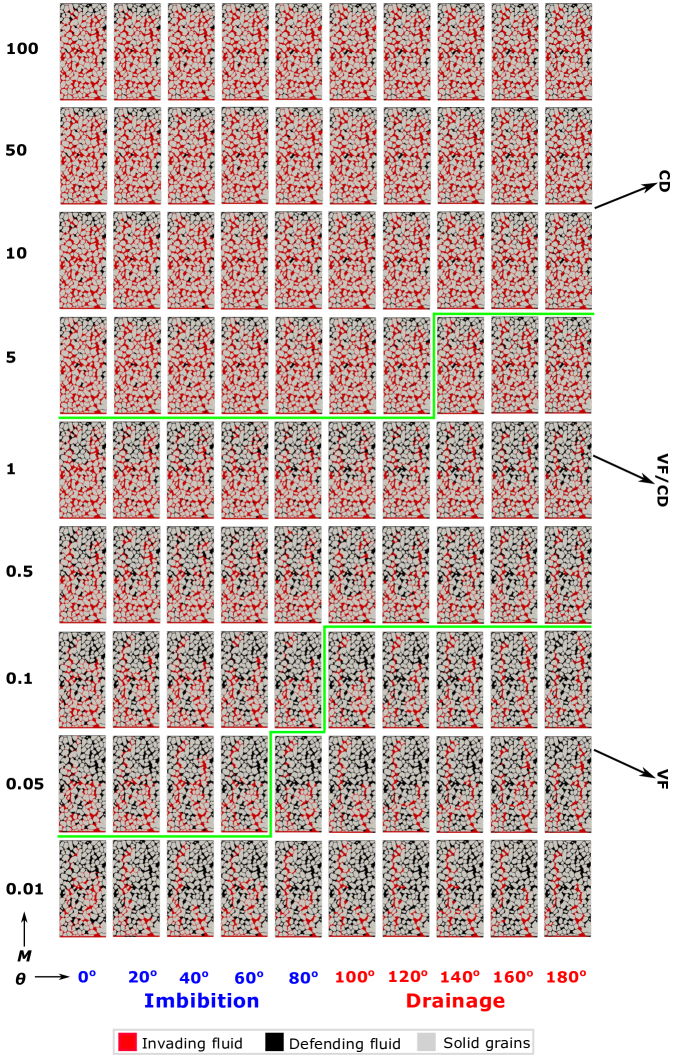
Supporting material provides three videos of the invasion processes occurring at for (VF, Video 1), 1 (VF/CD, Video 2) and 100 (CD, Video 3). For (Video 2), we notice the developed fingers propagating ahead of the compact displacement front. This displacement pattern eventually results in showcasing the traits of both VF (towards the outlet) and CD (towards the inlet).
Next, we analyze the patterns quantitatively, using (a) the displacement efficiency ; and (b) the fractal dimensions . The more compact, less preferential invasion is characterized by larger and (Fig. 3). Consequently, as the invading fluid becomes more wetting i.e. as decreases, both and increase, in most cases regardless of . Similarly, for a given , increasing stabilizes the displacement thus increasing and . The efficiency increases from % at and (drainage at non-favorable viscosity ratio, VF) to % at and (imbibition at favorable viscosities, CD).
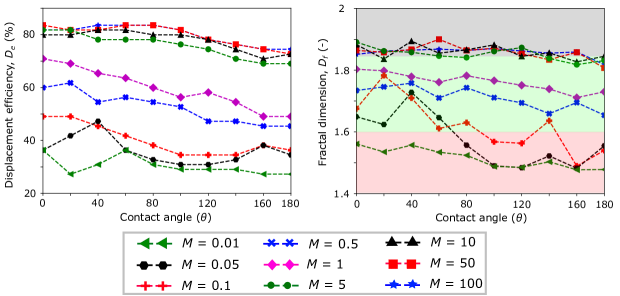
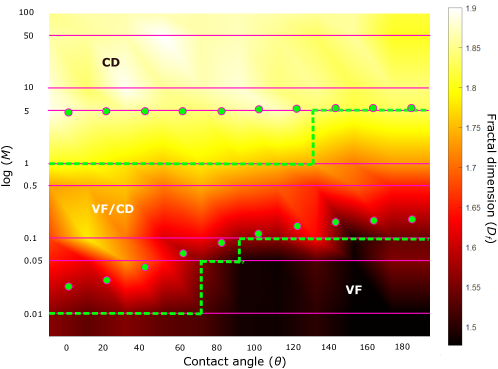
Combining the qualitative classification of the 90 simulated patterns (based on visual appearance, cf. Fig. 2) with their values, allows us to establish the corresponding range of values for each regime: for VF, for intermediate (VF/CD) regime, and for CD; our values agree well with published values for these regimes [47]. Plotting these in the form of a phase diagram, provides a quantitative estimation of the phase boundaries between regimes (dashed green line in Fig. 4). These phase boundaries (dashed green line) agree well with theoretical values obtained using the classical stability analysis by Saffman and Taylor [48] (plotted as green dots in Fig. 4); for derivation details see Appendix A. The value of at the boundary between regimes increases with , in particular for the crossover between VF and VF/CD (Fig. 4).
III.2 Pore Filling Mechanisms
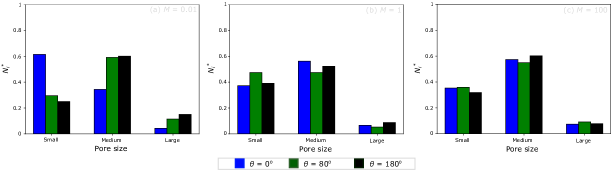
The pore-scale mechanisms, controlling the manner by which pores are filled, eventually dictate the larger, sample (macroscopic) scale patterns. Valuable information about these mechanisms is obtained here by analysing the pore size distribution (PSD) of the invaded pores. The pore sizes are determined using the distance transform watershed method, according to the maximum diameter of an inscribed circle which fits in them [49]. We classify pores into 3 size groups: small for , medium for and large for . The number of invaded pores (normalized by the total number of invaded pores) for different pore size distributions and for nine combinations is shown in Fig. 5. This demonstrates the strong effect of wettability at small (unstable) viscosity ratio, (VF; Fig. 5a). In contrast, it shows the small effect of in stable, compact displacement, with (CD; Fig. 5c). It is also interesting to examine the PSD symmetry: the invaded PSD is relatively symmetric (and uniform) for , slightly skewed for , and strongly skewed for at strong imbibition () (Fig. 5). To explain this, we further analyse the pore filling mechanisms during individual invasion events.
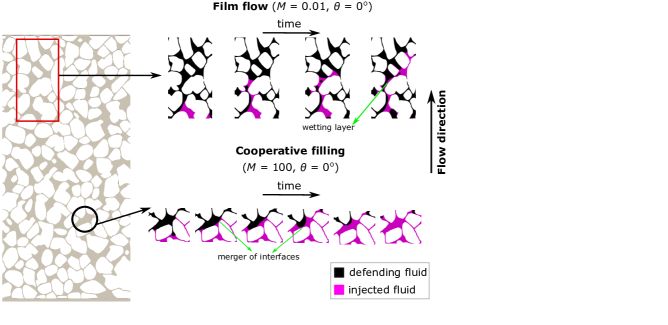
We investigate the pore filling mechanisms in a small region composed of a few pores both qualitatively (visually) and quantitatively through the evolution of the local capillary pressure . The local capillary pressure, where and are the volume-average non-wetting and wetting phase pressure, respectively, is computed as where and is the volumes of the computational cells within the analyzed region. We track the evolution of the local pressure vs. the local wetting phase saturation . The latter is normalized by the maximum attained as the invading fluid reaches breakthrough on all four boundaries of the window of observation (red rectangle in Fig. 6). In imbibition, we find that pores are filled primarily by two mechanisms: (i) film flow and (ii) cooperative pore filling, depending on the viscosities (Fig. 6). At (VF), the wetting phase advances as thin films coating the solid surfaces [15] (Fig. 6b). With this mechanism, the invasion progresses predominantly through smaller pores, in accordance with the PSD analysis (Fig. 5a.) The evolution of shows a decreases in magnitude upon imbibition (i.e. increasing ), see Fig. 6d, which can be due to the formation of wetting layers that eventually results in the formation of smaller interfacial curvatures . At moderately-high of , cooperative filling becomes the dominant mechanism (Fig. 6c), resulting in a more stable, compact front. This mechanism fills the various pore sizes more uniformly than at , as can be seen by comparing the PSD of filled pores in Fig. 5b–c (moderately-high ) vs Fig. 6a (). The local pressure drops (by 500 Pa) until as the invading fluid reaches the entrances of the pore body. As the invasion continues, several interfaces merge which increases at . Following that, cooperative pore filling continues and reaches a steady value as the average menisci curvature during these events does not change significantly.
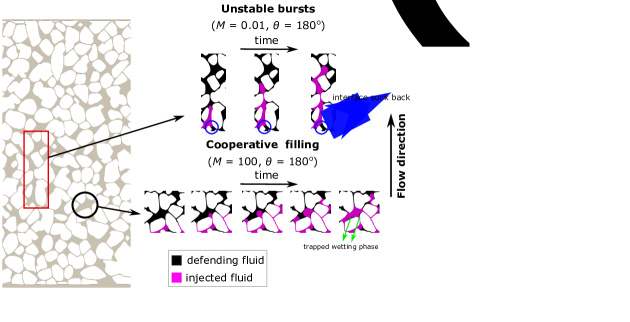
For strong drainage (), the two dominant pore filling mechanisms are (i) intermittent local jumps (“bursts”) and (ii) cooperative filling (Fig. 7). At , the pores are filled by a sequence of localized bursts, leading to VF (Fig. 7b). As in this regime viscous forces dominate over capillary forces, the location of invasion depends more on the global pressure gradients controlled by pore connectivity and less on the local pore sizes. This is why the PSD in this case is relatively uniform (Fig. 5a). The local pressure decreases as drainage progresses (decrease in ; Fig. 7d). This can be explained due to the formation of menisci that remain stagnant due to interfacial readjustments and the evolution of the curvatures of the invading fluid front. As increases, cooperative filling becomes dominant, making the displacement pattern more compact (Fig. 7d), and increasing the uniformity of invaded pore sizes (5b–c). While the mechanism seems similar to that in imbibition at high , in drainage as the invading fluid is less wetting it does not completely displace the defending (wetting) fluid which remains trapped in small pockets (Fig. 7c). Unlike cooperative filling in imbibition where as the interfaces reach entrance to the pore body, in drainage the tendency of the invading fluid to repel from the solid surfaces and invade mainly the larger pores results in maintaining a finite interfacial curvature at all times (vs. in imibibition), cf. Fig. 7e. Here, decreases as the invading fluid fills the pore bodies (), with a very moderate rise after interfaces merge.
The presented analysis of pore filling mechanisms provides an interesting link between the effective wettability conditions and the viscosities, . Published simulations and experiments observed cooperative filling at intermediate wet conditions [50, 51, 15]. Our simulations suggest that changes the effective wettability, and thus the dominant mechanism: from cooperative filling at moderate and high to film flow (during imbibition) and bursts (during drainage) at low .
IV Summary and Conclusions
We leverage high-resolution Direct Numerical Simulation (DNS) to uncover the synergistic impact of wettability and viscous forces in viscous-dominated multiphase flow through a heterogeneous geologically-realistic porous media. We present a phase diagram classifying invasion patterns into viscous fingering (VF), compact displacement (CD), and intermediate regime (CD/VF), with a transition from compact upstream to VF downstream. At the macroscopic (sample) scale, the wettability of porous media plays a pivotal role in controlling the crossover between regimes. Our simulations indicate an increase in threshold (at which the crossover between regimes occurs) as wetting properties vary from imbibition to drainage. Wettability was also found to affect the pore filling mechanisms. For low (VF), film flow dominated during imbibition and bursts during drainage. This strong effect of wettability over the pore-filling behavior diminishes as increases: cooperative filling was found to be dominating in CD irrespective of wettability. This change in mechanisms indicates a change in effective wettability conditions from neutral-wet to strong-wet, respectively. These intriguing effects of viscosity on effective wettability should be considered in modeling multiphase fluids of similar viscosities, which is of interest to applications such as non-aqueous phase liquid (NAPLs) contamination and enhanced hydrocarbon recovery.
Appendix A Derivations of phase boundary from linear stability analysis
Here we describe the evaluation of the theoretical phase boundaries (green dots in Fig. 4) using the linear stability analysis by Saffman and Taylor [48]. Considering the fluid flow potential , the continuity equation Eq. 1 for each individual phase can be written as
| (8) |
With this, force balance becomes [48]
| (9) |
where represents the location of the perturbed displacement (finger) front relative to the base state—the interface morphology before fingers develop. Here, is the growth rate of the perturbations and is the wavenumber indicating the number of periodic disturbances in the developed finger (see further details in Saffman and Taylor [48], Rabbani et al. [52]). The effective permeability of the injected fluid can be approximated as where is the pore radius, are the total number of pores in the considered porous medium [52]. is determined from the number of pores occupied by the invading fluid in Fig. 5c at (CD), using the distance transform watershed method in Fiji software [49]. At , 140 pores are invaded (see Fig. 5c) for efficiency (see Fig. 3a); extrapolating provides a representative value of . in the expression for is determined empirically to be . The product is the approximate area occupied by a single finger, where and are the length and width of the finger, respectively. We assume and where is the length of the porous media over which the fingers develop and is the effect of tortuosity [53]. For VF, as the fingers are of the size of the entire domain length, we use . For VF/CD, as the fingers roughly exist over half the length of the porous medium, we use . To account for the effect of tortuosity, we use . For VF, and for VF/CD, . We normalize by the area (medium dimensions). is an empirical parameter used to determine such that in Eq. (11) does not become negative. We obtain for VF, for VF/CD are the average displacement efficiencies. Assuming a proportionality between the effective permeabilities of the two fluids [54], we manipulate Eq. (9) to obtain
| (10) |
The crossover between flow regimes is expected to occur when [52]. Substituting in Eq. 10 provides the following condition
| (11) |
In the above equation, is determined empirically. For VF, the invading fluid propagates through the porous medium in the form of thin fingers. Therefore, most of the pores remain occupied by the defending fluid. As the effective permeabilities are function of phase saturation [54], this imply that the transition from VF to VF/CD occurs at . For this case, we assume . While considering VF/CD to CD, more than half of the porous medium is occupied by the invading fluid essentially making . For this case, we assume . Substituting all the above variables in Eq. (11) gives the threshold viscosity ratio (the boundary between regimes) at which transition between flow regimes occur indicated by green circles in Fig. 4. We note that the threshold increases with , in particular for the crossover between VF and VF/CD (Fig. 4). Interestingly, for the idealized geometry in Primkulov et al. [21] the transition from VF to CD occurred at irrespective of the wettability, without an intermediate VF/CD regime which could potentially be due to the relatively simplistic nature of the models used in PNM.
Acknowledgements.
HR acknowledges support from Texas A&M University at Qatar and Qatar Foundation. RH acknowledges support from the Engineering and Physical Sciences Research Council (EP/V050613/1).References
- Metz et al. [2005] B. Metz, O. Davidson, H. De Coninck, M. Loos, and L. Meyer, IPCC special report on carbon dioxide capture and storage (Cambridge: Cambridge University Press, 2005).
- Boot-Handford et al. [2014] M. E. Boot-Handford, J. C. Abanades, E. J. Anthony, M. J. Blunt, S. Brandani, N. Mac Dowell, J. R. Fernández, M.-C. Ferrari, R. Gross, J. P. Hallett, et al., Carbon capture and storage update, Energy & Environmental Science 7, 130 (2014).
- Villaume [1985] J. F. Villaume, Investigations at sites contaminated with dense, non-aqueous phase liquids (napls), Groundwater Monitoring & Remediation 5, 60 (1985).
- Mayer [2005] A. S. Mayer, Soil and groundwater contamination: Nonaqueous phase liquids, 17 (American Geophysical Union, 2005).
- Mackay and Cherry [1989] D. M. Mackay and J. A. Cherry, Groundwater contamination: Pump-and-treat remediation, Environmental Science & Technology 23, 630 (1989).
- O’Sullivan et al. [2001] M. J. O’Sullivan, K. Pruess, and M. J. Lippmann, State of the art of geothermal reservoir simulation, Geothermics 30, 395 (2001).
- Barbier [2002] E. Barbier, Geothermal energy technology and current status: an overview, Renewable and sustainable energy reviews 6, 3 (2002).
- Sheng [2010] J. J. Sheng, Modern chemical enhanced oil recovery: theory and practice (Gulf Professional Publishing, 2010).
- Cyr et al. [2001] T. Cyr, R. Coates, and M. Polikar, Steam-assisted gravity drainage heavy oil recovery process (2001), uS Patent 6,257,334.
- Avraam and Payatakes [1995] D. Avraam and A. Payatakes, Flow regimes and relative permeabilities during steady-state two-phase flow in porous media, Journal of fluid mechanics 293, 207 (1995).
- Lenormand et al. [1988] R. Lenormand, E. Touboul, and C. Zarcone, Numerical models and experiments on immiscible displacements in porous media, Journal of fluid mechanics 189, 165 (1988).
- Lenormand [1990] R. Lenormand, Liquids in porous media, Journal of Physics: Condensed Matter 2, SA79 (1990).
- Trojer et al. [2015] M. Trojer, M. L. Szulczewski, and R. Juanes, Stabilizing fluid-fluid displacements in porous media through wettability alteration, Physical Review Applied 3, 054008 (2015).
- Holtzman and Segre [2015] R. Holtzman and E. Segre, Wettability stabilizes fluid invasion into porous media via nonlocal, cooperative pore filling, Physical review letters 115, 164501 (2015).
- Zhao et al. [2016] B. Zhao, C. W. MacMinn, and R. Juanes, Wettability control on multiphase flow in patterned microfluidics, Proceedings of the National Academy of Sciences 113, 10251 (2016).
- Rabbani et al. [2017] H. S. Rabbani, V. Joekar-Niasar, T. Pak, and N. Shokri, New insights on the complex dynamics of two-phase flow in porous media under intermediate-wet conditions, Scientific reports 7, 1 (2017).
- Rabbani et al. [2018a] H. S. Rabbani, B. Zhao, R. Juanes, and N. Shokri, Pore geometry control of apparent wetting in porous media, Scientific reports 8, 1 (2018a).
- Hu et al. [2018] R. Hu, J. Wan, Z. Yang, Y.-F. Chen, and T. Tokunaga, Wettability and flow rate impacts on immiscible displacement: A theoretical model, Geophysical Research Letters 45, 3077 (2018).
- Pavuluri et al. [2020] S. Pavuluri, J. Maes, J. Yang, M. Regaieg, A. Moncorgé, and F. Doster, Towards pore network modelling of spontaneous imbibition: contact angle dependent invasion patterns and the occurrence of dynamic capillary barriers, Computational Geosciences 24, 951 (2020).
- Zakirov and Khramchenkov [2021] T. Zakirov and M. Khramchenkov, Wettability effect on the invasion patterns during immiscible displacement in heterogeneous porous media under dynamic conditions: A numerical study, Journal of Petroleum Science and Engineering 206, 109049 (2021).
- Primkulov et al. [2021] B. K. Primkulov, A. A. Pahlavan, X. Fu, B. Zhao, C. W. MacMinn, and R. Juanes, Wettability and lenormand’s diagram, Journal of Fluid Mechanics 923 (2021).
- Primkulov et al. [2018] B. K. Primkulov, S. Talman, K. Khaleghi, A. R. Shokri, R. Chalaturnyk, B. Zhao, C. W. MacMinn, and R. Juanes, Quasistatic fluid-fluid displacement in porous media: Invasion-percolation through a wetting transition, Physical Review Fluids 3, 104001 (2018).
- Mora et al. [2021] P. Mora, G. Morra, D. A. Yuen, and R. Juanes, Influence of wetting on viscous fingering via 2d lattice boltzmann simulations, Transport in Porous Media 138, 511 (2021).
- Bakhshian et al. [2021] S. Bakhshian, H. S. Rabbani, and N. Shokri, Physics-driven investigation of wettability effects on two-phase flow in natural porous media: Recent advances, new insights, and future perspectives, Transport in Porous Media 140, 85 (2021).
- Ferrari and Lunati [2014] A. Ferrari and I. Lunati, Inertial effects during irreversible meniscus reconfiguration in angular pores, Advances in water resources 74, 1 (2014).
- Pavuluri et al. [2019] S. Pavuluri et al., Direct numerical simulations of spontaneous imbibition at the pore-scale: impact of parasitic currents and dynamic capillary barriers, Ph.D. thesis, Heriot-Watt University (2019).
- Abu-Al-Saud et al. [2017] M. O. Abu-Al-Saud, A. Riaz, and H. A. Tchelepi, Multiscale level-set method for accurate modeling of immiscible two-phase flow with deposited thin films on solid surfaces, Journal of Computational Physics 333, 297 (2017).
- Rabbani et al. [2016] H. S. Rabbani, V. Joekar-Niasar, and N. Shokri, Effects of intermediate wettability on entry capillary pressure in angular pores, Journal of colloid and interface science 473, 34 (2016).
- Rabbani and Seers [2019] H. S. Rabbani and T. D. Seers, Inertia controlled capillary pressure at the juncture between converging and uniform channels, Scientific reports 9, 13870 (2019).
- Batchelor [2000] G. K. Batchelor, An introduction to fluid dynamics (Cambridge university press, 2000).
- Hirt and Nichols [1981] C. W. Hirt and B. D. Nichols, Volume of fluid (vof) method for the dynamics of free boundaries, Journal of computational physics 39, 201 (1981).
- Pavuluri et al. [2018] S. Pavuluri, J. Maes, and F. Doster, Spontaneous imbibition in a microchannel: Analytical solution and assessment of volume of fluid formulations, Microfluidics and nanofluidics 22, 1 (2018).
- Brackbill et al. [1992] J. U. Brackbill, D. B. Kothe, and C. Zemach, A continuum method for modeling surface tension, Journal of computational physics 100, 335 (1992).
- Van Leer [1979] B. Van Leer, Towards the ultimate conservative difference scheme. v. a second-order sequel to godunov’s method, Journal of computational Physics 32, 101 (1979).
- Rusche [2003] H. Rusche, Computational fluid dynamics of dispersed two-phase flows at high phase fractions, Ph.D. thesis, Imperial College London (University of London) (2003).
- Deshpande et al. [2012] S. S. Deshpande, L. Anumolu, and M. F. Trujillo, Evaluating the performance of the two-phase flow solver interfoam, Computational science & discovery 5, 014016 (2012).
- Hoang et al. [2013] D. A. Hoang, V. van Steijn, L. M. Portela, M. T. Kreutzer, and C. R. Kleijn, Benchmark numerical simulations of segmented two-phase flows in microchannels using the volume of fluid method, Computers & Fluids 86, 28 (2013).
- Ferrari and Lunati [2013] A. Ferrari and I. Lunati, Direct numerical simulations of interface dynamics to link capillary pressure and total surface energy, Advances in water resources 57, 19 (2013).
- Issa [1986] R. I. Issa, Solution of the implicitly discretised fluid flow equations by operator-splitting, Journal of computational physics 62, 40 (1986).
- Pak et al. [2023] T. Pak, H. S. Rabbani, A. Qaseminejad Raeini, and N. Shokri, Effects of the pore morphology on multiphase fluid displacement in porous media—a high-resolution modeling investigation, ACS omega (2023).
- Blunt [2001] M. J. Blunt, Flow in porous media?pore-network models and multiphase flow, Current opinion in colloid & interface science 6, 197 (2001).
- Mazouchi and Homsy [2001] A. Mazouchi and G. Homsy, Thermocapillary migration of long bubbles in polygonal tubes. i. theory, Physics of Fluids 13, 1594 (2001).
- Ferer et al. [2004] M. Ferer, C. Ji, G. S. Bromhal, J. Cook, G. Ahmadi, and D. H. Smith, Crossover from capillary fingering to viscous fingering for immiscible unstable flow: Experiment and modeling, Physical Review E 70, 016303 (2004).
- An et al. [2020] S. An, H. Erfani, O. E. Godinez-Brizuela, and V. Niasar, Transition from viscous fingering to capillary fingering: Application of gpu-based fully implicit dynamic pore network modeling, Water Resources Research 56, e2020WR028149 (2020).
- Feder [2013] J. Feder, Fractals (Springer Science & Business Media, 2013).
- Schindelin et al. [2012] J. Schindelin, I. Arganda-Carreras, E. Frise, V. Kaynig, M. Longair, T. Pietzsch, S. Preibisch, C. Rueden, S. Saalfeld, B. Schmid, et al., Fiji: an open-source platform for biological-image analysis, Nature methods 9, 676 (2012).
- Løvoll et al. [2004] G. Løvoll, Y. Méheust, R. Toussaint, J. Schmittbuhl, and K. J. Måløy, Growth activity during fingering in a porous hele-shaw cell, Physical Review E 70, 026301 (2004).
- Saffman and Taylor [1958] P. G. Saffman and G. I. Taylor, The penetration of a fluid into a porous medium or hele-shaw cell containing a more viscous liquid, Proceedings of the Royal Society of London. Series A. Mathematical and Physical Sciences 245, 312 (1958).
- Legland et al. [2016] D. Legland, I. Arganda-Carreras, and P. Andrey, Morpholibj: integrated library and plugins for mathematical morphology with imagej, Bioinformatics 32, 3532 (2016).
- Cieplak and Robbins [1988] M. Cieplak and M. O. Robbins, Dynamical transition in quasistatic fluid invasion in porous media, Physical review letters 60, 2042 (1988).
- Cieplak and Robbins [1990] M. Cieplak and M. O. Robbins, Influence of contact angle on quasistatic fluid invasion of porous media, Physical Review B 41, 11508 (1990).
- Rabbani et al. [2018b] H. S. Rabbani, D. Or, Y. Liu, C.-Y. Lai, N. B. Lu, S. S. Datta, H. A. Stone, and N. Shokri, Suppressing viscous fingering in structured porous media, Proceedings of the National Academy of Sciences 115, 4833 (2018b).
- Xu et al. [2022] W. Xu, K. Zhang, Y. Zhang, and J. Jiang, Packing fraction, tortuosity, and permeability of granular-porous media with densely packed spheroidal particles: Monodisperse and polydisperse systems, Water Resources Research 58, e2021WR031433 (2022).
- Ahmed [2018] T. Ahmed, Reservoir engineering handbook (Gulf professional publishing, 2018).