Elastic Microphase Separation Produces Robust Bicontinuous Materials
Abstract
Bicontinuous microstructures are essential to the function of diverse natural and synthetic systems. Their synthesis has been based on two approaches: arrested phase separation or self-assembly of block copolymers. The former is attractive for its chemical simplicity, the latter for its thermodynamic robustness. Here, we introduce Elastic MicroPhase Separation (EMPS) as an alternative approach to make bicontinuous microstructures. Conceptually, EMPS balances the molecular-scale forces that drive demixing with large-scale elasticity to encode a thermodynamic length scale. This process features a continuous phase transition, reversible without hysteresis. Practically, we trigger EMPS by simply super-saturating an elastomeric matrix with a liquid. This results in uniform bicontinuous materials with a well-defined microscopic length-scale tuned by the matrix stiffness. The versatility and robustness of EMPS is further demonstrated by fabricating bicontinuous materials with superior mechanical properties and controlled anisotropy and microstructural gradients.
Bicontinuous materials feature fascinating interpenetrating structures and are found across scales in the natural world. The macroscopic bicontinuous architecture of marine corals enables an optimal balance between connectivity and surface area for nutrient absorption Clarke et al. (2011). In sea urchins, the smoothness of bicontinuous microstructures leads to excellent mechanical properties Yang et al. (2022). At the nanoscale, bicontinuous photonic structures in bird feathers produce beautiful structural colors Dufresne et al. (2009); Saranathan et al. (2021). The unique topology, smooth morphology, and large surface area of these complex materials have inspired the development of synthetic mimicks for applications spanning catalysis Zielasek et al. (2006); Li et al. (2020), energy storage Han et al. (2023); Guo et al. (2016), and optical and mechanical meta-materials Wohlwend et al. (2022); Shi et al. (2021); Biener et al. (2006). Nonetheless, precise control over bicontinuous microstructures over large volumes presents fundamental challenges.
While bicontinuous structures with domain sizes approaching tens of microns can be directly written with modern additive manufacturing techniques Portela et al. (2020); Hsieh et al. (2019), spontaneous bottom-up approaches are preferred for the efficient production of bicontinuous materials with smaller feature sizes Erlebacher et al. (2001); Bates and Bates (2017); Xuanming Lu (2020). In polymeric systems, established approaches include arrested phase separation Chan and Rey (1996); Wienk et al. (1996) and the self-assembly of block copolymers Tang et al. (2008); Xiang et al. (2023). While block copolymer assembly offers unmatched control of bicontinuous structures at macromolecular scales, it cannot produce robust structures at scales much larger than the block copolymer itself. Conversely, arrested phase separation uses simpler chemistries and readily produces structures with dimensions well beyond the macromolecular scale Chan and Rey (1996); Cates and Clegg (2008); Guillen et al. (2011). However, these typically compromise the uniformity of the resulting microstructures, as arrest is usually triggered by a diffusion-limited process. Therefore, the creation of bicontinuous materials with a uniform structure at the microscale remains a major challenge. To that end, matrix elasticity has recently been proposed as an alternative mean to control phase separation Fernández-Rico et al. (2022). While initial experiments have demonstrated precise size tunability at the scale of several microns Style et al. (2018), the resulting microstructures have been limited to dilute spherical domains that are squeezed out of the matrix over tens of hours Rosowski et al. (2020).
In this paper, we introduce Elastic MicroPhase Separation (EMPS) to produce bicontinuous microstructures in bulk polymeric materials. In EMPS, elastic forces imposed by polymer matrices are used to counter molecular-scale forces that drive demixing. In this way, matrix elasticity stabilizes the microstructure and controls its final length scale. Similar to block copolymer assembly, EMPS features a thermodynamically-defined length scale. Like arrested phase separation, it utilizes simple chemistries and provides access to length scales much larger than its macro-molecular building-blocks. Furthermore, we find that EMPS is characterized by an unusual thermodynamic boundary combining features of binodal and spinodal curves. Finally, we demonstrate the versatility and robustness of EMPS by fabricating bicontinuous materials with enhanced durability, microstructural gradients, and anisotropy.
.1 Super-saturated elastomers form bicontinuous microstructures
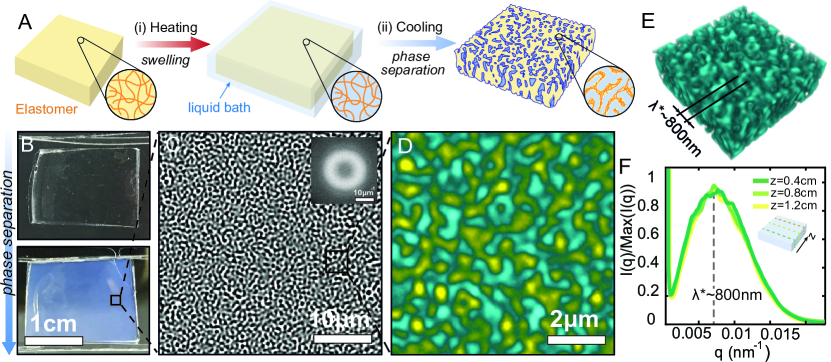
Our process to fabricate bicontinuous structures is shown schematically in Fig. 1A. First, an elastomer is immersed in a bath of liquid at an elevated temperature, Tswell. Over the course of a few days, the liquid diffuses into the elastomer, until the system reaches swelling equilibrium. Then, the temperature is dropped to reduce the solubility of the liquid in the matrix, inducing Elastic MicroPhase Separation (EMPS). An example of an 800kPa polydimethylsiloxane (PDMS) elastomer swollen with heptafluorobutyl methacrylate (HFBMA) at 60∘C is shown in Fig. 1B-E. Macroscopically, the liquid-saturated elastomer is transparent and becomes cloudy blue upon cooling to room temperature (see Fig. 1B). Bright-field optical microscopy of a thin sample reveals an intricate and regular network structure at the microscale (see Fig. 1C). This microstructure features strong structural correlations at a single wavelength, as shown by the ring in the two-dimensional Fourier transform of the image (see inset Fig. 1C). Stacks of fluorescence confocal images shown in Fig.1D and E, reveal that the three-dimensional structure of our material is bicontinuous (see full stack in Movie S1). This highly correlated structure is homogeneous across the centimeter-scale sample, as shown by the Fourier spectra of images acquired at different cross-sections (see Fig. 1F).
The resulting phase-separated structures resemble transient bicontinuous networks formed during spinodal decomposition Cahn and Hilliard (1958); Cahn (1959); Cabral and Higgins (2018). However, in striking contrast to that classical process, our microstructures are stationary for hours without sign of coarsening. As we show in the following section, the essential ingredient leading to this unusual phase separation process is the elasticity of the polymer matrix.
.2 Matrix elasticity stabilizes a single length scale
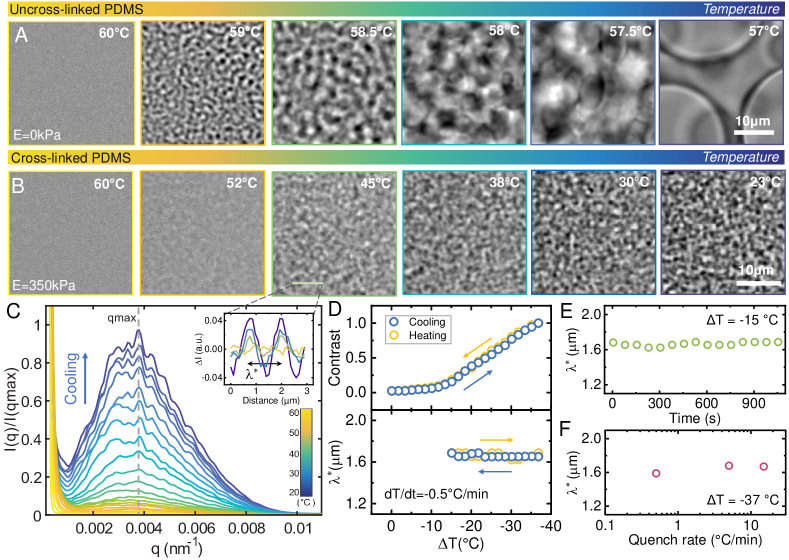
To highlight the crucial role of matrix elasticity, we compare phase separation with and without crosslinking of PDMS (see Fig. 2A and B). For a fluid matrix with no cross-linking (see Fig. 2A), phase separation follows the classical spinodal decomposition pathway, with the emergence and rapid coarsening of bicontinuous channels, followed by their break-up into discrete droplets Aarts et al. (2005). By contrast, phase separation in cross-linked matrices (see Fig. 2B), results in bicontinuous microstructures that emerge at deeper quenches and do not appear to coarsen over the course of experiment.
Fourier analysis of the image sequence shown in Fig. 2B reveals that the contrast of the structure smoothly increases during cooling, while the characteristic length scale of the structure remains fixed. This is shown in Fig. 2C, where the Fourier spectrum at each time-point is characterized by a broad peak centered on a single spatial frequency, . As temperature decreases, the height of this peak (i.e. contrast) increases smoothly (see top panel Fig. 2D), while the characteristic length scale remains constant at approximately 1.6 m (see bottom panel Fig. 2D). Intriguingly, elastic microphase separation is fully reversible without hysteresis when the system is heated up. This is shown by the yellow data in Fig. 2D, where the contrast and length scale follow the same path for cooling and heating. We also find that is stable over time at a fixed temperature (see Fig. 2E), and that it remains fixed when the quench rate is varied by a factor of 30 (see Fig. 2F).
Together, these observations suggest that the contrast and characteristic length scale of the phase-separated microstructure are equilibrium features of the system. This is reminiscent of microphase separation in block copolymers Bates and Bates (2017); Tang et al. (2008). However, our microstructures have much bigger than the sizes of their constituent macromolecules, which is typical of kinetically arrested phase separation Gibaud and Schurtenberger (2009); Kahrs and Schwellenbach (2020); Khan et al. (2022). Elastic microphase separation, therefore, combines attractive characteristics of both established routes, and provides a bulk route to produce uniform bicontinous microstructures.
.3 Matrix stiffness controls the length scale and morphology of the microstructure
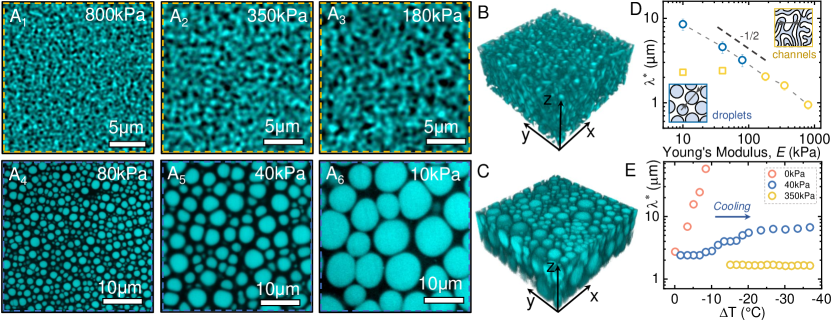
To elucidate the role of elasticity, we vary the matrix stiffness. Confocal images of the microstructures formed in matrices with Young’s moduli, , ranging from 800 to 10kPa, are shown in Fig. 3A. As is reduced from 800 to 180kPa, the characteristic length scale of the bicontinuous morphology increases from 0.8 to 2m (see Figs. 3A1-3 and Fig. 3D). For softer matrices, the final morphologies are, in fact, dense packings of discrete droplets, resembling ‘compressed emulsions’ (see Figs. 3A4-6) Brujić et al. (2003). In these droplet structures, the length scale increases from about 3 to 9m, when decreases from 80 to 10kPa (see Fig. 3D). In general, we find that over the full range of stiffnesses, scales smoothly as , as shown by the circles in Fig. 3D (see distributions in Fig. S2). Three-dimensional confocal reconstructions of both morphologies are displayed in Figs. 3B and C (see full stacks in Movie S2 and S3).
Independent of the final morphology and stiffness, we find that phase separation initiates with the smooth emergence of a bicontinuous structure at a single wavelength (see Fig. 3E and Fig. S3). While this structure is stable in size and connectivity in stiff samples, it coarsens and breaks in softer samples. This is shown in Fig. 3E, where the evolution of with cooling is shown for three different elasticities. In stiff samples (E=350kPa, Fig. 3E), is stable throughout the entire phase separation process. In softer samples (E=40kPa, Fig. 3E), is initially stable, as a network is formed, but then increases as the structure coarsens and forms droplets at deeper quenches (see images in Fig. S3). The initial characteristic length scale of these networks is added in Fig. 3D as yellow squares. For soft samples, this initial length scale is independent of . In uncrosslinked matrices (E=0kPa, Fig. 3E), rapidly increases as soon as the temperature drops, as expected for classical demixing (see Fig.2A).
To compare EMPS to the early stages of classical spinodal decomposition Cabral and Higgins (2018), we constructed a minimal analytical model considering the coupling between demixing and elasticity. We evaluated the linear stability of a near-critical mixture, following Cahn and Hilliard Cahn and Hilliard (1958), with an additional linear-elastic term governing stretching of the matrix. In this model, we find the initial wavelength during the early stage of spinodal demixing is given by . Here, is the corresponding wavelength for an uncrosslinked matrix, and E∗(T) is a characteristic stiffness depending on the degree of undercooling. For , we expect the fastest-growing wavelength to scale like , and for , we expect to be independent of stiffness. This minimal model seems to capture the observed scaling of the initial wavelength with (see yellow data in Fig. 3D). However, numerical solutions of this model reveal that linear elasticity is not sufficient to arrest the coarsening of the microstructure over time (see Figs. S11 and S13). This suggests that additional factors such as non-linear elasticity and toughness could be playing a role.
.4 Elasticity changes the thermodynamics of phase separation
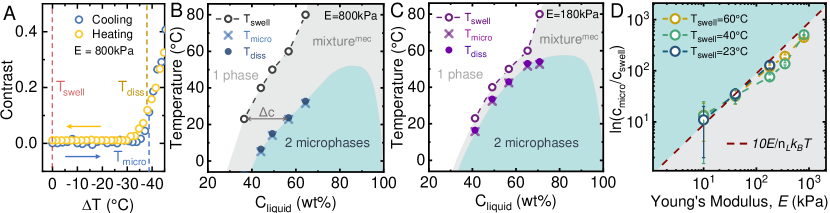
While results in the previous section suggest that the microstructure forms by spinodal decomposition, a closer look at the phase behavior of EMPS suggests that it is governed by a distinct thermodynamic process. The key features of our argument are shown in Fig.4 A. There, we quantify the structural contrast evolution of a bicontinuous microstructure during a temperature cycle. Cooling from the binodal curve at , we observe no phase separation until (see blue data Fig.4 A, contrast threshold 0.1), which is 39∘C below the swelling temperature. Our observations rule out phase separation at as being spinodal decomposition near the critical point, where no gap is expected between the binodal and spinodal curves. Spinodal decomposition, however, is still possible away from the critical point. To test for this, we reheat the sample (see yellow data in Fig.4 A), and find that the microstructure fully dissolves at , very close to . This remarkable observation rules out classical off-critical spinodal demixing, where phase-separated domains should persist until the original swelling temperature is reached.
Crucially, we find that is a robust feature across the full range of incubation temperatures (see Fig. 4B) and matrix stiffnesses (see Fig.4BC and Fig.S5). Further, is rate independent for sufficiently slow quench rates (see Fig. S6). These results suggest that is a proper thermodynamic boundary, dividing a region where mixtures are mechanically stabilized by the elastic polymer matrix (see highlighted gray zone in Fig.4B-E), from a microphase-separated area (see highlighted cyan zone in Fig.4B-E). Like a spinodal, a continuous compositional change is observed when this boundary is crossed. Like a binodal, phase-separated domains fully dissolve when it is crossed in the other direction. Such continuous hysteresis-free transitions are normally seen only near critical points.
Matrix stiffness has a strong impact on the onset of microphase separation. The gap between the and increases with matrix stiffness (compare gray zones in Figs.4B-C). To interpret this, we quantify the degree of supersaturation at the point of microphase separation (see c in Fig.4B) as for different elasticities and swelling temperatures. As shown in Fig. 4D, the supersaturation degree collapses the data acquired at different Tswell and scales roughly linearly with of the unswollen matrix. This trend has a simple mechanical interpretation, suggested by Rosowski et al. (2020). Assuming ideality, the difference in chemical potential between the mixed and marginally microphase separated states is given by . This leads to an elevated osmotic pressure of the solute in the polymer-depleted phase, , which is needed to maintain the host network in a deformed state. As shown by the red dashed line in Fig. 4D, the onset of microscopic phase separation is consistent with . Thus, the competition between elasticity and solubility places a practical upper-bound on the stiffness of samples that can be used, and hence a lower-bound on the length scales accessible by EMPS.
.5 EMPS makes functional materials with diverse microstructures
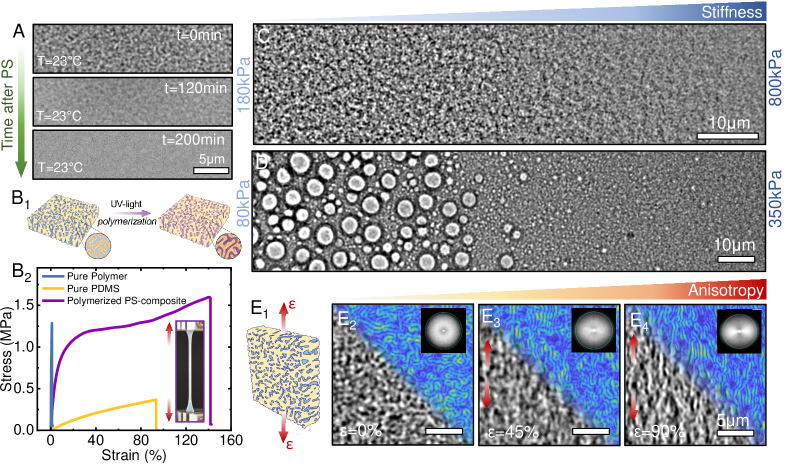
While our bicontinuous materials do not coarsen over time, the elevated osmotic pressure in the oil-rich microphase leads to its slow transport out of the network over several hours (see Fig. 5A) Rosowski et al. (2020). However, we can suppress this liquid migration by polymerizing the methacrylate-functionalized HFBMA after phase separation (see Fig.5B1 and Fig.S8). We achieve this by adding photo-initiator to the incubation bath and illuminating the sample with UV-light after phase separation (see SM). The resulting material is permanent (stable for at least 12 months), and thus enables EMPS to be used to fabricate microstructured functional materials.
For instance, EMPS followed by polymerization can significantly increase the toughness and Young’s Modulus of elastomers. This is shown in Figure 5B2, where tensile tests of polymerized samples reveal a remarkably elevated toughness of roughly 2MJ/m3, which is 9 greater than pure PDMS and 200 greater than polymerized HFBMA (pHFBMA). The composite elastomer has a stiffness 20MPa (11 greater than pure PDMS) and withstands strains up to 140% (see Fig. 5B2 and Fig.S9). This enhanced mechanical performance could arise from a filler- Fröhlich et al. (2005) or double-network-effect Gong et al. (2003). Alternatively, the brittle pHFBMA could be plasticized by small quantities of PDMS Zhang et al. (2022).
Finally, the simplicity and robustness of EMPS enables the fabrication of bicontinuous materials with controlled structural gradients and anisotropy. When swelling and phase separation take place in a polymer matrix with a stiffness gradient, the resulting materials can present smooth and continuous changes in both the length scale (see Fig. 5C) and morphology of the microstructure (see Fig. 5D). Materials with structural gradients are attractive for filtration, implants or tissue engineering applications, where gradual changes in the length scale are crucial for their functionality Siddhant Kumar and Kochmann (2020); Gibson (2005). Finally, anisotropic bicontinuous structures can be also systematically produced by stretching the material, either before (see Fig. S10) or after phase separation (see Fig. 5E). Such anisotropic structures have recently been proposed to have promising orientation-dependent mass transport, energy absorption, and mechanical properties Zeng et al. (2018); Jr et al. (2008); Siddhant Kumar and Kochmann (2020).
.6 Conclusions
Elastic microphase separation is a powerful approach for fabricating homogeneous bicontinuous materials in bulk. The final length scale, morphology, and thermodynamics of this system are found to be intimately related to the mechanics of the elastic matrix. In fact, we have uncovered the emergence of an elastically-controlled thermodynamic boundary delineating a hysteresis-free continuous phase transition over a wide range of compositions. Finally, we have shown the potential of this approach for making functional materials, by fabricating tough elastomers, and bicontinuous materials with controlled anisotropy and microstructural gradients.
Our results have broad implications for soft matter and materials science. For soft matter, EMPS challenges classical models of phase separation, where continuous hysteresis-free transitions are only accessible near critical points. As such, EMPS requires a new theoretical framework, incorporating elasticity to address the stability and length scale of the system. We anticipate that a deeper understanding of the interplay of mechanics and thermodynamics will shed crucial light on emerging problems in biology Yongdae Shin et al. (2019); Wiegand and Hyman (2020); Ronceray et al. (2022) and mechanical engineering Portela et al. (2020); Siddhant Kumar and Kochmann (2020).
From a materials perspective, EMPS breaks the current dichotomy between block copolymer self-assembly and arrested phase separation to produce bicontinuous microstructures. EMPS combines the thermodynamic robustness of block-copolymer assembly with the chemical simplicity of arrested phase separation, enabling precision microstructures with inexpensive components. While our preliminary results on anisotropic and graded bicontinuous materials already suggest applications in mechanical materials Siddhant Kumar and Kochmann (2020), EMPS promises a host of opportunities for developing other functional materials. Further developments of this system could include the reduction of the microstuctural length scale to produce structural color Dufresne et al. (2009), the optimization of the elastomers’ toughness for wearable devices applications Peng et al. (2021), or the selective removal of one of the phases to exploit the exciting filtration, energy storage and catalytic properties of open bicontinuous materials Phillip et al. (2010); Lee et al. (2022); Zielasek et al. (2006).
.7 Acknowledgements
We acknowledge funding from the ETH Zurich Fellowship and the Swiss National Science Foundation NCCR for Bioinspired Materials. We thank Nan Xue, Kathryn Rosowski, David Zwicker and Dennis Kochmann for useful discussions.
Methods
Fabrication of HFBM-PDMS bicontinuous microstructures
First, we prepare pure PDMS matrices by mixing PDMS chains (DMS-V31, Gelest) with a crosslinker (HMS-301, Gelest) and a platinum-based catalyst (SIP6831.2, Gelest) (see full recipe in Style et al. (2015)). The stiffness of the matrix depends on the mass ratio between the chains and crosslinker (from 3:1 to 9:1), while keeping the catalyst concentration constant (0.0019% in volume). Once the different parts are thoroughly mixed together, we pour the mixture into a petri dish, degassed it in vacuum, and finally cure it at 60∘C for approximately 6 days. After curing, the resulting PDMS elastomer is carefully removed from the petri dish and cut into rectangular pieces (1cm2cm0.5cm).
Next, PDMS pieces are transferred into a bath of heptafluorobutyl methacrylate (HFBMA, Apollo scientific) (1mL HFBMA/0.5g of PDMS), in a 25mL glass bottle. This bath is then typically incubated at C in a pre-heated oven during 2.5 days. After the elastomer is saturated with the liquid, the glass bottle is brought to room temperature, at which point phase separation occurs spontaneously. The resulting phase-separated bicontiunous samples are then prepared for characterization tests.
Note that experiments with un-crosslinked PDMS are performed by preparing mixtures of PDMS chains and HFBMA liquid in glass bottles, and following the same temperature steps described above.
Structural characterization
Bright-field optical and confocal fluorescence microscopy images of phase-separated microstructures are obtained using a Nikon-Ti Eclipse inverted optical microscope, equipped with a Confocal Spinning disk Scanner Unit. We typically use 60 and 100 oil objectives with NA=1.2 and 1.45, respectively. Optimal imaging is achieved when preparing thin PDMS samples (200-500m thick), by either curing the PDMS in between two coverslips (1.5, Menzel Glaser), or by using a razor blade to cut thin slides from the bulk samples. Note that the incubation period for the samples between coverslips is significanly longer (6 days). For confocal microsocopy experiments, free BDP is added to HFBMA and Nile-Red is added to PDMS prior to incubation.
To characterize the structural evolution of the samples with temperature we use thin PDMS samples (200-500m thick) cured on a 35-mm diameter glass-bottomed dish (MatTek). We add 1mL of HFBMA, and seal the petri dish with Teflon tape. The sample is next incubated at 60∘C-oven for 2.5 days. The sample is next transferred into a pre-heated heating stage at 60∘C (InsTec instruments), which is coupled to an optical microscope. For these experiments we use an 60 air objective, to avoid temperature variations in the sample.
Stiffness-gradient and anisotropic samples
To prepare PDMS samples with stiffness gradients, we first cure a stiff PDMS mixture (e.g. 3:1 chains:crosslinker) on the right-side of a coverslip, and let it cure at 40∘C for 2 hours. We limit it to the right-side by only pouring a small amount of mixture, and using a very small tilt during the curing. Next, we cure a softer PDMS mixture (e.g. 5:1 chains:crosslinker) on the left-side of the coverslip, which slowly gets in contact with the pre-cured stiff side. The gradient is let to cure for two days at 60∘C.
Anisotropic bicontinuous structures can be prepared by either pre-stretching a PDMS sample before the incubation and phase separation process, or after the system has phase separated. In both cases, strains are externally imposed by clamping 8cm2cm0.5cm pieces of the elastomer, in a home-made device for stretching the sample that can be coupled to an optical microscope (see Fig. S10). The stretch () is calculated as l/l0, where l0 is the original unstretched length. Stretch can be applied before incubation or after phase separation.
Polymerization of bicontinuous microstructures and mechanical tests
Polymerization of the phase separated samples is performed in degassed glass vials containing a piece of PDMS (0.4g), 500L of HFBMA and 2wt% of photoinitiator (2-Hydroxy-2-methylpropiophenone, Apollo scientific). Once the incubation has proceed at 60∘C for 2.5 days, the samples are cooled down to room temperature to induce EMPS. Next, we remove the excess of monomer in the container with a degassed syringe and expose the sample to UV-light for 2 hours. We use a 365nm UV-lamp (12 Watts and 0.5cm from the lamp).
To measure the mechanical properties of the polymerized materials, we prepare 520.5cm3 dog-bone PDMS samples, and proceed with the swelling, phase separation and polymerization procedure described above. Once dog-bones are polymerized, we perform uniaxial tests using a tensile testing machine (Stable Micro Systems), where we record the engineering strain-stress curves until failure. All mechanical tests were performed in air, at room temperature, and at elongation speeds of 0.05mm per second. The sample toughness (J/m3) is calculated as the area under the strain-stress curves.
Thermo-mechanical model based on Cahn-Hilliard theory
Assuming spinodal decomposition near a critical point, we introduce a minimal model with two basic ingredients, a Landau-Ginzburg free energy Landau and Ginzburg (1950) and an energy term related to the mechanical properties of the matrix. We define as an order parameter describing how far we are from the critical point (). The matrix has a stiffness , where is the Young’s modulus at the critical point, and captures the compositional variation of the stiffness. For simplicity, we assume to be independent of and . Then, free energy density including elasticity is represented as:
| (1) |
The first two terms on the right side represent the free energy of mixing of the matrix and the liquid, while the third represents the interfacial energy between the two materials. , and are the usual coefficients for a Landau-Ginzburg type free energy, and we take these to be independent of the network elasticity. The last two terms represent the mechanical strain energy of the mixture, which includes the stored elastic strain energy and a contribution related to the swelling pressure that makes the matrix equilibrate at a non-zero strain, .
We assume the phase separation processes maintains local mechanical equilibrium. This equilibrium condition is given by , so . Thermodynamic equilibrium is much slower to achieve, as it involves slow transport of fluid through the sample. This transport occurs along gradients in the exchange chemical potential König et al. (2021):
| (2) | ||||
The flux of monomer is given by , where is the mobility, which we assume to be constant. Conservation of mass is described by the transport equation:
| (3) |
To find the wavelength that emerges at the onset of phase separation, we perform a linear-stability analysis of this equation Cahn and Hilliard (1958). We let , etc. Then, at leading order, we find the linearized transport equation:
| (4) |
is defined as the term in the square brackets for convenience. We seek solutions of the form , where is the growth rate of a mode with wavelength . Inserting this into the transport equation, we find
| (5) |
When is positive for some range of wavelengths, the system is unstable, and spinodal decomposition will occur. This occurs when (n.b. is always positive). Under these conditions, we see that will take a maximum value when . The corresponding value of gives us the wavelength which will dominate the early stages of spinodal decomposition:
| (6) |
Assuming and to be independent of experimental conditions, and to be proportional to unswollen Young’s modulus of the matrix, , we can write the expression above as
| (7) |
where is a constant, , and .
.8 References
References
- Clarke et al. (2011) Clarke, S.; Walsh, P.; Maggs, C.; Buchanan, F. Designs from the deep: Marine organisms for bone tissue engineering. Biotechnology Advances 2011, 29, 610–617.
- Yang et al. (2022) Yang, T.; Jia, Z.; Wu, Z.; Chen, H.; Deng, Z.; Chen, L.; Zhu, Y.; Li, L. High strength and damage-tolerance in echinoderm stereom as a natural bicontinuous ceramic cellular solid. Nat Commun 2022, 13, 610–617.
- Dufresne et al. (2009) Dufresne, E. R.; Noh, H.; Saranathan, V.; Mochrie, S. G.; Cao, H.; Prum, R. O. Self-assembly of amorphous biophotonic nanostructures by phase separation. Soft Matter 2009, 5, 1792–1795.
- Saranathan et al. (2021) Saranathan, V.; Narayanan, S.; Sandy, A.; Dufresne, E. R.; Prum, R. O. Evolution of single gyroid photonic crystals in bird feathers. Proceedings of the National Academy of Sciences 2021, 118.
- Zielasek et al. (2006) Zielasek, V.; Jürgens, B.; Schulz, C.; Biener, J.; Biener, M. M.; Hamza, A. V.; Bäumer, M. Gold Catalysts: Nanoporous Gold Foams. Angewandte Chemie International Edition 2006, 45, 8241–8244.
- Li et al. (2020) Li, Q.; Chen, C.; Li, C.; Liu, R.; Bi, S.; Zhang, P.; Zhou, Y.; Mai, Y. Ordered Bicontinuous Mesoporous Polymeric Semiconductor Photocatalyst. ACS Nano 2020, 14, 13652–13662.
- Han et al. (2023) Han, J.; Lee, M. J.; Lee, K.; Lee, Y. J.; Kwon, S. H.; Min, J. H.; Lee, E.; Lee, W.; Lee, S. W.; Kim, B. J. Role of Bicontinuous Structure in Elastomeric Electrolytes for High-Energy Solid-State Lithium-Metal Batteries. Advanced Materials 2023, 35, 2205194.
- Guo et al. (2016) Guo, X.; Han, J.; Liu, P.; Chen, L.; Ito, Y.; Jian, Z.; Jin, T.; Hirata, A.; Li, F.; Fujita, T.; Asao, N.; Zhou, H.; Chen, M. Hierarchical nanoporosity enhanced reversible capacity of bicontinuous nanoporous metal based Li-O2 battery. Scientific Reports 2016, 6, 33466.
- Wohlwend et al. (2022) Wohlwend, J.; Sologubenko, A. S.; Döbeli, M.; Galinski, H.; Spolenak, R. Chemical Engineering of Cu–Sn Disordered Network Metamaterials. Nano Letters 2022, 22, 853–859.
- Shi et al. (2021) Shi, S.; Li, Y.; Ngo-Dinh, B.-N.; Markmann, J.; Weissmüller, J. Scaling behavior of stiffness and strength of hierarchical network nanomaterials. Science 2021, 371, 1026–1033.
- Biener et al. (2006) Biener, J.; Hodge, A. M.; Hayes, J. R.; Volkert, C. A.; Zepeda-Ruiz, L. A.; Hamza, A. V.; Abraham, F. F. Size Effects on the Mechanical Behavior of Nanoporous Au. Nano Letters 2006, 6, 2379–2382.
- Portela et al. (2020) Portela, C. M.; Vidyasagar, A.; Krödel, S.; Weissenbach, T.; Yee, D. W.; Greer, J. R.; Kochmann, D. M. Extreme mechanical resilience of self-assembled nanolabyrinthine materials. Proceedings of the National Academy of Sciences 2020, 117, 5686–5693.
- Hsieh et al. (2019) Hsieh, M.-T.; Endo, B.; Zhang, Y.; Bauer, J.; Valdevit, L. The mechanical response of cellular materials with spinodal topologies. Journal of the Mechanics and Physics of Solids 2019, 125, 401–419.
- Erlebacher et al. (2001) Erlebacher, J.; Aziz, M. J.; Karma, A.; Dimitrov, N.; Sieradzki, K. Evolution of nanoporosity in dealloying. Nature 2001, 410, 450–453.
- Bates and Bates (2017) Bates, C. M.; Bates, F. S. 50th Anniversary Perspective: Block Polymers– Pure Potential. Macromolecules 2017, 50, 3–22.
- Xuanming Lu (2020) Xuanming Lu, K. K. . K. N., George Hasegawa Hierarchically porous monoliths prepared via sol–gel process accompanied by spinodal decomposition. J Sol-Gel Sci Technol 2020, 95, 530–550.
- Chan and Rey (1996) Chan, P. K.; Rey, A. D. Polymerization-induced phase separation. 1. Droplet size selection mechanism. Macromolecules 1996, 29, 8934–8941.
- Wienk et al. (1996) Wienk, I.; Boom, R.; Beerlage, M.; Bulte, A.; Smolders, C.; Strathmann, H. Recent advances in the formation of phase inversion membranes made from amorphous or semi-crystalline polymers. Journal of membrane science 1996, 113, 361–371.
- Tang et al. (2008) Tang, C.; Lennon, E. M.; Fredrickson, G. H.; Kramer, E. J.; Hawker, C. J. Evolution of block copolymer lithography to highly ordered square arrays. Science 2008, 322, 429–432.
- Xiang et al. (2023) Xiang, L.; Li, Q.; Li, C.; Yang, Q.; Xu, F.; Mai, Y. Block copolymer self-assembly directed synthesis of porous materials with ordered bicontinuous structures and their potential applications. Advanced Materials 2023, 35, 2207684.
- Cates and Clegg (2008) Cates, M. E.; Clegg, P. S. Bijels: a new class of soft materials. Soft Matter 2008, 4, 2132–2138.
- Guillen et al. (2011) Guillen, G. R.; Pan, Y.; Li, M.; Hoek, E. M. V. Preparation and Characterization of Membranes Formed by Nonsolvent Induced Phase Separation: A Review. Cell 2011, 175, 3798.
- Fernández-Rico et al. (2022) Fernández-Rico, C.; Sai, T.; Sicher, A.; Style, R. W.; Dufresne, E. R. Putting the Squeeze on Phase Separation. JACS Au 2022, 2, 66–73.
- Style et al. (2018) Style, R. W.; Sai, T.; Fanelli, N.; Ijavi, M.; Smith-Mannschott, K.; Xu, Q.; Wilen, L. A.; Dufresne, E. R. Liquid-liquid phase separation in an elastic network. Physical Review X 2018, 8, 011028.
- Rosowski et al. (2020) Rosowski, K. A.; Sai, T.; Vidal-Henriquez, E.; Zwicker, D.; Style, R. W.; Dufresne, E. R. Elastic ripening and inhibition of liquid–liquid phase separation. Nature Physics 2020, 16, 422–425.
- Cahn and Hilliard (1958) Cahn, J. W.; Hilliard, J. E. Free Energy of a Nonuniform System. I. Interfacial Free Energy. The Journal of Chemical Physics 1958, 28, 258–267.
- Cahn (1959) Cahn, J. W. Free Energy of a Nonuniform System. II. Thermodynamic Basis. The Journal of Chemical Physics 1959, 30, 1121–1124.
- Cabral and Higgins (2018) Cabral, J. T.; Higgins, J. S. Spinodal nanostructures in polymer blends: On the validity of the Cahn-Hilliard length scale prediction. Progress in Polymer Science 2018, 81, 1–21.
- Aarts et al. (2005) Aarts, D. G. A. L.; Dullens, R. P. A.; Lekkerkerker, H. N. W. Interfacial dynamics in demixing systems with ultralow interfacial tension. New Journal of Physics 2005, 7, 40.
- Gibaud and Schurtenberger (2009) Gibaud, T.; Schurtenberger, P. A closer look at arrested spinodal decomposition in protein solutions. Journal of Physics: Condensed Matter 2009, 21, 322201.
- Kahrs and Schwellenbach (2020) Kahrs, C.; Schwellenbach, J. Membrane formation via non-solvent induced phase separation using sustainable solvents: A comparative study. Polymer 2020, 186, 122071.
- Khan et al. (2022) Khan, M. A.; Sprockel, A. J.; Macmillan, K. A.; Alting, M. T.; Kharal, S. P.; Boakye-Ansah, S.; Haase, M. F. Nanostructured, Fluid-Bicontinuous Gels for Continuous-Flow Liquid–Liquid Extraction. Advanced Materials 2022, 34, 2109547.
- Brujić et al. (2003) Brujić, J.; Edwards, S. F.; Grinev, D. V.; Hopkinson, I.; Brujić, D.; Makse, H. A. 3D bulk measurements of the force distribution in a compressed emulsion system. Faraday discussions 2003, 123, 207–220.
- Fröhlich et al. (2005) Fröhlich, J.; Niedermeier, W.; Luginsland, H.-D. The effect of filler–filler and filler–elastomer interaction on rubber reinforcement. Composites Part A: Applied Science and Manufacturing 2005, 36, 449–460.
- Gong et al. (2003) Gong, J.; Katsuyama, Y.; Kurokawa, T.; Osada, Y. Double-Network Hydrogels with Extremely High Mechanical Strength. Advanced Materials 2003, 15, 1155–1158.
- Zhang et al. (2022) Zhang, G.; Kim, J.; Hassan, S.; Suo, Z. Self-assembled nanocomposites of high water content and load-bearing capacity. Proceedings of the National Academy of Sciences 2022, 119, e2203962119.
- Siddhant Kumar and Kochmann (2020) Siddhant Kumar, L. Z., Stephanie Tan; Kochmann, D. M. Inverse-designed spinodoid metamaterials. npj Computational Materials 2020, 6.
- Gibson (2005) Gibson, L. J. Biomechanics of cellular solids. Journal of Biomechanics 2005, 38, 377–399.
- Zeng et al. (2018) Zeng, D.; Ribbe, A.; Kim, H.; Hayward, R. C. Stress-Induced Orientation of Cocontinuous Nanostructures within Randomly End-Linked Copolymer Networks. ACS Macro Letters 2018, 7, 828–833.
- Jr et al. (2008) Jr, G. C. E.; Cheng, M.; Bettinger, C. J.; Borenstein, J. T.; Langer, R.; Freed, L. E. Accordion-like honeycombs for tissue engineering of cardiac anisotropy. Nature Materials 2008, 7, 1003–1010–399.
- Yongdae Shin et al. (2019) Yongdae Shin, Y.-C. C.; Lee, D. S. W.; Berry, J.; Sanders, D. W.; Ronceray, P.; Wingreen, N. S.; Haataja, M.; Brangwynne, C. P. Liquid Nuclear Condensates Mechanically Sense and Restructure the Genome. Cell 2019, 175, 1481–1491.
- Wiegand and Hyman (2020) Wiegand, T.; Hyman, A. A. Drops and fibers—how biomolecular condensates and cytoskeletal filaments influence each other. Emerging topics in life sciences 2020, 4, 247.
- Ronceray et al. (2022) Ronceray, P.; Mao, S.; Košmrlj, A.; Haataja, M. P. Liquid demixing in elastic networks: Cavitation, permeation, or size selection? Europhysics Letters 2022, 137, 67001.
- Peng et al. (2021) Peng, J.; Tomsia, A. P.; Jiang, L.; Tang, B. Z.; Cheng, Q. Stiff and tough PDMS-MMT layered nanocomposites visualized by AIE luminogens. Nature Communications 2021, 12, 4539.
- Phillip et al. (2010) Phillip, W. A.; O’Neill, B.; Rodwogin, M.; Hillmyer, M. A.; Cussler, E. Self-assembled block copolymer thin films as water filtration membranes. ACS applied materials & interfaces 2010, 2, 847–853.
- Lee et al. (2022) Lee, M. J.; Han, J.; Lee, K.; Lee, Y. J.; Kim, B. G.; Jung, K.-N.; Kim, B. J.; Lee, S. W. Elastomeric electrolytes for high-energy solid-state lithium batteries. Nature 2022, 601, 217–222.
- Style et al. (2015) Style, R. W.; Boltyanskiy, R.; Allen, B.; Jensen, K. E.; Foote, H. P.; Wettlaufer, J. S.; Dufresne, E. R. Stiffening solids with liquid inclusions. Nature Physics 2015, 11.
- Landau and Ginzburg (1950) Landau, L. D.; Ginzburg, V. L. On the theory of superconductivity. Zh. Eksp. Teor. Fiz. 1950, 20, 1064.
- König et al. (2021) König, B.; Ronsin, O. J.; Harting, J. Two-dimensional Cahn–Hilliard simulations for coarsening kinetics of spinodal decomposition in binary mixtures. Physical Chemistry Chemical Physics 2021, 23, 24823–24833.