Strategic Responses to Personalized Pricing and Demand for Privacy: An Experiment ††thanks: Financial support from the National Natural Science Foundation of China key project (no. 72033006), Tore Browaldhs stiftelse BFh18-0007, and from the Swiss National Science Foundation (Project number 189152). is gratefully acknowledged. We thank Renke Schmacker, Johan Stennek, and seminar audience at University of Gothenburg for comments and suggestions.
Abstract
We consider situations where consumers are aware that a statistical model determines the price of a product based on their observed behavior. Using a novel experiment varying the context similarity between participant data and a product, we find that participants manipulate their responses to a survey about personal characteristics, and manipulation is more successful when the contexts are similar. Moreover, participants demand less privacy, and make less optimal privacy choices when the contexts are less similar. Our findings highlight the importance of data privacy policies in the age of big data, where behavior in seemingly unrelated contexts might affect prices.
Keywords: Price discrimination, Personalized pricing, Strategic behavior, Privacy regulation, Experiments JEL classification: L11, C91, D91, M38
1 Introduction
Advances in information technology in recent decades have led to an explosive growth of consumer data. Firms can exploit these data for more accurate target decisions like pricing. Despite the increasing consumers’ awareness of privacy protection and government regulations such as the General Data Protection Regulation (GDPR) in the European Union, consumers’ ability to make informed choices about their privacy is often compromised due to incomplete information regarding what data is collected and how that data is used, especially in complex “big data” environments.
This paper studies one such complex environment with personalized pricing. Personalized pricing uses information on each individual’s observed characteristics to implement consumer-specific price discrimination. Tracking tools, such as cookies, allow firms to build profiles of consumers on the Internet and target them with individualized prices, thus extracting consumer surplus. Airline companies and car rental services, for instance, are known to sell products and services online according to user features such as location.111 Finding systematic evidence on personalized pricing is challenging, consumer reports such as Schleusener and Hosell (2016) and Commission et al. (2018) shed some light on personalized pricing practices in Germany and EU countries. These reports reveal that in addition to location, airline companies charge higher prices for people using Mac operating systems and mobile phone devices. Personalized pricing practices have also received media attention. See for instance, a BBC report on rental services, https://www.bbc.com/news/business-28756674, last accessed on August 10, 2022. Recently, the Dutch Authority for Consumers and Markets found that an online shopping platform, Wish, used personalized pricing based on locations in the EU, https://www.acm.nl/en/publications/following-acm-actions-wish-bans-fake-discounts-and-blocks-personalized-pricing, last accessed on April 12, 2023. With the growing awareness of personalized pricing, consumers can, sometimes, take countermeasures.222A recent European Commission consumer study has reported a growing awareness of personalized pricing among consumers in EU countries (Commission et al., 2018). According to the survey, 44% of consumers know about personalized pricing and claim they understand how it works. A similar share of respondents thinks personalized pricing offers them discounts and reductions and provides them with the best available price. In the case of airline tickets or car rental services, they can protect their privacy by deleting cookies or using the “private browsing” option. Alternatively, they can respond strategically to cut a nice bargain by, for instance, changing their locations through a virtual private network (VPN), provided that they know how prices are set according to locations.333Multiple websites and forums discuss the best strategies to avoid higher prices for airline tickets using such techniques. For instance, https://www.makeuseof.com/tag/insanely-cheap-flights-vpn/, last accessed on August 10, 2022. While it might be easy to guess the “cheap” locations, the link between consumer information and firms’ pricing models is increasingly blurred with the use of big data. Big data allows firms to better explore the link between the willingness to pay (WTP) for a product and consumer characteristics beyond these easily observed ones.444Web tracking services often provide not only basic information about visitors such as locations, age, and gender, but also additional information, such as their interests and tastes in movies, music, and sports. The marketing literature has recognized the value of using personality traits, values, lifestyles, and emotions, known as psychographics, for consumer targeting (Gunter and Furnham, 2014). This data might be less direct, but it can capture additional consumer information correlated with their WTP and is cheap to obtain (OECD, 2015). It is essential to understand how such technologies affect consumer behaviors and welfare. In particular, when the link between consumer data and the pricing model is less obvious, how consumers weigh between privacy protection and “gaming the system”, and whether they can respond strategically in their own favor. Identifying these choices in field data is, however, difficult. The ideal data would need to determine whether a specific consumer is aware of personalized pricing and disentangle strategic from non-strategic responses.
We make an attempt to analyze experimentally consumers’ responses—how they report and manage their data—to personalized pricing. We are able to identify whether they are aware of personalized prices and discern their strategic responses in a controlled online experimental setup, using a sample from the US population through the Prolific platform. The product for sale is a lottery with a 50% probability of winning £5.555Since Prolific is a UK-based company, all rewards are fixed in British pound sterling. A key element in our design is the link between participants’ survey responses and the predicted WTP which determines the personalized prices. To vary the degree of similarity between the survey context and the product, we used two surveys to predict WTP. The first survey consists of questions commonly used by insurance firms or banks for risk profiling (Risk treatment), making the link between the responses and the predicted WTP for the lottery relatively straightforward, as both have the same context: risk. The second survey asks participants to rate various movie genres (Movies treatment), making the relationship less obvious. Nevertheless, movie ratings could connect to the WTP for the lottery through channels such as personality and gender, which in turn correlate with risk preferences (Rentfrow et al., 2011; Becker et al., 2012; Croson and Gneezy, 2009).
The experiment consists of two stages. In the first stage, we collected responses to these two surveys and the WTP for the lottery through multiple price lists (MPL).666In a MPL task, participants decide whether they would purchase a lottery ticket at various price points, ranging from very low to very high. The prices at which participants switch from buying to not buying the ticket enables the estimation of their WTP. This information is used to train a pricing model. There is no strategic aspect at this stage: participants received a fixed payment for answering them. In the main experiment stage, participants went through one of the surveys, depending on their treatment group, and they were informed that the survey responses would be used to determine the price by a statistical model trained with real data. There is a strategic aspect at this stage: their responses could affect their payments. Participants could, however, choose a privacy option, where they paid a cost to hide their survey responses after submitting them, but before observing the suggested price. In this case, an anonymous price was offered instead.
Our study uncover the following results. First, we find evidence that participants manipulate their responses in both treatments, but more so in Risk than in Movies. Comparing these responses with the training data, we observe a significant difference between the treatment and the training data in seven out of ten Risk survey questions and two out of ten Movies survey questions.777We consider three dimensions–mean, distribution, and variance–and interpret a significant difference in at least one of these dimensions as a sign of manipulation in a question. Second, manipulation by participants is more successful in Risk. That is, the predicted WTP in Risk is significantly lower than in the training data. We find no significant differences in the predicted WTP between the training data and Movies. As a result, individualized prices are significantly lower in Risk than in Movies. Third, contrary to our prediction, participants are significantly more likely to buy the privacy option in the Risk treatment than in the Movies treatment. The decisions to buy the privacy option are significantly more often optimal in Risk than in Movies. The difference is mainly driven by those who do not buy the privacy option when they should, as the individualized price is higher than the anonymous price. These behavior patterns are consistent with participants being naïve about the relevance of their responses to movie ratings for personalized pricing. As a result, participants have significantly higher payoffs in Risk than in Movies.
Our main contributions are twofold. Firstly, we demonstrate that consumers can be strategic against pricing algorithms, but the success of strategic manipulation is substantially reduced when the pricing model relies on data from less related contexts. Although this may not be surprising, there has been a lack of causal empirical evidence supporting both strategic responses to pricing algorithms and consumers’ diminished performance in more complex setups, which are likely to become prevalent in the era of big data.
Secondly, while providing privacy options is essential, somewhat counter-intuitively, privacy is demanded less when pricing models are complex. This result suggests consumers may be naïve about the usefulness of data from less related contexts for personalized pricing, which could potentially decrease consumer welfare due to incorrect strategic responses and less optimal sorting into private browsing. As big data becomes more prevalent, our results call for interventions to increase awareness about the scope of pricing models and promote policies that enhance transparency regarding the inputs used in algorithms and their significance for price discrimination.
Related literature. Our findings are connected to the literature on the welfare implications of targeted price discrimination. The extant theoretical literature primarily considers behavior-based price discrimination where firms offer different prices conditional on the histories of consumer purchases and analyzes the optimal pricing strategies by firms, assuming consumers are not strategic (Villas-Boas, 1999; Fudenberg and Tirole, 2000; Choe et al., 2018). The results are surveyed in Fudenberg and Villas-Boas (2006) and Acquisti et al. (2016). A smaller set of papers have considered the possibility of consumers’ strategic effort to influence the price, mostly assuming consumers can successfully strategize through purchasing behavior (Taylor, 2004; Acquisti and Varian, 2005; Chen et al., 2017; Bonatti and Cisternas, 2020). One exception is Bonatti and Cisternas (2020) where they also show that information matters to consumer behavior under price discrimination. Specifically, they look at the welfare of using aggregated consumer information, such as credit scores, for price discrimination and find that price discrimination based on purchase histories harms naïve consumers who ignore the link between current purchases and future prices, while benefiting sophisticated consumers who understand how firms use their scores for pricing and, crucially, when they can observe their scores. Sophisticated consumers who do not observe their scores can still be harmed. Our result indicating worse consumer welfare in Movies than in Risk is similar to their result of lower welfare for sophisticated consumers when they do not observe their scores. Like theirs, we also study a monopolist setup, but consider price discrimination based on consumer characteristics rather than purchase histories, which is easier to implement in experiments.
Despite the large theoretical literature, empirical evidence on targeted price discrimination is limited, and evidence on strategic behaviors is even more scarce as it is difficult to identify them in the field. A few papers use field data to estimate the impact on consumer welfare—without considering the strategic responses—of offering prices based on past histories (Shiller, 2020) and observable characteristics (Waldfogel, 2015; Dubé et al., 2017; Dubé and Misra, 2022). They find that price discrimination generally increases consumer welfare, though the magnitude depends on the method used. Our study complements the existing literature by providing causal evidence that the similarity of context affects consumers’ strategic decisions on privacy.
The strategic responses explored in our paper connect to the literature on consumer attitudes and behaviors in various contexts. Leibbrandt (2020) uses experiments to study when firms would use price discrimination when consumers can be averse to such action. The results align with a reference point model where consumers care about redistribution and fairness. When it comes to privacy, research has revealed that consumers’ decision-making is affected by behavior biases, such as immediate gratification (Acquisti, 2004), status quo bias (John et al., 2011), and that context matters for the WTP for privacy (Tsai et al., 2011; Beresford et al., 2012; Jentzsch et al., 2012).
Our findings also relate to strategic mistakes observed in the market design and matching literature and add to the debate on the design of privacy regulation policies. In our setting, some participants manipulate their responses even though they should not, leading to reduced welfare. This type of mistake is similar to those observed in the context of matching students to schools and colleges, where seemingly innocuous design details can prevent students from adopting optimal strategies when faced with complex environments (Hassidim et al., 2017; Shorrer and Sóvágó, 2022; Chen and Sebastián Pereyra, 2019). Current regulations on privacy such as GDPR rely on “notice and consent” for data collection, without much emphasis on how the data is actually used. Our results suggest that the sole use of notice and consent is probably insufficient to protect consumers due to strategic mistakes. Additional awareness and guidance on the nature of the relationship between their data and how it is used should be raised so that consumers can manage their privacy.
More broadly, our paper relates to the recent literature on the interaction between AI algorithms and humans. One of its strands documents aversion to following algorithmic advice despite its superior performance (Dietvorst et al., 2018; Jussupow et al., 2020; Greiner et al., 2022; Dargnies et al., 2022). Our paper provides evidence that the preferences for using algorithms can depend on the context. In some situations, consumers choose algorithm pricing, and their choices are more optimal when the context between the product and the information used for pricing is clear.
2 Experimental Design
The primary goal of our experiment is to identify subjects’ strategic responses to personalized pricing and their demand for privacy. This is achieved through a two-stage experiment that both involves survey questions related and less related to the product for sale—a lottery with a 50% probability of winning £5, and decisions to purchase the lottery at a given price. A key difference between the two stages is how subjects were incentivized, which we will describe shortly. Details of the survey questions and the instructions can be found in Appendix B. At the beginning of each experiment, we asked subjects for their gender, age, and consent to be part of the study. We use gender and age as control variables throughout our analysis. We deployed our experiments on the Prolific Platform with a sample from the US population. We pre-registered the design and main hypotheses in the AEA RCT registry (AEARCRT-0009440).888The pre-registration contains two additional treatments—ScopeRisk and ScopeMovies. These treatments inform subjects about the range between minimum and maximum personalized prices. Our interest in the effect relied heavily on the assumption that subjects underestimate the scope of price discrimination, which is not the case in our data. We opted out of presenting the data from these treatments in the main text to simplify the paper’s exposition and motivation, focusing on the difference between the Risk and Movies surveys. We present the results of these treatments in the Online Appendix. The design received ethical approval from the Ethics Board of HEC Lausanne.
2.1 Training Sample
In the first stage, we collected data which we then used as a training sample for developing an personalized pricing model (or algorithm). Subjects in this stage received a fixed payment for their responses and therefore did not affect the price. As a result, we interpreted their responses as truthful. We collected responses to the following two surveys in a random order for our training sample:
-
1.
A survey to identify the risk preferences of subjects, similar to the assessments conveyed by insurance companies (Risk survey).
-
2.
A survey where subjects rate movie genres (Movies survey).
Afterwards, subjects entered the final stage, where we elicited their WTP for the lottery using MPL. Each row of the lists presents subjects the option to choose between buying the lottery or not buying it at a specific price. The price varied from £0.20 to £4 in £0.20 increments. One of the rows was chosen randomly, and the associated choice of buying or not was implemented and paid out for 20 randomly chosen subjects.
2.2 Treatments: Risk and Movies
In the main experiment stage, we ran between-subjects treatments where subjects completed one of the surveys. Risk refers to the treatment with the Risk survey. Movies refers to the treatment with the Movies survey.
Before the survey, subjects were informed that a statistical model built using answers from real subjects would determine the lottery price in a later round of the experiment. This was the only information that subjects were given about the pricing model. To ensure subjects could afford the lottery, which had a maximum rice of £2.09 according to our pricing model, we paid a high fee of £2.20 to subjects for completing the survey.
After completing the survey but before observing the price, subjects could choose to conceal their survey responses from the seller (imitating a privacy—or private browsing—option) for a cost of £0.10. If they decided to hide the survey responses, the price would be the one that maximized revenue, given the distribution of the WTP in the entire training sample. We referred to it as the anonymous price. Subjects were informed that they would learn about both the individual and the anonymous prices at the end of the experiment to avoid curiosity motives.
In the following step, subjects had to decide whether to buy the lottery at a given price , which was either determined by the algorithm using their survey responses (if the subjects decided not to hide their responses) or by the anonymous pricing. When they chose to buy, the lottery was played out, and the subject’s payoff for the last round was £, if won or if lost. If negative, the payoff was deducted from the reward given for filling out the survey.
In the last experimental task, we elicited the subjects’ beliefs about the lowest and the highest individualized prices that the pricing model could generate. We paid them £0.10 if they were within £0.20 of the lowest price and £0.10 if they were within £0.20 of the highest price.
2.3 Sample data
We collected 804 responses for the training data. The average duration of the survey in the training sample was 5.5 minutes. The participation payment was £1, and in addition, 20 randomly chosen respondents received their payoff from the lottery task. We collected 302 and 301 responses in the Risk and Movies treatments, respectively. The average duration for these was 7.5 minutes. The average payoff of the participants was £6.30, including a £0.75 payment for participation.
3 Hypotheses
Our first hypothesis relates to whether subjects’ behavior indicates that they make clear attempts to strategize their survey answers in response to the knowledge that their answers will determine the prices they face.
Hypothesis 1.
Participants attempt to manipulate the responses: The distributions of responses in Risk and Movies are significantly different from the responses to the same questions in the training data.
Next, we hypothesize that subjects have a better understanding of the relationship between demand for lotteries and a survey on risk preferences, as opposed to one about movie genre preferences. In principle, it is conceivable that a pricing model based on the Movies survey would result in a wider range of manipulation possibilities. If subjects know how to work with them, they could be more successful in their attempts in obtaining lower prices. We conjecture, however, that the subjects will fail to successfully infer the more complex relation between their WTP and movie preferences.
Hypothesis 2.
Participants are more successful in strategically shifting down their predicted WTP in Risk than in Movies: The predicted WTP in the training data is significantly higher than in Risk, and is not significantly different from Movies.
While subjects may not be able to manipulate the Movies survey as well as the Risk survey, we conjecture that they will be aware of the complexity involved in the former and, as a result, choose the privacy option more often in the Movies treatment. This is because they may wish to avoid the risk of making incorrect choices.
Hypothesis 3.
Participants anticipate the complexity of manipulating the Movies treatment and select the privacy option significantly more often than in the Risk treatment.
Additionally, a clearer understanding of the relation between their responses and the predicted values in Risk should also result in a higher proportion of optimal choices for the privacy option. That is, choosing the privacy option if the price under privacy is lower than personalized price.
Hypothesis 4.
The proportion of optimal privacy choices is higher in the Risk than in the Movies treatment.
4 Results
4.1 The pricing model
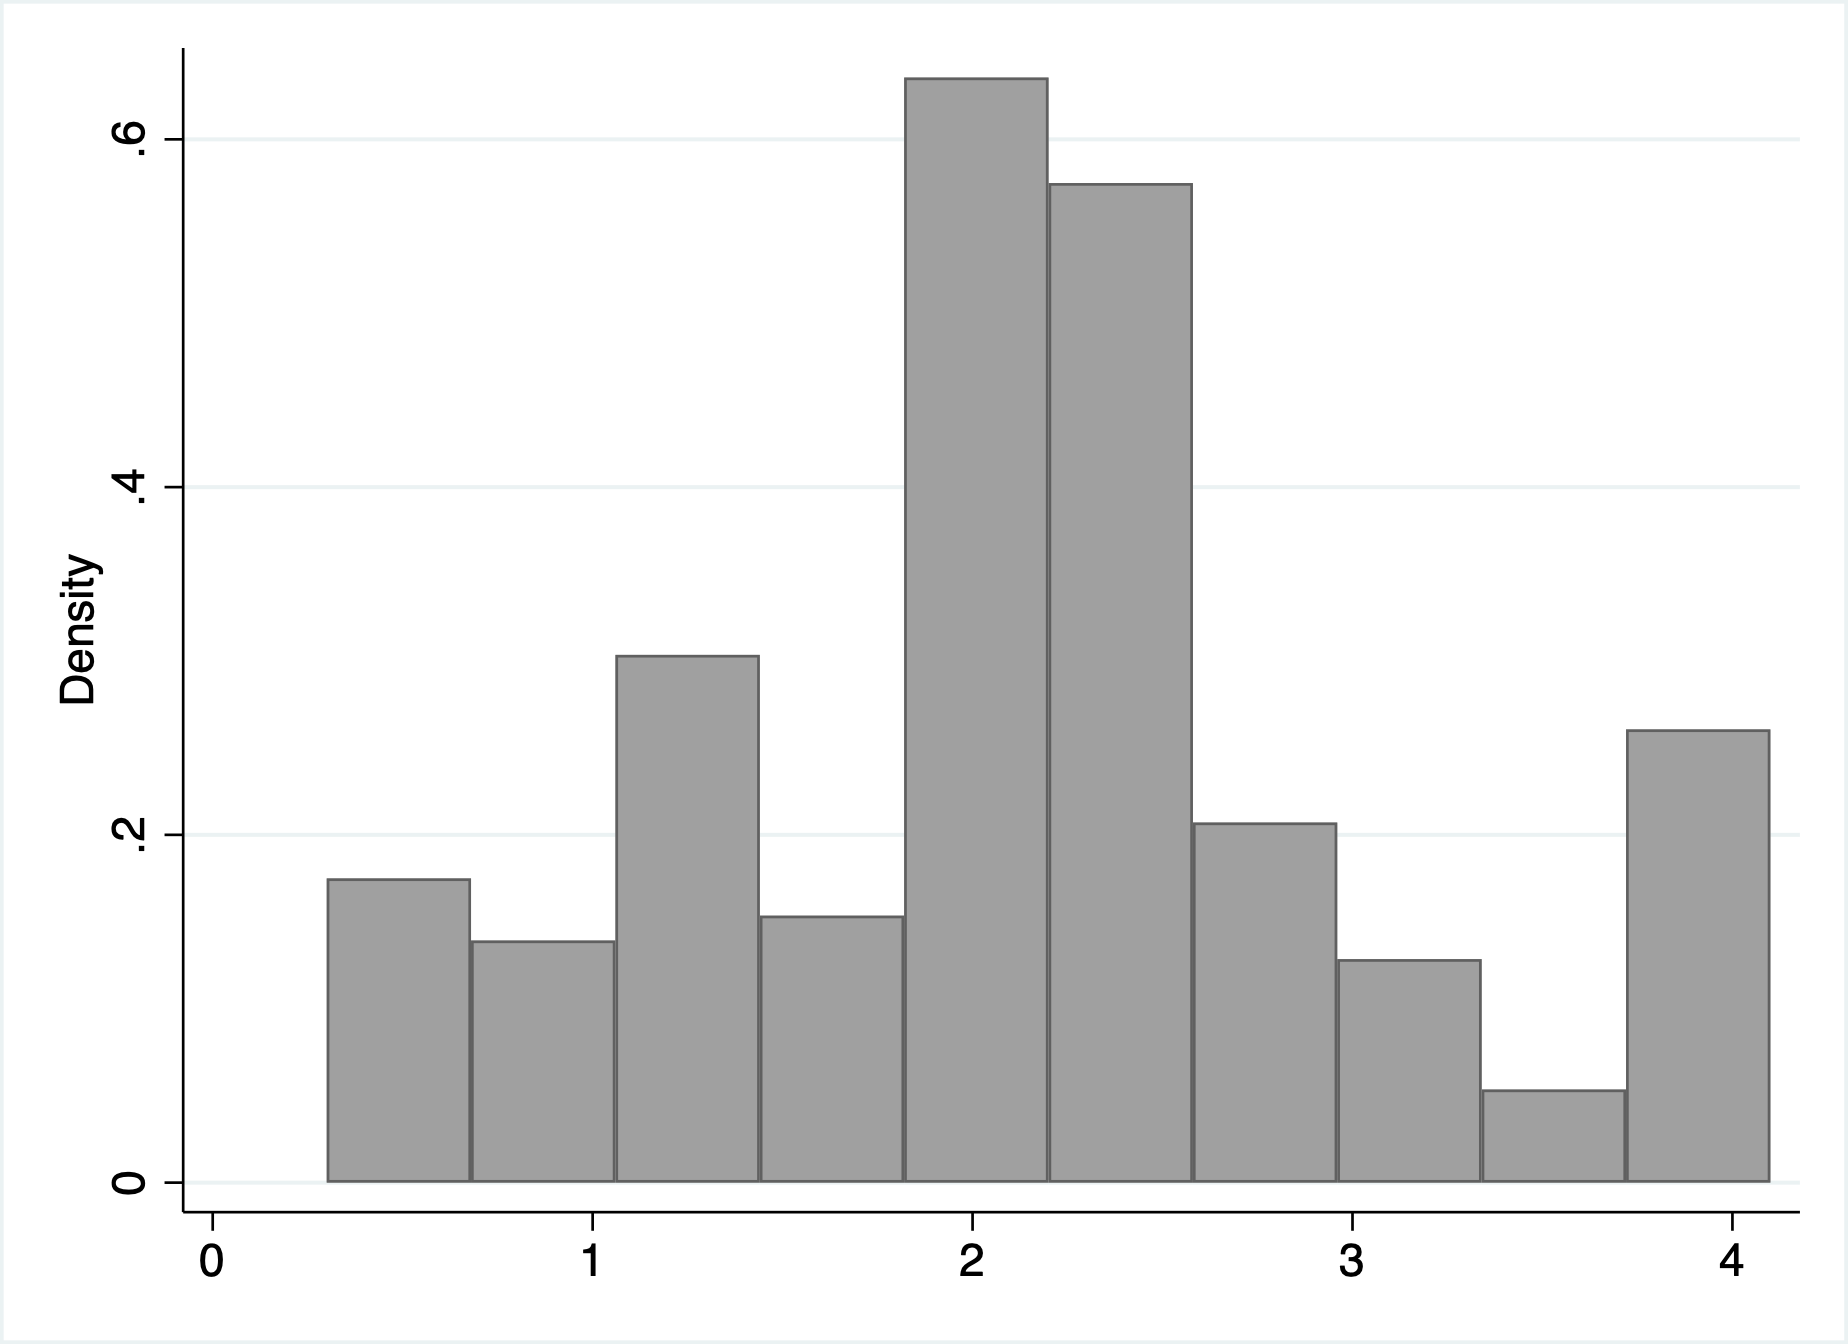
This subsection presents the descriptive results of the training data and the development of the pricing model for our main treatments. First, we define the WTP as the switching point of the choices between lotteries in the MPL. Out of 804 collected responses, 67 had multiple switching points, and we exclude them from the analysis, as we would have to make additional assumptions to assign a WTP to these subjects. For the remaining 737 subjects,999Note that some subjects did not answer one or several survey questions. Thus we cannot use them in the model estimation. This leaves us with a sample of 731 subjects in Risk and 723 in Movies. we calculated the WTP value as the average between the prices of the lotteries adjacent to the switching point from not buying to buying. For example, if a subject chose not to buy a lottery for £2.0 but chose to buy it for £1.8, we assigned a WTP of £1.9 to this subject. For those subjects who always chose not to buy the lottery—even at a price of £0.60, we assigned a WTP of £0.30. For the subjects who always chose to buy the lottery—even at a price of £4, we assigned a WTP of £4.10. Figure 1 presents the distribution of the resulting WTP. Simple optimization shows that the revenue-maximizing price is £1.85. In the training sample, this price would result in 521 sales, with a total revenue of £963.85.
Before developing a predictive model, we present the correlations between the WTP and answers to each survey. Table 1 shows the Spearman correlations of the WTP with the responses to the Risk survey (Panel A) and the Movies survey (Panel B). We observe a significant correlation of the WTP with seven out of ten Risk survey questions at the 5% level. The WTP correlates the most with the question about forgoing gains for securities of investment and game show decisions, and the correlations are in the predicted direction. Specifically, the subjects with a higher WTP tend to disagree more with the statement that “I am prepared to forego potentially large gains if it means that the value of my investment is secure.” In addition, subjects who chose to bet on alternatives with different winning probabilities and awards in a hypothetical TV game show scenario, rather than quitting with a safe option, tend to have a higher WTP for the lottery. As for the Movies survey, only five out of ten questions significantly correlate with the WTP. The strongest is the ratings for crime movies. Thus, our hypothesis that survey responses might correlate with the WTP found support in the data. As mentioned earlier, we based our assumption that responses to the Movies survey would correlate with WTP on two channels. First, the big five personality traits correlate with movie ratings (Rentfrow et al., 2011) and risk (Becker et al., 2012). Second, through gender, women are more risk-averse than men (Croson and Gneezy, 2009). We can verify the latter channel by testing whether movie ratings predict the gender of the respondent. Indeed, in our training data, simple OLS regression of gender on the movies ratings has adjusted- of 24%, resulting in the correct categorization of the subjects’ gender in the linear discriminant analysis for 74% of subjects (see Tables A.1 and A.2 in Appendix A).
| Panel A | Panel B | ||
| Risk survey | WTP | Movies survey | WTP |
| R1:Forgo gains for secure investment | 0.12*** | M1:Romance | 0.04 |
| R2:Annual income | 0.08** | M2:Horror | 0.10** |
| R3:Loss of 14%, action | 0.08** | M3:Action | 0.09** |
| R4:Current insurance amount | 0.07** | M4:Documentary | -0.01 |
| R5:Which stock you choose | 0.00 | M5:Foreign | -0.01 |
| R6:Borrow for investment | 0.09** | M6:Fantasy | 0.06 |
| R7:Gameshow safe vs alternative | 0.14*** | M7:Comedy | 0.11*** |
| R8:Smoking | 0.05 | M8:Historical | 0.01 |
| R9:Amusement park | 0.05 | M9:Crime | 0.16*** |
| R10:Future employments | -0.07** | M10:Thriller | 0.09** |
| Notes: * , ** , *** . | |||
The first step in developing the pricing model is to create a predictive model of WTP using survey answers. There are numerous ways to address this question, including the use of machine learning techniques. However, we chose a simpler model, as our primary objective is not to achieve the highest level of precision. Instead, we aim for a straightforward model that can be easily implemented in Qualtrics and allows for a clear interpretation of the coefficients.We use the OLS of the WTP for all variables of a survey and all possible pairwise interactions between these variables. We then eliminated all variables with -values above 0.5, then 0.3, and then 0.1. The resulting model is used to predict the WTP. Tables A.3 and A.4 in Appendix A present the resulting models. As expected, the of the Risk model (13.8%) is higher than that of the Movies model (11.4%).
While our level of precision is relatively low and direct pricing according to the prediction might not be profitable due to noise,101010For instance, when the model’s predictive power is low, the high price might be shown too often to those whose WTP is above the anonymous price but below the high price, thus resulting in no sale under personalized pricing. the pricing model could help to identify participants with high and low WTP. As we are interested in pricing models with the same scope of prices between the two treatments, we opted for a pricing that offers three price levels: low, medium, and high. We fixed the medium price to be the anonymous price, i.e., £1.85, and ran simulations for the high and low prices to maximize the profit for the Movies and Risk, such that the expected sales are higher than under anonymous pricing. More precisely, we varied the high and low prices and the cutoff values that separate these prices in each model. The resulting pricing models are:
-
•
In the Risk treatment: If the predicted WTP according to the Risk model is above £2.11, display the price £2.09. If the predicted WTP according to the Risk model is below £1.30, display the price £1.09. Otherwise, display £1.85.
-
•
In the Movies treatment: If the predicted WTP according to the Movies model is above £2.22, display the price £2.09. If the predicted WTP according to the Movies model is below £1.30, display the price £1.09. Otherwise, display £1.85.
It is worthy noting that the goal of our model was not to approximate firms’ more sophisticated pricing models in reality, but rather to allow for some price discrimination in the experiment. The current model fits for this purpose. We are primarily interested in participants’ strategic response to the announced use of their answers and their privacy choices. As we intentionally do not reveal any details of the model to the participants, we believe our results concerning treatment differences are independent of the exact model we use.111111The results in section 4.4 are the exception, as pointed out at the beginning of that section. These are, however, not essential for the paper’s main goal.
The resulting simulated sales are £973.48 in the Risk and £981.08 in the Movies surveys. While the pricing model does not offer a vast improvement over the anonymous prices, they suit our goal of testing the strategic response of the participants when facing personalized pricing models, which is the main focus of this paper.
4.2 Strategic responses in the surveys
We start by identifying attempts to strategize the responses to the surveys by comparing the responses in the treatments to the training data. First, we run OLS regressions of the answers to each Risk survey question on the dummy for the training data.
Figure 2 helps to visualize the dummy coefficients for the training data for questions in the Risk survey with a sample of the Risk treatment and the training data. The OLS regressions include controls for gender and age. Relative to the training data, subjects in the treatment significantly disagree more with the statement of forgoing gains in exchange for security (R1:Forgo gains for secure investment). In addition, they report significantly more often that they expect a substantial annual income increase (R2:Annual income), and intend to “sell not to worry” in the case of a sharp loss of 14% of investment value (R3:Loss of 14%, action). The evidence above strongly supports the manipulation hypothesis, as moving the average responses requires coordinated efforts to bias answers in a particular direction.
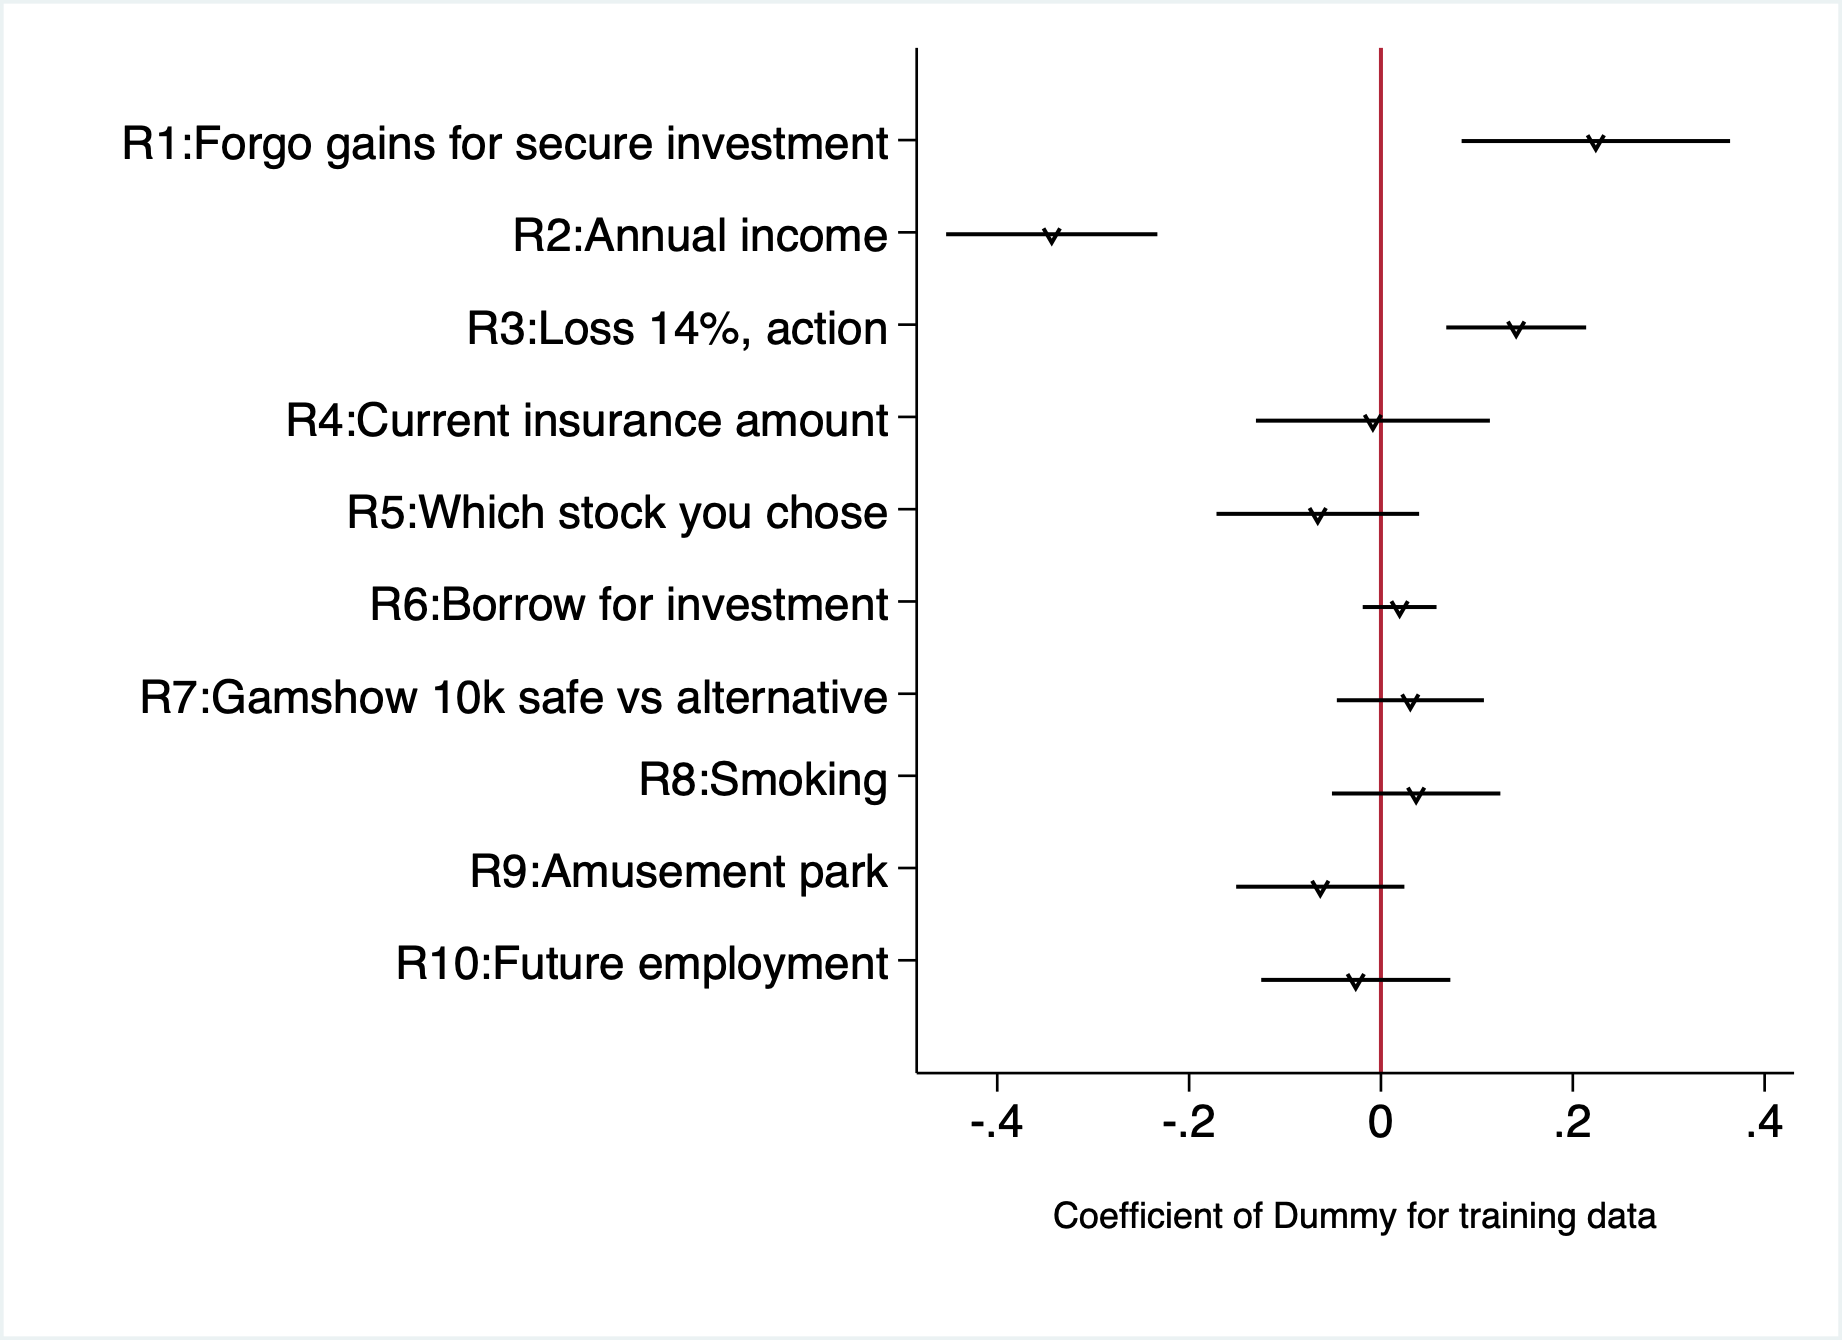
Notes: The sample consists of the Risk treatment and the training data. A negative coefficient indicates that the average survey answer is larger than the training data, while a positive coefficient points to a smaller average answer in the survey than in the training data. For question R1, a response of strongly disagree with the statement corresponds to 5, while strongly agree corresponds to 1. For question R2, a response of the annual income grows substantially corresponds to 5, while a substantial decrease corresponds to 1. For question R3, a response of buying more the investment when it loses 14% of its value corresponds to 3, while selling the investment corresponds to 1.
| Question | -value variance test | -value Mann-Whitney test |
|---|---|---|
| R1:Forgo gains for secure investment | 0.00 | 0.02 |
| R2:Annual income | 0.00 | 0.00 |
| R3:Loss of 14%, action | 0.31 | 0.00 |
| R4:Current insurance amount | 0.08 | 0.71 |
| R5:Which stock you choose | 0.62 | 0.03 |
| R6:Borrow for investment | 0.00 | 0.15 |
| R7:Gameshow safe vs alternative | 0.82 | 0.48 |
| R8:Smoking | 0.00 | 0.19 |
| R9:Amusement park | 0.30 | 0.00 |
| R10:Future employments | 0.69 | 0.32 |
Another sign of manipulation attempts could be differences in the variance of answers or in the distributions. We test the former with a variance test and the latter with a Mann-Whitney non-parametric test. Table 2 presents the -values for the test of equality of variance (the second column) and equality of distributions (the third column) between the answers in the training data and the treatments. There is a significantly higher variance in the treatment than in the training data in the following questions: R1:Forgo gains for secure investment, R6:Borrow for investment, and R8:Smoking. There is a significantly lower variance in the treatment than in the training data in the question about annual income expectations. Results from the Mann-Whitney test generally align with the regression results, though they add significant differences in distributions in questions about which stock one would choose and preferences regarding amusement parks. Thus, overall, we see at least one sign of manipulation (5% significant difference in mean, variance, or distribution) in seven out of ten Risk survey questions.
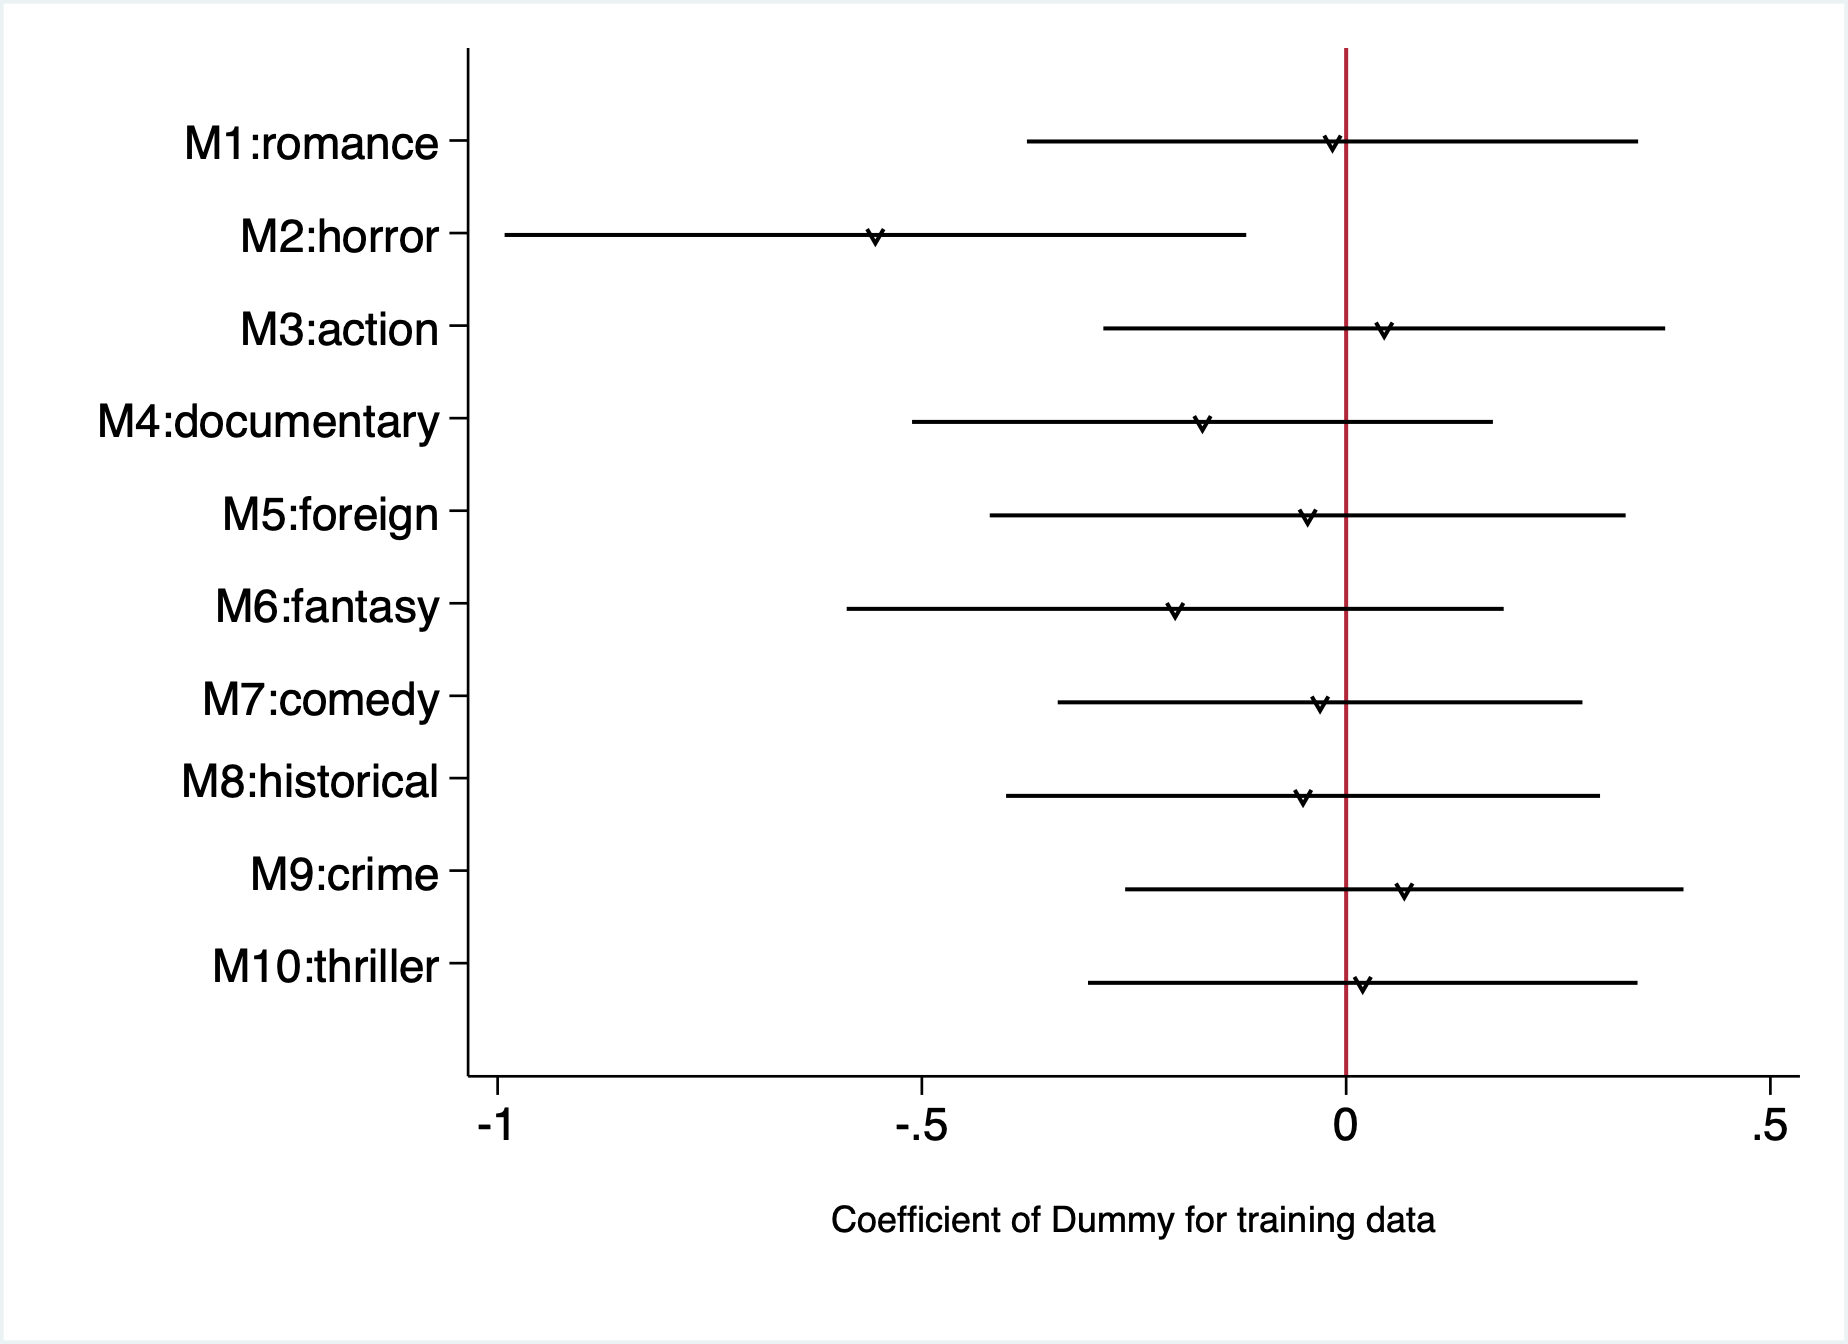
Notes: The sample consists of the Movie treatment and the training data. A negative coefficient indicates that the average survey answer is larger than the training data, while a positive coefficient points to a smaller average answer in the survey than in the training data. Ratings are on a scale from 1 to 10.
In Movies, the only significant difference between the treatment and the training data in the OLS regressions is the higher ratings of horror movies in the treatment, as shown in Figure 3 (M2:horror). As before, the regressions include control for gender and age. There is a significantly higher variance in the treatment than in the training data in the rating of action movies. There is a significantly lower variance in the treatment than in the training data in the ratings of fantasy movies. In Table 3, results from the Mann-Whitney test generally confirm the regression results for ratings of horror movies and also point to a significantly different distribution of the ratings of fantasy movies between the training sample and the treatments. Thus, overall, we see at least one sign of manipulation (5% significant difference in mean, variance, or distribution) in two out of ten Movies survey questions.121212An alternative interpretation is that, in Movies, subjects manipulated their responses but in random directions. We cannot exclude this possibility, but it would also be a sign of a lack of agreement on how movie ratings relate to prices.
| Question | -value variance test | -value Mann-Whitney test |
|---|---|---|
| M1:Romance | 0.42 | 0.80 |
| M2:Horror | 0.97 | 0.00 |
| M3:Action | 0.09 | 0.97 |
| M4:Documentary | 0.51 | 0.98 |
| M5:Foreign | 0.37 | 0.94 |
| M6:Fantasy | 0.05 | 0.00 |
| M7:Comedy | 0.22 | 0.18 |
| M8:Historical | 0.86 | 0.07 |
| M9:Crime | 0.97 | 0.42 |
| M10:Thriller | 0.85 | 0.82 |
Result 1.
(Strategic responses): Subjects attempt to manipulate their responses to the survey questions. We find significant manipulation in seven questions in the Risk survey and two in the Movies survey.
Are these manipulations successful? In other words, do participants manage to shift down the predicted WTP? Table 4 presents the results of regression analyses comparing the predicted WTP. between the training data and treatments. Predicted WTP in the Risk treatment (Columns (1) and (2)) is significantly lower than in the training data. Thus, participants’ strategic responses result in lower estimations of their WTP, and are therefore successful on average. However, in the Movies treatment (Columns (3) and (4)), the opposite is true: on average, predicted WTP is higher than in the training data. This increase is not significant once we control for gender and age. Thus, in the Movies survey, participants could not shift the predicted WTP in their favor.
| Predicted | Predicted | Predicted | Predicted | Individual | Individual | |
| WTP | WTP | WTP | WTP | price | price | |
| (1) | (2) | (3) | (4) | (5) | (6) | |
| Risk | -0.081*** | -0.090*** | ||||
| (0.024) | (0.025) | |||||
| Movies | 0.054** | 0.018 | 0.085*** | 0.085*** | ||
| (0.023) | (0.024) | (0.016) | (0.016) | |||
| Age | -0.001 | -0.003*** | -0.001 | |||
| (0.001) | (0.001) | (0.001) | ||||
| Female | -0.063*** | 0.001 | -0.034** | |||
| (0.022) | (0.021) | (0.016) | ||||
| Constant | 2.166*** | 2.228*** | 2.177*** | 2.326*** | 1.926*** | 1.961*** |
| (0.013) | (0.036) | (0.013) | (0.035) | (0.011) | (0.026) | |
| Observations | 1033 | 1033 | 1024 | 1024 | 603 | 603 |
| Adjusted | 0.010 | 0.017 | 0.004 | 0.024 | 0.046 | 0.051 |
| Sample | Train+Risk | Train+Risk | Train+Mov | Train+Mov | Risk+Mov | Risk+Mov |
-
•
Notes: OLS regressions of the predicted WTP in Columns (1) to (4). OLS regressions of individual prices based on survey answers in Columns (5) and (6). Standard errors between parentheses. * , ** , ***
These first results of the data are informative, but does the shift in the predicted WTP have a meaningful impact in the price? Columns (5) and (6) in Table 4 show the results of the regressions of the individual prices generated based on our pricing model and participants’ responses. The individual prices are significantly higher in Movies than in Risk. These results directly support Hypothesis 2.
Result 2.
(Success of strategic response): The predicted WTP is significantly lower in the Risk survey than in the training data. There is no significant difference in the predicted WTP between the Movies and the training data, controlling for gender and age. Individual prices are significantly higher in the Movies survey than in the Risk survey.
4.3 Privacy choices
Before analyzing the treatment differences, we first look at the correlates of the privacy choices in our baseline treatments. Table 5 presents the results of the marginal effects of a Probit regression for the decision to choose the privacy option or not on the observables. Column (1) shows that the privacy choice does not correlate with gender and age. Column (2) controls for the beliefs about the highest and lowest possible individual prices. When participants have higher beliefs about the upper and lower bounds of individual prices, they are less likely to choose the privacy option. However, the coefficients are only marginally significant. The interpretation is challenging, as one would expect the opposite direction of the effects. That is, we should expect that the higher the beliefs about the price bounds, the more likely participants are to choose the privacy option, as it allows them to hide information and avoid personalized pricing.
One possible explanation for the negative correlation between privacy choices and beliefs about the highest and lowest prices is that participants base their privacy choices on their expectations of the anonymous price. Even though they believe the low and high prices are high, they may still choose to disclose their information if they expect the alternative anonymous price to be also high. Unfortunately, we did not elicit this in our study. Nevertheless, if participants believe the anonymous price would fall between the highest and the lowest prices, then we can use the average between the lowest and highest beliefs as an approximation of the believed anonymous price. Column (3) controls for this average belief. The coefficient is negative and significant: the larger the average belief, the less often participants choose the privacy option. This is in line with the interpretation that a higher believed anonymous price leads to lower privacy demand.
| Privacy choice | Privacy choice | Privacy choice | |
| (1) | (2) | (3) | |
| Age | -0.000 | -0.000 | -0.000 |
| (0.002) | (0.002) | (0.002) | |
| Female | 0.058 | 0.044 | 0.045 |
| (0.036) | (0.036) | (0.036) | |
| Belief low | -0.074* | ||
| (0.041) | |||
| Belief high | -0.051* | ||
| (0.031) | |||
| Average belief | -0.120*** | ||
| (0.045) | |||
| Observations | 603 | 602 | 602 |
-
•
Notes: The table reports marginal effect of Probit regression of a dummy variable for the choice of privacy option. The sample includes both Risk and Movies treatments. Belief low shows the elicited belief about the lowest possible individual price. Belief high is the elicited belief about the highest possible individual price. Average belief shows the average between believed low and high individual prices. Standard errors between parentheses. * , ** , ***
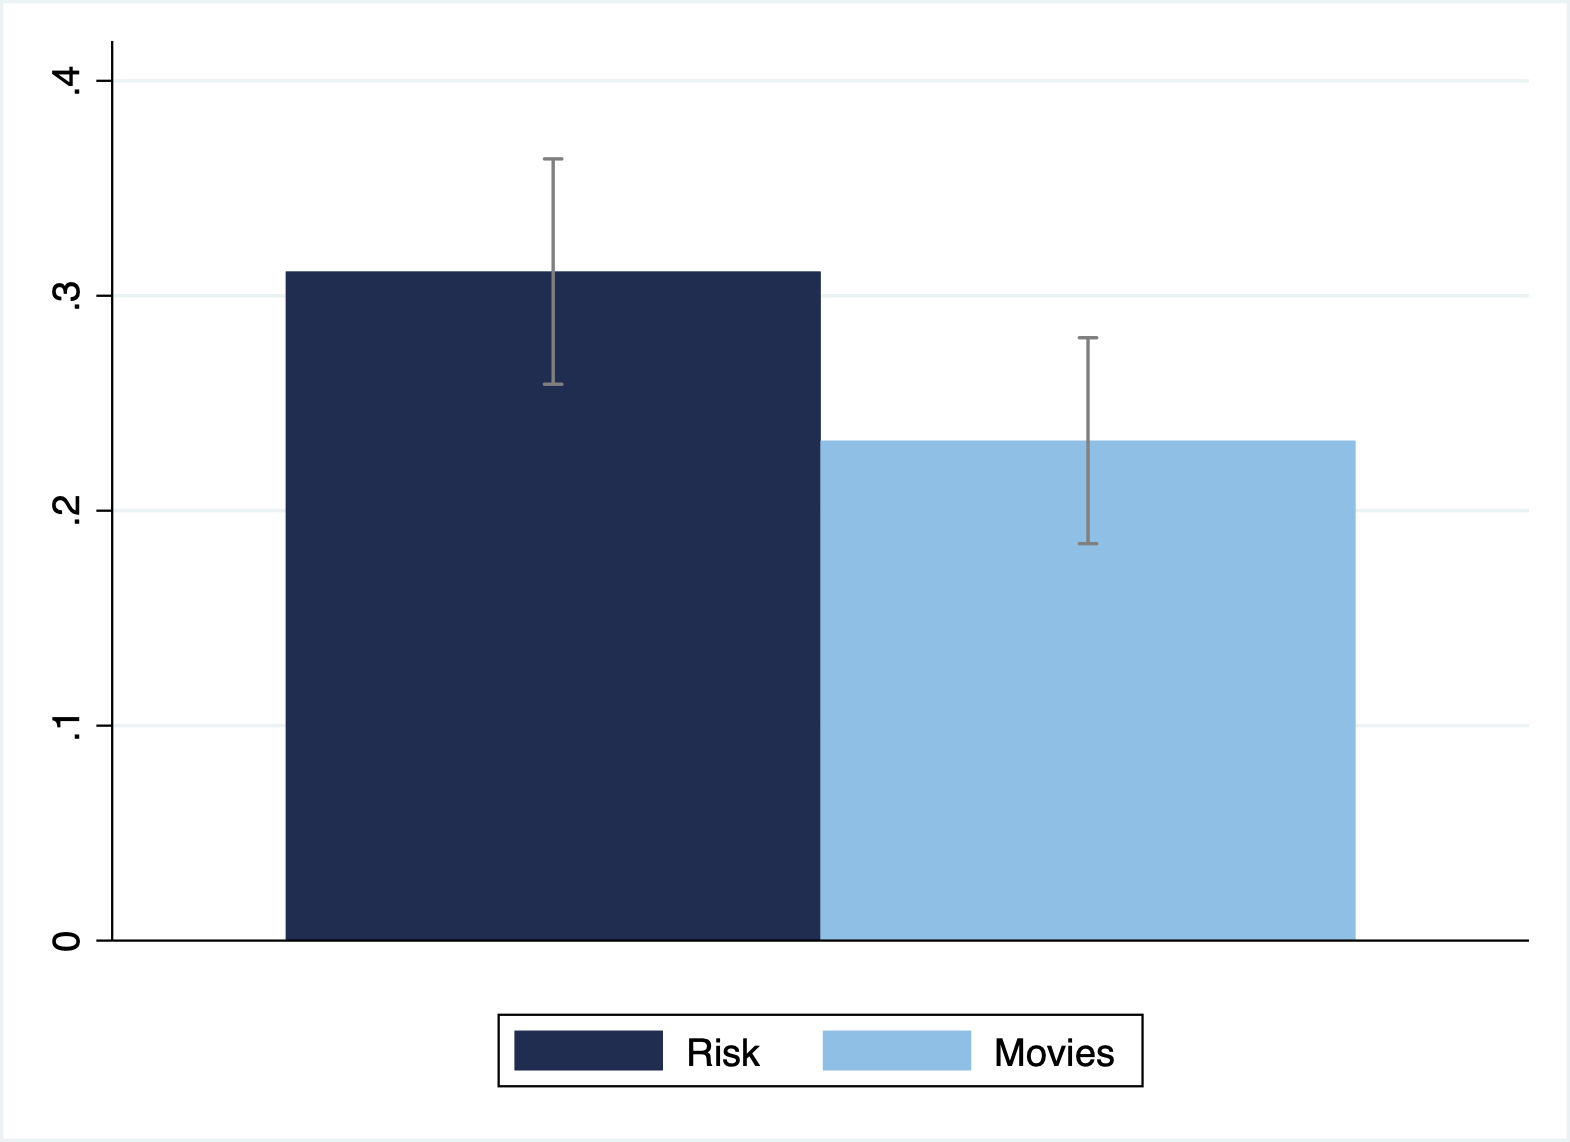
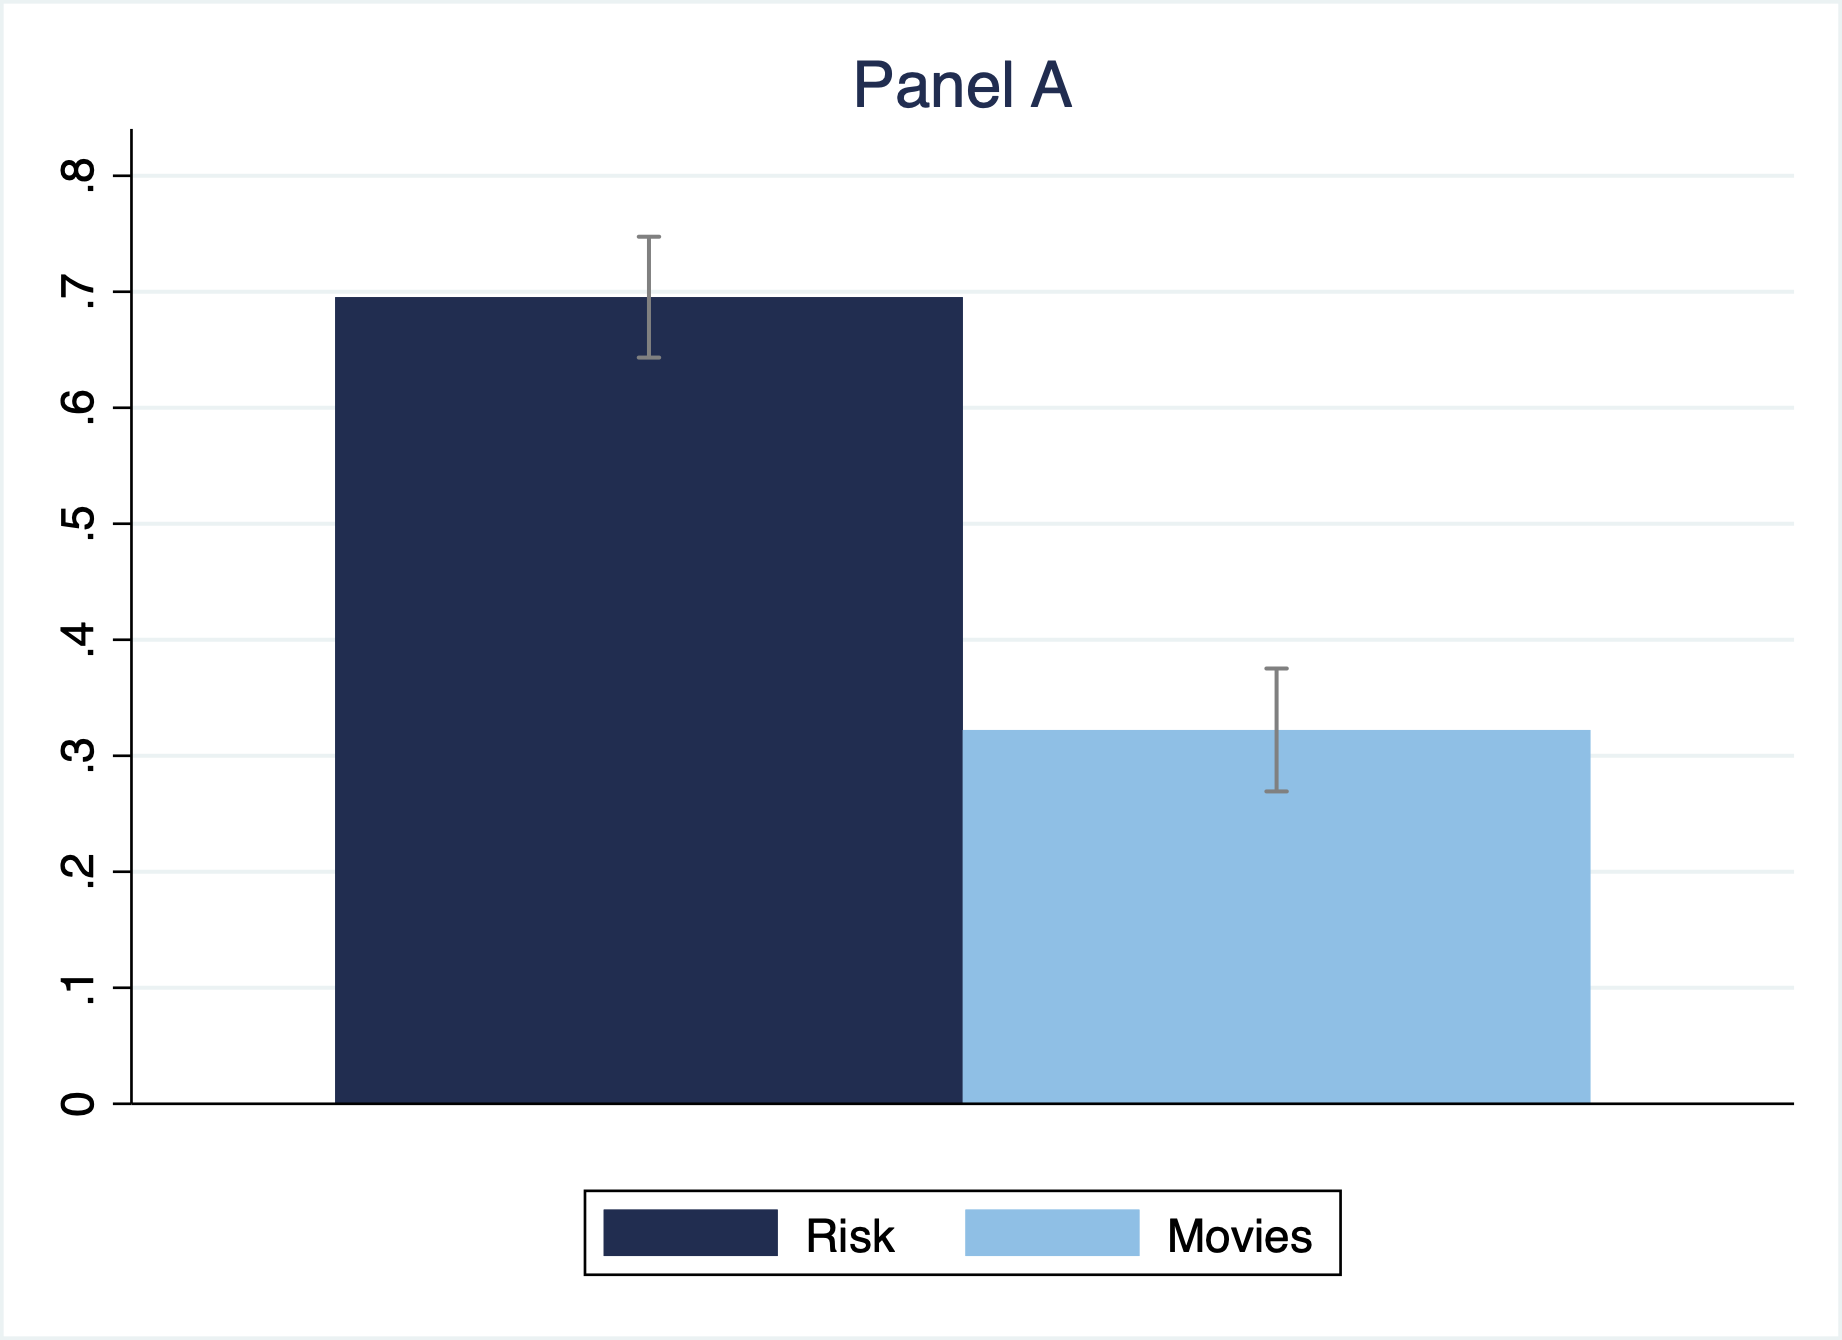
Next, we analyze treatment differences in the privacy choices. Figure 4 presents the proportion of privacy choices by treatment. Overall, we see low demand for privacy (31.1% and 23.2% in Risk and Movies, respectively). Table 6 shows the marginal effects of a Probit regression on privacy choices. Column (1) shows that participants chose the privacy option significantly less often in Movies than in Risk. The result is robust to individual controls and a proxy for beliefs about the anonymous price, as shown in Columns (2) and (3). Thus, we find no support for Hypothesis 3 but a significant opposite effect.
We propose two possible explanations for this result. The first possibility is participants’ overconfidence in their ability to manipulate the Movies survey.131313Overconfidence has been found in different applications, including lying (Serra-Garcia and Gneezy, 2021), unraveling of matching market (Dargnies et al., 2019), labor market (Santos-Pinto and de la Rosa, 2020), delegation to algorithms (Dargnies et al., 2022) and market places like our paper (Grubb, 2015). The link between the context of the survey and the product is weak in Movies. The pricing model is, therefore, less clear to participants compared to Risk. However, the attempts to game the system, which in fact reduced their welfare, are consistent with the fact that they overestimate their ability to understand the pricing model. The second possibility is that participants perceive the Movies survey as less informative to the firm for the purpose of price discrimination. In other words, subjects are naïve in estimating the relevance of movie ratings for the price.141414This is consistent with, for instance, massive media coverage and discussions of results of Kosinski et al. (2013). The fact that Facebook likes can predict sex, sexual orientation, and political preferences of users was perceived as surprising and created some resonance, pointing to the original naïvité of users in terms of informativeness of their behavior. Because the privacy option is costly, participants perceive this choice as wasteful. This might explain the fewer attempts of strategic responses in Movies. While we cannot distinguish between these explanations, we believe the latter is more realistic: the seemingly unrelated context of the movie ratings leads to subjects naïvely believing that it is less consequential for the price.
| Privacy choice | Privacy choice | Privacy choice | |
| (1) | (2) | (3) | |
| Movies | -0.078** | -0.080** | -0.076** |
| (0.036) | (0.036) | (0.035) | |
| Age | -0.001 | -0.001 | |
| (0.002) | (0.002) | ||
| Female | 0.058 | 0.045 | |
| (0.036) | (0.036) | ||
| Average belief | -0.119*** | ||
| (0.044) | |||
| Observations | 603 | 603 | 602 |
-
•
Notes: The table reports marginal effects of Probit regressions on the choice of privacy option dummy. The sample includes both Risk and Movies treatments. The average belief shows the average between the believed low and high individual prices. Standard errors are between parentheses. * , ** , ***
We proceed to analyze the optimality of the privacy choices. We constructed a dummy variable for optimal privacy choice, which is equal to 1 if: (i) the individual price is high, and the participant chooses the privacy option; (ii) the individual price is low or middle, and the participant chooses not to buy the privacy option. It equals zero otherwise.151515Our analysis assumes that everyone prefers to see a lower price. This is not exactly optimal since when a participant does not buy the lottery, we do not know the conterfactual decision. Thus, optimality analysis is impossible in the strict sense. Nevertheless, we think the current approach is informative about optimal sorting into privacy, at least to some extent.
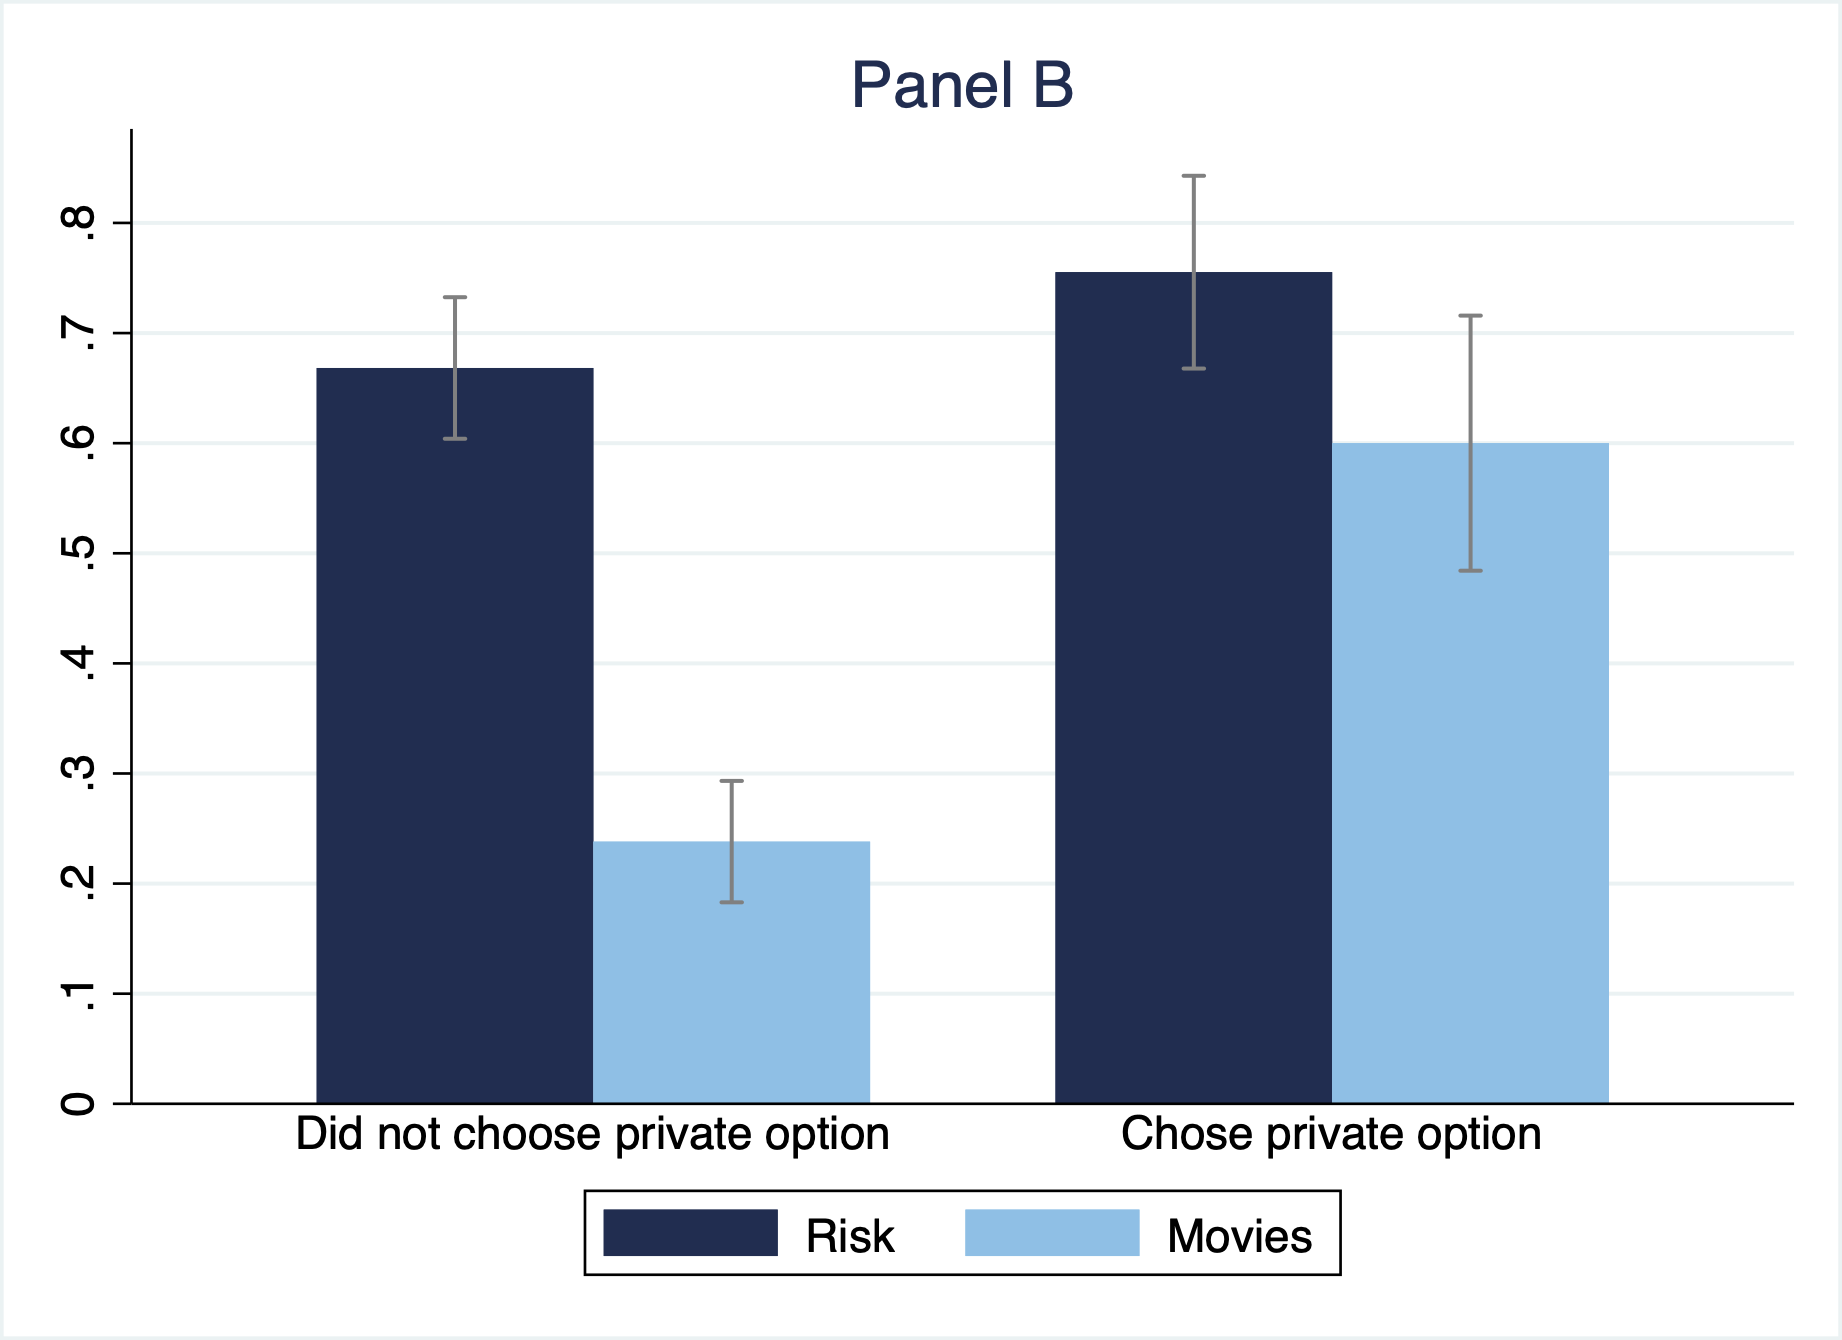
Panel A of Figure 5 shows the proportion of optimal privacy choices by treatment. The proportion is higher in Risk than in Movies, and the difference is large. Table 7 presents the results of regression analyses, and Columns (1) and (2) support the significance of the difference. This supports Hypothesis 4. Thus, participants are better sorted in choosing the privacy option in Risk than in Movies, which suggests that participants have a better understanding of the relationship between the responses and the resulting prices in the Risk survey than in the Movies survey.
Panel B of Figure 5 shows the proportion of optimal privacy choices by treatment, dividing the sample according to whether participants chose the privacy option. The figure suggests that the main difference in the optimality of the privacy choice comes from those who did not choose the privacy option. In Movies, only 24% of participants who did not choose the privacy option did it optimally, while this proportion is 67% in Risk. Columns (3) and (4) of Table 7 present the regression analyses, controlling for privacy choice. First, on average, the proportion of optimal choices is higher among those who chose the privacy option (see the coefficient of the variable “Chose privacy dummy” in Column (3)). However, this result is driven by the Movies treatment, as seen in Column (4). Thus, the inferior proportion of optimal privacy choices in Movies is driven by the under-demand for privacy from those who would face the high price. This result is in line with the explanation that the participants were naïve about the effectiveness of the movie rating information for price discrimination. Importantly, treatment differences are significant, even for those who chose the privacy option ().
| Optimal privacy | Optimal privacy | Optimal privacy | Optimal privacy | |
| choice | choice | choice | choice | |
| (1) | (2) | (3) | (4) | |
| Movies | -0.345*** | -0.344*** | -0.327*** | -0.387*** |
| (0.029) | (0.029) | (0.029) | (0.033) | |
| Age | 0.001 | 0.001 | 0.001 | |
| (0.002) | (0.002) | (0.002) | ||
| Female | 0.056 | 0.039 | 0.039 | |
| (0.038) | (0.037) | (0.037) | ||
| Chose privacy dummy | 0.202*** | 0.083 | ||
| (0.040) | (0.056) | |||
| Movies*Chose privacy dummy | 0.240*** | |||
| (0.080) | ||||
| Observations | 603 | 603 | 603 | 603 |
-
•
Notes: The table reports marginal effects of Probit regressions of dummy for optimal choice of privacy option. Sample includes all treatments. Standard errors between parentheses. * , ** , ***
Result 3.
(Privacy choices): The proportion of participants choosing the privacy option in the Risk survey is significantly higher than in the Movies survey. The proportion of optimal decisions of whether to buy the privacy option is significantly higher in the Risk survey than in the Movies survey. The largest treatment difference in optimality is driven by those who did not buy the privacy option.
4.4 Buying decisions and payoffs
In a last step, we look at results for the buying decisions and payoffs. These results are presented for the completeness of the analysis. It should be taken with a grain of salt, as the the buying decisions and payoffs rely heavily on the precision of the algorithm that predicts the WTP and thus may not be externally valid, unlike the main results of the paper concerning the strategic responses and privacy choices.
Table 8 presents the marginal effects of a Probit regression for the dummy of buying the lottery. Columns (1) and (2) show that the proportion of buying decisions is significantly lower in Movies than in Risk. However, controlling for the price, there is no significant difference between treatments, as seen in Column (3). The higher the price, the lower the propensity to buy. Column (4) adds control for those who chose the privacy option and suggests that those who opted for privacy are significantly more likely to buy the lottery. One explanation could be that this is the effect of price. Column (5) restricts the sample only to those who saw the same price, £1.85, which is the anonymous price and the price for those predicted to have middle valuations in our pricing models. The dummy for choosing the privacy option remains significant. Thus, the effect is not driven by price. It is either the consequence of sorting, with those who have higher valuations buying the privacy option more often, or the behavioral effect of “safety” to buy under anonymous prices, without the perception that one might be tricked into buying for a high individual price.
| Bought lottery | Bought lottery | Bought lottery | Bought lottery | Bought lottery | |
| (1) | (2) | (3) | (4) | (5) | |
| Movies | -0.098** | -0.099** | -0.049 | -0.048 | -0.062 |
| (0.040) | (0.040) | (0.042) | (0.042) | (0.056) | |
| Age | -0.001 | -0.001 | -0.001 | -0.000 | |
| (0.002) | (0.002) | (0.002) | (0.002) | ||
| Female | 0.028 | 0.010 | 0.007 | -0.040 | |
| (0.041) | (0.040) | (0.040) | (0.053) | ||
| Price | -0.473*** | -0.384*** | |||
| (0.124) | (0.126) | ||||
| Chose privacy dummy | 0.105** | 0.114** | |||
| (0.047) | (0.053) | ||||
| Observations | 603 | 603 | 603 | 603 | 342 |
| Sample | All | All | All | All | Price=anonymous |
-
•
Notes: The table reports marginal effects of Probit regressions of a dummy for buying the lottery. Sample in Columns (1) to (4) includes all data from treatments. The sample in Column (5) includes only those who saw the anonymous price, either because they chose the privacy option or because their predicted WTP suggested the middle price in the pricing model. Standard errors between parentheses. * , ** , ***
Next, we look at the payoffs, which serve as a proxy for consumer welfare. We consider payoffs only for the main binary decisions in the experiment, namely to buy privacy or not and to buy the lottery or not. To calculate the payoffs, we first assign a payoff of £0 to all participants and then add £2.50 minus the price for those who bought the lottery. We use £2.50 as the expected lottery payoff to avoid noise due to randomization of the lottery payoff. We deduct £0.10 for those who chose privacy. The resulting values represent the payoffs.
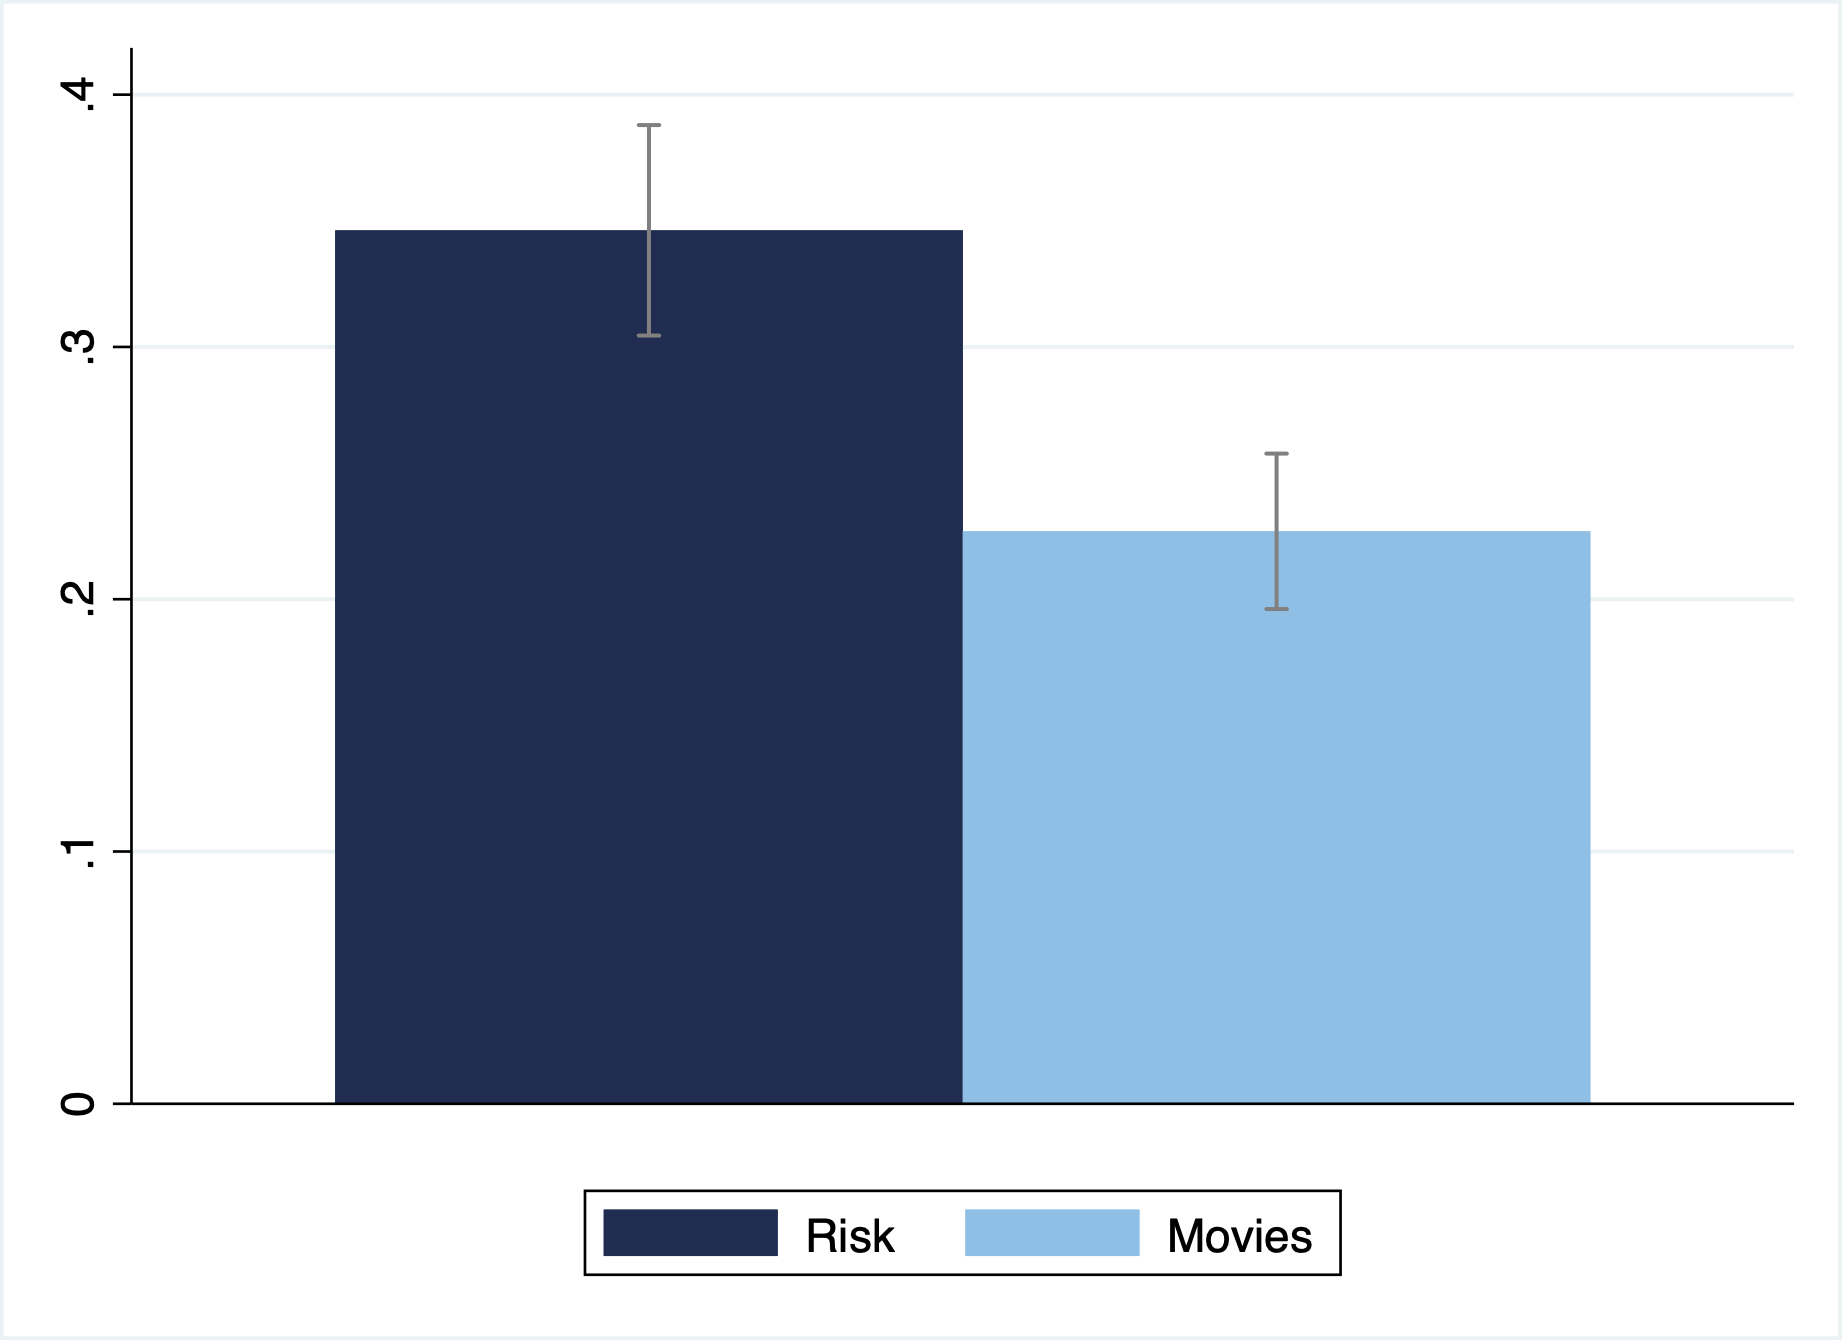
Figure 6 displays the average payoffs by treatment. Table 9 confirms this result, with Column (1) reporting the payoff is significantly lower in Movies than in Risk. The significance of the difference in payoffs is robust to individual controls, as seen in Column (2). Thus, participants earn significantly less in Movies than in Risk, as they are less able to respond strategically to the firm’s screening. Column (3) provides additional evidence, showing that the treatment difference goes completely through the differences in prices.
| Payoff | Payoff | Payoff | |
| (1) | (2) | (3) | |
| Movies | -0.119*** | -0.120*** | -0.026 |
| (0.026) | (0.026) | (0.025) | |
| Age | -0.000 | -0.001 | |
| (0.001) | (0.001) | ||
| Female | 0.034 | -0.001 | |
| (0.027) | (0.024) | ||
| Price | -0.849*** | ||
| (0.069) | |||
| Constant | 0.346*** | 0.333*** | 1.956*** |
| (0.019) | (0.045) | (0.138) | |
| Observations | 603 | 603 | 603 |
| Adjusted | 0.031 | 0.031 | 0.225 |
| Sample | All | All | All |
-
•
Notes: OLS regression of participants’ payoff for the main task. Standard errors between parentheses. * , ** , ***
Finally, we also examine revenues and find no significant treatment differences (see Table A.5 in Appendix A.
Result 4.
(Buying decisions and payoffs): There is no significant difference in the proportion of participants who buy the lottery between treatments, controlling for the prices. The payoffs of participants are significantly higher in the Risk survey than in the Movies surveys.
5 Discussion and conclusions
In this paper, we studied experimentally consumers’ strategic responses to personalized pricing by exploiting the link between their behavior and the pricing model. Our results provide a novel angle on analyzing consumers’ decisions concerning big data. The ability of consumers to manage their privacy effectively depends on their understanding of how their data is used for pricing. Participants in our main experiment stage are incentivized to manipulate their responses to surveys. We distinguish between two ways of consumer profiling. One, based on the methods before big data became readily available, is when a firm determines prices based on consumer answers to a survey in the same context as the product, and thus has a more explicit link between answers to its questions and the resulting prices. The other, based on the possibility of exploiting sophisticated statistical relations with big data, is when a firm determines prices based on consumer answers to a survey in a context different from the product. As expected, they were more successful in manipulation when the context is similar. This suggests an additional “vulnerability” for consumers in the era of big data, as it is harder to gain from personalized pricing through strategic responses. We also conjectured that participants were more likely to pay for privacy when the link was less clear, as they should anticipate the difficulty of manipulating. Our result suggests the opposite: participants in the survey of a seemingly unrelated context demanded less privacy, and fewer decisions were optimal than those in a closer context. This surprising result was driven by those who did not buy privacy, though they should have.
How externally valid are our results? Our experiments present an artificial and very simplified setup to study price discrimination, and our personalized price models are clearly less precise than those used by firms in the real world. However, we believe this fact does not affect the interpretations regarding the main interest of our paper, namely the attempts and the ability to manipulate responses strategically. Our results in Movies, where participants failed to respond strategically to personalized pricing successfully, are likely to overestimate the degree of strategic response because we present the best conditions for it. Also, in terms of privacy, we believe that our treatment differences are independent of the model’s precision and reflect participants’ perception of when they are more likely to benefit from private browsing.
One important policy implication of our study is that with the increasing use of consumer information in seemingly unrelated contexts for pricing strategies, consumer protection becomes even more important than before. When firms use traditional personalized pricing, some consumers might have reasonably simple strategies to recover some of the welfare that firms capture with price discrimination. When these pricing models use more sophisticated relations and seemingly unrelated variables, questions such as the extent to which consumers understand these relations and their own ability to manipulate them might matter. The lack of clarity not only hinders consumers’ ability to get desirable prices, but also reduces the volume of transactions, where misguided manipulations prevent sales from happening at all.
Providing privacy options alone might not suffice to mitigate this problem. While current data protection regulations emphasize more on transparency in the data collection, future policies should also encourage transparency in pricing algorithms and providing consumers with better information on how their data is used. This could further improve consumers’ decisions while still leaving space for welfare-improving price discrimination. Returning to the personalized pricing practices mentioned in the Introduction, we are seeing some exciting developments in policy to address this issue. The Dutch Authority for Consumers and Markets recently made a landmark decision to order an online shopping platform to be transparent about their algorithm.
Another implication from our results is that the prominence of the privacy option could be context-dependent. For instance, instead of bombarding cyberspace with cookie choices in every interaction, these could become more prominent in situations where consumers are identified with significant vulnerabilities for the suboptimal use of cookies. Another related open question is whether an opt-in system where the default option of privacy protection and consumers choose for personalized pricing if they want, instead of an opt-out system like we studied in this paper, could reduce the strategic mistakes.
Finally, our results suggest that using observed privacy choices from the field for welfare analysis may be problematic. When consumers do not choose privacy options, one might conclude that there is a lack of demand. However, it might instead be that consumers are not making informed choices, and the demand would change if they were better informed.
Taken together, our results point out that policies promoting consumer awareness of data transparency complement regulations requiring firms to abide by data transparency and provide consumers with control choices. While recent public debates have mostly centered around the regulation approach of “notice and consent,” it is also essential to educate consumers. One without the other may harm consumer welfare.
References
- Acquisti (2004) Alessandro Acquisti. Privacy in electronic commerce and the economics of immediate gratification. In Proceedings of the 5th ACM conference on Electronic commerce, pages 21–29, 2004.
- Acquisti and Varian (2005) Alessandro Acquisti and Hal R Varian. Conditioning prices on purchase history. Marketing Science, 24(3):367–381, 2005.
- Acquisti et al. (2016) Alessandro Acquisti, Curtis Taylor, and Liad Wagman. The economics of privacy. Journal of economic Literature, 54(2):442–92, 2016.
- Becker et al. (2012) Anke Becker, Thomas Deckers, Thomas Dohmen, Armin Falk, and Fabian Kosse. The relationship between economic preferences and psychological personality measures. Annu. Rev. Econ., 4(1):453–478, 2012.
- Beresford et al. (2012) Alastair R Beresford, Dorothea Kübler, and Sören Preibusch. Unwillingness to pay for privacy: A field experiment. Economics letters, 117(1):25–27, 2012.
- Bonatti and Cisternas (2020) Alessandro Bonatti and Gonzalo Cisternas. Consumer scores and price discrimination. The Review of Economic Studies, 87(2):750–791, 2020.
- Chen and Sebastián Pereyra (2019) Li Chen and Juan Sebastián Pereyra. Self-selection in school choice. Games and Economic Behavior, 117(C):59–81, 2019.
- Chen et al. (2017) Yuxin Chen, Xinxin Li, and Monic Sun. Competitive mobile geo targeting. Marketing Science, 36(5):666–682, 2017.
- Choe et al. (2018) Chongwoo Choe, Stephen King, and Noriaki Matsushima. Pricing with cookies: Behavior-based price discrimination and spatial competition. Management Science, 64(12):5669–5687, 2018.
- Commission et al. (2018) European Commission, Agriculture Consumers, Health, and Food Executive Agency. Consumer market study on online market segmentation through personalised pricing/offers in the European Union final report. Publications Office, 2018.
- Croson and Gneezy (2009) Rachel Croson and Uri Gneezy. Gender differences in preferences. Journal of Economic literature, 47(2):448–74, 2009.
- Dargnies et al. (2019) Marie-Pierre Dargnies, Rustamdjan Hakimov, and Dorothea Kübler. Self-confidence and unraveling in matching markets. Management Science, 65(12):5603–5618, 2019.
- Dargnies et al. (2022) Marie-Pierre Dargnies, Rustamdjan Hakimov, and Dorothea Kübler. Aversion to hiring algorithms: Transparency, gender profiling, and self-confidence. Working paper, 2022.
- Dietvorst et al. (2018) Berkeley J Dietvorst, Joseph P Simmons, and Cade Massey. Overcoming algorithm aversion: People will use imperfect algorithms if they can (even slightly) modify them. Management Science, 64(3):1155–1170, 2018.
- Dubé and Misra (2022) Jean-Pierre Dubé and Sanjog Misra. Personalized pricing and customer welfare. Journal of Political Economy, forthcoming, 2022.
- Dubé et al. (2017) Jean-Pierre Dubé, Zheng Fang, Nathan Fong, and Xueming Luo. Competitive price targeting with smartphone coupons. Marketing Science, 36(6):944–975, 2017.
- Fudenberg and Tirole (2000) Drew Fudenberg and Jean Tirole. Customer poaching and brand switching. RAND Journal of Economics, pages 634–657, 2000.
- Fudenberg and Villas-Boas (2006) Drew Fudenberg and J Miguel Villas-Boas. Behavior-based price discrimination and customer recognition. Handbook on economics and information systems, 1:377–436, 2006.
- Greiner et al. (2022) Ben Greiner, Philipp Grünwald, Thomas Georg Lindner, and Martin Wiernsperger. Incentives, framing, and trust in ai: An experimental study. Working paper, 2022.
- Grubb (2015) Michael D Grubb. Overconfident consumers in the marketplace. Journal of Economic Perspectives, 29(4):9–36, 2015.
- Gunter and Furnham (2014) Barrie Gunter and Adrian Furnham. Consumer profiles (RLE Consumer Behaviour): An introduction to psychographics. Routledge, 2014.
- Hassidim et al. (2017) Avinatan Hassidim, Déborah Marciano, Assaf Romm, and Ran I Shorrer. The mechanism is truthful, why aren’t you? American Economic Review, 107(5):220–24, 2017.
- Jentzsch et al. (2012) Nicola Jentzsch, Sören Preibusch, and Andreas Harasser. Study on monetising privacy: An economic model for pricing personal information. ENISA, Feb, 1(1), 2012.
- John et al. (2011) Leslie K John, Alessandro Acquisti, and George Loewenstein. Strangers on a plane: Context-dependent willingness to divulge sensitive information. Journal of consumer research, 37(5):858–873, 2011.
- Jussupow et al. (2020) Ekaterina Jussupow, Izak Benbasat, and Armin Heinzl. Why are we averse towards algorithms? a comprehensive literature review on algorithm aversion. Working paper, 2020.
- Kosinski et al. (2013) Michal Kosinski, David Stillwell, and Thore Graepel. Private traits and attributes are predictable from digital records of human behavior. Proceedings of the national academy of sciences, 110(15):5802–5805, 2013.
- Leibbrandt (2020) Andreas Leibbrandt. Behavioral constraints on price discrimination: Experimental evidence on pricing and customer antagonism. European Economic Review, 121:103303, 2020.
- OECD (2015) OECD. Data-driven innovation: Big data for growth and well-being. OECD Publishing, 2015.
- Rentfrow et al. (2011) Peter J Rentfrow, Lewis R Goldberg, and Ran Zilca. Listening, watching, and reading: The structure and correlates of entertainment preferences. Journal of personality, 79(2):223–258, 2011.
- Santos-Pinto and de la Rosa (2020) Luis Santos-Pinto and Leonidas Enrique de la Rosa. Overconfidence in labor markets. Handbook of Labor, Human Resources and Population Economics, pages 1–42, 2020.
- Schleusener and Hosell (2016) Michael Schleusener and Sarah Hosell. Expertise zum Thema” Personalisierte Preisdifferenzierung im Online-Handel”. SVRV, Sachverständigenrat für Verbraucherfragen, 2016.
- Serra-Garcia and Gneezy (2021) Marta Serra-Garcia and Uri Gneezy. Mistakes, overconfidence, and the effect of sharing on detecting lies. American Economic Review, 111(10):3160–83, 2021.
- Shiller (2020) Benjamin Reed Shiller. Approximating purchase propensities and reservation prices from broad consumer tracking. International Economic Review, 61(2):847–870, 2020.
- Shorrer and Sóvágó (2022) Ran I Shorrer and Sándor Sóvágó. Dominated choices in a strategically simple college admissions environment. Working paper, 2022.
- Taylor (2004) Curtis R Taylor. Consumer privacy and the market for customer information. RAND Journal of Economics, pages 631–650, 2004.
- Tsai et al. (2011) Janice Y Tsai, Serge Egelman, Lorrie Cranor, and Alessandro Acquisti. The effect of online privacy information on purchasing behavior: An experimental study. Information systems research, 22(2):254–268, 2011.
- Villas-Boas (1999) J Miguel Villas-Boas. Dynamic competition with customer recognition. The Rand Journal of Economics, pages 604–631, 1999.
- Waldfogel (2015) Joel Waldfogel. First degree price discrimination goes to school. The Journal of Industrial Economics, 63(4):569–597, 2015.
Appendix
Appendix A Additional tables and figures
| Female | |
| M1:Romance | 0.077∗∗∗ |
| (0.007) | |
| M2:Horror | 0.006 |
| (0.006) | |
| M3:Action | -0.056∗∗∗ |
| (0.009) | |
| M4:Documentary | 0.030∗∗∗ |
| (0.008) | |
| M5:Foreign | -0.023∗∗∗ |
| (0.007) | |
| M6:Fantasy | 0.000 |
| (0.007) | |
| M7:Comedy | -0.021∗∗ |
| (0.008) | |
| M8:Historical | -0.017∗∗ |
| (0.008) | |
| M9:Crime | -0.003 |
| (0.010) | |
| M10:Thriller | -0.008 |
| (0.010) | |
| Constant | 0.661∗∗∗ |
| (0.083) | |
| Observations | 723 |
| 0.248 | |
| Adjusted | 0.237 |
| sample | Training |
-
•
Notes: OLS of the WTP on answers to the Movies survey. Standard errors between parentheses. * , ** , ***
| Classified female | Classified male | |
|---|---|---|
| Female | 275 | 85 |
| 76.4% | 23.6% | |
| Male | 102 | 261 |
| 28.1% | 71.9% |
| wtp | |
| R1:Forgo gains for secure investment | -1.450∗∗∗ |
| (0.213) | |
| R2:Famshow 10k safe vs alternative | 0.146∗∗ |
| (0.064) | |
| R1*R1 | 0.172∗∗∗ |
| (0.029) | |
| R1*R4 | 0.085∗∗∗ |
| (0.024) | |
| R3*R1 | 0.057∗∗ |
| (0.023) | |
| R4*R6 | -0.095∗∗ |
| (0.047) | |
| R8*R1 | 0.159∗∗∗ |
| (0.039) | |
| R8*R9 | -0.160∗∗∗ |
| (0.047) | |
| R9*R6 | 0.244∗∗∗ |
| (0.065) | |
| Constant | 3.036∗∗∗ |
| (0.302) | |
| Observations | 731 |
| 0.138 | |
| Adjusted | 0.127 |
| sample | Training |
-
•
Notes: OLS of the WTP on answers to the Risk survey. R1*R1 is squared answer to R1:Forgo gains for secure investment. R1*R4 is the interaction between R1:Forgo gains for secure investment and R4:Current insurance amount. R3*R1 is the interaction between R3:Loss of 14% and R1:Forgo gains for secure investment. R4*R6 is the interaction between R4:Current insurance amount and R6:Borrow for investment. R8*R1 is the interaction between R8:Smoking and R1:Forgo gains for secure investment. R8*R9 is the interaction between R8:Smoking and R9:Amusement park. R9*R6 is the interaction between R9:Amusement park and R6:Borrow for investment. Standard errors between parentheses. * , ** , ***
| wtp | |
| M1:Romance | 0.147∗∗ |
| (0.069) | |
| M2:Horror | 0.069∗ |
| (0.042) | |
| M3:Action | -0.130∗∗∗ |
| (0.035) | |
| M6:Fantasy | 0.165∗∗∗ |
| (0.049) | |
| M9:Crime | 0.150∗∗∗ |
| (0.030) | |
| M10:Thriller | -0.139∗∗∗ |
| (0.041) | |
| M1*M1 | -0.011∗∗ |
| (0.006) | |
| M1*M2 | -0.008∗ |
| (0.004) | |
| M1*M7 | -0.014∗∗ |
| (0.007) | |
| M2*M8 | 0.011∗∗ |
| (0.004) | |
| M3*M1 | 0.019∗∗∗ |
| (0.005) | |
| M4*M2 | -0.010∗ |
| (0.005) | |
| M4*M5 | -0.014∗∗∗ |
| (0.004) | |
| M4*M6 | -0.009∗ |
| (0.005) | |
| M4*M10 | 0.021∗∗∗ |
| (0.005) | |
| M5*M7 | 0.011∗∗∗ |
| (0.004) | |
| M7*M6 | -0.014∗∗∗ |
| (0.005) | |
| M7*M7 | 0.011∗∗∗ |
| (0.004) | |
| M8*M9 | -0.013∗∗∗ |
| (0.004) | |
| Constant | 1.371∗∗∗ |
| (0.290) | |
| Observations | 723 |
| 0.114 | |
| Adjusted | 0.090 |
| sample | Training |
Notes: OLS of the WTP on answers to the Movies survey. MX*MY id interaction of MX and MY, where X and Y are between 1 and 10, and correspond to the index of question. M1:Romance, M2:Horror, M3:Action, M4:Documentary, M5:Foreign, M6:Fantasy, M7:Comedy, M8:Historical, M9:Crime, M10:Thriller. Standard errors between parentheses. * , ** , ***
| Revenue | Revenue | |
| Movies | -0.117 | -0.119 |
| (0.078) | (0.078) | |
| Age | -0.002 | |
| (0.003) | ||
| Female | 0.031 | |
| (0.078) | ||
| Constant | 1.046*** | 1.110*** |
| (0.055) | (0.133) | |
| Observations | 603 | 603 |
| Adjusted | 0.002 | -0.002 |
-
•
Notes: OLS of Revenues. Standard errors between parentheses. * , ** , ***
Appendix B Instructions
B.1 Common to all treatments
Screen 1
Consent: You are invited to take part in a research study. The study is administered by researchers at the University of Lausanne, University of Gothenburg, and Southwestern University of Finance and Economics, in Chengdu.
You will receive £1 for participating. Total duration of the study is 5 to 6 minutes.
All data will be treated confidentially. Data will be used anonymously and for academic research only. Anonymized data will be made available to other researchers for replication purposes.
o I understand the conditions and consent to participate in this study
o I reject participation
Screen 2
What is your gender?
o Male
o Female
o Prefer not to answer
Age How old are you?
What is your prolific ID? (Note that it should be filled automatically. If yes, just proceed further.)
B.2 Training data
Screen 3
In the next block you will answer in total 21 questions about yourself. Please read the questions carefully and try to choose the answer that is as close to your preferences as possible.
Screens 4-24 Risk Survey and Movies Survey in random order
Risk Survey
Q1.1
I am prepared to forego potentially large gains if it means that the value of my investment is secure
o I strongly agree (1)
o I agree (2)
o I neither agree or disagree (3)
o I disagree (4)
o I strongly disagree (5)
Q1.2
Over the next several years, you expect your annual income to:
o Stay about the same (3)
o Grow moderately (4)
o Grow substantially (5)
o Decrease moderately (2)
o Decrease substantially (1)
Q1.3
Imagine that due to a general market correction, one of your investments loses 14% of its value a short time after you buy it. What do you do?
o Sell the investment so you will not have to worry if it continues to decline (1)
o Hold on to it and wait for it to climb back up (2)
o Buy more of the same investment…because at the current lower price, it looks even better than when you bought it (3)
Q1.4
What is the current amount of insurance you buy (life insurance, home insurance, medical insurance, travel insurance, etc)?
o Much less than most of people I know (5)
o Less than most people I know (4)
o About the same as most people I know (3)
o More than most people I know (2)
o Much more than most people I know (1)
Q1.5
Assuming you are investing in a stock, which one would you choose?
o Companies that may make significant technological advances that are still selling at their low initial offering price (3)
o Established, well-known companies that have a potential for continued growth (2)
o Established, stable, and well-recognized corporation that pay dividends (1)
Q1.6
Have you ever borrowed money for the purpose of making an investment (other than for marriage)?
o Yes (2)
o No (1)
Q1.7
You have just reached the $10,000 plateau on a TV game show. Now you must choose between quitting with the $10,000 in hand or betting the entire $10,000 in one of three alternative scenarios. Which do you choose?
o The $10,000 – you take the money and run (1)
o A 50 percent chance of winning $50,000 (2)
o A 20 percent chance of winning $75,000 (3)
o A 5 percent chance of winning $100,000 (4)
Q1.8
Do you smoke cigarettes?
o Yes, daily (3)
o Yes, occasionally (2)
o No (1)
Q1.9
In an amusement park, which of the following describes your type best?
o I always select the most extreme and exciting attractions, such as roller coasters with dead loops. (3)
o I look for enjoyable attractions with not too many extreme conditions. (2)
o I prefer attractions with no adrenaline at all that offer quiet time and enjoyment of the atmosphere of the part, such as artistic performances. (1)
Q1.10 Which of the following describes your preferences for future employment best?
o I am self-employed and an owner of my business (3)
o I work in a stable well paying government job (1)
o I am a professional with stable income in a private firm (2)
Movies Survey
![[Uncaptioned image]](/html/2304.11415/assets/figs/figssurvey/q1.png)
![[Uncaptioned image]](/html/2304.11415/assets/figs/figssurvey/q2.png)
![[Uncaptioned image]](/html/2304.11415/assets/figs/figssurvey/q3.png)
![[Uncaptioned image]](/html/2304.11415/assets/figs/figssurvey/q4.png)
![[Uncaptioned image]](/html/2304.11415/assets/figs/figssurvey/q5.png)
![[Uncaptioned image]](/html/2304.11415/assets/figs/figssurvey/q6.png)
![[Uncaptioned image]](/html/2304.11415/assets/figs/figssurvey/q7.png)
![[Uncaptioned image]](/html/2304.11415/assets/figs/figssurvey/q8.png)
![[Uncaptioned image]](/html/2304.11415/assets/figs/figssurvey/q9.png)
![[Uncaptioned image]](/html/2304.11415/assets/figs/figssurvey/q10.png)
Screen 25
Imagine a lottery with a 50% chance of winning £5, and 50% of winning nothing. Next, you will need to choose whether you would buy this lottery for a corresponding price in each row.
20 participants who fill out this survey will be chosen randomly. For those, one of the rows below will be chosen randomly. If the participant selected “do not buy” in that row, he/she will receive a bonus in the form of the corresponding price in the row. If the participant selected “buy the lottery”, she will receive £5 or £0 with a 50% probability each.
| Buy the lottery | Do not buy the lottery | |
|---|---|---|
| Price of £4 | o | o |
| Price of £3.8 | o | o |
| Price of £3.6 | o | o |
| Price of £3.4 | o | o |
| Price of £3.2 | o | o |
| Price of £3 | o | o |
| Price of £2.8 | o | o |
| Price of £2.6 | o | o |
| Price of £2.4 | o | o |
| Price of £2.2 | o | o |
| Price of £2 | o | o |
| Price of £1.8 | o | o |
| Price of £1.6 | o | o |
| Price of £1.4 | o | o |
| Price of £1.2 | o | o |
| Price of £1 | o | o |
| Price of £0.8 | o | o |
| Price of £0.6 | o | o |
B.3 Treatments Risk and Movies
Screen 3
In the next block, you will answer 10 questions about yourself.
After these 10 questions, we will offer you an option to buy a lottery from us, which gives you a 50% chance of winning £5.
After answering the next ten questions, you will have a chance to buy the lottery ticket for a certain price. The price you will face might be personalized by an algorithm based on the statistical relation between other participants’ answers to these same questions and how much they were willing to pay for that lottery. The goal of the algorithm is to maximize the revenue obtained from the sale of the lotteries to the participants who choose to buy for the given price.
We will award you with a bonus of £2.20 for answering the questions.
Screens 4-14 Risk survey or Movies survey, depending on the treatment
Screen 15
Your answers to the survey are recorded. Remember that they can influence the price for the lottery on the next screen.
However, for £0.10, you can hide your answers from the algorithm that determines the price. If you hide your answers, you will face an anonymous price, which is set to maximize the revenue from the lottery sales without the information from your survey answers.
Do you want to pay £0.10 and hide your answers (we will deduct it from your bonus of £2.20 for the survey)?
Note that we will inform you of both the anonymous price and the price you would face in case the price was based on your answers at the end of the survey.
o Pay £0.10 and hide the answers, so the price is not based on my answers
o Do NOT hide the answers, so the price can be based on my answers
Screen 16
Buying: Do you want to buy a lottery with a 50% chance of winning £5 and a 50% chance of winning zero?
The price is X161616Respective individualized or anonymous price depending on the privacy choice.
If you decide to buy, we will deduct the price from the £2.20 bonus you earned for the survey and play out the lottery immediately. If you win, we will add £5 to your bonus.
o Buy the lottery
o Do not buy the lottery
Screen 17
Belief price range: The personalized prices algorithm, which was generated using answers from other participants and the price that they were willing to pay for the lottery, uses the answers to the survey to determine the price for the lottery. Given that, what do you think are the lowest and highest possible prices that the algorithm generates when considering all possible answers in the survey?
If your answer is within £0.20 from the correct lowest price, we will add £0.1- to your bonus.
If your answer is within £0.20 from the correct highest price, we will add £0.10 to your bonus.
Lowest possible price (slider between 1 and 3.5)
Highest possible price (slider between 1 and 3.5)
Screen 18
For your information:
The anonymous price is 1.85
The price based on your answers is Y171717 Individualized price.