Kinematics of Galactic Centre clouds shaped by shear-seeded solenoidal turbulence
Abstract
The Central Molecular Zone (CMZ; the central pc of the Galaxy) is a kinematically unusual environment relative to the Galactic disc, with high velocity dispersions and a steep size-linewidth relation of the molecular clouds. In addition, the CMZ region has a significantly lower star formation rate (SFR) than expected by its large amount of dense gas. An important factor in explaining the low SFR is the turbulent state of the star-forming gas, which seems to be dominated by rotational modes. However, the turbulence driving mechanism remains unclear. In this work, we investigate how the Galactic gravitational potential affects the turbulence in CMZ clouds. We focus on the CMZ cloud G0.253+0.016 (‘the Brick’), which is very quiescent and unlikely to be kinematically dominated by stellar feedback. We demonstrate that several kinematic properties of the Brick arise naturally in a cloud-scale hydrodynamics simulation that takes into account the Galactic gravitational potential. These properties include the line-of-sight velocity distribution, the steepened size-linewidth relation, and the predominantly solenoidal nature of the turbulence. Within the simulation, these properties result from the Galactic shear in combination with the cloud’s gravitational collapse. This is a strong indication that the Galactic gravitational potential plays a crucial role in shaping the CMZ gas kinematics, and is a major contributor to suppressing the SFR by inducing predominantly solenoidal turbulent modes.
keywords:
stars: formation – ISM: clouds – ISM: evolution – ISM: kinematics and dynamics – Galaxy: centre – galaxies: ISM1 Introduction
The Central Molecular Zone (CMZ) is one of the most extreme star-forming environments in the Milky Way. The region contains a large reservoir of molecular gas (; Dahmen et al. 1998) within the innermost few hundred parsecs of the Galaxy, with temperatures (; Ao et al. 2013; Ginsburg et al. 2016; Krieger et al. 2017), column densities (; Molinari et al. 2011) and pressures (; Rathborne et al. 2014; Walker et al. 2018; Myers et al. 2022) much higher than in the Solar neighbourhood (Kruijssen & Longmore, 2013). Despite that, the region as a whole has a star formation rate (SFR) which is an order of magnitude lower than expected based on the large amount of dense gas (e.g. traced by NH3; Longmore et al., 2013), and is likely due to a current minimum within an episodic star formation cycle (Kruijssen et al., 2014; Armillotta et al., 2019; Callanan et al., 2021). Sgr B2 accounts for at least 50% of all star formation activity in the CMZ (possibly up to 89%; Barnes et al. 2017; Ginsburg et al. 2018), leaving the rest of the clouds with quiescent to intermediate levels of star formation (Lu et al., 2019; Walker et al., 2021; Williams et al., 2022).
The interstellar medium (ISM) structure and star formation arise in response to the kinematic state of the gas (Henshaw et al., 2020). Therefore, the kinematics of the star-forming gas in the CMZ could help us understand the low SFR. The kinematics in the CMZ are also unususal, with high line-of-sight velocity dispersions and reports of a steep size-linewidth relation relative to the molecular clouds in the Galactic disk (Shetty et al., 2012; Kauffmann et al., 2017). These phenomena are (at least partially) attributed to the effects of turbulence, which is known to play an important role in shaping the ISM (Elmegreen & Scalo, 2004; Mac Low & Klessen, 2004). Turbulent motions consist of solenoidal and compressive modes that coexist at varied relative strength (see e.g. Federrath et al., 2010). The compressive turbulent modes can lead to fragmentation and star formation by creating shocks and overdensities, while the solenoidal modes can prevent gravitational collapse. Within the CMZ we have an indication of predominantly solenoidal turbulence driving (Federrath et al., 2016), which is likely linked to the suppressed SFR. Orkisz et al. (2017) found an inverse relation between the fraction of solenoidal modes in the velocity field of the gas and SFR within Orion B. A later work by Rani et al. (2022) found the same type of relation for a large sample of Milky Way clouds at Galactocentric radii between kpc.
Even though turbulence is likely responsible for the kinematic and physical state of the CMZ clouds, it is currently not understood what drives it. Based on energetic analysis of common turbulence driving mechanisms, the CMZ turbulence is most likely driven by supernova feedback, followed by gas inflow from the galactic bar and magnetorotational instabilities (Kruijssen et al., 2014; Henshaw et al., 2022a). However, this type of analysis is sensitive to coupling parameters that determine what fraction of the total energy goes into turbulent motions, and these parameters are not very well constrained. Recent work by Tassis & Pavlidou (2022) suggested that the CMZ turbulence can be explained by feedback from massive stars with high vertical (perpendicular to the Galactic plane) velocity dispersion that cross the clouds and deposit energy via stellar winds. The authors also demonstrated that this type of energy injection results in a steep size-linewidth relation.
An additional contribution to the gas turbulence may come from the strong orbital shear resulting from the Galactic gravitational potential (Kruijssen et al., 2014; Krumholz & Kruijssen, 2015; Federrath et al., 2016; Meidt et al., 2018; Keto et al., 2020). This mechanism is expected to drive solenoidal turbulence within the gas, which is consistent with observational estimates (Federrath et al., 2016).
In this paper, we investigate how the Galactic gravitational potential affects the turbulence in the CMZ clouds. In particular, we focus on the G0.253+0.016 cloud, also known as ‘the Brick’ (Longmore et al., 2012). This cloud is in the very early stages of star formation (e.g. Lis et al., 1994; Lu et al., 2019; Walker et al., 2021) and even though there is evidence that it may contain an H II region (Henshaw et al., 2022b), its kinematics are not dominated by in-situ stellar feedback. Furthermore, the Brick’s structural and kinematic properties have been extensively studied through high resolution ALMA (Atacama Large Millimeter/submillimeter Array) observations (e.g. Rathborne et al., 2014, 2015; Federrath et al., 2016; Henshaw et al., 2019). Here we use a recent cloud-scale hydrodynamics simulation (Dale et al., 2019; Kruijssen et al., 2019; Petkova et al., 2023) which includes a model for the Galactic gravitational potential, and demonstrate that it matches very well the kinematic properties of the Brick. This analysis provides key predictions for the ongoing ALMA CMZ Exploration Survey (ACES) on the Atacama Large Millimeter/submillimeter Array (Longmore et al. in prep.), which will be able to characterise the driving mechanism(s) of turbulence in molecular clouds throughout the CMZ.
2 Simulation setup
We use the high-density (HDens) tidally-virialised simulation from Dale et al. (2019) (see their sect. 3 and tab. 1). Kruijssen et al. (2019) and Petkova et al. (2023) selected this particular model to represent the Brick as its initial conditions best match the cloud’s size and mass. Furthermore, Kruijssen et al. (2019) showed that this simulation naturally reproduces other properties of the Brick, such as its column density and velocity dispersion (see their fig. 5). Additionally, Petkova et al. (2023) found similarities in the substrucure of the simulation and the real cloud in terms of their fractal dimension and spatial power spectra. Within this paper we expand the existing analysis of this simulation by performing a kinematic comparison to the Brick. In order to evaluate the importance of the initially assumed velocity field, we also repeat the analysis for the HDens self-virialised simulation from Dale et al. (2019) (see Appendix A).
The simulation is performed with the smoothed particle hydrodynamics (SPH) code gandalf (Hubber et al., 2018). The simulation is three-dimensional, unmagnetised, and assumes an isothermal equation of state with temperature (consistent with the observed range for the Brick, e.g. Ao et al., 2013; Ginsburg et al., 2016; Krieger et al., 2017) and a mean molecular weight , corresponding to fully molecular gas. Self-gravity of the gas is included, whereas the field stars are included in the background potential (see below). The cloud is initialised as a sphere with total mass and SPH particles. The initial velocity field is turbulent with a power spectrum , and virial parameter . These initial conditions are selected from a set of randomly generated velocity fields to have negative spin angular momentum with respect to the orbital motion, consistent with the shear observed upstream from the Brick.
The simulated cloud is evolved on an eccentric orbit around the Galactic Centre starting before the pericentre passage (see fig. 3 of Kruijssen et al. 2019) in the gravitational potential described in Appendix A of Kruijssen et al. (2015), which is based on the photometric model of Launhardt et al. (2002). Since no turbulence driving is included, the initial turbulent velocity field of the cloud is quickly dissipated (on a timescale ; Kruijssen et al., 2019). Turbulence is generated during the simulation through gravitational collapse and shearing motions. Due to the lack of sufficient pressure support, the cloud fragments and forms sink particles (with threshold density of ). By the time the present-day position of the Brick is reached (after 0.74 Myr of evolution), of the gas mass is transformed into sink particles.
For our analysis we focus mainly on the snapshot that corresponds to the present-day location of the Brick. We label this snapshot as being at . To facilitate analysis we bin SPH particles onto a 3D Cartesian grid with cell size using splash (Price, 2007) and the exact mapping method of Petkova et al. (2018). For reference, the sink accretion radius is , and the median particle smoothing length is . With the exception of Figures 1 and 2, which use the synthetic HNCO moment 1 map from Petkova et al. (2023), all of the analysis is performed on these mapped simulation density outputs. The HNCO (; 87.925 GHz) emission line is chosen, as within the Brick its emission is bright and extended, and it has been used in multiple observational studies (e.g. Federrath et al., 2016; Henshaw et al., 2019).
3 Comparison to the Brick
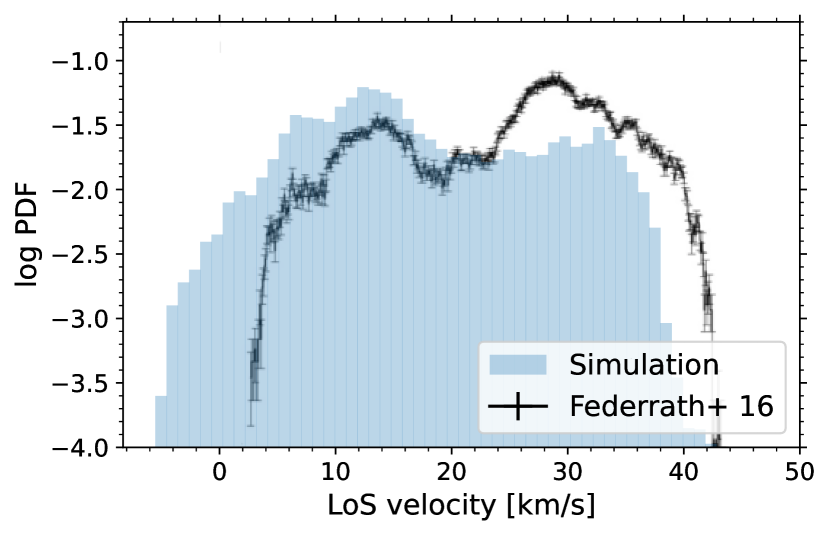
In order to compare the kinematic state of the simulated and the observed cloud, we first consider their line-of-sight (LoS) velocities. Kruijssen et al. (2019) found that the simulation matches the LoS velocity dispersion of the real Brick, indicating a kinematic similarity between the clouds. In addition, the synthetic HNCO (; 87.925 GHz) moment 1 map constructed by Petkova et al. (2023) shows a clear gradient and a matching LoS velocity range to the Brick (see their Appendix B). Figure 1 presents probability distribution function (PDF) histograms of the synthetic moment 1 map and of the observed HNCO moment 1 map of the Brick (Federrath et al., 2016). The two distributions span the same velocity range and have a double-peaked profile, with a minimum at . The results remain unchanged if we consider a synthetic moment 1 map that uses the density structure of the simulation instead of modelled HNCO emission. Note that both the spin angular momentum and the LoS velocity gradient of the simulation evolve with time (fig. 4 of Kruijssen et al., 2019), and the presented velocity distribution is not identical to the initial conditions. Furthermore, earlier simulation snapshots have very different LoS velocities.
The double-peaked velocity profile in Figure 1 is indicative of rotation along an axis perpendicular to the line-of-sight. However, the rotation is not necessarily global but it may be present in multiple structures within the Brick which are overlapping along the LoS (Henshaw et al., 2019). This is consistent with the velocity structure of the simulation, where the rotation is multi-axial, and broken down into spatially-coherent regions.
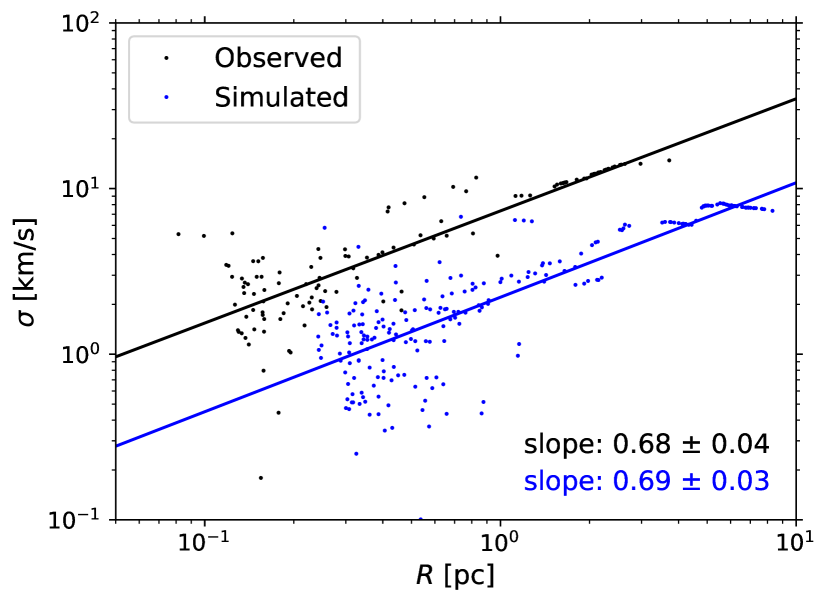
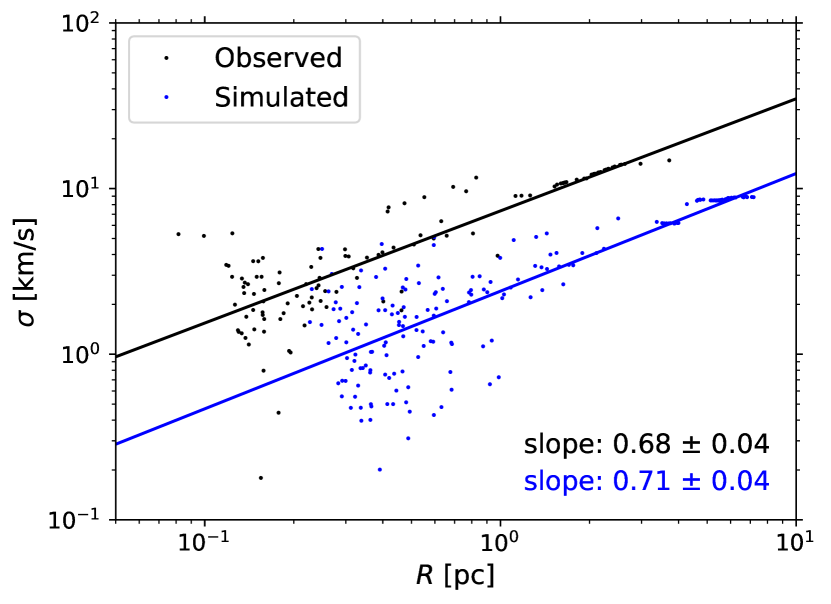
The LoS velocities can be used to construct the size-linewidth relation (Larson, 1981). We defer a full exploration of this observable in our simulations to a future study (Petkova et al. in prep.), but mention our finding that the simulated and observed cloud both exhibit the same size-linewidth slope (; see Figure 2). This is consistent with other CMZ studies (Shetty et al., 2012; Kauffmann et al., 2017), but is steeper than in the Solar neighbourhood (; Heyer & Dame, 2015). Our analysis considers the entire Brick cloud and follows the procedure of Shetty et al. (2012), which identifies structures in position-position-velocity (PPV) space with a dendrogram. For the simulation we construct a PPV cube using the HNCO () emission maps from Petkova et al. (2023), and for the Brick we use the HNCO () PPV cube presented in Rathborne et al. (2015). Figure 2 also shows a vertical offset between the two sets of data points, which can be explained as mismatch of pressure between the simulation and the Brick.
In contrast to the results shown in Figure 2, Henshaw et al. (2020) performed a Gaussian decomposition of HNCO emission lines, and found a much shallower size-linewidth slope within identified sub-structures of the Brick. This suggests that the steeper relation may be due to rotational motions on the cloud scale.
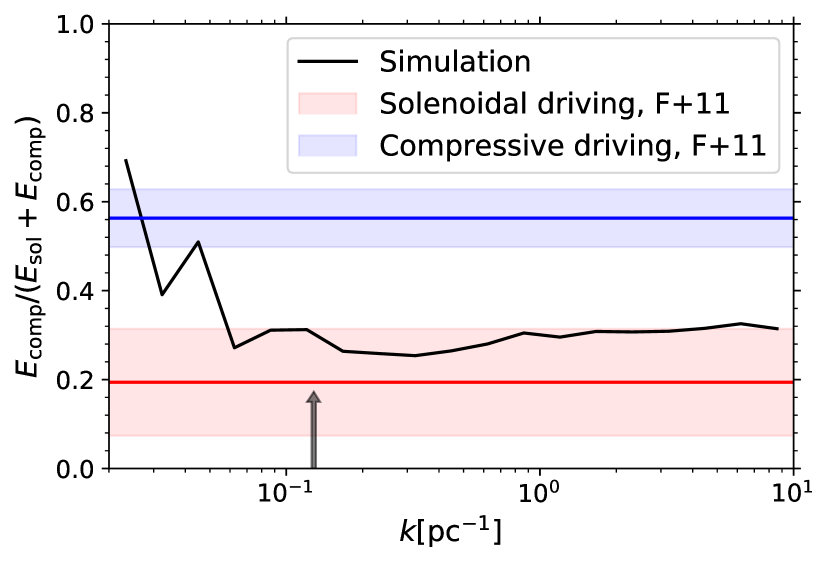
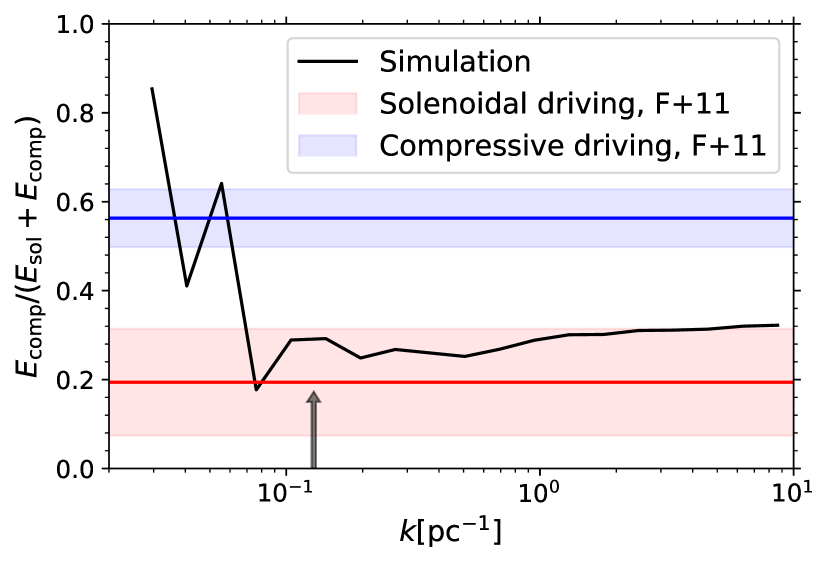
The similar (yet atypical) size-linewidth relation in the simulation and in the Brick is suggestive of a similar kinematic state, which is likely due to a combination of rotation and turbulence. Federrath et al. (2016) estimated the turbulence driving parameter of the Brick to be , which is consistent with having predominantly solenoidal driving. In order to compare this result with the simulation, we split the 3D velocity field into a compressive (curl-free) and a solenoidal (divergence-free) component using Helmholtz decomposition (see e.g. Federrath et al. 2010), and calculate the power spectrum of each component multiplied by the square root of the local density ( and , respectively). We then find the compressive ratio, , which represents the fraction of kinetic energy stored in the compressive modes of the velocity field. For supersonic clouds, the compressive ratio is always greater than 0, even if the driving force is purely solenoidal (Federrath et al., 2010; Federrath et al., 2011). Figure 3 shows the compressive ratio of the simulation as a function of spatial scale (), compared to the results of Federrath et al. (2011) for a Mach number of . For most spatial scales our simulation has a cmpressive ratio of , which is consistent with having predominantly solenoidal turbulence driving. This is also in agreement with the results of Federrath et al. (2016) for the Brick. Similar results are seen for earlier simulation snapshots.
All of the above measurements are consistent with the hypothesis that the Galactic shear is influencing the cloud kinematics. We explore this hypothesis further in the following section.
4 The role of the Galactic potential
The Galactic gravitational potential can influence the evolution and dynamics of the CMZ clouds through two main effects: shear and tidal forces. The simulated cloud uses the Launhardt et al. (2002) potential, which has a scaling of between the enclosed mass , and the Galactocentric radius for radii between 60 pc and 100 pc (Kruijssen et al., 2015). Using this dependence, Kruijssen et al. (2019) derived the velocity differential due to shear:
| (1) |
where is the mean orbital angular velocity of a cloud (for our simulation ; Kruijssen et al., 2015), and is the difference in Galactocentric radius between two points in the cloud. While an updated potential (Sormani et al., 2022) has been constructed since the simulation run, the shape of the new potential within the orbit of the simulation is consistent with that of Launhardt et al. (2002), and hence the results of this paper remain unchanged.
The tidal radius of the cloud is (Mo et al., 2010, eq. 12.21):
| (2) |
where is the cloud mass enclosed within the tidal radius. Note that is used for the Galactocentric radius and is used for the cloud-centric radius. By assuming that (true for circular motion where ), and (Launhardt et al., 2002; Kruijssen et al., 2015), we simplify the above expression to the following:
| (3) |
In eq. 3 we express the dependence of the tidal radius on . This allows us to find iteratively within the simulation. Note that due to the adopted gravitational potential, the tidal field is fully compressive (Dale et al., 2019; Kruijssen et al., 2019).
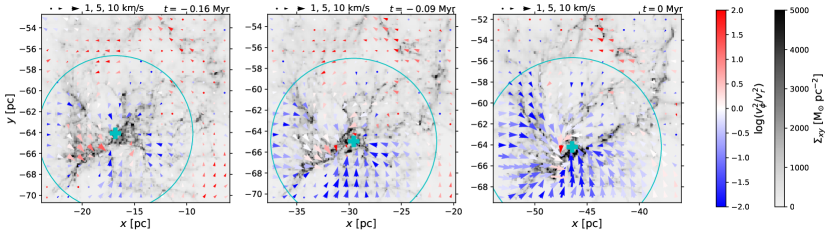
We now study the effects of shear and tidal forces on the kinematics of the simulation. Figure 4 shows a top-down view of the simulated cloud with superimposed -velocity vectors, where the bulk motion of the gas has been subtracted. We include three snapshots of the cloud – one at the present location of the Brick (right), and two at earlier positions along the cloud’s orbit. We find that as the cloud evolves it undergoes collapse towards a central dense region, which can be seen both in the more enhanced gas column density (grey scale in Figure 4), and in the gas velocities. The velocity vectors are coloured based on the ratio of their tangential and radial components with respect to the local minimum of the gravitational potential along the orbit (cyan cross; hereafter ‘cloud centre’). Figure 4 shows that as the cloud evolves, there is more radial motion of the gas (blue arrows) concentrated within the tidal radius (cyan circle; see eq. 3), and the regions outside the tidal radius move predominantly in a tangential direction (red arrows). This is consistent with the interpretation that the periphery of the cloud is stretched due to shear, while its central region is collapsing (possibly with the help of tidal compression induced by the Galactic potential).
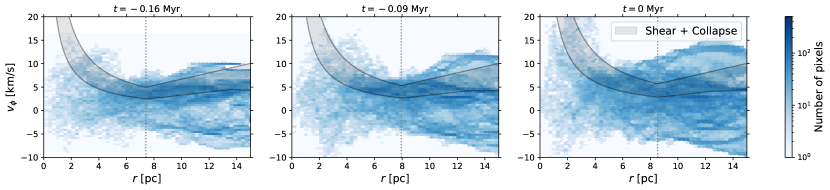
In order to quantify the effect of the shear, we consider the tangential velocity components of the gas with respect to the cloud centre, , and their dependence on the distance from this centre, (see Figure 5). We also include the velocity ranges that we expect from a simple model of shear (outside the tidal radius) and collapse (inside the tidal radius). For the shear we consider two limiting cases. In the first case (lower estimate) we take each pixel from Figure 4 and we compute its shear velocity using eq. 1. This approach does not give axisymmetric results with respect to the cloud centre. We then divide the pixels in radial distance bins and compute the mean in each bin. In the second case, we assume that a parcel of gas will maintain its tangential speed set by shear as the cloud rotates. This approach assumes that the effects of shear are effectively axisymmetric with respect to the cloud centre. To compute the upper velocity estimates, we use eq. 1 where we replace with . The grey shaded area is then continued within the tidal radius by assuming an dependence for the upper and the lower velocity estimate. This is equivalent to a parcel of gas moving with the shear velocity at the tidal radius, and then being accreted while it conserves its angular momentum.
Figure 5 shows that for all snapshots our lower theoretical prediction for the contribution of the shear (i.e. outside the tidal radius) overlaps with a prominent feature in the data. This feature is better defined in the early snapshots where the spread of velocities is smaller and there is less ongoing gravitational collapse. We also see an average increase of inside the tidal radius in all snapshots, consistent with spin-up due to collapse. This effect is most prominent at where we have a better defined centre of cloud rotation.
5 Summary and Discussion
In this paper, we demonstrated that several kinematic properties of the CMZ cloud known as the Brick arise naturally in a hydrodynamics simulation which takes into account the Galactic gravitational potential. These properties include the line-of-sight velocity distribution, the steep slope of the size-linewidth relation and the solenoidally-driven turbulence. Within the simulation, we explain these through the effect of shear. In the outskirts of the simulated cloud, shear stretches the gas, boosts the velocity dispersion and seeds solenoidal turbulence. Due to the kinematic similarities between the simulation and the Brick, we conclude that the dynamical state of the Brick is likely strongly influenced by the Galactic gravitational potential. Our findings trigger several important follow-up questions.
Can the turbulence be driven by another mechanism? Within the simulation: In addition to shear, turbulence can be driven by gravitational collapse within the cloud. Dale et al. (2019) compared clouds evolved with the Galactic potential to the same clouds evolved in isolation and found that the isolated clouds undergo more rapid collapse, but after the initial period of turbulent dissipation ( Myr) their velocity dispersions remain lower than in the clouds evolved within the potential (see fig. 14 and 15 of Dale et al. 2019). Together with the solenoidal nature of the turbulence (see Figure 3), this indicates that the gravitational collapse on its own is not a sufficient turbulence driver. However, CMZ simulations which include the Galactic gravitational potential but no gas self-gravity also lack sufficient turbulence (Hatchfield et al., 2021). Therefore, the most likely interpretation is that shear seeds solenoidal turbulence which is amplified through gravitational collapse. Within the Brick: we cannot be sure that shear is the only factor contributing to the mode of the turbulence, but the agreement between simulations and observations suggest that it is likely to be an important factor. In addition to shearing motions within the cloud, there should also be shear with respect to the warmer diffuse gas surrounding the cloud, which can trigger Kelvin-Helmholtz instability. Other mechanisms can (and likely do) inject energy into the gas (e.g. stellar feedback; Tassis & Pavlidou 2022; Henshaw et al. 2022b), but this type of energy injection does not typically trigger solenoidal motions (Menon et al., 2020).
Is the Galactic potential suppressing star formation in the Brick? Many authors have argued in favour of the Galactic shear as the mechanism responsible for suppressing star formation in the CMZ (Kruijssen et al., 2014, 2019; Krumholz & Kruijssen, 2015; Federrath et al., 2016; Meidt et al., 2018, 2020; Keto et al., 2020). However, the SFR in our simulation (; Dale et al. 2019) is much higher than that of the Brick (; Rathborne et al. 2014; Walker et al. 2021). This discrepancy suggests that the low SFR in the Brick may be partially caused by physical factors missing from the simulation, such as magnetic and thermal support. Magnetic fields are known to delay star formation and prevent fragmentation. Petkova et al. (2023) found a difference in the width of the column density PDFs between the simulation and the Brick, which can be accounted for with the estimated turbulent plasma of the cloud (Federrath et al., 2016), indicating that magnetic fields are likely important for shaping the cloud structure. Additionally, the high gas temperature of the Brick is explained with shock heating (Ginsburg et al., 2016), as well as high levels of cosmic rays and interstellar radiation (Clark et al., 2013), that are not captured in our simulation.
Another reason for the different SFR in the simulation and the Brick may be the idealised simulation assumptions. The simulation was initialised as a gas sphere, which differs from the expected complex filamentary clouds that enter the CMZ (Tress et al., 2020). The assumed spherical initial state is unstable under the strong compressive tide in the vertical direction, and hence our simulation flattens rapidly. This vertical collapse may be artificially boosting the SFR, and the discrepancy with the Brick may be reduced by assuming more realistic initial conditions. Furthermore, the simulated cloud exists in isolation and it is possible that the Brick has formed through gradual accretion of (higher kinetic energy) material, shifting the timeline of star formation to a later point along the Brick’s orbit.
Observational predictions. The dust ridge of the CMZ consists of several predominantly quiescent clouds, of which the Brick is the most studied one. The analysis presented in this paper predicts that these clouds should also be strongly influenced by the shear induced by the Galactic gravitational potential. As a result, the clouds are expected to have predominantly solenoidal turbulent motions, steep size-linewidth relation, and kinematic signatures of counter-rotation. These predictions are based on the assumption that the clouds can be treated as isolated objects on a CMZ orbit. If we find discrepancies with the kinematic predictions, this could indicate an ongoing cloud assembly, or a form of cloud-cloud interaction.
As part of the ALMA CMZ Exploration Survey (ACES), we have observed the full high column density ( cm-2) reservoir of the Galactic centre region at high spatial ( pc) and spectral ( km s-1) resolution (Longmore et al. in prep.). These data include the full dust ridge, and will be compared to the predictions of this work. In addition, ACES covers a lot of dense gas that has not been previously targeted by ALMA. The kinematic state and the three-dimensional geometry of this gas have not yet been studied, and the predictions included here can help constrain them.
Our analysis concludes that the dynamical state of the Brick is likely strongly influenced by the Galactic gravitational potential. These findings are extendable to the rest of the quiescent CMZ clouds and make predictions for their turbulent state.
Acknowledgements
This work was carried out by the ACES Collaboration as part of the ALMA CMZ Exploration Survey. MAP and JMDK acknowledge funding from the European Research Council (ERC) under the European Union’s Horizon 2020 (ERC Starting Grant MUSTANG; 714907). MAP, JMDK, SCOG and RSK acknowledge financial support from the Deutsche Forschungsgemeinschaft (DFG; German Research Foundation) via the collaborative research center (SFB 881, Project-ID 138713538) “The Milky Way System” (MAP, JMDK: subproj. B2; SCOG: subproj. A1, B1, B2, B8). MAP acknowledges support from a Chalmers Cosmic Origins postdoctoral fellowship. JMDK acknowledges funding from the DFG through an Emmy Noether Research Group (KR4801/1-1). COOL Research DAO is a Decentralised Autonomous Organisation supporting research in astrophysics aimed at uncovering our cosmic origins. SCOG and RSK acknowledge subsidies from the Heidelberg Cluster of Excellence STRUCTURES in the framework of Germany’s Excellence Strategy (EXC-2181/1 - 390900948) and funding from the ERC via the ERC Synergy Grant ECOGAL (855130). AG acknowledges support from the NSF under grants AST 2008101, 2206511, and CAREER 2142300, and from STSCI under grant JWST-GO-02221.001-A. JDH gratefully acknowledges financial support from the Royal Society (University Research Fellowship). VMR has received support from the project RYC2020-029387-I funded by MCIN/AEI /10.13039/501100011033. C.F. acknowledges funding by the Australian Research Council (Future Fellowship FT180100495 and Discovery Projects DP230102280), and the Australia-Germany Joint Research Cooperation Scheme (UA-DAAD). L.C. acknowledges financial support through the Spanish grant PID2019-105552RB-C41 funded by MCIN/AEI/10.13039/501100011033.
Data Availability
The data underlying this article will be shared on reasonable request to the corresponding author.
References
- Ao et al. (2013) Ao Y., et al., 2013, A&A, 550, A135
- Armillotta et al. (2019) Armillotta L., Krumholz M. R., Di Teodoro E. M., McClure-Griffiths N. M., 2019, MNRAS, 490, 4401
- Barnes et al. (2017) Barnes A. T., Longmore S. N., Battersby C., Bally J., Kruijssen J. M. D., Henshaw J. D., Walker D. L., 2017, MNRAS, 469, 2263
- Callanan et al. (2021) Callanan D., et al., 2021, MNRAS, 505, 4310
- Clark et al. (2013) Clark P. C., Glover S. C. O., Ragan S. E., Shetty R., Klessen R. S., 2013, ApJ, 768, L34
- Dahmen et al. (1998) Dahmen G., Huttemeister S., Wilson T. L., Mauersberger R., 1998, A&A, 331, 959
- Dale et al. (2019) Dale J. E., Kruijssen J. M. D., Longmore S. N., 2019, MNRAS, 486, 3307
- Elmegreen & Scalo (2004) Elmegreen B. G., Scalo J., 2004, ARA&A, 42, 211
- Federrath et al. (2010) Federrath C., Roman-Duval J., Klessen R. S., Schmidt W., Mac Low M. M., 2010, A&A, 512, A81
- Federrath et al. (2011) Federrath C., Chabrier G., Schober J., Banerjee R., Klessen R. S., Schleicher D. R. G., 2011, Phys. Rev. Lett., 107, 114504
- Federrath et al. (2016) Federrath C., et al., 2016, ApJ, 832, 143
- Ginsburg et al. (2016) Ginsburg A., et al., 2016, A&A, 586, A50
- Ginsburg et al. (2018) Ginsburg A., et al., 2018, ApJ, 853, 171
- Hatchfield et al. (2021) Hatchfield H. P., Sormani M. C., Tress R. G., Battersby C., Smith R. J., Glover S. C. O., Klessen R. S., 2021, ApJ, 922, 79
- Henshaw et al. (2019) Henshaw J. D., et al., 2019, MNRAS, 485, 2457
- Henshaw et al. (2020) Henshaw J. D., et al., 2020, Nature Astronomy, 4, 1064
- Henshaw et al. (2022a) Henshaw J. D., Barnes A. T., Battersby C., Ginsburg A., Sormani M. C., Walker D. L., 2022a, arXiv e-prints, p. arXiv:2203.11223
- Henshaw et al. (2022b) Henshaw J. D., et al., 2022b, MNRAS, 509, 4758
- Heyer & Dame (2015) Heyer M., Dame T. M., 2015, ARA&A, 53, 583
- Hubber et al. (2018) Hubber D. A., Rosotti G. P., Booth R. A., 2018, MNRAS, 473, 1603
- Kauffmann et al. (2017) Kauffmann J., Pillai T., Zhang Q., Menten K. M., Goldsmith P. F., Lu X., Guzmán A. E., 2017, A&A, 603, A89
- Keto et al. (2020) Keto E., Field G. B., Blackman E. G., 2020, MNRAS, 492, 5870
- Krieger et al. (2017) Krieger N., et al., 2017, ApJ, 850, 77
- Kruijssen & Longmore (2013) Kruijssen J. M. D., Longmore S. N., 2013, MNRAS, 435, 2598
- Kruijssen et al. (2014) Kruijssen J. M. D., Longmore S. N., Elmegreen B. G., Murray N., Bally J., Testi L., Kennicutt R. C., 2014, MNRAS, 440, 3370
- Kruijssen et al. (2015) Kruijssen J. M. D., Dale J. E., Longmore S. N., 2015, MNRAS, 447, 1059
- Kruijssen et al. (2019) Kruijssen J. M. D., et al., 2019, MNRAS, 484, 5734
- Krumholz & Kruijssen (2015) Krumholz M. R., Kruijssen J. M. D., 2015, MNRAS, 453, 739
- Larson (1981) Larson R. B., 1981, MNRAS, 194, 809
- Launhardt et al. (2002) Launhardt R., Zylka R., Mezger P. G., 2002, A&A, 384, 112
- Lis et al. (1994) Lis D. C., Menten K. M., Serabyn E., Zylka R., 1994, ApJ, 423, L39
- Longmore et al. (2012) Longmore S. N., et al., 2012, ApJ, 746, 117
- Longmore et al. (2013) Longmore S. N., et al., 2013, MNRAS, 429, 987
- Lu et al. (2019) Lu X., et al., 2019, ApJ, 872, 171
- Mac Low & Klessen (2004) Mac Low M.-M., Klessen R. S., 2004, Reviews of Modern Physics, 76, 125
- Meidt et al. (2018) Meidt S. E., et al., 2018, ApJ, 854, 100
- Meidt et al. (2020) Meidt S. E., et al., 2020, ApJ, 892, 73
- Menon et al. (2020) Menon S. H., Federrath C., Kuiper R., 2020, MNRAS, 493, 4643
- Mo et al. (2010) Mo H., van den Bosch F. C., White S., 2010, Galaxy Formation and Evolution
- Molinari et al. (2011) Molinari S., et al., 2011, ApJ, 735, L33
- Myers et al. (2022) Myers P. C., Hatchfield H. P., Battersby C., 2022, ApJ, 929, 34
- Orkisz et al. (2017) Orkisz J. H., et al., 2017, A&A, 599, A99
- Petkova et al. (2018) Petkova M. A., Laibe G., Bonnell I. A., 2018, Journal of Computational Physics, 353, 300
- Petkova et al. (2023) Petkova M. A., et al., 2023, MNRAS, 520, 2245
- Price (2007) Price D. J., 2007, PASA, 24, 159
- Rani et al. (2022) Rani R., Moore T. J. T., Eden D. J., Rigby A. J., 2022, MNRAS, 515, 271
- Rathborne et al. (2014) Rathborne J. M., et al., 2014, ApJ, 795, L25
- Rathborne et al. (2015) Rathborne J. M., et al., 2015, ApJ, 802, 125
- Shetty et al. (2012) Shetty R., Beaumont C. N., Burton M. G., Kelly B. C., Klessen R. S., 2012, MNRAS, 425, 720
- Sormani et al. (2022) Sormani M. C., et al., 2022, MNRAS, 512, 1857
- Tassis & Pavlidou (2022) Tassis K., Pavlidou V., 2022, arXiv e-prints, p. arXiv:2205.06820
- Tress et al. (2020) Tress R. G., Sormani M. C., Glover S. C. O., Klessen R. S., Battersby C. D., Clark P. C., Hatchfield H. P., Smith R. J., 2020, MNRAS, 499, 4455
- Walker et al. (2018) Walker D. L., et al., 2018, MNRAS, 474, 2373
- Walker et al. (2021) Walker D. L., et al., 2021, MNRAS, 503, 77
- Williams et al. (2022) Williams B. A., et al., 2022, MNRAS, 514, 578
Appendix A Self-virialised initial conditions
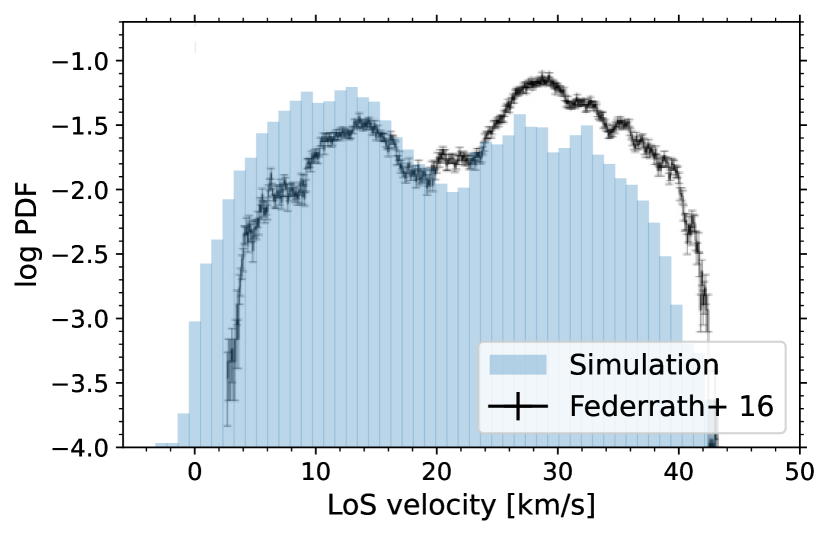
We repeat the same kinematic comparison to the Brick presented in Sec. 3 using a snapshot of a different simulation from Dale et al. (2019). The chosen simulation also has the HDens setup (Dale et al., 2019, see their sect. 3 and tab. 1), but the initial velocity field is self-virialised instead of tidally-virialised. The difference between the two is that the tidally-virialised simulation has additional initial velocity support against the compressive tidal fields of the Galactic gravitaional potential.
Figure 6, 7 and 8 collectively show that the main results presented in this paper hold for a simulation with a different initial velocity field. The line-of-sight velocity distribution is slightly less well matched to the Brick, but it shows a similar velocity range and a double-peaked profile about the same middle velocity value (Figure 6). The simulated size-linewidth relation is similarly offset with respect to the observed one, with a slope which remains (Figure 7). And finally, the compressive ratio within the simulation is low and consistent with having predominantly solenoidal turbulence driving (Figure 8).