Multimodal contrastive learning for diagnosing cardiovascular diseases from electrocardiography (ECG) signals and patient metadata
1 Introduction
This work discusses the use of contrastive learning and deep learning for diagnosing cardiovascular diseases from electrocardiography (ECG) signals. While the ECG signals usually contain 12 leads (channels), many healthcare facilities and devices lack access to all these 12 leads. This raises the problem of how to use only fewer ECG leads to produce meaningful diagnoses with high performance. We introduce a simple experiment to test whether contrastive learning can be applied to this task. More specifically, we added the similarity between the embedding vectors when the 12 leads signal and the fewer leads ECG signal to the loss function to bring these representations closer together. Despite its simplicity, this has been shown to have improved the performance of diagnosing with all lead combinations, proving the potential of contrastive learning on this task.
2 Problem definition and methods
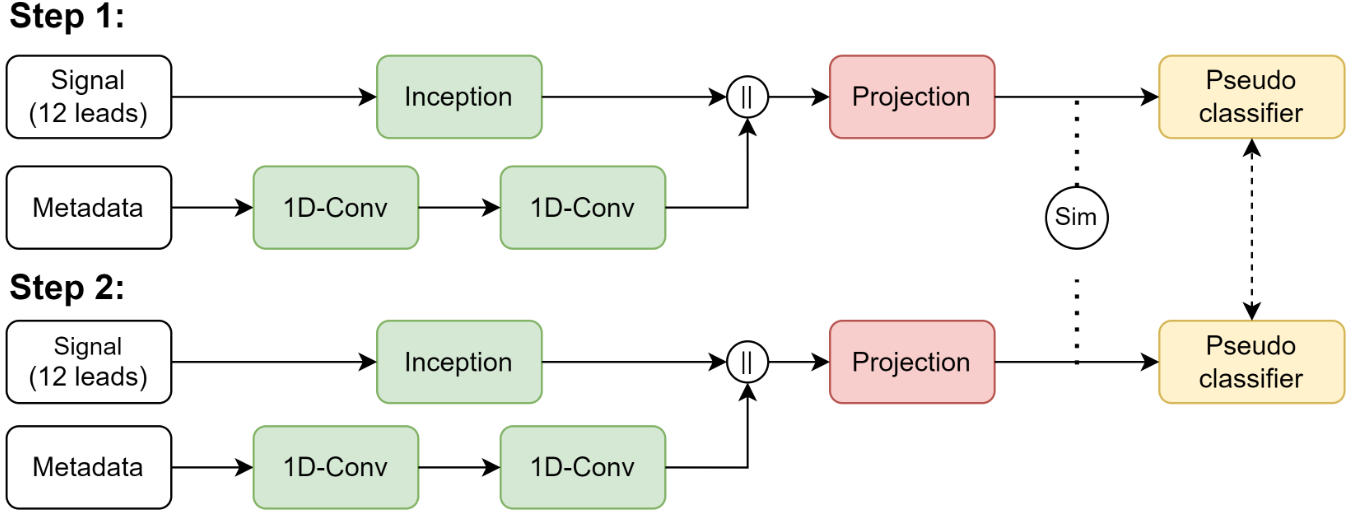
The missing leads problem is defined in Physionet CinC2020 [1], which requires competitors to have models that can achieve high performance on predefined sets of leads. Models tackling this task [10, 4, 6, 9] utilized methods that focused on training and testing on the same number of leads. Here we approach this problem differently by trying to achieve higher performance on less number of leads assuming we have access to all 12 leads ECG with the use of contrastive learning. Figure 1 illustrates an overview of the experiment we used to determine whether contrastive learning would work on this task. The training process is split into two steps. In the first step, we used InceptionTime [3] - a powerful 1D-CNN for feature extraction of 12-lead ECGs in this task. This feature is then concatenated with the encoded metadata feature before being projected onto the embedding space using a linear layer. The embedding vectors then go through a MLP (pseudo-classifier) for classification. In the second step, we froze the weights of the pseudo classifier from the first step (which maps the vectors from the embedding space to the predictions) and then trained the model with fewer leads ECG and a different CNN to project it onto the same embedding space. Notably, in this step, we bring embedding vectors of missing leads closer to their 12-lead version using the modified loss function:
| (1) |
Where and are the prediction and ground truth of the labels, and denote the projected embedding vectors of the 12-lead and its x-lead version (x {2,3,4,6}). The function here calculates the similarity between those two vectors and can be the L1, L2 norm of the difference between these two vectors or the cosine similarity, and is a hyperparameter. The prediction of this method is compared to that of training the model without the first step, freezing the pseudo-classifier and the custom loss function. Patients’ metadata (weight, height, age, gender) is encoded using soft label encoding [2, 5].
3 Experiments and Results
Our experiment was conducted on the PTB-XL dataset [8], which contains over 21000 12-lead ECG signals, and these samples are 10 seconds long. While the dataset also provides various tasks, here we focus on the super-diagnostic classification task. We used validation Macro-AUC as the evaluation metric as the PTB-XL benchmark paper [7] suggests while following the same train-validation split as the paper. Table 1 illustrates the experimental results of various leads combinations with and without the two-step training process (denoted as pseudo=True and pseudo=False). As can be seen, our method outperforms the traditional training process for all leads combination.
| No. of leads | pseudo = True | pseudo = False |
|---|---|---|
| 12 | 0.9320 | N/A |
| 6 | 0.9017 | 0.9007 |
| 4 | 0.9227 | 0.9218 |
| 3 | 0.9213 | 0.9199 |
| 2 | 0.9017 | 0.9002 |
4 Discussions and Conclusion
We showed that contrastive learning can be used in the task of missing leads ECG classification. Despite its simplicity, the results suggest that by bringing the missing lead representation closer to that of the complete signal, diagnostic performance can be improved on all lead combinations. In the future, we will apply more complex contrastive learning techniques to improve the model’s performance.
References
- [1] E. A. P. Alday, A. Gu, A. J. Shah, C. Robichaux, A.-K. I. Wong, C. Liu, F. Liu, A. B. Rad, A. Elola, S. Seyedi, et al. Classification of 12-lead ecgs: the physionet/computing in cardiology challenge 2020. Physiological measurement, 41(12):124003, 2020.
- [2] G. Cai, Y. Zhu, Y. Wu, X. Jiang, J. Ye, and D. Yang. A multimodal transformer to fuse images and metadata for skin disease classification. The Visual Computer, May 2022.
- [3] H. I. Fawaz, B. Lucas, G. Forestier, C. Pelletier, D. F. Schmidt, J. Weber, G. I. Webb, L. Idoumghar, P. Muller, and F. Petitjean. Inceptiontime: Finding alexnet for time series classification. CoRR, abs/1909.04939, 2019.
- [4] H. Han, S. Park, S. Min, H.-S. Choi, E. Kim, H. Kim, S. Park, J. Kim, J. Park, J. An, K. Lee, W. Jeong, S. Chon, K. Ha, M. Han, and S. Yoon. Towards high generalization performance on electrocardiogram classification. In 2021 Computing in Cardiology (CinC), volume 48, pages 1–4, 2021.
- [5] W. Li, J. Zhuang, R. Wang, J. Zhang, and W.-S. Zheng. Fusing metadata and dermoscopy images for skin disease diagnosis. In 2020 IEEE 17th International Symposium on Biomedical Imaging (ISBI). IEEE, Apr. 2020.
- [6] P. Nejedly, A. Ivora, R. Smisek, I. Viscor, Z. Koscova, P. Jurak, and F. Plesinger. Classification of ecg using ensemble of residual cnns with attention mechanism. In 2021 Computing in Cardiology (CinC), volume 48, pages 1–4, 2021.
- [7] N. Strodthoff, P. Wagner, T. Schaeffter, and W. Samek. Deep learning for ecg analysis: Benchmarks and insights from ptb-xl. IEEE Journal of Biomedical and Health Informatics, 25(5):1519–1528, 2020.
- [8] P. Wagner, N. Strodthoff, R.-D. Bousseljot, W. Samek, and T. Schaeffter. PTB-XL, a large publicly available electrocardiography dataset, 2020.
- [9] N. L. Wickramasinghe and M. Athif. Multi-label cardiac abnormality classification from electrocardiogram using deep convolutional neural networks. In 2021 Computing in Cardiology (CinC), volume 48, pages 1–4. IEEE, 2021.
- [10] Z. Xu, Y. Guo, T. Zhao, Y. Zhao, Z. Liu, X. Sun, G. Xie, and Y. Li. Abnormality classification from electrocardiograms with various lead combinations. Physiological Measurement, 43(7):074002, 2022.