Research on the transition dynamics and linear (nonlinear) optical properties of mCherry
Abstract
In this study, we explore the electron transition mechanism and optical properties of the popular red fluorescent protein mCherry. By examining the charge transfer spectrum and combining it with the mCherry hole-electron distribution, we identify that the charge transfer between the phenolate and imidazolinone loops significantly contributes to the absorption spectrum. Quantitative analysis of charge transfer shows that, overall, the electrons are transferred to the atom in the middle of phenolate and the imidazolinone loops during absorption. We speculate that may also absorb protons to enable the photoconversion of mCherry in the excited state, similar to the blinking mechanism of IrisFP. In addition, we further investigated the optical properties of mcherry in the external field by polarizability (hyperpolarizability), showing the anisotropy of the polarization, the first hyperpolarization and the second hyperpolarization by unit spherical representation. Our results suggest that significant polarization and second hyperpolarizability occur when the field direction and electron transfer direction are aligned. We also analyzed the polarizability and first hyperpolarizabilities for different external fields. The polarizability mutated when the external field satisfies the transition. Finally, the study of the first hyperpolarizability shows that adjusting the appropriate field can lead to a linear photoelectric effect or second harmonic generation of mCherry. These studies have certain reference values for various red fluorescent protein correlation simulations and experiments because of the similarity of the red fluorescent protein.
keywords:
American Chemical Society, LaTeXBeijing Institute of Technology] Center for Quantum Technology Research, Key Laboratory of Advanced Optoelectronic Quantum Architecture and Measurements (MOE), School of Physics, Beijing Institute of Technology, Beijing, China Beijing Institute of Technology] Center for Quantum Technology Research, Key Laboratory of Advanced Optoelectronic Quantum Architecture and Measurements (MOE), School of Physics, Beijing Institute of Technology, Beijing, China Beijing Institute of Technology] Center for Quantum Technology Research, Key Laboratory of Advanced Optoelectronic Quantum Architecture and Measurements (MOE), School of Physics, Beijing Institute of Technology, Beijing, China Beijing Institute of Technology] Center for Quantum Technology Research, Key Laboratory of Advanced Optoelectronic Quantum Architecture and Measurements (MOE), School of Physics, Beijing Institute of Technology, Beijing, China Beijing Institute of Technology] Center for Quantum Technology Research, Key Laboratory of Advanced Optoelectronic Quantum Architecture and Measurements (MOE), School of Physics, Beijing Institute of Technology, Beijing, China \alsoaffiliationBeijing Academy of Quantum Information Sciences, Beijing 100193, China \abbreviationsIR,NMR,UV
1 Introduction
Fluorescent proteins (FPs), derived from green fluorescent proteins found in the jellyfish Aequorea victoria1, can be engineered to respond to various biological events and signals, rendering them valuable for various biological tissues and organisms while rarely causing photodynamic toxicity2.
Decades of research have resulted in a family of FPs that span the entire visible spectrum, leading to the development of powerful fluorescent probes and revealing the complexity and application value of the photophysical properties of proteins3, 4, 5, 6, 7, 8, 9. In bioimaging and sensing, FPs and their derived biosensors make it possible to probe the location, activities, or interactions of molecules from the subcellular to multicellular scales10. Fluorescence imaging technology is ideal for measuring the pathophysiological microenvironment measurement11, and fluorescent protein nanothermometers have the capability of accurately targeting to organelles and genetically encode12. Tumour-targeted fluorescence-guided surgery enables the visualization of solid tumors13, while fluorescence lifetime imaging and Frster resonance energy transfer has been coupled with multiphoton microscopy for in vivo dynamic imaging14. Many photoinduced reactions of FPs, such as photoisomerization, excited-state proton transfer, photooxidation/photoreduction, are initiated by electron transfer15. The reversible photoconversion characteristic of fluorescent proteins to switch back and forth between fluorescent and nonfluorescent states is highly significant to the development of advanced fluorescence imaging and biotechnology based on their photophysical properties16, 17, 18. Engineering FPs to switch between dark and detectable states enables to image structures with spatial resolution beyond Abbe’s diffraction limit19. Dynamic fluorescence can adjust surface patterns through external stimulation, which is highly valuable in the fields of smart displays, information storage, and anticounterfeiting20, 21, 22, 23, 24.
Red fluorescent proteins (RFPs) have low scattering and large penetration depth in the red to near-infrared region, making them advantageous in deep-tissue imaging of live animals owing to their longer excitation and emission wavelengths3, 25. For instance, the bright red fluorophore mRuby3 can be used to design a voltage-activated red neuronal activity monitor, extending the application of genetically encoded voltage indicators in high-speed multispectral imaging and opening the door to high-speed multispectral functional imaging in vivo26. The energy of the excited state of RFPs strongly correlates with the magnetic dipole moment, which can be used to adjust the spectrum of markers in in vivo imaging27.
Although mCherry has low fluorescence quantum yield, it is a popular red fluorescent protein, the lineage of which can be traced to the naturally occurring tetramer DsRed28. However, naturally occurring RFPs occur in dimeric or tetrameric form, both of which tend to oligomerize and are unsuitable for fusion tagging29, 30, 31, 32. Several novel mutant monomeric variants known as mFruits have been designed to address this issue; among the designed variants, mCherry, mOrange, and mStrawberry are the most promising28, 33, 34. Compared to its progenitor, mCherry has the advantages of a favorable red-shift of absorption and emission spectra, higher expression and fast chromophore maturation, and lower phototoxicity35. Unfortunately, the fluorescence quantum yield of mcherry is only one-third, rendering it suubstantially dimmer than DsRed28, 36. The second-order nonlinear optical response () of fluorescent proteins including mCherry can be measured via Hyper-Rayleigh Scattering and is suitable for second-harmonic imaging microscopy37. RFPs with a common origin are similar, and their transition mechanism in absorption and emission is intriguing. However, related studies on this photoinduced reaction are relatively few. Consequently, we posit that studying the transition mechanism of mCherry in detail could provide some references for experiments related to mCherry and other RFPs.
In this study, we used the QM/MM method to simulate the absorption process of mcherry, and we analyzed the calculated wave function using Multiwfn (Version (dev))38 software to investigate the transition mechanism and optical properties of mCherry. The absorption process involves molecular transition from the ground state minimum () to the excited state (); we consider only the transition with the largest contribution to the mCherry absorption spectrum. Using Multiwfn, we introduced hole-electron analysis to study the transition mechanism of mCherry. First, we observe the hole-electron distribution 39 of the excited state, and combined with the charge transfer spectrum40 of mCherry, we investigate the influence of the charge transfer within the chromophore on the absorption spectrum. Second, we quantitatively analyzed charge transfer during absorption using the interfragment charge transfer module41 of Multiwfn and plotted a heat map. Additionally, we focus on the palarization and hyperpolarization calculated by the complete state summation method42, showing the polarizability, the first and second hyperpolarizations in all directions using the unit spherical representation43, 44. Finally, we studied the polarizability and the first hyperpolarization under different external fields and analyzed the linear and nonlinear optical properties of mCherry.
2 Models and methods
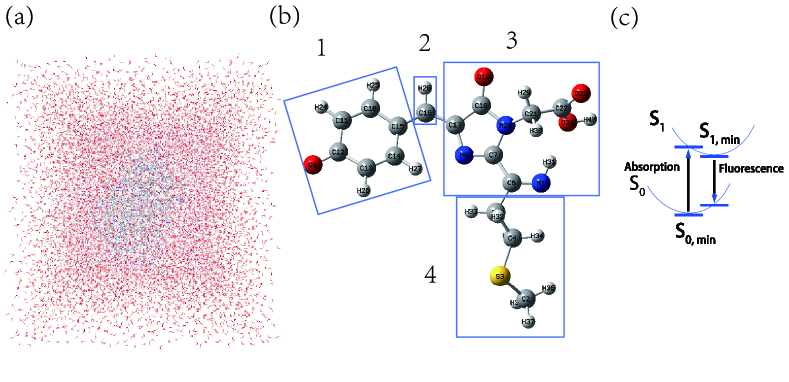
Herein, we used ORCA (Version )45 software for QM/MM calculation and Multiwfn38 software for data analysis. To prepare for the analysis, we obtained the mCherry crystal structure file (code 2H5Q)46 from the Protein Data Bank. Then, we used VMD47 software to cover it with a layer of water molecules Å thick (Fig.1(a)), and generate a protein structure file (PSF), in which residue glu215 was adjusted to a protonation state.
Using Avogadro48, we individually added atoms to the chromophore and additionally appended and ions at the interface to compensate for the effects of bond breakage. As shown in Fig.1(b), the three extra attached atoms are , , and at the right end. To investigate the role of phenolate and imidazolinone, we referred to the three-state adiabatic model49, 50 to divide the chromophore into four regions. Region comprises the phenolate ring, Region includes the imidazolinone ring and partially surrounding atoms, Region comprises the phenolate ring and the imidazolinone ring middle region, and the remaining parts are included in Region . The PSF file was then transformed into an ORCA force field file, and the force field file of the chromophore was generated directly in the ORCA software using the orca_mm module. Subsequently, the mCherry was pre-optimized using the L-BFGS optimizer (keyword “L-Opt”) in ORCA.
To facilitate the analysis, we performed a geometric manipulation of the molecule using Multiwfn. In order, making the bond of region parallel to the -axis, selecting the heavy atom center of region as the origin of coordinates, and adjusting the phenolate ring of region parallel to the plane.
Next, we initiated the QM/MM calculation using ORCA software. As shown in Fig.1(c), we regard directly as the absorption process, while the fluorescence process is . The structure optimization level was CAM-B3LYP(D3)/cc-pVDZ, where the QM region contained only the chromophore, and the active region included all atoms within Å of the chromophore. We then selected the higher level DSD-PBEP86(D3)/may-cc-pV(T+d)Z to perform TDDFT calculations and imported the results into Multiwfn for spectra drawing and various analyses.
We analyze the linear (nonlinear) optical characteristics of mCherry in different external fields by polarization (hyperpolarization). In Multiwfn, the complete state summation method was used to calculate polarization and hyperpolarizability42. The Taylor expansion of the system energy relative to the uniform external field is given as51
where is called the permanent dipole moment, is the polarizability (linear optical coefficient), is the first hyperpolarizability (second-order nonlinear optical coefficient) and is the second hyperpolarizability (third-order nonlinear optical coefficients) , which satisfies
In addition, the total dipole moment can be expressed as
where is called the induced dipole moment. Assuming that the external field per unit strength is used, the polarizability (hyperpolarizability) under the electrostatic field can measure the change in the molecule-induced dipole moment. Generally, molecules with stronger polarizability tend to have larger molecular volumes52, 53.
3 Results and discussion
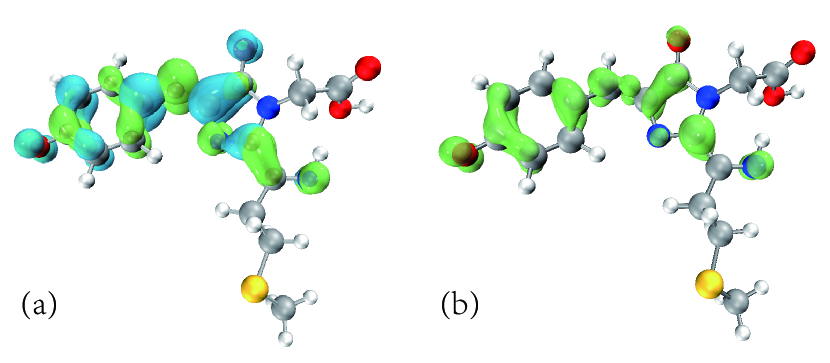

Hole-Electron Distribution. Fig.2(a) shows the hole-electron distribution in the state of mCherry. It is apparent that the holes and electrons are mainly distributed around the phenolate ring and the imidazolinone ring. Based on Fig.1(b), electron transfer exclusively occurs in Regions and no hole-electron distribution in Region . In the absorption process, the molecule transitions from the ground state to the first excited state, loses electrons in the region of the blue grid surface and obtains electrons in the region of the green grid surface, eventually leading to massive electron transfer inside Regions . In addition, we have attempted to expand the QM region, but the final hole-electron distribution is not significantly different.
Fig.2(b) indicates the region where the electrons and holes significantly overlap. As can be clearly observed therein, the electrons and holes overlapped very heavily. Moreover, based on the output of Multiwfn, the centroid distance between the hole and the electron is only Å, which is less than half of the single bond (about Å54). From the high overlap of holes and electrons, we infer that the transition is accompanied by a large transition electric dipole moment, corresponding to a large oscillator intensity, eventually producing a strong absorption peak in the absorption spectrum55.
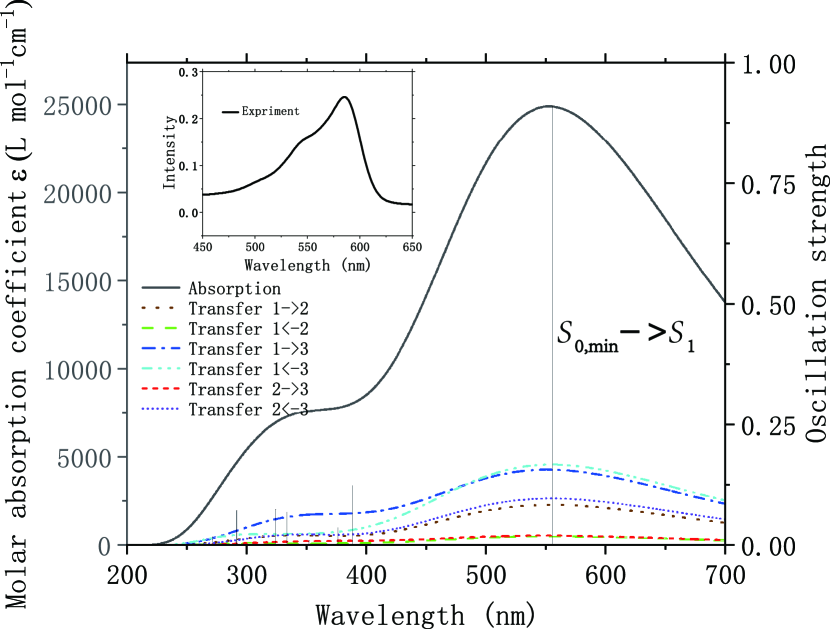
Charge-Transfer Spectrum. The absorption spectrum of the mCherry and the contribution of charge transfer between regions to the absorption spectrum are shown in Fig.3. According to the hole-electron distribution in Fig.2(a), there are no holes or electrons in Region ; hence, we only consider charge transfer between Regions . The dark blue dot-dash line and the light blue double dot-dash line have the largest effect on the spectrum, representing the charge transfer between Regions and , namely between the phenolate and imidazolinone rings. The brown dotted line and the purple short dotted line have a slightly less impact, representing the charge transfer from Region and Region to Region , i.e., the contribution to the absorption spectrum when the charges in the phenolate and imidazolinone rings move to the region in between them. Fig.3 clearly shows that the oscillator intensity corresponding to the transition is the largest, and the contribution to the absorption spectrum is the largest, confirming our speculation. The subfigure shows the mCherry absorption spectrum measured in our experimentally, and its trend is consistent with our calculation results. Combined with the consistent trend of the experimental and calculated results and the above conclusion that the hole-electron distribution does not change with the increase in the QM region, we conclude that our study can describe the mCherry transition mechanism.
Interfragment Charge Transfer. Fig.4 shows the specific electron transfer values between regions or heavy atoms. Combining Fig.3 and 4(a), it can be found that many electrons are transferred between Region 1 and Region 3, which also makes great contributions to the absorption spectrum. The more the number of electrons transferred, the greater the contribution to the absorption spectrum. With electrons transferred within Region and simultaneously electrons moving within Region , it is conceivable that both parts also substantially contribute to the absorption spectrum. Overall, Region lost electrons, Region lost electrons, and instead, Region obtained electrons. Therefore, electrons generally move from phenolate and imidazolinone to the atom between them. This conclusion is different from that of electron transfer obtained from observing the positive (negative) electron density difference centroid, in the case of which the electrons move purely from phenolate to imidazolinone27. The hole-electron distribution map directly shows the original distribution characteristics of holes and electrons without cancelation, which has certain advantages in investigating the intrinsic characteristics of electron excitation. Furthermore, if we judge the direction of electron transfer by referring to the hole centroid and the electron centroid, the result is consistent with that observed from the perspective of density difference.
The electron transfer between regions can be more intuitively understood from Fig.4(b), in which a large number of electrons are transferred into Region (colored green), whereas very few atoms are transferred out of Region (colored dark blue). The number of electrons transferred between Regions and is very close, both shown in orange. Region has the highest number of redistributed electrons, shown in red. Additionally, if the four regions are not divided, the heat mat of the direct study on charge transfer between heavy atoms, as shown in Fig.4(c), can be found from another perspective that electrons are concentrated in in Region , and the nearby and transfer an extra large number of electrons to . In contrast, the result of electron transfer is that is negatively charged, with the possibility of proton absorption, which is very similar to the blinking mechanism56 in IrisFP. The blinking mechanism57 of IrisFP is the thermally reversible photoinduced proton exchange between the methylene bridge of the chromophore and the surrounding residues. In particular, the chromophore of IrisFP acquired protons at exactly the same site as that of in the chromophore of mCherry. Therefore, it is possible for to absorb the proton and protonize the chromophore, resulting in phototransformation of mCherry.
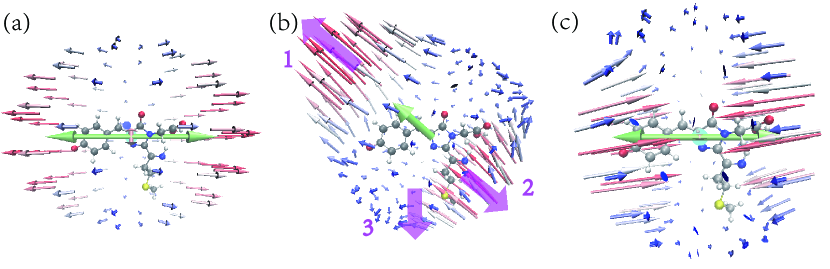
Linear and Nonlinear Optical Properties. Fig.5 displays the anisotropy of polarization, the first hyperpolarization, and the second hyperpolarization using unit spherical representation. In Fig.5(a) and Fig.5(c), the components in the and directions are negligible relative to the direction. Thus, applying the external fields in the connection direction of the phenolate ring and the imidazolinone ring can generate relatively large polarization and second hyperpolarization. In contrast, the polarization and second hyperpolarization are relatively negligible when the outer fields are perpendicular to the direction. According to the electron transfer situation shown in Fig.4, the external field applied in direction is in the same direction as the electron transfer, resulting in the largest influence on polarization or hyperpolarization. In contrast, the influence of the external field perpendicular to the electron transfer direction is negligible. As for Fig.5(b), the first hyperpolarization generated by outfields applied in direction is larger and in the same direction as the outfields, but the first hyperpolarization generated by outfields applied in direction is opposite to the outfields, whereas the first hyperpolarization generated by outfields applied in direction is smaller and perpendicular to the outfields.
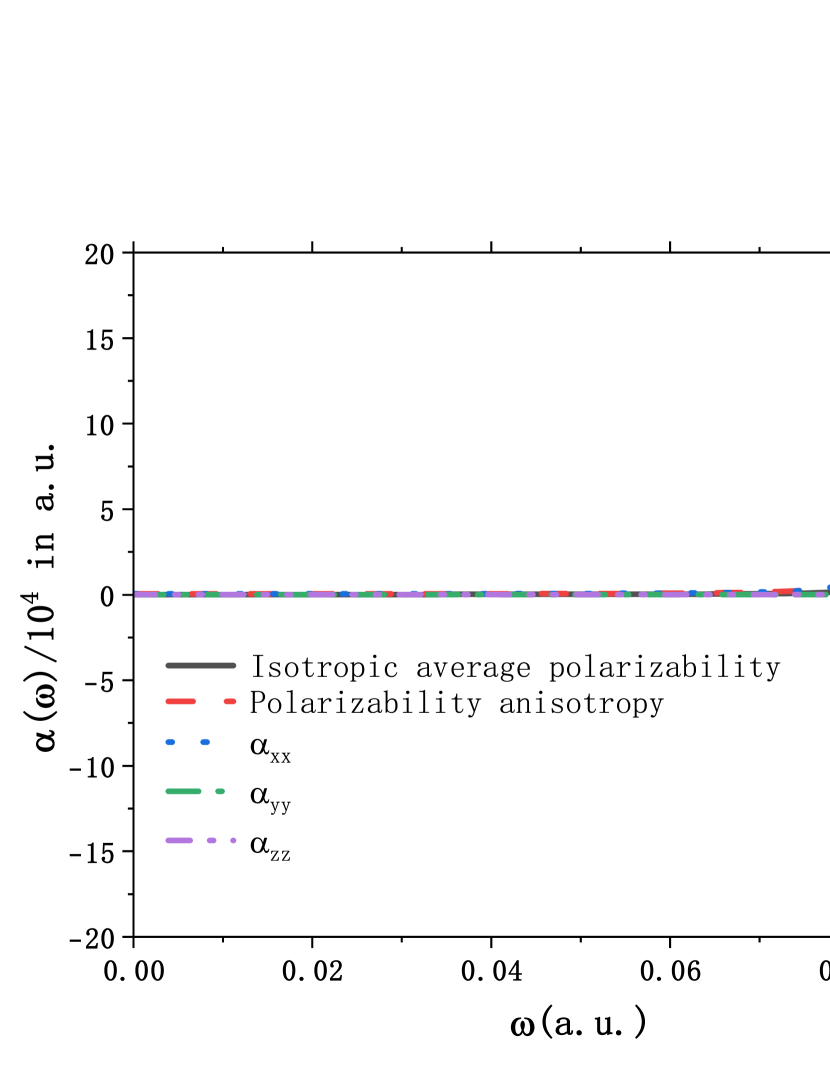
Fig.6 studies the variation of the polarizability with the frequency of the outfield. It shows that when the external field frequency is a.u. (about nm), satisfying the transition, the polarizability is mutated while the polarizabilities in all directions around the transition point obviously differ from each other. Specifically, the main reason is that the polarization of direction undergoes a huge change while the polarizations of the and directions can be ignored in terms of both the absolute size and the degree of change. Moreover, the absolute value of anisotropic polarization (orange) is consierably higher than that of isotropic average polarization (black), and the polarization of mCherry presents significant anisotropy.
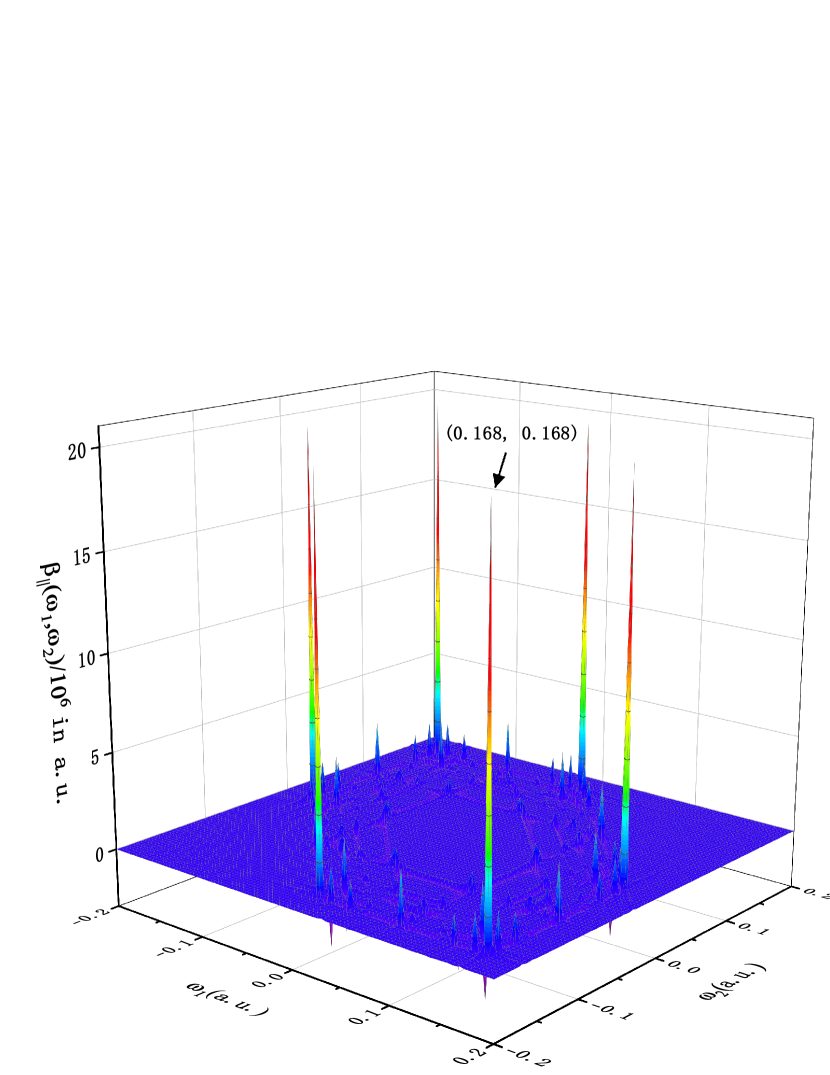
The scanning of the first hyperpolarizability as a function of the frequency of the field in Fig.7 demonstrates the excellent nonlinear optical characteristics of mCherry. The positive and negative signs of frequencies and have no physical significance. If the peak occurs when and symbols are the same, it corresponds to the combined frequency effect. In contrast, when the peaks with the opposite and symbols reflect the difference frequency effect. Specifically, the peak at represents the second harmonic generation effect at the corresponding frequency; in the absence of any adjustment in these two fields, if the effect is optical rectification, the peak appears at 58, 59.
Abundant peaks appeared in our simulation, with six peaks far exceeding the others in height. Four of the six highest peaks correspond to or values of , reflecting a linear photoelectric effect, and can be used in fields such as electric-optical regulators. Two of the highest peaks satisfy and generate second harmonics at their locations, which can be used in frequency multipliers and second-harmonic generation microscopy37, 60. Observing the external field frequencies corresponding to these six peaks, if the frequency of one field is , the other external field frequency size is a.u.( nm); in contrast, when , both external field frequency sizes are a.u. Using different calculation methods, the frequency and wavelength of the nonzero field at the peak will change but the trend of the first hyperpolarizability changing with outfields is similar.
4 CONCLUSIONS
Here, we investigate the transition mechanism of mCherry during the absorption process and its linear (nonlinear) optical properties. With Multiwfn software, we introduced the hole-electron analysis method to investigate the transition mechanism of mCherry. Based on the absorption spectra we simulated with the QMMM method is consistent with the trend we obtained experimentally, and that expanding the QM region does not affect the hole-electron distribution, i.e., the electron transfer is concentrated in the chromophore, we judge our simulation and analysis are reliable. According to the charge transfer spectrum, a substantial charge transfer occurred between phenolate and imidazolinone, which considerably contributed to the absorption spectrum. Interestingly, the electrons converge overall towards the atom between the phenolate ring and the imidazolinone ring during absorption, which different from the observed direction of electron movement along phenolate to imidazolinone from the perspective of the density difference27. However, from the perspectives of the hole centroid and the electron centroid, the electron transfer direction was the same as the density difference perspective. Similar to the blinking mechanism57, 56 of IrisFP, the chromophore of mCherry may also absorb proton at after excitation, thus achieving protonation and resulting photoconversion of mCherry.
In addition to investigating the transition mechanism of mCherry during the absorption process, we further analyzed its linear and nonlinear optical properties in different external fields. We utilized the unit spherical representation method to study the anisotropy of polarization, first hyperpolarization, and second hyperpolarization. Our results show that the polarizability and second hyperpolarizability are considerably larger in the phenolate and imidazolinone connection direction than when perpendicular to this direction. In connection with the previous analysis of the transition mechanism, this phenomenon is due to electrons moving mainly in this direction. Then, we study the polarizability in the outer field at different frequencies, and find that the polarizability is mutated in the connection direction of the phenolate loop and the imidazolinone loop when the outer field satisfies the transition. Finally, we investigated the variation of the first hyperpolarizability in two different fields and plotted the scan. Our simulation results show that mCherry can produce a linear photoelectric effect (the nonzero external wavelength is nm) or second harmonic wave (both external field wavelengths are nm) by adjusting the appropriate external fields, which has great application value in the electro-optic regulator, frequency multiplier, and second-harmonic imaging microscopy37.
Given the similarity of RFPs, we suggest that the transition mechanism and optical properties of mCherry can be extricated to other RFPs. The analytical techniques, such as hole-electron analysis and unit spherical representation method used herein, can also be applied to other FPs. At present, there are few detailed analyses of how electrons are transferred in the photoinduced reaction of FPs. The hole-electron analysis is more intuitive and detailed than the electron density method61, 62 commonly used to analyze FPs and can be used to study electron transfer in various photoinduced reactions. Finally, we believe that our study can serve as a reference for mCherry and other fluorescence protein-related experiments and simulations.
The authors thank financial support from the National Natural Science Foundation of China (12204040).
References
- Mishin et al. 2015 Mishin, A. S.; Belousov, V. V.; Solntsev, K. M.; Lukyanov, K. A. Novel uses of fluorescent proteins. Current Opinion in Chemical Biology 2015, 27, 1–9, Molecular imaging
- Zhang et al. 2002 Zhang, J.; Campbell, R. E.; Ting, A. Y.; Tsien, R. Y. Creating new fluorescent probes for cell biology. Nature Reviews Molecular Cell Biology 2002, 3, 906–918
- Mukherjee and Jimenez 2022 Mukherjee, S.; Jimenez, R. Photophysical Engineering of Fluorescent Proteins: Accomplishments and Challenges of Physical Chemistry Strategies. The Journal of Physical Chemistry B 2022, 126, 735–750, PMID: 35075898
- Dean and Palmer 2014 Dean, K. M.; Palmer, A. E. Advances in fluorescence labeling strategies for dynamic cellular imaging. Nature Chemical Biology 2014, 10, 512–523
- Montero Llopis et al. 2021 Montero Llopis, P.; Senft, R. A.; Ross-Elliott, T. J.; Stephansky, R.; Keeley, D. P.; Koshar, P.; Marqués, G.; Gao, Y.-S.; Carlson, B. R.; Pengo, T.; Sanders, M. A.; Cameron, L. A.; Itano, M. S. Best practices and tools for reporting reproducible fluorescence microscopy methods. Nature Methods 2021, 18, 1463–1476
- Koch et al. 2018 Koch, M.; Symvoulidis, P.; Ntziachristos, V. Tackling standardization in fluorescence molecular imaging. Nature Photonics 2018, 12, 505–515
- Bando et al. 2019 Bando, Y.; Sakamoto, M.; Kim, S.; Ayzenshtat, I.; Yuste, R. Comparative Evaluation of Genetically Encoded Voltage Indicators. Cell Reports 2019, 26, 802–813.e4
- Mo et al. 2018 Mo, H.-M.; Xu, Y.; Yu, X.-W. Improved Soluble Expression and Catalytic Activity of a Thermostable Esterase Using a High-Throughput Screening System Based on a Split-GFP Assembly. Journal of Agricultural and Food Chemistry 2018, 66, 12756–12764, PMID: 30411620
- Ranjit et al. 2021 Ranjit, S.; Lanzanò, L.; Libby, A. E.; Gratton, E.; Levi, M. Advances in fluorescence microscopy techniques to study kidney function. Nature Reviews Nephrology 2021, 17, 128–144
- Duwé and Dedecker 2019 Duwé, S.; Dedecker, P. Optimizing the fluorescent protein toolbox and its use. Current Opinion in Biotechnology 2019, 58, 183–191, Systems Biology • Nanobiotechnology
- Wang et al. 2021 Wang, S.; Ren, W. X.; Hou, J.-T.; Won, M.; An, J.; Chen, X.; Shu, J.; Kim, J. S. Fluorescence imaging of pathophysiological microenvironments. Chem. Soc. Rev. 2021, 50, 8887–8902
- Zhou et al. 2020 Zhou, J.; del Rosal, B.; Jaque, D.; Uchiyama, S.; Jin, D. Advances and challenges for fluorescence nanothermometry. Nature Methods 2020, 17, 967–980
- Mieog et al. 2022 Mieog, J. S. D.; Achterberg, F. B.; Zlitni, A.; Hutteman, M.; Burggraaf, J.; Swijnenburg, R.-J.; Gioux, S.; Vahrmeijer, A. L. Fundamentals and developments in fluorescence-guided cancer surgery. Nature Reviews Clinical Oncology 2022, 19, 9–22
- Coelho et al. 2020 Coelho, S.; Poland, S. P.; Devauges, V.; Ameer-Beg, S. M. Adaptive optics for a time-resolved Förster resonance energy transfer (FRET) and fluorescence lifetime imaging microscopy (FLIM) in vivo. Opt. Lett. 2020, 45, 2732–2735
- Acharya et al. 2017 Acharya, A.; Bogdanov, A. M.; Grigorenko, B. L.; Bravaya, K. B.; Nemukhin, A. V.; Lukyanov, K. A.; Krylov, A. I. Photoinduced Chemistry in Fluorescent Proteins: Curse or Blessing? Chemical Reviews 2017, 117, 758–795, PMID: 27754659
- Coquelle et al. 2018 Coquelle, N. et al. Chromophore twisting in the excited state of a photoswitchable fluorescent protein captured by time-resolved serial femtosecond crystallography. Nature Chemistry 2018, 10, 31–37
- Adam et al. 2014 Adam, V.; Berardozzi, R.; Byrdin, M.; Bourgeois, D. Phototransformable fluorescent proteins: Future challenges. Current opinion in chemical biology 2014, 20, 92–102
- Nienhaus and Ulrich Nienhaus 2014 Nienhaus, K.; Ulrich Nienhaus, G. Fluorescent proteins for live-cell imaging with super-resolution. Chem. Soc. Rev. 2014, 43, 1088–1106
- Sigal et al. 2018 Sigal, Y. M.; Zhou, R.; Zhuang, X. Visualizing and discovering cellular structures with super-resolution microscopy. Science 2018, 361, 880–887
- Ma et al. 2020 Ma, T.; Li, T.; Zhou, L.; Ma, X.; Yin, J.; Jiang, X. Dynamic wrinkling pattern exhibiting tunable fluorescence for anticounterfeiting applications. Nature Communications 2020, 11, 1811
- Qi et al. 2017 Qi, Q.; Li, C.; Liu, X.; Jiang, S.; Xu, Z.; Lee, R.; Zhu, M.; Xu, B.; Tian, W. Solid-State Photoinduced Luminescence Switch for Advanced Anticounterfeiting and Super-Resolution Imaging Applications. Journal of the American Chemical Society 2017, 139, 16036–16039, PMID: 29045132
- Zuo et al. 2018 Zuo, M.; Qian, W.; Li, T.; Hu, X.-Y.; Jiang, J.; Wang, L. Full-Color Tunable Fluorescent and Chemiluminescent Supramolecular Nanoparticles for Anti-counterfeiting Inks. ACS Applied Materials & Interfaces 2018, 10, 39214–39221
- Gao et al. 2018 Gao, Z.; Han, Y.; Wang, F. Cooperative supramolecular polymers with anthracene–endoperoxide photo-switching for fluorescent anti-counterfeiting. Nature Communications 2018, 9, 3977
- Liu et al. 2019 Liu, Y. et al. Inkjet-printed unclonable quantum dot fluorescent anti-counterfeiting labels with artificial intelligence authentication. Nature Communications 2019, 10, 2409
- Duan et al. 2019 Duan, C.; Won, M.; Verwilst, P.; Xu, J.; Kim, H. S.; Zeng, L.; Kim, J. S. In Vivo Imaging of Endogenously Produced HClO in Zebrafish and Mice Using a Bright, Photostable Ratiometric Fluorescent Probe. Analytical Chemistry 2019, 91, 4172–4178, PMID: 30784257
- Kannan et al. 2018 Kannan, M.; Vasan, G.; Huang, C.; Haziza, S.; Li, J. Z.; Inan, H.; Schnitzer, M. J.; Pieribone, V. A. Fast, in vivo voltage imaging using a red fluorescent indicator. Nature methods 2018, 15, 1108–1116
- Khrenova et al. 2021 Khrenova, M. G.; Mulashkin, F. D.; Nemukhin, A. V. Modeling Spectral Tuning in Red Fluorescent Proteins Using the Dipole Moment Variation upon Excitation. Journal of Chemical Information and Modeling 2021, 61, 5125–5132, PMID: 34601882
- Shaner et al. 2004 Shaner, N. C.; Campbell, R. E.; Steinbach, P. A.; Giepmans, B. N. G.; Palmer, A. E.; Tsien, R. Y. Improved monomeric red, orange and yellow fluorescent proteins derived from Discosoma sp. red fluorescent protein. Nature Biotechnology 2004, 22, 1567–1572
- Matz et al. 1999 Matz, M. V.; Fradkov, A. F.; Labas, Y. A.; Savitsky, A. P.; Zaraisky, A. G.; Markelov, M. L.; Lukyanov, S. A. Fluorescent proteins from nonbioluminescent Anthozoa species. Nature Biotechnology 1999, 17, 969–973
- Yarbrough et al. 2001 Yarbrough, D.; Wachter, R. M.; Kallio, K.; Matz, M. V.; Remington, S. J. Refined crystal structure of DsRed, a red fluorescent protein from coral, at 2.0-Å resolution. Proceedings of the National Academy of Sciences 2001, 98, 462–467
- Campbell et al. 2002 Campbell, R. E.; Tour, O.; Palmer, A. E.; Steinbach, P. A.; Baird, G. S.; Zacharias, D. A.; Tsien, R. Y. A monomeric red fluorescent protein. Proceedings of the National Academy of Sciences 2002, 99, 7877–7882
- Merzlyak et al. 2007 Merzlyak, E. M.; Goedhart, J.; Shcherbo, D.; Bulina, M. E.; Shcheglov, A. S.; Fradkov, A. F.; Gaintzeva, A.; Lukyanov, K. A.; Lukyanov, S.; Gadella, T. W. J.; Chudakov, D. M. Bright monomeric red fluorescent protein with an extended fluorescence lifetime. Nature Methods 2007, 4, 555–557
- Shaner et al. 2005 Shaner, N. C.; Steinbach, P. A.; Tsien, R. Y. A guide to choosing fluorescent proteins. Nature Methods 2005, 2, 905–909
- Chapagain et al. 2011 Chapagain, P. P.; Regmi, C. K.; Castillo, W. Fluorescent protein barrel fluctuations and oxygen diffusion pathways in mCherry. The Journal of Chemical Physics 2011, 135, 235101
- Mukherjee et al. 2022 Mukherjee, S.; Manna, P.; Hung, S.-T.; Vietmeyer, F.; Friis, P.; Palmer, A.; Jimenez, R. Directed evolution of a bright variant of mCherry: Suppression of non-radiative decay by fluorescence lifetime selections. ChemRxiv 2022,
- Baird et al. 2000 Baird, G. S.; Zacharias, D. A.; Tsien, R. Y. Biochemistry, mutagenesis, and oligomerization of DsRed, a red fluorescent protein from coral. Proceedings of the National Academy of Sciences 2000, 97, 11984–11989
- De Meulenaere et al. 2013 De Meulenaere, E.; Nguyen Bich, N.; de Wergifosse, M.; Van Hecke, K.; Van Meervelt, L.; Vanderleyden, J.; Champagne, B.; Clays, K. Improving the Second-Order Nonlinear Optical Response of Fluorescent Proteins: The Symmetry Argument. Journal of the American Chemical Society 2013, 135, 4061–4069, PMID: 23406416
- Lu and Chen 2012 Lu, T.; Chen, F. Multiwfn: A multifunctional wavefunction analyzer. Journal of Computational Chemistry 2012, 33, 580–592
- Liu et al. 2020 Liu, Z.; Lu, T.; Chen, Q. An sp-hybridized all-carboatomic ring, cyclo[18]carbon: Bonding character, electron delocalization, and aromaticity. Carbon 2020, 165, 468–475
- Liu et al. 2022 Liu, Z.; Wang, X.; Lu, T.; Yuan, A.; Yan, X. Potential optical molecular switch: Lithium@cyclo[18]carbon complex transforming between two stable configurations. Carbon 2022, 187, 78–85
- 41 Lu, T. Multiwfn Manual, Version 3.8(dev), Section 3.21.8. available at: http://sobereva.com/multiwfn/ . (Accessed 12 April 2023).
- Sasagane et al. 1993 Sasagane, K.; Aiga, F.; Itoh, R. Higher-order response theory based on the quasienergy derivatives: The derivation of the frequency-dependent polarizabilities and hyperpolarizabilities. The Journal of Chemical Physics 1993, 99, 3738–3778
- Tuer et al. 2011 Tuer, A.; Krouglov, S.; Cisek, R.; Tokarz, D.; Barzda, V. Three-dimensional visualization of the first hyperpolarizability tensor. Journal of Computational Chemistry 2011, 32, 1128–1134
- Wang et al. 2022 Wang, X.; Liu, Z.; Yan, X.; Lu, T.; Wang, H.; Xiong, W.; Zhao, M. Photophysical properties and optical nonlinearity of cyclo[18]carbon (C18) precursors, C18–(CO)n (n = 2, 4, and 6): focusing on the effect of the carbonyl groups. Phys. Chem. Chem. Phys. 2022, 24, 7466–7473
- Neese 2012 Neese, F. The ORCA program system. WIREs Computational Molecular Science 2012, 2, 73–78
- Shu et al. 2006 Shu, X.; Shaner, N. C.; Yarbrough, C. A.; Tsien, R. Y.; Remington, S. J. Novel Chromophores and Buried Charges Control Color in mFruits,. Biochemistry 2006, 45, 9639–9647, PMID: 16893165
- Humphrey et al. 1996 Humphrey, W.; Dalke, A.; Schulten, K. VMD: Visual molecular dynamics. Journal of Molecular Graphics 1996, 14, 33–38
- Hanwell et al. 2012 Hanwell, M. D.; Curtis, D. E.; Lonie, D. C.; Vandermeersch, T.; Zurek, E.; Hutchison, G. R. Avogadro: an advanced semantic chemical editor, visualization, and analysis platform. Journal of Cheminformatics 2012, 4, 17
- Olsen and McKenzie 2009 Olsen, S.; McKenzie, R. H. A diabatic three-state representation of photoisomerization in the green fluorescent protein chromophore. The Journal of Chemical Physics 2009, 130, 184302
- List et al. 2022 List, N. H.; Jones, C. M.; Martínez, T. J. Internal conversion of the anionic GFP chromophore: in and out of the I-twisted S1/S0 conical intersection seam. Chem. Sci. 2022, 13, 373–385
- 51 Lu, T. Multiwfn Manual, Version 3.8(dev), Section 3.200.7. available at: http://sobereva.com/multiwfn/ . (Accessed 12 April 2023).
- Brink 1993 Brink, J. Murray, and P. Politzer. J. Chem. Phys 1993, 98, 4305
- Liu et al. 2021 Liu, Z.; Lu, T.; Yuan, A.; Wang, X.; Chen, Q.; Yan, X. Remarkable Size Effect on Photophysical and Nonlinear Optical Properties of All-Carboatomic Rings, Cyclo[18]carbon and Its Analogues. Chemistry – An Asian Journal 2021, 16, 2267–2271
- Hao et al. 2018 Hao, H.; ho Tam, L.; Lu, Y.; Lau, D. An atomistic study on the mechanical behavior of bamboo cell wall constituents. Composites Part B: Engineering 2018, 151, 222–231
- Hilborn 1982 Hilborn, R. C. Einstein coefficients, cross sections, f values, dipole moments, and all that. American Journal of Physics 1982, 50, 982–986
- Roy et al. 2011 Roy, A.; Field, M. J.; Adam, V.; Bourgeois, D. The Nature of Transient Dark States in a Photoactivatable Fluorescent Protein. Journal of the American Chemical Society 2011, 133, 18586–18589, PMID: 22039963
- Adam et al. 2014 Adam, V.; Berardozzi, R.; Byrdin, M.; Bourgeois, D. Phototransformable fluorescent proteins: Future challenges. Current Opinion in Chemical Biology 2014, 20, 92–102, Molecular imaging
- He et al. 2019 He, Y.-Y.; Chen, J.; Zheng, X.-L.; Xu, X.; Li, W.-Q.; Yang, L.; Tian, W. Q. Spiral Graphene Nanoribbons with Azulene Defects as Potential Nonlinear Optical Materials. ACS Applied Nano Materials 2019, 2, 1648–1654
- 59 Lu, T. Multiwfn Manual, Version 3.8(dev), Section 4.200.8.1. available at: http://sobereva.com/multiwfn/ . (Accessed 12 April 2023).
- He et al. 2022 He, H.; Zhou, M.; Qiao, T.; Lai, H. M.; Ran, Q.; Ren, Y.-X.; Ko, H.; Zheng, C.; Tsia, K. K.; Wong, K. K. Y. 890-nm-excited SHG and fluorescence imaging enabled by an all-fiber mode-locked laser. Opt. Lett. 2022, 47, 2710–2713
- Nasu et al. 2021 Nasu, Y.; Shen, Y.; Kramer, L.; Campbell, R. E. Structure- and mechanism-guided design of single fluorescent protein-based biosensors. Nature Chemical Biology 2021, 17, 509–518
- Trachman et al. 2019 Trachman, R. J.; Autour, A.; Jeng, S. C. Y.; Abdolahzadeh, A.; Andreoni, A.; Cojocaru, R.; Garipov, R.; Dolgosheina, E. V.; Knutson, J. R.; Ryckelynck, M.; Unrau, P. J.; Ferré-D’Amaré, A. R. Structure and functional reselection of the Mango-III fluorogenic RNA aptamer. Nature Chemical Biology 2019, 15, 472–479