E Pluribus Unum:
Guidelines on Multi-Objective Evaluation of Recommender Systems
Abstract.
Recommender Systems today are still mostly evaluated in terms of accuracy, with other aspects beyond the immediate relevance of recommendations, such as diversity, long-term user retention and fairness, often taking a back seat. Moreover, reconciling multiple performance perspectives is by definition indeterminate, presenting a stumbling block to those in the pursuit of rounded evaluation of Recommender Systems. EvalRS 2022 — a data challenge designed around Multi-Objective Evaluation — was a first practical endeavour, providing many insights into the requirements and challenges of balancing multiple objectives in evaluation. In this work, we reflect on EvalRS 2022 and expound upon crucial learnings to formulate a first-principles approach toward Multi-Objective model selection, and outline a set of guidelines for carrying out a Multi-Objective Evaluation challenge, with potential applicability to the problem of rounded evaluation of competing models in real-world deployments.
1. Introduction
Recommender Systems (RSs) can be evaluated according to different quality factors, like relevance/accuracy, diversity, novelty, serendipity, coverage, and fairness, among others (Zangerle and Bauer, 2022). However, recommendation accuracy, conceived as immediate item relevance — “Is the user going to watch the recommended movie?” (Bennett and Lanning, 2007) or “Is the user going to buy the suggested product” (Virinchi et al., 2022; Chia et al., 2021) — has been by far the main measure to assess the performance of RSs.
Industry practitioners and academics are becoming increasingly aware that a focus on only accuracy as a performance objective can result in RSs that transfer poorly “in-the-wild”. While improving business metrics, accuracy-oriented systems have been shown to have unintended, yet profound, social ramifications (Techcrunch, 2021; Geyik et al., 2019; Raj and Ekstrand, 2022; Smith et al., 2022) such as inciting social divisiveness (Wallstret Journal, 2020) or spreading misinformation (McCrosky and Geurkink, 2021). This behavioural gap calls for a re-assessment of how we evaluate RSs, shifting from a narrow focus on singular accuracy metrics to a more rounded evaluation methodology that considers a wider range of metrics.
Numerous works have introduced new RS quality measures (Zangerle and Bauer, 2022), such as fairness, diversity, and serendipity, of which, some have even been used in research focusing on multi-objective training of RSs (Lin et al., 2019), e.g., optimizing for both accuracy and diversity (Adomavicius and Kwon, 2011). Be that as it may, relatively little effort has been put into designing and operationalizing multi-objective evaluation, i.e., ranking models in light of multiple quality metrics, in part due to factors such as the indeterminate nature of aggregating multiple metrics, difficulty in modeling the relationship between them, and combinatorial explosion. For example, given an accuracy metric such as Normalized Discounted Cumulative Gain (NDCG) and a fairness metric such Popularity Bias (PB), it is not known a priori whether they are correlated, what the relationship (e.g., linear, exponential, quadratic) between them is, or how they should be combined (e.g., a weighted sum, ratio). Moreover, the problem quickly becomes more difficult when more metrics are considered.
In this paper, we reflect on our experience of organizing EvalRS 2022 (Tagliabue et al., 2022), a first-of-its-kind data challenge that focused on the rounded evaluation111“Rounded evaluation” was the original description of EvalRS, while “multi-objective evaluation” is a more formal framing for the challenges we tackle in this paper: we will use both phrases interchangeably, as there is no risk of confusion. of RSs, hosted at the CIKM 2022 AnalytiCup, and draw upon it to introduce a first-principles approach toward multi-objective evaluation. We provide a holistic analysis of the challenge, encompassing our past experience and motivations, present reflections, and future possibilities. While the motivation for this work comes directly from a data challenge, we believe many of our learnings may generalize to the real-world, and have broad applicability in deployment scenarios when competing models needs to be evaluated. Section 2 provides some background on multi-objective evaluation. Then, in Section 3, we review our past experience provided by EvalRS 2022. Next, in Section 4, we reflect on the shortcomings and limitations of EvalRS 2022, where we propose, describe, and implement a more principled approach toward evaluating models in light of multiple metrics. Lastly, in Section 5, we summarize our findings into guidelines for future challenges.
2. Background
In this section, we will introduce the formalism and main components that are required to understand our work, and to situate our contributions in the appropriate context.
2.1. Beyond-Accuracy Metrics
Standard evaluation of RS tend to revolve around accuracy, i.e., how well a system’s recommendations match implicit or explicit user feedback. Recent advances have focused instead on novel quality characteristics, such as diversity (dissimilarity of recommendations under certain criteria) or coverage (the number of items a system can or will recommend), serendipity, novelty, fairness across users or groups, and more (see Table 5 in (Zangerle and Bauer, 2022)). We refer to such metrics as beyond-accuracy metrics.
A key focus of EvalRS 2022 was group fairness. One practical way of measuring group fairness is by choosing a utility function and measuring how it varies across subgroups (e.g., demographics (Dixon et al., 2018)). Miss-Rate Equality Difference (MRED) (Tagliabue et al., 2022) requires computing the miss-rate () for each group of interest and measuring how far it deviates from the global miss-rate:
| (1) |
Where is defined as the MR computed on the entire test set, is defined as the MR computed on a group , and is a partitioning of the data into groups under a given criterion (e.g., partitioning by Country).
2.2. Multi-Objective Evaluation
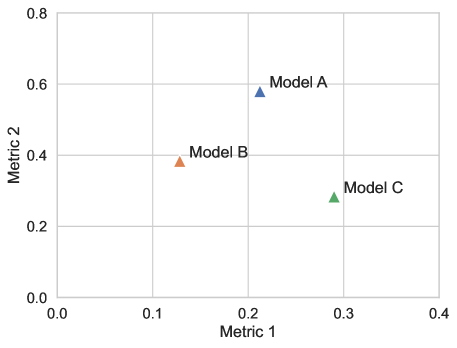
Multi-Objective Evaluation refers to the process of ranking models based on two or more metrics/objectives, in order to select the “best” performing model. Considering the simplest multi-objective case of two dimensions in Fig. 1, whereby the goal is to maximize both Metric 1 and Metric 2, we see that while it is clear that Model A is better than Model B, it is not immediately clear whether Model A is better than Model C. Borrowing from the literature of Multi-Objective Optimization (Ehrgott, 2000), we can say that Model A pareto-dominates Model B, while Model A and Model C are pareto-noncomparable. In fact, the space of nondominated models, which is a subset of noncomparable models, grows exponentially with the number of dimensions involved (Allmendinger et al., 2022). As such, without making any further assumptions, when multiple objectives are in consideration there is no well defined meaning of a “best” model, i.e., pareto-nomcomparable models are equally “good”.
Rounded evaluation thus requires one to devise a scoring function which takes in metrics from a Model and returns a single score which can be used for model ranking and selection. It is worth noting that while prima facie this might have a similar appearance as a single-objective metric, the underlying mechanism is multi-faceted and hence different: how is defined will ultimately determine its utility in rounded evaluation – the goal is not simply to “come up with a single number” 222Or, we could have just pick the scoring function , and obtain a single-dimensional metric we are familiar with., but to pick a number that conveys a (for the lack of a better word) rounded view of model behavior. Careful thought must therefore be put into the various design decisions that go into the construction of .
2.3. Multi-Objective Evaluation vs. Multi-Objective Optimization
The interplay between multi-objective optimization and multi-objective evaluation is subtle. On the one hand, multi-objective optimization is concerned with searching for models which perform well under a set of objectives, where common challenges involve, but are not limited to, operationalizing multiple metrics as optimizable objectives (e.g. differentiable), handling non-convex objectives, and finding solutions (models) that are pareto optimal. On the other hand, multi-objective evaluation deals with the ranking of a given set of models when multiple measures of performance are involved, i.e., “how do we make sense of multiple metrics and ultimately select the best candidate?”. While both appear to deal with some form of model selection in the context of many objectives, multi-objective evaluation often takes things a step further: multi-objective optimization is generally interested in finding a set of models which are optimal in the pareto-optimal sense, whereas, multi-objective evaluation is interested in picking a single model based on certain assumptions (e.g. accuracy is more important that fairness). That being said, the interdependence of both perspectives is undeniable, too, and techniques and ideas from the multi-objective optimization domain often have analogs and can offer insight into multi-objective evaluation.
3. The Past: EvalRS 2022, Multi-Objective Evaluation in Practice
In light of the current limitations in accuracy-centric testing, we organized EvalRS 2022 as a first-of-its-kind data challenge to foster discussion and innovation around rounded evaluation for RSs, with the aim of bridging the gap between offline evaluation and performance “in the wild” (Tagliabue et al., 2023). In this section, we introduce the key components of EvalRS 2022 333EvalRS 2022, the first edition of the challenge and workshop, counted more than 150 participants, divided into 50 teams from 14 countries, distributed across industry and academia. Please find more details at https://github.com/RecList/evalRS-CIKM-2022. and several core guiding principles and learnings from our first attempt at a practical implementation of multi-objective evaluation.
3.1. Challenge Overview
EvalRS 2022 presented participants with a classical user-item recommendation task in the music domain: the goal is to recommend each user an appropriate song given their listening history and a catalog of target items. For the task, we utilized LFM-1b (Schedl, 2016), a large-scale dataset with information on music consumption on Last.fm and performed preprocessing (summary statistics of the final dataset in Table 1) such that it was accessible to, and amenable for, a wide range of participants and compute environments.
| Items | Value |
|---|---|
| Users | |
| Artists | |
| Albums | |
| Tracks | |
| Listening Events | |
| User-Track History Length (25/50/75 pct) |
3.2. Initial Guidelines
We designed EvalRS 2022 around an initial set of guiding principles: we share those guidelines and the reasoning behind them and highlight the strengths and weaknesses of our original design, which motivated this follow-up contribution.
3.2.1. Adopt Diverse Evaluation Metrics.
Our primary goal of EvalRS 2022 was to promote the development of models that balance between standard operating requirements, e.g., retrieval accuracy, and more uncommon (yet important) ones, e.g., being fair across subgroups or demonstrating robustness in recommendation. Therefore, following (Chia et al., 2022), we proposed to evaluate models against a comprehensive “reclist” which included both accuracy and beyond-accuracy metrics. Specifically, on top of the usual retrieval metrics such as Hit-Rate (HR) and Mean Reciprocal Ranking (MRR), we introduced beyond-accuracy metrics in the form of behavioral and fairness tests.
Behavioral tests included a “being-less-wrong” (Chia et al., 2022) test — measuring whether a wrong recommendation remains relevant (e.g., if it has the same genre of the goal recommendation) — and diversity. Both tests leveraged a latent space of tracks learnt from historical user activity data.
The fairness tests were focused on group fairness: using Miss Rate (MR) as the utility metric, we tested for utility equality across groups with MRED (Tagliabue et al., 2022). We extracted groups by slicing across gender, country, listening activity, and track popularity and artist popularity.
Additionally, as part of the EvalRS challenge, we asked participants to come up with a novel beyond-accuracy metric to encourage new evaluation perspectives.
3.2.2. Rigorous Evaluation Protocol
The reproducibility crisis in RS research and evaluation is a known problem (Ferrari Dacrema et al., 2021; Dacrema et al., 2019; Sun et al., 2020). Following the recommendations of Schnabel (2022), we thus adopted Bootstrapped Nested Cross Validation (BNCV) as the evaluation protocol of EvalRS 2022. The protocol performs takes a learning algorithm (i.e., a procedure that trains and returns a recommendation model) and performs iterations of training and evaluation on random samples (with replacement) of the entire dataset. Sampling was conducted by stratifying on users. The model is then assigned its average performance, per-metric, across iterations.
BNCV fulfilled two practical needs. From the perspective of a data challenge, evaluation across multiple folds of the data prevents participants from overfitting on the dataset444LFM-1b is a publicly available dataset. A single train/test split approach would too easily allow for test set leaking.. From a model evaluation perspective, it minimizes the chance of “false discoveries,” i.e., performance gains simply due to a lucky split, thereby increasing the overall reliability of our evaluation approach.
3.2.3. A Two-staged Evaluation
Recent evidence has shown that recommendation quality measures such as diversity or fairness either compete with or favor accuracy differently (Jannach, 2022). However, such relationships are not generally known in advance, especially in the context of a data challenge. We thus proposed a two-stage evaluation, each with different leaderboards and scoring strategies, allowing us to leverage submissions from the former stage to make a more informed model score in the latter. In each stage, we summarize all tests into a single scalar score.
During the first stage, the scores from each individual test were simply averaged; here, tests have equal importance. While getting participants acquainted, this stage has the crucial goal of gathering data on the relative difficulty of tests – the average itself does not matter: participants have granular access to single test results to build intuition on what the model does well (or not), and they are actively discouraged from “interpreting” the aggregate score. At the end of this phase, we might notice, for example, a test where, overall, models underperformed relative to other tests (e.g., MRED on Gender vs. MRED on other groups). We would hence assume it to be hard under the current challenge setup.
Leveraging data collected from stage one, the second stage applied a different scoring mechanism. Here, we apply a weighted average where each test contribution is given by how a submission placed compared to lower and upper baselines. For a given metric , each score was hence transformed as:
| (2) |
where is the score for metric , is the score for of a baseline we provided, and is the score for of the best stage one submission.
As such, each metric is recalculated based on how much it out performs the baseline () relative to how much the best submission out performs the baseline (), thereby normalizing scores across metrics. After the normalization, we used a weighted mean to compute the final score, giving slightly more weight to fairness and behavioral categories over accuracy. See Tagliabue et al. (2022) for further details.
Despite our best efforts at designing a fair model scoring methodology, we believe this to be the key weakness of EvalRS 2022, and that in retrospect, the normalization procedure used could be improved significantly. In particular, we observed that (1) the normalization procedure only utilizes information from the baseline and best model and (2) it hinges upon our choice of best model and baseline, with an overall result of confounding metric aggregation and metric importance weighting. In Section 4, we introduce a more principled approach toward model scoring that takes full advantage of the data collected in the first stage.
3.2.4. Accessible Evaluation APIs
We believe that the theoretical discussion on multi-objective evaluation should come along with an easy-to-access, reproducible, and extensible programmatic evaluation API. Bringing together the above guidelines and principles, we released, as part of EvalRS 2022, open-source training and evaluation code along with resources (e.g., tutorials, blogs, notebooks) and strong baselines. Our evaluation framework builds around RecList (Chia et al., 2022), an open-source Python library to automate behavioral testing of RSs. We implemented as well, the score normalization and Bootstrapped Cross-Validation procedures described above into a single abstraction. As a result, participants needed only to provide code for model training. Since everything is available as open source code and the evaluation can be performed locally without any organization or server available, EvalRS 2022 dataset and tests will remain a forever accessible benchmark to test models on, even long after the initial competition ended.
3.3. Best Contributions to EvalRS 2022
The participating teams of EvalRS developed original and effective systems. Here, we highlight the best solution proposed by the winning team and the best beyond-accuracy metric introduced.
3.3.1. Best Solution
Park et al. (2022) proposed an ensemble between Variational Auto-Encoders (VAEs) and Bayesian Personalized Ranking Matrix Factorization. The proposed VAE architecture is structured following an Item-oriented formulation (rather than the most typical User-oriented VAE formulation). The authors noted that Item-oriented VAEs tend to recommend less popular items. Further, they introduced a fairness regularization term in the loss, following Borges and Stefanidis (2022). However, the authors observed that while Item-VAEs, had better fairness across item popularity, it suffered in performance in the “being less wrong” test.
3.3.2. Best Test
The Variance Agreement test introduced in Giobergia (2022) was selected as the best test. This metric measures how well the diversity in a recommendation matches the user’s tendency to prefer diverse items (i.e. a certain user may listen mostly to a single genre of music, whereas another might prefer a broader range of genres). The author computes the diversity using the Gini impurity coefficient. Notably, the test applies to any user preference: in the challenge, the authors tested diversity in terms of different artists recommended.
4. The Present: How to Perform a Rounded Evaluation
The main weakness of EvalRS 2022 was in its scoring methodology. We, therefore, propose a more principled approach toward rounded evaluation, one that is derived from first principles and one which draws upon the challenges and experiences we faced when organizing the first edition of EvalRS.
We begin by illustrating why rounded evaluation is difficult, then we propose how one can systematically reason about the problem, and offer a possible solution. Lastly, we demonstrate the merits of our newly proposed evaluation approach and provide further intuition by comparing it with the methodology used in EvalRS 2022.
4.1. The Challenge of Rounded Evaluation
As remarked in §2.2, multiple metrics make models comparable across interesting dimensions, at the cost of making it harder to pick the best model.
Our initial scoring approach for the data challenge was a linear combination of various metrics (§3.2.1), whereby the corresponding weights per metric were chosen on the basis of our experience and from the data obtained from the first stage of the challenge. Distilling our learnings, we identify two key properties/capabilities which a good scoring function should possess:
-
(1)
Metric Importance (P1): Given the non-determinism of model selection in the multi-objective setting, practitioners must make operational decisions regarding metric importance (e.g. Accuracy is 2x more important than Fairness). An ideal scoring function should thus allow the relative importance of each metric to be specified precisely.
-
(2)
Scalability (P2): If we desire to accurately estimate the true Pareto Frontier in , it would thus require data points (§2.2). An ideal scoring function should thus be scalable with respect to the number of metrics involved, i.e., it should not require an unreasonable magnitude of data (e.g. exponential) in order to give reasonable results.
While the approach used in §3.2.1 respected P2, it struggled with P1. In particular, it confounded metric aggregation and metric importance: since different metrics do not measure the same quantities and might not have the same scale and distribution, they should not be directly compared. For example, Hit-Rate measures retrieval accuracy and its values might fall into the range ( whereas MRED is a measure of fairness and its values might fall in the range (. It is not immediately obvious what the appropriate scaling factor is, if it is even linear, and whether a summation of both terms can be interpreted meaningfully. Our scoring approach in EvalRS falls short as it did not clearly distinguish incommensurability and importance, resulting in a less than optimal weighting scheme (see §4.3).
4.2. Rebooting EvalRS 2022: Evaluating new approaches through back-testing
Considering the properties of an ideal scoring function, we propose a more principled approach toward model selection in the paradigm of rounded evaluation. While multi-objective model selection cannot have a determinate, single answer, we put forward a motivated and systematic approach to satisfy our desiderata. Our main insight is that only by first tackling the problem of incommensurability, can we then appropriately address P1. Our proposed approach hinges on this, and learns the optimal-trade off between pairs of metrics based on available data to maintain an complexity (P2).
4.2.1. Definitions
We introduce notation here, which will be expanded upon in subsequent sections. Let be a set of metrics used to assess a model , and let be a base metric used as a base unit. Subsequently, let be a function that for a given metric value of , returns the value of an optimal model should have.
4.2.2. Design Choices
-
(1)
Base Metric (): We select Hit Rate as given that model accuracy, though imperfect, is strongly correlated with model performance. This provides a common and familiar unit to reason about performance. In addition, we believe there is a priority on being accurate first, at least to some degree, before considering other performance metrics.
-
(2)
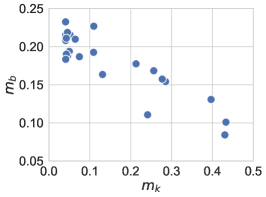
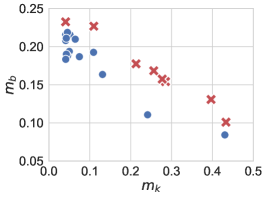
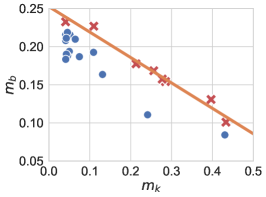
Optimal Trade-off Function (): We obtain by learning it from data555We assume here that the relationship between and is unknown or merely anecdotal. If the true functional relationship between and is known, then it is preferred over estimating with data.. Referring to Fig. 2, given multiple data points , obtained either via simulation — e.g., by learning a family of models across different objective weighting schemes (Dosovitskiy and Djolonga, 2020) — or leaderboard submissions, we first extract the Pareto non-dominated points (tommyod, 2020) from the set of data points. Then, we fit a curve to said Pareto non-dominated points in order to obtain the best-guess666It is not know whether our data contains the true Pareto Optimal points optimal trade-off between and . The choice of function to perform the curve fit is a design choice and for the rest of this section we restrict ourselves to a linear relationship.
-
(3)
Scoring Function (): We define the scoring function as follows,
(3) Qualitatively, we convert metric into the units of via and subsequently, given an importance ratio , we obtain the performance differential , which represents whether the current model M in consideration is underperforming () , over performing () or at parity () with respect to its expected optimal performance given and importance weight . Finally, we take a summation of for each given pair to obtain a single score.
4.3. Analysis and Interpretation
We provide further intuition behind our proposed scoring method by making an analytical comparison with the scoring method used in EvalRS 2022, which reveals critical insights about the underlying mechanism of our new approach.
4.3.1. Analytical Comparison
Given the linearity assumptions between and , we can make an analytical comparison between our original scoring approach, henceforth , and the proposed approach, . As we will see, both are essentially linear transformations of their inputs (i.e. ), with the difference lying in how their coefficients are derived. We can therefore rewrite the former scoring approach into the same form as the latter to compare said coefficients. For the sake of analysis, we restrict ourselves to two dimensions, i.e., we focus on Hit Rate and MRED (User Activity) and drop unnecessary notation.
In the proposed approach, the scoring function can be written as,
Where and are the coefficient and intercept recovered from linear regression, is the importance ratio between and . Similarly, the scoring function from EvalRS 2022 (see Eqn. 2) can be re-written as,
If we let and then,
Comparing coefficients, we see that,
| (4) |
and 777Note that we can discard for the sake of rank analysis as it only impacts absolute score and not relative score.. By reintroducing and terms, we obtain,
which in itself has the canonical form of a gradient/slope between two points in , with scaling factors. In other words, the original scoring mechanism attempts to estimate the gradient of the optimal trade-off curve using and , i.e., the “best model” in the data and a baseline model both determined by us. In addition, the ratio can be interpreted as our ratio . The negation comes from the fact that our proposed scoring approach takes a differential between the two metrics rather summation.
4.3.2. Interpretation
We compare the coefficients obtained in our proposed approach with the ones used during the data challenge. Given that there are two degrees of freedom, and , we fix to allow for an unbiased interpretation of 888 and cancel each other when ..
The first major difference is the negation term on the RHS of Eqn. 4, highlighting that the original scoring mechanism did not respect the principles of Pareto Optimality, i.e., assuming equal metric importance, models which lie on the Pareto Optimal front will not be assigned an equal score.
We now compare the gradient obtained via normalization, , and regression, . The value of used (implicitly) during EvalRS is given as whereas the we obtain is . Ignoring magnitude differences, a difference in sign implies that the models used to estimate did not reflect the competing nature of the two metrics involved. We observe a similar trend in other ¡Hit Rate, MRED¿ pairs. Incidentally, this negated the sign error we highlighted in Eqn. 4, allowing us to estimate999Given the differences in the scoring mechanism, and constraints imposed by the proposed one, an exact one-to-one comparison is not possible. and compare the metric importance implied during EvalRS 2022 — we find that compared to what the data says, MRED (User Activity) was effectively given x more importance than Hit Rate, much more than we had intended.
Drawing from the link between the old and the new, the proposed approach can thus be seen as a form of data-driven, optimal trade-off, normalization with knobs for controlling metric importance — a consequence of (1) converting metrics into a single base metric and (2) learning the optimal trade-off function from data. As compared to , our approach more faithfully respects the relationship between metrics, evident in how we approximate the gradient using multiple data points as opposed to , which effectively utilizes only two points: the current “best” model and a baseline, which introduces significant noise due to human choice. It also more faithfully respects the principles of Pareto Optimality when considering a pair of metrics: if we assign equal importance to a pair of metrics (), our approach assigns approximately101010Noise is introduced by regression. equal scores to models that adhere to the optimal trade-off, something which does not guarantee. As a result, we are able to introduce importance weights that more accurately encode the trade-off we desire. Collectively, our proposed scoring approach provides a more systematic lens toward scoring in the rounded evaluation paradigm.
4.4. EvalRS Post-Mortem
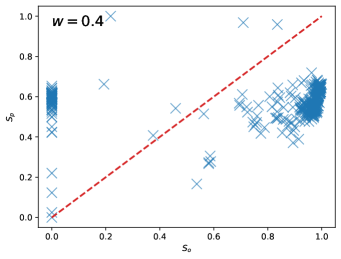
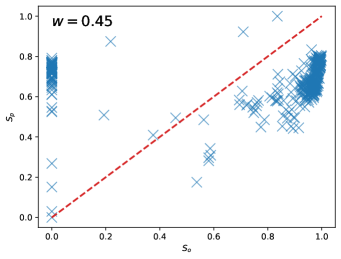
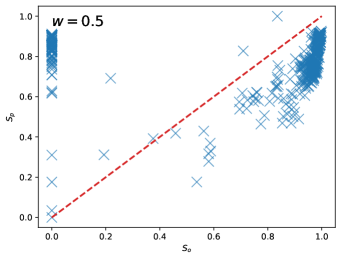
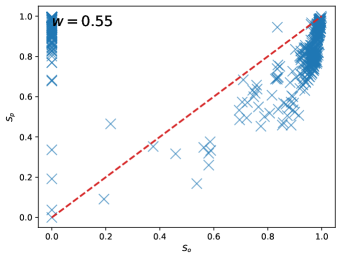
Circling back to where we began, we apply our proposed approach to the competition data obtained from EvalRS 2022, allowing us to better understand how submissions were ranked during the challenge, whilst elucidating the merits of our proposed approach. Our analysis refers to Fig. 3 which visualizes against , normalized to a range of , for various settings of , whereby is uniform for all . Note that models assigned were due to a minimum Hit Rate threshold requirement as part of the scoring.
Setting , i.e., giving accuracy and fairness equal importance, our first observation is that the EvalRS scoring was effectively giving more weight to fairness than toward accuracy. This is evident in how most of the EvalRS scores sit below the line (red, dashed). We observe even greater correlation as is increased to (bottom right) and beyond (not shown).
We also observe that many of the models assigned a score of are given are high ranking in . Indeed, one of the motivations when assigning a minimum threshold was to avoid assigning high scores to models that had too low an accuracy111111It is easier to score in fairness with low accuracy.. While this may have worked practically for EvalRS, we argue that such an approach promotes an unintentional “gaming” of the leaderboard — many submissions had a Hit-Rate which were slightly above the minimum threshold (Median Hit-Rate = 0.0175) which, in hindsight, restricted the spirit of the challenge.
We believe that our newly proposed approach can offer some resilience towards “gaming”, and be especially helpful for future events: by updating iteratively with each new submission, the notion of optimal is constantly updated rather being chosen a priori. This incentivizes competition, and circumvents a common pitfall in evaluation as summarized by Goodhart’s law — “When a measure becomes a target, it ceases to be a good measure”.
5. The Future: Guidelines for Future Challenges
We illustrate in this section our set of minimal guidelines that we believe can make up for a successful holistic evaluation of recommender systems and challenges. We divide the guidelines in two: the first part is a more general guideline on the organization of the challenges while the second part are suggestions on how to design a scoring mechanism .
5.1. Guideline: Competition Structure
5.1.1. Dataset
With ever increasing modelling capabilities (Brown et al., 2020; Chowdhery et al., 2022) and growing sizes of datasets (Zheng et al., 2022), the compute requirements to participate in data challenges has risen accordingly, with the problem further exacerbated when multiple objectives are in concern. By preparing a smaller yet signal-dense dataset, the data challenge is made more accessible, encouraging contributions from participants of varying backgrounds. Another critical requirement for running an multi-objective evaluation data challenge is rich metadata, which enables slicing of data into interesting facets, and may unlock more in-depth evaluation approaches — e.g., given song lyrics, we could assess song similarity in another way.
5.1.2. Evaluation Metrics
Beyond the obvious contenders for accuracy metrics (Hit-Rate, MRR, NDCG), and beyond-accuracy metrics (diversity, serendipity, population bias, fairness), we believe that further innovation into beyond-accuracy metrics is critical to the adoption and utility of multi-objective evaluation. As a starting point, “being less wrong”(Chia et al., 2022) metrics introduced in EvalRS is fertile ground upon which more innovative metrics can be developed – for example, Large Language Models could be used to elicit “similarity judgements” (Rosenbaum et al., 2022) to complement the representational approach. EvalRS also highlighted that improved formulations of classical metrics, such as fairness (Wang and Joachims, 2021), are also opportunities for improvement.
5.1.3. Evaluation Structure
A successful challenge depends also on dealing with practical considerations:
-
(1)
Prevent Leaderboard Hacking: It is important to find ways to prevent users to game the challenge (e.g. with a single test set, estimating test parameters may be feasible). Bootstrapped cross-validation methodologies makes it harder to game the leaderboard and allow to also report standard deviation over the results.
-
(2)
Evaluation Platform: We suggest the adoption of an open source tool, such as RecList (Chia et al., 2022), in such a way that progress can be easily made public and that the challenge can be replicated in the future. Moreover, participants can evaluate their models offline (long after the event is concluded) without the need to get third-party access to an external platform.
5.2. Guideline: Scoring Methodology
We conclude by providing guidelines on how to best use our approach, and which choices are left to be made.
5.2.1. Base Metric
As the base metric we suggest an accuracy-based metric (e.g. Hit Rate), since we believe that accuracy is easy to understand and still a very important component (even if not the only one).
5.2.2. Optimal Trade-Off Function
The choice of the family of functions that are used to learn the optimal trade-off function from the data is critical to the success of this approach and will depend on the relationship between the metrics observed after Phase 1 or based on expert knowledge.
5.2.3. Estimation from Data
The two-stage approach championed by EvalRS 2022 is an effective paradigm: easy to understand by practitioners, and convenient to collect the data we need to estimate the optimal trade-off between metrics. After the end of Phase 1, the data can be used for the initial estimation, and be updated with newer submissions from Phase 2.
5.2.4. Weighting Scheme
While algorithmic approaches can inform this decision this choice is ultimately an operational decision and should reflect the objectives of the challenge. We believe this to be an important consequence of our formulation; indeed, a strength of our proposal is the clean separation between what should be left to the human and what should be inferred from the data.
6. Conclusion
In order to develop recommender systems with more predictable “in-the-wild” performance, it is necessary to evaluate models with measures other than accuracy; that is, beyond-accuracy measures must become defaults in the modern-day evaluation toolkit. EvalRS 2022 was our first attempt at fostering awareness of the rounded evaluation of recommender systems. It introduced practical and reusable code for the community. We leverage the experience we garnered from our unique data challenge to further refine definitions and requirements for multi-objective evaluation and to formulate a principled framework and a set of guidelines for performing multi-objective evaluation.
As we prepare the second edition of EvalRS, we released the dataset and the code used to prepare this contribution 121212Available at https://github.com/RecList/e-pluribus-unum-evalrs-2022, hoping to benefit not just other organizers, but the recommender system community at large. In particular, even if data challenges are rarely completely representative of real-world deployments, we do believe industry practitioners are eager to incorporate more rounded evaluation in their pipelines (Editors, 2023): when they do, they will indeed face the problem of selecting which architecture, among many, should be promoted to production. While hardly the last word on the topic, we hope these reflections will help them take the first few steps more firmly.
Limitations
The contributions we have presented in this work come with some limitations. First of all, we make linear assumptions when defining a scoring function, this can strongly affect how models behave if relations between the metrics are non-linear. In addition, since we perform pairwise comparisons between the base metric and other metrics, we do not model the effects between the non-accuracy metrics. This also means that our approach may not fully respect pareto optimality beyond two dimensions (it is worth noting that this is a design choice to combat combinatorial explosion, but is still a limitation).
Our proposed guidelines for challenges come with some inherent limitations. We assume, for example, that all challenges can be split into two phases, and this might not be true for fast-paced challenges. In addition to this, we assume the test data is freely available to participants; while we used bootstrapping to reduce the possibility of test-set leakage/leaderboard hacking, this cannot completely mitigate the issue, and many organizers might prefer not to share the test set.
Acknowledgements.
FB is supported by the Hoffman–Yee Research Grants Program and the Stanford Institute for Human-Centered Artificial Intelligence. GA is supported by Fondazione Cariplo (grant No. 2020-4288, MONICA). We wish to thank Dietmar Jannach for helpful comments on a previous draft of this paper. We wish to also thank all the participants of EvalRS 2022 – starting from Tobias Schnabel –, and the organizers of CIKM – starting from Surya Kallumadi – for providing a fantastic venue and great support: this work would have been impossible without such a successful event. No manager and no Italian bureaucrat were harmed in the course of running our experiments.References
- (1)
- Adomavicius and Kwon (2011) Gediminas Adomavicius and YoungOk Kwon. 2011. Improving aggregate recommendation diversity using ranking-based techniques. IEEE Transactions on Knowledge and Data Engineering 24, 5 (2011), 896–911.
- Allmendinger et al. (2022) Richard Allmendinger, Andrzej Jaszkiewicz, Arnaud Liefooghe, and Christiane Tammer. 2022. What if we increase the number of objectives? Theoretical and empirical implications for many-objective combinatorial optimization. Computers & Operations Research 145 (2022), 105857. https://doi.org/10.1016/j.cor.2022.105857
- Bennett and Lanning (2007) J. Bennett and S. Lanning. 2007. The Netflix Prize. In Proceedings of the KDD Cup Workshop 2007. ACM, New York, 3–6. http://www.cs.uic.edu/~liub/KDD-cup-2007/NetflixPrize-description.pdf
- Borges and Stefanidis (2022) Rodrigo Borges and Kostas Stefanidis. 2022. F2VAE: a framework for mitigating user unfairness in recommendation systems. In Proceedings of the 37th ACM/SIGAPP Symposium on Applied Computing. 1391–1398.
- Brown et al. (2020) Tom Brown, Benjamin Mann, Nick Ryder, Melanie Subbiah, Jared D Kaplan, Prafulla Dhariwal, Arvind Neelakantan, Pranav Shyam, Girish Sastry, Amanda Askell, Sandhini Agarwal, Ariel Herbert-Voss, Gretchen Krueger, Tom Henighan, Rewon Child, Aditya Ramesh, Daniel Ziegler, Jeffrey Wu, Clemens Winter, Chris Hesse, Mark Chen, Eric Sigler, Mateusz Litwin, Scott Gray, Benjamin Chess, Jack Clark, Christopher Berner, Sam McCandlish, Alec Radford, Ilya Sutskever, and Dario Amodei. 2020. Language Models are Few-Shot Learners. In Advances in Neural Information Processing Systems, H. Larochelle, M. Ranzato, R. Hadsell, M.F. Balcan, and H. Lin (Eds.), Vol. 33. Curran Associates, Inc., 1877–1901. https://proceedings.neurips.cc/paper/2020/file/1457c0d6bfcb4967418bfb8ac142f64a-Paper.pdf
- Chia et al. (2022) Patrick John Chia, Jacopo Tagliabue, Federico Bianchi, Chloe He, and Brian Ko. 2022. Beyond NDCG: Behavioral Testing of Recommender Systems with RecList. In Companion of The Web Conference 2022, Virtual Event / Lyon, France, April 25 - 29, 2022, Frédérique Laforest, Raphaël Troncy, Elena Simperl, Deepak Agarwal, Aristides Gionis, Ivan Herman, and Lionel Médini (Eds.). ACM, 99–104. https://doi.org/10.1145/3487553.3524215
- Chia et al. (2021) Patrick John Chia, Bingqin Yu, and Jacopo Tagliabue. 2021. Are you sure?: Preliminary Insights from Scaling Product Comparisons to Multiple Shops. In SIGIR eCom 2021.
- Chowdhery et al. (2022) Aakanksha Chowdhery, Sharan Narang, Jacob Devlin, Maarten Bosma, Gaurav Mishra, Adam Roberts, Paul Barham, Hyung Won Chung, Charles Sutton, Sebastian Gehrmann, Parker Schuh, Kensen Shi, Sasha Tsvyashchenko, Joshua Maynez, Abhishek Rao, Parker Barnes, Yi Tay, Noam M. Shazeer, Vinodkumar Prabhakaran, Emily Reif, Nan Du, Benton C. Hutchinson, Reiner Pope, James Bradbury, Jacob Austin, Michael Isard, Guy Gur-Ari, Pengcheng Yin, Toju Duke, Anselm Levskaya, Sanjay Ghemawat, Sunipa Dev, Henryk Michalewski, Xavier García, Vedant Misra, Kevin Robinson, Liam Fedus, Denny Zhou, Daphne Ippolito, David Luan, Hyeontaek Lim, Barret Zoph, Alexander Spiridonov, Ryan Sepassi, David Dohan, Shivani Agrawal, Mark Omernick, Andrew M. Dai, Thanumalayan Sankaranarayana Pillai, Marie Pellat, Aitor Lewkowycz, Erica Oliveira Moreira, Rewon Child, Oleksandr Polozov, Katherine Lee, Zongwei Zhou, Xuezhi Wang, Brennan Saeta, Mark Diaz, Orhan Firat, Michele Catasta, Jason Wei, Kathleen S. Meier-Hellstern, Douglas Eck, Jeff Dean, Slav Petrov, and Noah Fiedel. 2022. PaLM: Scaling Language Modeling with Pathways.
- Dacrema et al. (2019) Maurizio Ferrari Dacrema, Paolo Cremonesi, and Dietmar Jannach. 2019. Are We Really Making Much Progress? A Worrying Analysis of Recent Neural Recommendation Approaches. In Proceedings of the 13th ACM Conference on Recommender Systems (Copenhagen, Denmark) (RecSys ’19). Association for Computing Machinery, New York, NY, USA, 101–109. https://doi.org/10.1145/3298689.3347058
- Dixon et al. (2018) Lucas Dixon, John Li, Jeffrey Sorensen, Nithum Thain, and Lucy Vasserman. 2018. Measuring and mitigating unintended bias in text classification. In Proceedings of the 2018 AAAI/ACM Conference on AI, Ethics, and Society. 67–73.
- Dosovitskiy and Djolonga (2020) Alexey Dosovitskiy and Josip Djolonga. 2020. You Only Train Once: Loss-Conditional Training of Deep Networks. In International Conference on Learning Representations. https://openreview.net/forum?id=HyxY6JHKwr
- Editors (2023) Editors. 2023. Algorithmic recommendations, anyone? Nature Machine Intelligence (2023). https://doi.org/10.1038/s42256-023-00631-7
- Ehrgott (2000) Matthias Ehrgott. 2000. Multicriteria optimization. Lecture Notes in Economics and Mathematical Systems (2000). https://doi.org/10.1007/978-3-662-22199-0
- Ferrari Dacrema et al. (2021) Maurizio Ferrari Dacrema, Simone Boglio, Paolo Cremonesi, and Dietmar Jannach. 2021. A Troubling Analysis of Reproducibility and Progress in Recommender Systems Research. ACM Trans. Inf. Syst. 39, 2, Article 20 (jan 2021), 49 pages. https://doi.org/10.1145/3434185
- Geyik et al. (2019) Sahin Cem Geyik, Stuart Ambler, and Krishnaram Kenthapadi. 2019. Fairness-Aware Ranking in Search & Recommendation Systems with Application to LinkedIn Talent Search. In Proceedings of the 25th ACM SIGKDD International Conference on Knowledge Discovery & Data Mining (Anchorage, AK, USA) (KDD ’19). Association for Computing Machinery, New York, NY, USA, 2221–2231. https://doi.org/10.1145/3292500.3330691
- Giobergia (2022) Flavio Giobergia. 2022. Triplet Losses-based Matrix Factorization for Robust Recommendations. arXiv preprint arXiv:2210.12098 (2022).
- Jannach (2022) Dietmar Jannach. 2022. Multi-Objective Recommender Systems: Survey and Challenges. arXiv preprint arXiv:2210.10309 (2022).
- Lin et al. (2019) Xiao Lin, Hongjie Chen, Changhua Pei, Fei Sun, Xuanji Xiao, Hanxiao Sun, Yongfeng Zhang, Wenwu Ou, and Peng Jiang. 2019. A Pareto-Efficient Algorithm for Multiple Objective Optimization in e-Commerce Recommendation. In Proceedings of the 13th ACM Conference on Recommender Systems (Copenhagen, Denmark) (RecSys ’19). Association for Computing Machinery, New York, NY, USA, 20–28. https://doi.org/10.1145/3298689.3346998
- McCrosky and Geurkink (2021) Jesse McCrosky and Brandi Geurkink. 2021. YouTube Regrets; A crowdsourced investigation into YouTube’s recommendation algorithm. https://assets.mofoprod.net/network/documents/Mozilla_YouTube_Regrets_Report.pdf
- Park et al. (2022) Jinhyeok Park, Dain Kim, and Dongwoo Kim. 2022. Item-based Variational Auto-encoder for Fair Music Recommendation. arXiv preprint arXiv:2211.01333 (2022).
- Raj and Ekstrand (2022) Amifa Raj and Michael D Ekstrand. 2022. Fire Dragon and Unicorn Princess; Gender Stereotypes and Children’s Products in Search Engine Responses. arXiv preprint arXiv:2206.13747 (2022).
- Rosenbaum et al. (2022) Andy Rosenbaum, Saleh Soltan, Wael Hamza, Amir Saffari, Marco Damonte, and Isabel Groves. 2022. CLASP: Few-shot cross-lingual data augmentation for semantic parsing. In AACL-IJCNLP 2022. https://www.amazon.science/publications/clasp-few-shot-cross-lingual-data-augmentation-for-semantic-parsing
- Schedl (2016) Markus Schedl. 2016. The LFM-1b Dataset for Music Retrieval and Recommendation. In Proceedings of the 2016 ACM on International Conference on Multimedia Retrieval (New York, New York, USA) (ICMR ’16). Association for Computing Machinery, New York, NY, USA, 103–110. https://doi.org/10.1145/2911996.2912004
- Schnabel (2022) Tobias Schnabel. 2022. Where Do We Go From Here? Guidelines For Offline Recommender Evaluation. arXiv preprint arXiv:2211.01261 (2022).
- Smith et al. (2022) Jessie J. Smith, Lucia Jayne, and Robin Burke. 2022. Recommender Systems and Algorithmic Hate. In Proceedings of the 16th ACM Conference on Recommender Systems (Seattle, WA, USA) (RecSys ’22). Association for Computing Machinery, New York, NY, USA, 592–597. https://doi.org/10.1145/3523227.3551480
- Sun et al. (2020) Zhu Sun, Di Yu, Hui Fang, Jie Yang, Xinghua Qu, Jie Zhang, and Cong Geng. 2020. Are we evaluating rigorously? benchmarking recommendation for reproducible evaluation and fair comparison. In Fourteenth ACM conference on recommender systems. 23–32.
- Tagliabue et al. (2023) Jacopo Tagliabue, Federico Bianchi, Tobias Schnabel, Giuseppe Attanasio, Ciro Greco, Gabriel de Souza Moreira, and Patrick John Chia. 2023. A challenge for rounded evaluation of recommender systems. Nature Machine Intelligence (2023), 1–2.
- Tagliabue et al. (2022) Jacopo Tagliabue, Federico Bianchi, Tobias Schnabel, Giuseppe Attanasio, Ciro Greco, Gabriel de Souza P. Moreira, and Patrick John Chia. 2022. EvalRS: a rounded evaluation of recommender systems. In CIKM Workshops (CEUR Workshop Proceedings, Vol. 3318). CEUR-WS.org.
- Techcrunch (2021) Techcrunch. 2021. YouTube’s recommender AI still a horror show, finds major crowdsourced study. https://techcrunch.com/2021/07/07/youtubes-recommender-ai-still-a-horrorshow-finds-major-crowdsourced-study/
- tommyod (2020) tommyod. 2020. paretoset. https://github.com/tommyod/paretoset.
- Virinchi et al. (2022) Srinivas Virinchi, Anoop S V K K Saladi, and Abhirup Mondal. 2022. Recommending related products using graph neural networks in directed graphs. In ECML-PKDD 2022. https://www.amazon.science/publications/recommending-related-products-using-graph-neural-networks-in-directed-graphs
- Wallstret Journal (2020) Wallstret Journal. 2020. Facebook Executives Shut Down Efforts to Make the Site Less Divisive. https://www.wsj.com/articles/facebook-knows-it-encourages-division-top-executives-nixed-solutions-11590507499
- Wang and Joachims (2021) Lequn Wang and Thorsten Joachims. 2021. User Fairness, Item Fairness, and Diversity for Rankings in Two-Sided Markets. In Proceedings of the 2021 ACM SIGIR International Conference on Theory of Information Retrieval (Virtual Event, Canada) (ICTIR ’21). Association for Computing Machinery, New York, NY, USA, 23–41. https://doi.org/10.1145/3471158.3472260
- Zangerle and Bauer (2022) Eva Zangerle and Christine Bauer. 2022. Evaluating Recommender Systems: Survey and Framework. Comput. Surveys 55, 8 (2022), 1–38.
- Zheng et al. (2022) Yinglin Zheng, Hao Yang, Ting Zhang, Jianmin Bao, Dongdong Chen, Yangyu Huang, Lu Yuan, Dong Chen, Ming Zeng, and Fang Wen. 2022. General Facial Representation Learning in a Visual-Linguistic Manner. In Proceedings of the IEEE/CVF Conference on Computer Vision and Pattern Recognition (CVPR). 18697–18709.