2022
[1,2]\fnmMohammed \surF. Daqaq
1]\orgdivEngineering Division, \orgnameNew York University Abu Dhabi (NYUAD), \orgaddress \citySaadiyat Island, \countryUAE
2]\orgdivDepartment of Mechanical and Aerospace Engineering, \orgnameTandon School of Engineering, NYU, \cityBrooklyn, \postcode11201, \stateNY, \countryUSA
An Origami-Inspired Design of Highly Efficient Cellular Cushion Materials
Abstract
Current architectured cellular cushion materials rely mainly on damage and/or unpredictable collapse of their unit cells to absorb and dissipate energy under impact. This prevents shape recovery and produces undesirable force fluctuations that limit reusability and reduce energy absorption efficiency. Here, we propose to combine advanced manufacturing technologies with Origami principles to create a new class of architectured cellular viscoelastic cushion material which combines low weight and high energy absorption efficiency with damage resistance and full behavior customization. Each unit cell in the proposed material is inspired by the Kresling Origami topology, which absorbs impact energy by gracefully folding the different interfaces forming the cell to create axial and rotational motions. A large part of the absorbed energy is then dissipated through viscoelasticity and friction between the interfaces. The result is a nearly ideal cushion material exhibiting high energy absorbing efficiency ( 70%) combined with high energy dissipation (94% of the absorbed energy). The material is also tunable for optimal performance, reliable despite successive impact events, and achieves full shape recovery.
keywords:
Origami, Kresling pattern, Architectured material, Impact, Absorption, Advanced manufacturing1 Introduction
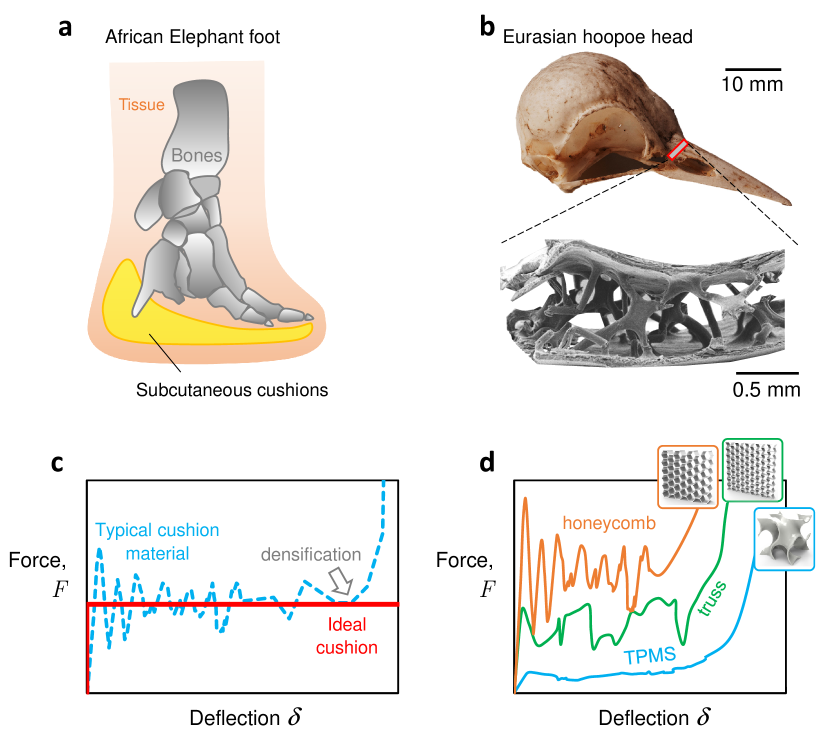
From the fins of the humpback whale (megaptera novaeangliae clapham_megaptera_1999 ) inspiring the design of quieter stall-resistant turbine blades to the leaves of the lotus flower (nelumbo nucifera feng_super-hydrophobic_2002 ) providing the fundamental knowledge necessary to create superhydrophobic surfaces, nature continues to inspire many of today’s most efficient manmade inventions. And while nature did not directly inspire the design of traditional cushion materials, it provided hints regarding the elements necessary to build efficient ones ha_review_2020 . In particular, animals that are constantly subjected to high impact forces have evolved to incorporate porous and/or viscoelastic elements. Porosity serves to absorb kinetic energy through compaction, while viscosity serves to dissipate a part of the absorbed energy as heat. An interesting illustration lies in the feet of the African elephants (loxodonta africana weissengruber_structure_2006 ), which has a subcutaneous cushion consisting of layers of fatty viscoelastic fibrous connective tissue to dissipate large stresses induced by the elephant’s weight during locomotion (see Fig. 1a). Another intriguing example can be seen in the eurasian hoopoe’s (upupa epops wang_why_2011 ) porous cranial bone, which protects its brain against high-frequency impacts reaching up to an acceleration of 1000 g (see Fig. 1b).
Interestingly, current engineered cushion materials, which are mostly polymeric foams do, to some extent, mimic those optimized by nature through a lengthy process of natural selection and evolution. They are disordered cellular viscoelastic structures with open or closed cells that have high crushability and energy absorption capacity gibson_mechanics_1982 ; aubert_low-density_1985 ; brumfield_characterization_1969 ; almanza_microestructure_2001 . Their performance, and that of other energy absorbing materials, is a function of their internal structure and density, and is assessed based on the shape of their force displacement () curve during quasi-static loading or impact gibson_cellular_1999 ; gibson_mechanics_1982 . Besides having a large area under its curve, which represents the amount of raw energy absorbed by the material during loading, a good cushion material should exhibit a sharp increase in force upon impact with minimal force overshoot to avoid damaging protected subjects xiang_energy_2020 ; wang_architected_2019 (Fig. 1c). Upon reaching the maximum allowable force level, the material should maintain a constant resistance to displacement/penetration without force fluctuation. In addition, unlike the blue dashed curve in Fig. 1c, an ideal cushion material should not experience full densification prior to full energy dissipation. It should be damage resistant and able to sustain multiple impacts with minimal deterioration in its effectiveness; or better yet, the material should be able to recover its initial shape after impact. Finally, the ideal material should be lightweight, low cost, and easy to install.
To realize the aforedescribed properties of the ideal cushion material, much of the earlier research work focused on manipulating the density of the material and the average size of the voids to offer some control over the maximum forces experienced by the subject and to maximize energy absorption with minimal densification ashby_mechanical_1983 ; lakes_materials_1993 ; gosselin_cell_2005 ; gibson_biomechanics_2005 ; schaedler_ultralight_2011 . More recently, as a result of the advent of 3D/4D printing kuang_advances_2019 ; thakar_3d_2022 ; teunis_4d_2021 , new avenues were opened towards the design of versatile architectured cellular cushion materials that can combine high strength and toughness dalaq_finite_2016 ; han_microscopic_2017 ; jiang_highly-stretchable_2016 ; dalaq_mechanical_2016 ; abou-ali_mechanical_2020 , high stiffness-to-weight ratio habib_fabrication_2018 ; li_additive_2021-1 ; abueidda_effective_2016 , and compactness with other desirable thermal transport properties qureshi_effect_2022 ; abueidda_micromechanical_2015 ; baobaid_fluid_2022 ; alqahtani_thermal_2021 . Such materials, which are formed of unit cells of different geometric features arranged in various configurations, seem ideal for the design of highly-efficient energy absorbing cushions with tunable curves.
Yet, despite the introduction of architectured cellular materials, many of the ideal cushion qualities, such as damage resistance, shape recovery, and absence of overshoots and fluctuations are still challenging to fulfill. This is because much of the current cellular materials utilize damage as an energy dissipation mechanism dalaq_mechanical_2016 ; habib_fabrication_2018 , or they rely on sudden collapse and unstable buckling of their features abueidda_compression_2020 ; song_octet-truss_2019 ; gibson_mechanics_1982 , all of which are unpredictable or stochastic at best. Take for example, Fig. 1d, which demonstrates the curves for three engineered cellular cushion materials. Both of the honeycomb and truss architectures exhibit large force overshoots and non-smooth deformations under stresses kucewicz_modelling_2018 ; mohsenizadeh_additively-manufactured_2018 . Triply periodic minimal sheets (TPMS), on the other hand, have a much smoother curve, but still rely mainly on damage to absorb energy and show limited recovery after impact abueidda_compression_2020 ; dalaq_mechanical_2016 ; abou-ali_mechanical_2020 .
Creating a reliable curve that fulfills the qualities of an ideal cushion remains a challenge in the formation of modern cushion materials. So much so that some investigators have utilized pneumatic systems in cellular materials wang_architected_2019 . To circumvent this critical problem, we propose in this work to combine 3D printing of viscoelastic materials lakes_viscoelastic_1998 ; ramirez_viscoelastic_2018 with Origami principles lang_science_2007 ; kresling_fifth_2020 to create a new class of cushion materials that is tunable, recoverable, and has a predictable response. The choice of Origami-inspired unit cells to construct the proposed cellular cushion is not arbitrary, but rather motivated by the unique fundamental mechanics of a special Origami topology called the Kresling pattern. In particular, the special geometry of the Kresling unit cell permits graceful folding at different interfaces under loading, which, in turn, forms large recoverable axial and rotational deformations that are free of permanent damage or irreversible buckling dalaq_experimentally-validated_2022 ; kresling_origami-structures_2012 ; kresling_fifth_2020 ; khazaaleh_combining_2022 ; zhai_origami-inspired_2018 . This, combined with the fact that the geometric properties of each unit cell has a qualitative and predictable influence on the restoring force behavior of the material, permits customizing the curve for the application under consideration. This includes designing linear, nonlinear softening, hardening, or even bi-stable cushions dalaq_experimentally-validated_2022 ; khazaaleh_combining_2022 . Finally, the process of folding and unfolding causes rubbing at the interfaces which improves energy dissipation via friction, adding to the bulk energy already dissipated through viscoelasticity.
2 Results
2.1 The Unit Cell
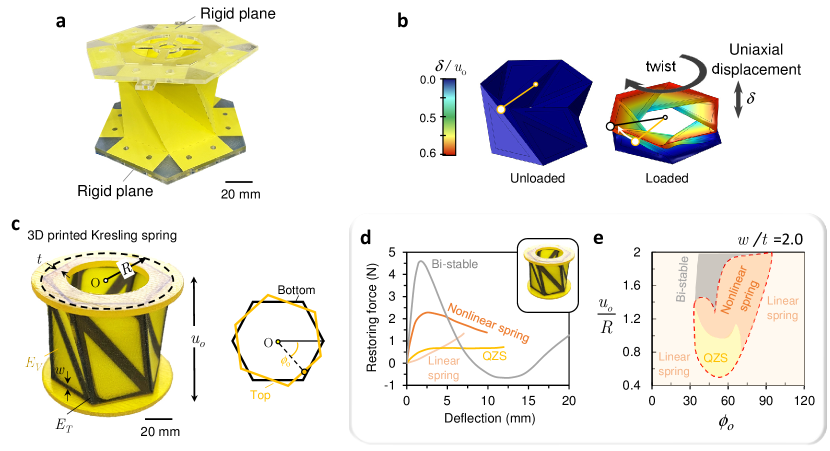
We propose a cellular cushion material made from individual viscoelastic springs inspired by the Kresling origami pattern kresling_fifth_2020 ; hunt_twist_2005 ; noauthor_kresling-pattern_2017 . This viscoelastic spring is an adaptation of a paper-based structure constructed by folding paper following a particular procedure that involves segmenting a flat sheet of paper into triangles and folding it along the edges to form valley and mountain folds. The result is a cylindrical bellow-type structure consisting of similar triangles arranged in cyclic symmetry and connected together (Fig. 2a). As can be seen in Fig. 2b, when an external axial load or a torque is applied to the structure, it stretches or compresses depending on the direction of the applied load. In the process, the two parallel polygon planes, while remaining rigid, move and rotate relative to each other along and about a common centroidal axis similar to the motion of a threaded screw into a nut. This causes the triangular panels to deform and store the applied work in the form of strain energy at the folds. The stored energy is released upon removal of the external loads. This forces the spring to go back to its initial configuration, therewith providing a restoring element that forms the basis for the design of many interesting engineering structures.
Based on the paper spring replica, we aimed here at designing and producing a viscoelastic functional and notably durable replica of the paper-based spring that is constructed using 3D printing technologies khazaaleh_combining_2022 as depicted in Fig. 2c. It involves redesigning each fundamental triangle to permit folding and stretching at the panel interfaces while simultaneously providing sufficient rigidity such that it creates the desired functionality without collapsing under loading (refer to the Methods section for details on fabrication). This is achieved by using two different materials. A compliant material is used to print the outer frames of the triangular panels, which permits stretching, bending, and extensive folding during deformation. A hard material is used to print the inner rigid cores that retain the Kresling topology during deformation.
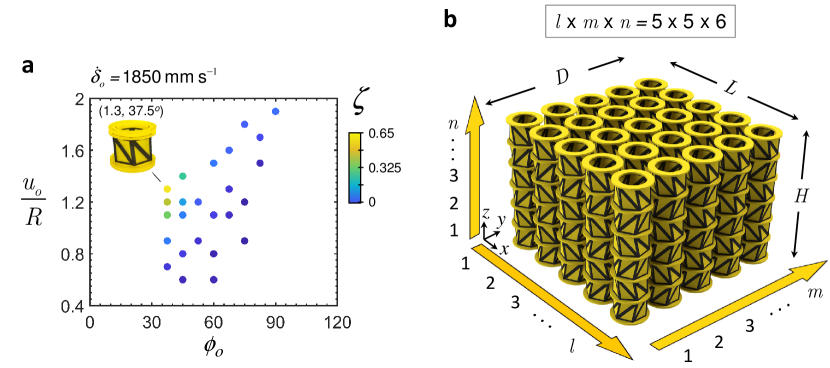
The restoring force behavior and size of each unit cell are governed by 6 geometric and 4 material design parameters. The geometric design variables are the radius, , circumscribing the top and lower polygons, the pre-deformation height, , the pre-deformation angle, , the panel thickness , the flexible frame width , and the number of polygon sides, . The material design variables are the Young’s moduli, () and Poisson’s ratios () of the panel and creases, respectively. As shown in Fig. 2d,e, depending on the values of primarily and , the viscoelastic spring can exhibit different restoring force behaviors, which includes a linear spring behavior, a nonlinear spring behavior, a quasi-zero stiffness (QZS) behavior, and a bi-stable behavior dalaq_experimentally-validated_2022 . The behavior is determined by the ratio and irrespective of specific values of and . Throughout this study, the behavior of the unit cell is changed by varying and while the rest of the parameters listed above are kept constant (see Supplementary Table 1). A sufficient contrast, in terms of the Young’s modulus between the constituting materials, is essential to impart enough flexibility at the creases. In addition, the material forming the creases must be stretchable (e.g., rubbery polymers). Our choice of the 3D printing materials, TangoBlackPlus (soft) and Vero (stiff), fulfills the above and provides a contrast of . The same Origami springs can be fabricated from other material combinations, with similar attributes and with comparable to that of Tango and Vero.
Of particular interest to the design of cushion material is the QZS behavior because it mimics the behavior of an ideal cushion material as described earlier in Fig. 1c. To characterize the region/regions in the geometric design parameters space which results in a QZS response, we carried out a detailed modeling of the quasi-static behavior of the unit cell using finite element methods (FEMs) as described in the Methods section. Figure 2e demarcates regions of qualitatively different restoring force behavior as function of the design parameters and for . It can be clearly seen that there is a sizable region in the parameter space which leads to the desired QZS behavior.
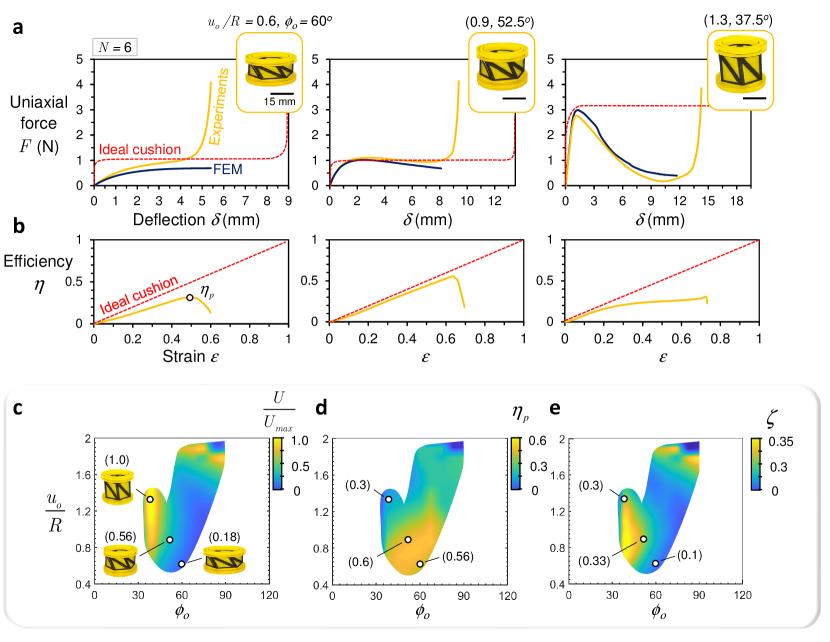
Using three different geometric data sets from the map, we generated the quasi-static curves for three different unit cells as depicted in Fig. 3a. Results were generated using FEM and compared to experimental data obtained using a quasi-static uniaxial compression testing machine as detailed in the Methods section. The three cases are a nonlinear spring , a quasi-zero stiffness (QZS) spring , and a strongly nonlinear softening spring . The first unit cell shows a nonlinear softening restoring-force behavior that is free from force fluctuations, but has a very slow rise to the steady-state value when compared to the ideal cushion response. This response is depicted by cases that have just transitioned into QZS away from the border between the QZS (yellow region) and the linear spring response (pink region) (Fig.2e). The experimental response is qualitatively similar to the computational results, with the addition of the rapid increase of force at large displacements due to densification. Note that densification due to contact between surfaces was not modeled computationally.
The second unit cell was designed using the parameters (), which lies within the QZS region of Fig. 2e. The resulting computational and experimental curves under quasi-static conditions are similar, showing an almost QZS behavior that mimics the ideal cushion response (red dashed curve in Fig. 3a). The resulting response is free from overshoots and exhibits the desired flat curve (i.e., quasi-zero stiffness) after the sharp linear increase in force. The third unit cell, which is designed using (), has a curve which exhibits an initial sharp increase in force followed by a strong softening behavior that ends with a spike in force due to densification. This particular design lies near the border between the nonlinear and bi-stable response (orange-grey regions) as shown in Fig. 2e. Increasing leads to severe softening and loss of load bearing capacity, which eventually induces bi-stability.
2.2 Energy Absorption Efficiency
One approach to measure the resemblance of the curves to that of an ideal cushion is by tracking the energy absorption efficiency, , during deformation, which is given by li_compressive_2006 :
| (1) |
where is the engineering stress at any given engineering strain, , is the maximum recorded stress as is increased, , and is the final strain at full compression, that is . In essence, the absorption efficiency measures the ratio of the energy absorbed up to any given deflection to that of an ideal cushion, . Therefore, assesses the resemblance of profile to its ideal curve (red dashed curve in Fig. 3a and b).
Figure 3b depicts the values of for the three different designs as compared to the ideal cushion. Peak efficiency (indicated by a filled white circular marker) marks the onset of densification. The first and third unit cells have an efficiency that resembles that of the ideal cushion for small deformations, but that quickly deviates away from it for values of . This indicates a gradual loss of efficiency with deformation. In contrast, the second unit cell, which is QZS, has an absorption efficiency which almost coincides with that of the ideal cushion up until the point of densification.
In addition to having a good absorption efficiency, a good energy absorbing material should have a high absorption capacity. This is characterized by the total energy absorbed, , which is quantified by the area under the curve. To characterize the influence of the geometric parameters of the unit cell on these two performance metrics, we used the computational model to sweep (a full factorial sweep) across the geometric parameter space . The sweep covered values between and with increments of 0.05 and along the and axes, respectively, for a total of 651 simulations. Using those simulations, we computed the total absorbed energy , and the peak efficiency for each geometry. We normalized by which is the maximum value of the absorbed energy across the parameter space. Results are shown in Figs. 3c and d, which depict, respectively, contour maps of the normalized absorbed energy and the peak efficiency as a function of . It is evident that the regions resulting in highest energy absorption are different from those resulting in maximum efficiency. Actually, in the region where the geometry yields the desired QZS behavior, these two performance criteria appear to be competing against each other. Thus, we devise a new performance metric which combines both criteria in the form . High values of generally indicate a better cushion. Fig. 3e shows a contour map of as a function of the geometric parameters . The region yielding the highest values of occurs in the mid-left region between and .
2.3 Effect of Viscoelasticity
While the quasi-static curves offer a good understanding of the energy absorption capacity and efficiency of the unit cell, they provide no insight into the loading rate dependence of the curves or the amount of energy dissipated during an impact event due to viscoelasticity. First, we analyze the viscoelasticity induced rate-dependence of the curves. To this end, Fig. 4a and b show experimentally obtained and curves for the third unit cell with under quasi-static and impact loading rates of mm/s and mm/s, respectively. Here, we introduced the subscript “” to make the distinction that is the initial loading rate imparted on the sample at the onset of impact. It is evident that the two curves are very different. First, the level of force experienced during high speed impact are much higher than the quasi-static case. Second, maximum force is experienced at a larger strain level during impact loading; that is, the force rises to its maximum value at a much slower rate. This has the influence of reducing the absorption efficiency at small strains. Finally, there is a reduction in the strain softening behavior observed in the quasi-static case. This causes the absorption efficiency to increase at medium and high strain levels.
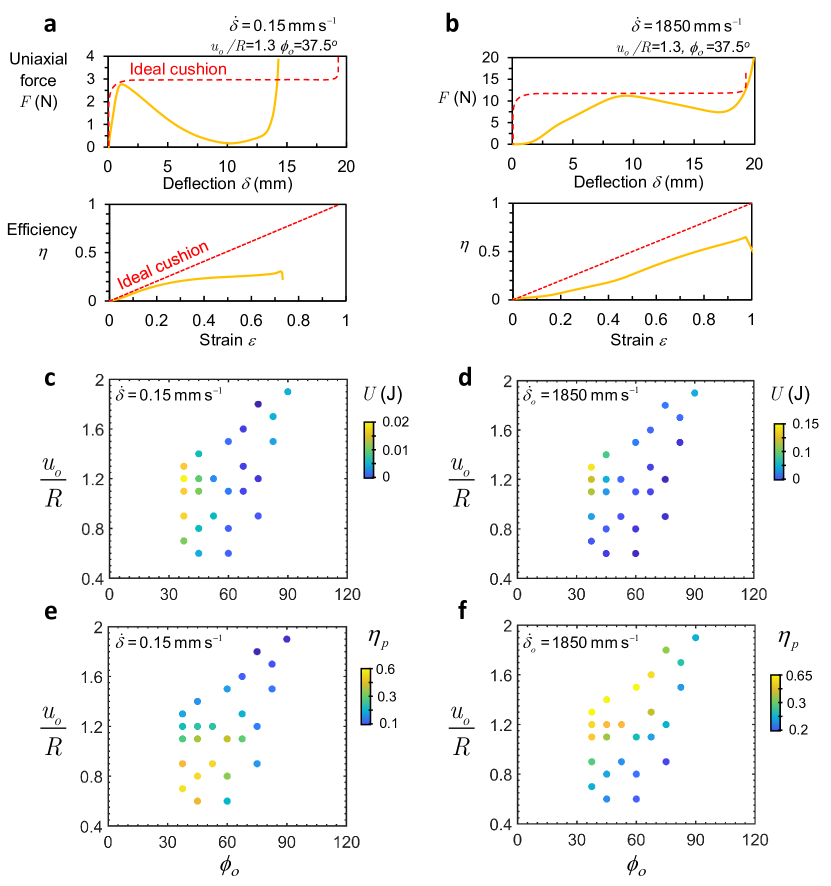
To better understand which combination of geometric design parameters yields the highest absorption capacity and efficiency under impact loading, we probed the design space experimentally at 25 different locations across the geometric parameter space . We chose points of interest to be scattered in the QZS region as encouraged by the numerical simulations shown in Fig. 3d. We also included points around the QZS region pertaining to the nonlinear-softening cases, as they may have the potential of exhibiting QZS behavior upon increased loading rate due to viscoelasticity. For each geometry, we experimentally measured the and curves, which, in turn, are used to compute and as shown in Figs. 4c and e for the quasi-static case, and Fig. 4d and f for the impact scenario. Each point on the figures corresponds to the average of 3 tests. For the quasi-static case, best performing designs in terms of energy absorption, , cluster around the left-hand side of the parameter space, which agrees well with the computational simulations shown earlier in Fig. 3d. The best performing cluster in terms of energy absorption, , remains the same even under impact loading. Thus, one can safely rely on quasi-static simulations to identify the best energy absorbing designs regardless of loading rate.
In terms of absorption efficiency, best designs under quasi-static testing cluster around the bottom left corner of the figure favoring shorter and more compliant unit cells (Fig. 4e). On the other hand, best performance under impact loading favors longer designs with larger stroke distance as can be clearly seen in Fig. 4f. Moreover, when comparing Figs. 4c and d, we notice that, due to the viscoelasticity of the base constituents, samples absorbed 7.5 times more energy under impact loading than those subjected to quasi-static loading.
Next, we analyze the effect of the loading rate on the dissipated energy, which can be captured by quantifying the size of the hysteresis loops during a single cycle of loading and unloading. To this end, we performed loading tests at five different loading rates: = 0.1, 1, 10, 20 and 50 mm/s and tracked the size of the resulting hysteresis loops (Supplementary Note 1, Supplementary Fig. 3a). It is evident, that the size of the hysteresis loop corresponding to the energy dissipated per cycle increases with the loading rate (Supplementary Note 1, Supplementary Fig. 3b). This hysteresis is consistent and notably predictable (see also Supplementary Movie 1). Thus, unlike energy dissipation via damage, viscoelasticity provides a predictable energy dissipating mechanism which improves with the loading rate.
2.4 The 3D Tessellated Lattice
The combined performance indicator is used to identify the optimal unit cell design for impact absorption. Experimental measurements in Fig. 5a show that the best performing design in terms of both energy absorption and efficiency corresponds to the geometry with (). We therefore use this optimal unit cell to architecture and construct, for the first time, a 3D Origami based composite lattice which is depicted in Fig. 5b. This design utilizes alternating chirality to cancel out any net rotation during compression of the springs. This design which is created by tessellating the unit cell along the three Cartesian directions: , and , has a total of 150 unit cells.
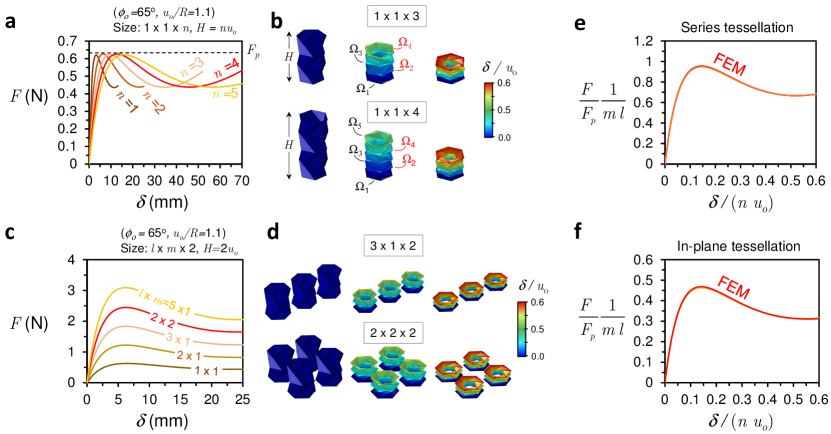
To first understand the mechanics of such tessellated designs, we simulated their responses for series and in-plane tessellations. Tessellation of unit cells in series along the -axis forms a vertical stack, or rather an Origami column of unit cells, with an equivalent height of . Since equilibrium along the -axis requires that the reaction uniaxial force, , be constant and independent of , taller columns with larger height are more compliant and have larger stroke distance. The larger stroke distance enhances energy absorption (area under the curves), which directly scales with the number of vertical unit cells as shown in Fig. 6a for to (see Eq. (22) in Supplementary Note 3).
Figure 6b shows the field plots of the deforming Origami-column at and for both and . The junctions between the unit cells are indicated by , where the subscript denotes the junction location. For example, a column of has 5 junctions as indicated in Fig. 6b. Those plots are obtained for uniaxially compressed columns subjected to uniaxial displacement at top surface and that is fixed at the bottom for all cases (Methods section). Since unit cells are stacked with alternating opposite chirality, no rotation occurs at the ends of each pair. Instead, the junction in between the two pairs (even values of ) absorbs the entire rotation. Rotations are therefore induced at every other junction. For instance, for , the compression at the top, junction , induces rotation at and , while and are free of any rotation.
Tessellation within the plane forms a planar lattice of unit cells. Top and bottom unit cells are connected by rigid planes to ensure direct transfer of forces across the model. The simulated curves for , , , and are shown in Fig. 6c for . It is evident that the overall response becomes stiffer as increases, requiring a larger uniaxial force to achieve a unit deflection. The total energy absorbed scales directly with the total number of in-plane unit cells, i.e. (see Supplementary Note 3).
2.5 The curve of the 3D Tessellated Lattice
While FEM can be used to generate the curves of the tessellated lattice as shown in Fig. 6a and c, more insights can be gained form an analytical description of those curves. Similar to hyperelastic foams, we model each unit cell as a nonlinear hyperelastic material (Supplementary Fig. 6a). The curve of a single unit cell can then be modeled by adopting Storaker equation for hyperelastic materials storakers_material_1986 (Supplementary Note 3):
| (2) |
which can be extended to account for tessellation in 3D using
| (3) |
where is the force experienced by the unit cell; is a constant representing the stiffness of the material at ; and are empirical constants that can be calibrated based on either experiments or high-fidelity simulations of a single unit cell. Those constants reflect the particularities of the geometric and material properties of the cell. Equations (2) and (3) can be used to fully capture the restoring force behavior of any single unit cell and the overall response of any lattice of known configuration, . Results showing the agreement between this analytical model and experiments can be found in Supplementary Figs. 6b and 6c.
The analytical model presented in Eq. (3) offers a key additional insight that cannot be easily inferred by relying on the FEM simulations. In particular, by introducing the dimensionless deflection and the dimensionless force , where is the peak force in any given curve, all the curves in Figs. 6a and c can be collapsed into two universal curves for series and in-plane parallel tessellations. This facilitates the prediction of the curve for any arbitrary tessellated lattice.
Combining the series and parallel configurations offers a rich platform for tuning the mechanical properties and customizing the overall curve for the desired application. The series configuration (varying only) can be used to tune the stiffness, stroke distance, and, therewith energy absorption , while keeping the peak forces fixed (constant strength). Whereas, in-plane tessellation (varying and ) can be used to tune the maximum force (strength), stiffness, energy absorption, and the footprint area of the cushion material. Thus, in a nutshell, we proposed here an Origami based design framework that allows tailoring of the geometric parameters of the Kresling topology (, ) to engineer the desired response, then use it to form a 3D lattice by setting , and for the desired levels of stiffness, strength, stroke distance and energy absorption.
2.6 A Functional Cushion
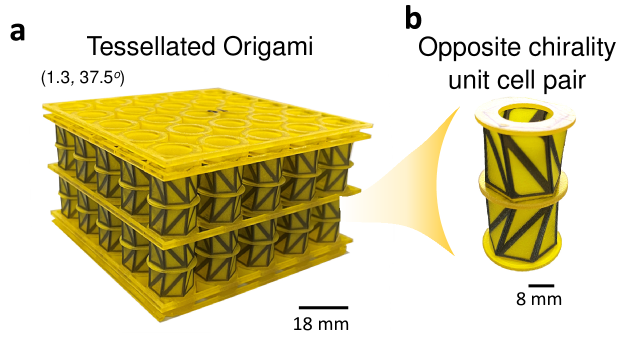
There have been several methods for 3D fabrication of Origami structures ranging from the use of flexible linkages, scoring sheets using laser, and paper folding ishida_design_2017 ; yasuda_origami-based_2017 ; deleo_origami-based_2020 ; butler_highly_2017 . Here, we employ state-of-the-art additive manufacturing utilizing the polyjet technique. By carefully tuning the UV light exposure time, printing speed, unit cell spacing and minimum feature size, we are able to 3D print a high-fidelity tessellated prototype in “one go”. In other words, we bypass the assembly step that is often employed in other forms of tessellated metamaterials. Figure 7a and b show, respectively, the 3D printed cushion material using the optimal unit cell design () and the opposite-chirality unit cell forming the lattice.
The 3D printed prototype serves as a functional, viscoelastic, Origami-inspired cushion for impact absorption. To test its performance, we carry out a low-speed impact test on this material ( mm/s and impactor mass, kg). In particular, we subject the material to 12 successive impacts with a window of 7 min break. Figure 8a shows the corresponding curves for the multiple impacts. The first impact exhibits the highest peak force, which appears to drop slightly with each subsequent impact up to the impact, beyond which the curve is unaffected. This can be seen in Figure 8b, which studies variation of the peak force, , and absorbed energy, , as a function of the number of impacts. Successive impacts only cause around 5% reduction in the peak force (strength) with no measurable influence on the overall energy absorption capacity of the cushion.
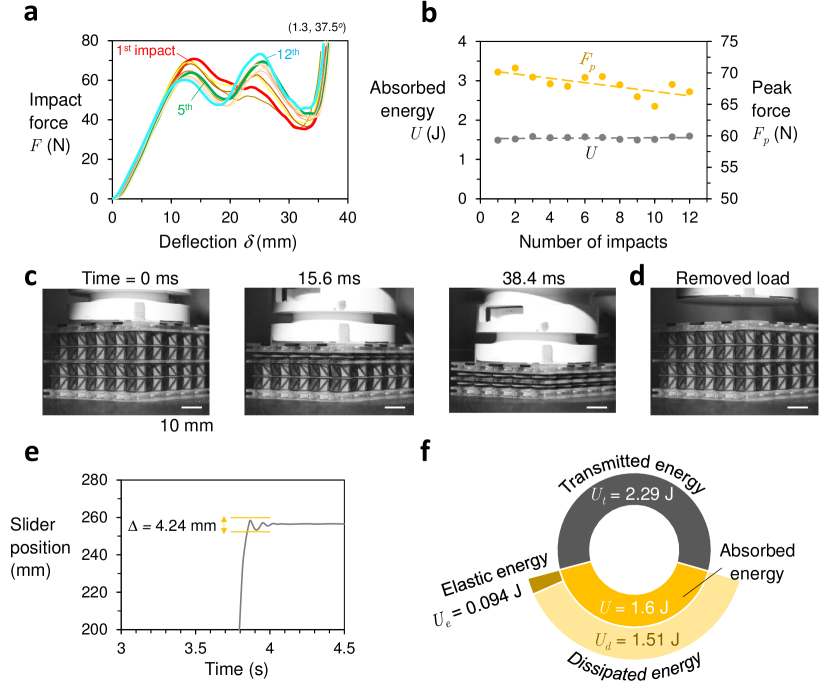
The damage resistance of the cushion can be attributed to the unique topology of the Origami cell which channels the incident energy into graceful folding, crease stretching, and panel rubbing through rotation (see Supplementary Movie 2). The curves of Fig. 8a exhibit a plateau region characterized by a wavy profile which is attributed to the successive engagement of the layers in the structure. High speed imaging performed at 10,000 frames/s reveals this successive engagement of the layers as shown in Fig. 8c. The impactor head reaches the material at ms. Within the next 15.6 ms, the head presses through the 22 mm height of the first layer, which is reflected as a linear rise in the reaction force until the peak force is reached followed by slight softening. After which, the impactor presses through the second layer exhibiting the same rise until a second peak force is realized followed by a softening behavior (see Supplementary Movie 2). It takes the impact head a much longer time of 23 ms to flatten the second layer because it has already decelerated and lost a large part of its kinetic energy. The lower impact speed reduces the viscoelastic effect, which is reflected by the higher softening response in the second peak of Fig. 8a. By virtue of the Kresling topology, the structure recovers 100% of its shape and height despite multiple impacts (Fig. 8d). In contrast to other cellular materials, the wavy profile is not resulting from material damage, but is an inherent characteristic of the Kresling topology that is fully customizable (deterministic).
The 2.26 kg impactor approaches the Origami structure at a speed of 1.85 m/s and imparts a total energy of J on the cushion. Using a laser sensor, we track the impactor position during testing as depicted in Fig. 8e. This permits carrying out a full energy analysis to provide an energy breakdown of the impact event as shown in Fig. 8f. Almost 41% ( J, area under the ) of the 3.9 J incident energy gets absorbed by the structure, of which 94% ( J) is dissipated through viscoelasticity and friction between the panels. About 5% ( J) is stored as elastic energy within the structure, and hence, is recovered as a rebound of mm. The remaining J of the total energy is transmitted to the surrounding via acoustic and elastic waves.
2.7 Apparent and Effective Properties of the Cushion
The Origami-based lattice can be either treated as a structure or as a material in its own right. Thus, it is critical to understand whether the energy absorbed via a single unit cell scales linearly with the number of unit cells. Figure 9a shows the raw energy absorption for , , , and . The shaded envelope represents the experimental variation across the tested samples. Each point presented on the figure is an average value of 15 impact cycles, where the upper and lower limits of the envelope denote the pre-impact (fresh samples) and the minimal post-impact results, respectively. Knowing that the energy absorbed by a single unit cell is J, we can predict the overall response of the lattice by using (Supplementary Note 3):
| (4) |
Equation (4) is plotted together with the experimental data in Fig. 9a as a black solid line showing very good correspondence.
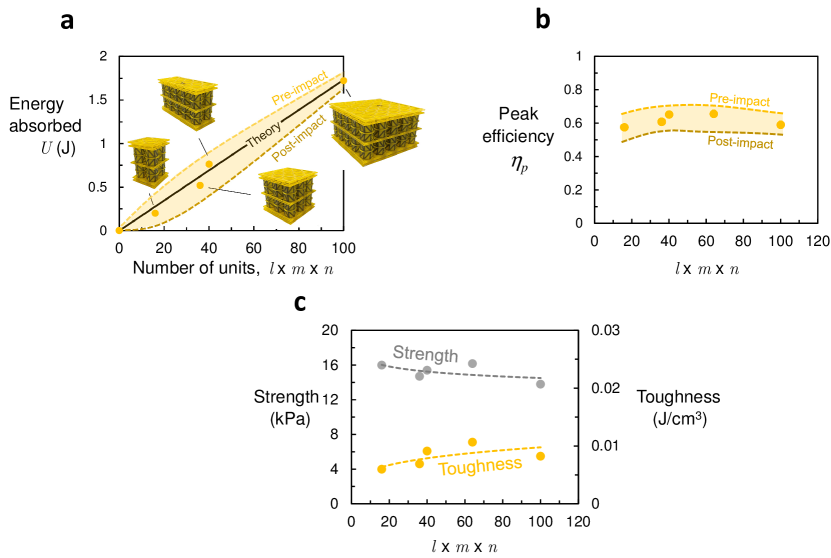
We also calculate the peak efficiency, , for the different samples as a function of as depicted in Fig. 9b. The absorption efficiency remains nearly constant, ranging between 0.55 - 0.7. Thus, it is plausible to conclude that is independent of the number of unit cells, and that it is a property of the geometry of each unit cell.
In view of this design framework as a cushion material, we calculate the apparent strength and toughness of the cushion (see Supplementary Note 1). Both the strength and toughness are raw measurements that are normalized by their effective area and volume, respectively. Therefore, they are independent of size and will mainly be dependent on experimental conditions such as impact speed, base material constituents, and ambient conditions. It can be seen in Fig. 9c that the proposed cushion achieves periodicity, and therewith its effective material properties, at a relatively low number of unit cells. Actually, only 30 unit cells are needed for both strength and toughness to saturate with the increased number of unit cells.
3 Discussion
Throughout this paper, it has been demonstrated that origami-inspired unit cells based on the Kresling pattern can be used to architect efficient cushion materials for impact energy absorption and dissipation. Those materials, which absorb energy through graceful folding at the interfaces of each unit cell in the absence of permanent damage induced by irreversible buckling, can fully recover once the load is removed (see Supplementary Movie 3). Indeed, results illustrate that even after as many as twelve impacts that fully compress the cushion, the strength was only reduced by 5% with no measurable influence on the overall energy absorption capacity of the cushion.
Because of the sensitive dependence of the curve on the geometric properties of the unit cell, each cell can be designed to retain a desired level of energy absorption efficiency, while tuning for specific combinations of peak force, total energy absorbed, or effective strength and toughness. This permits the design of optimal cushion materials for the application at hand (impact level and speed).
Energy dissipation, which is mainly due to viscoelasticity and frictional rubbing between the panels, is rate and load dependent. A cushion material consisting of two layers of unit cell pairs (4 cells across the height) was able to absorb 41% of the energy imparted by a load moving with a linear momentum of 4.2 kg m/s at a speed of 1.85 m/s, and dissipate 94% of absorbed energy. Both percentages could possibly be increased by increasing the number of layers.
In order to compare the performance of this cushion material to other existing materials or lattices structures, we generate an absorption efficiency versus density () chart as shown in Fig. 10. Some of those reported cases are regarded as structures as they do not achieve separation of scale, where the magnitudes of the forces or apparent Young’s modulus are still scale dependent. Recall that the peak efficiency, , assesses the closeness of curve to its ideal response (red curves in Fig. 3). As such, it primarily reflects the effect of geometry and viscoelasticity (loading rate dependence, if any) on the overall response irrespective of scale or specific Young’s modulus of the lattice’s constituents. The ideal cushion materials must be able to provide the highest absorption efficiency at the lowest possible density. The Origami base unit cell has a panel thickness of 0.4 mm and the material has a small apparent density kg/m3 leading to a light and highly porous cellular material with a relative density of ( is the density of solid material).
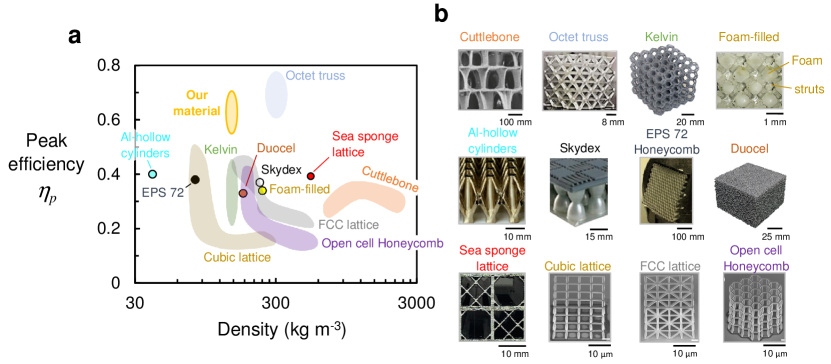
liu_dynamic_2014 , Aluminum Duocel mohsenizadeh_additively-manufactured_2018 (image adapted from duocel_aluminum_2023 ), Open cell Honeycomb-, FCC-, cubic-mieszala_micromechanics_2017 , Kelvin-lattice habib_fabrication_2018 , EPS 72 foam (honeycomb lattice) caserta_shock_2011 , Octet-truss song_octet-truss_2019 , Skydex (twin-spherical lattice) mohsenizadeh_additively-manufactured_2018 ; de_sousa_assessing_2012 (Skydex padding image adapted from zhu_parameterized_2014 ), Foam-filled (COF240) ramirez_viscoelastic_2018 , Sea sponge lattice sharma_bio-inspired_2022 and Cuttlebone-lattice yang_advanced_2020 (image adapted from cadman_cuttlebone_2012 ). The Kresling based Origami material is denoted by “Our material” in orange. Unless otherwise stated, images are adapted from their respective reference(s), from which numerical data is reported.
In terms of absorption efficiency, the vast majority of extensively researched cellular topologies used for the design of architectured cellular cushions; e.g. cubic-, kelvin-, honeycomb- and FCC-lattices, have an energy absorption efficiency in the range . Industrial counterparts, such as Ducel, Skydex, EPS 72 foams, have a peak efficiency which hovers around . Notably, the Origami-inspired cushion demonstrated a high energy absorbing efficiency of around at very low density. In particular, experimentally collected data yields efficiency numbers that occupy the top left corner of the chart, . In addition, because of the viscoelasticity-induced dependence of the absorption efficiency on the rate of impact, efficiency figures are expected to increase even further at higher impact speeds. Only architectured materials based on the Octet truss lattice have a comparable efficiency under quasi-static conditions. However, this material has a much higher density and suffers substantial damage under impacts with low recoverability of its initial height, shape, and structural load bearing capacity. In contrast, the Origami-inspired cushion is damage resistant, recovers its full shape, and has a reliable mechanical response even after a large number of impact events. Finally, a solution to small impactors or incident bodies interacting with the through-holes of the cushion can be achieved by incorporating a top rigid plate containing arrays of tiny perforations to allow air to escape during impact while preventing the interactions with the holes (Supplementary Fig. 7). The plate can also be made flexible to selectively localize the impact and control the participation of the unit cells during impact.
4 Materials and Methods
4.1 Fabrication
The Kresling unit cell and its full 3D tessellated version are fabricated using Stratasys J750 3D printer (Stratasys stratasys_feel_2022 , Commerce Way, USA) which utilizes the polyjet technique. The structure is made out from a compliant (rubbery) and hard materials; namely, TangoBlackPlus stratasys_tango_2018 ; object_fullcure_2009 and Vero stratasys_vero_2018 ; object_fullcure_2009 (Fig 2c). The compliant material is used to create the creases, particularly outer frame of the unit cell to permit stretching, bending, and extensive folding during deformation, while the hard material is used to create the inner rigid core, which retains the Kresling topology during deformation. Each 3D printed sample is submerged in a chemical solution consisting of 2% caustic soda (sodium hydroxide) and 1% sodium metasilicate (Na2SiO3) for a period ranging from 18 to 72 hours, depending on the size of the sample, to ensure gentle and complete removal of the SUP706 support material stratasys_find_2022 . Each sample is then cured under UV-light for 300 minutes. In practice, the size of the tessellated Origami is limited by the size of the build plate of the 3D printer, which is mm. For mass production, full utilization of the build plate allows the printing of 12 cushion samples (of , Fig. 7a), or a full-fledged tessellation over the entire plate of , in 42 hours. Those 12 samples of consume a total of 295 grams of TangoBlackPlus, 1403 grams of Vero and 8600 grams of support materials (SUP706). We can thus fabricate, clean and cure samples in hours (or an average of hours per a single cushion).
4.2 Uniaxial Testing
The uniaxial quasi-static tests are performed using an Instron 5960 series universal testing machine (Instron illinois_tool_works_inc_out_2020 , Norwood, US). The sample is placed into a sample holder designed in-house as shown in Supplementary Fig. 1a. The bottom part of the sample holder is connected to a frictionless bearing which permits a smooth rotation of the unit cell upon compression. The entire apparatus rests on a rigid platform. A constant rate displacement of 0.15 mm/s is applied at the upper surface of the holder up to 80% of the initial height. The resulting axial reaction force, , exerted by the sample on the clamp is recorded using a load cell. The measured deflection and reaction force are used to generate the curves (Supplementary Fig. 1b). The resulting curves are then translated into their corresponding engineering stress-strain and efficiency-strain curves li_compressive_2006 (see Supplementary Note 1 for further details on the uniaxial testing process).
4.3 Computational Model
A general shell-based finite element model is built using Abaqus (Dassault Systèmes simulia_abaqus_2022 , US) to simulate the quasi-static behavior of the Origami-based cellular materials. The base constituents are considered to be linear-elastic materials. The model is meshed using 3D planar shell elements that account for 3D translation, rotation, in-plane and out-of-plane deformations michael_smith_abaqusstandard_2019 . The model takes the geometric parameters , the material elastic properties (, and tessellation () as inputs and uses them to construct the 3D shell-model using the Kresling topology. Considering an Origami column () as an example (Supplementary Fig. 4), the bottom surface is fixed while the top surface is subjected to uniaxial compression . To ensure a well-posed boundary value problem with unique solutions kim_introduction_2008 and that is free of numerical artifacts, all junctions, including top and bottom surfaces (), are constrained such that their rotation around the -axis is restricted for odd junctions. In other words, the rotation at every other two junction(s) is constrained. Otherwise, any subtle variation in the relative displacement/rotation among junctions in the course of the numerical simulation results in junctions overtaking or falling behind during deformation, which is solely due to numerical artifacts. We also restrict the out-of-plane rotation (overturn) of all junctions. All remaining surfaces and edges are assumed to be traction free. The above constraints are imposed through the boundary conditions listed in Supplementary Note 2 and in Supplementary Fig. 4.
4.4 Impact Testing
The impact testing rig consists of a free-falling impactor head guided via two frictionless bearings along two steel poles. The unit cell sample is positioned under the impactor head with its bottom surface clamped to a frictionless bearing to allow rotation under load (Supplementary Fig. 5a). For the tessellated cushion, a bearing is not required since its end surfaces are free of rotation. The mass of the impactor head can be adjusted by adding different weights via a bolt-nut mechanism. The mass of the slider and the attached masses is 2.26 kg for impact tests involving the tessellated cushion material. Whereas, the total mass is set to 1.26 kg for the single unit cell impact tests. A laser sensor (Micro-Epsilon optoNCDT 2300) is used to track the position of the impactor head along the -axis during impact and rebound, while a force sensor is used to measure the impact force. The falling height is set such that the speed at the onset of impact in all cases is 1.85 m/s. The obtained data (impact force, slider position and time), along with the sample deflection, are collected via an acquisition system with a sampling rate of 20 kHz. The data is used to generate the force-time (), deflection-time ), and force-deflection () curves (See Supplementary Fig. 3b, 3c and 3d).
*Acknowledgments This research was carried out using the Core Technology Platform resources at New York University Abu Dhabi. In particular, we would like to acknowledge the support of the Advanced Manufacturing Core.
Declarations
-
•
Supplementary Information are provided as separate files with the submission.
-
•
Competing interests: The authors declare no competing interests.
-
•
Data availability: Data supporting the findings of this study are available from the corresponding author upon request.
References
- \bibcommenthead
- (1) Clapham, P. J. & Mead, J. G. Megaptera novaeangliae. Mammalian Species (604), 1–9 (1999). URL https://www.jstor.org/stable/3504352. 10.2307/3504352, publisher: [American Society of Mammalogists, Oxford University Press] .
- (2) Feng, L. et al. Super-Hydrophobic Surfaces: From Natural to Artificial. Advanced Materials 14 (24), 1857–1860 (2002). URL https://onlinelibrary.wiley.com/doi/abs/10.1002/adma.200290020. 10.1002/adma.200290020, _eprint: https://onlinelibrary.wiley.com/doi/pdf/10.1002/adma.200290020 .
- (3) Ha, N. S. & Lu, G. A review of recent research on bio-inspired structures and materials for energy absorption applications. Composites Part B: Engineering 181, 107496 (2020). URL https://www.sciencedirect.com/science/article/pii/S1359836819339964. 10.1016/j.compositesb.2019.107496 .
- (4) Weissengruber, G. E. et al. The structure of the cushions in the feet of African elephants (Loxodonta africana). Journal of Anatomy 209 (6), 781–792 (2006). URL https://www.ncbi.nlm.nih.gov/pmc/articles/PMC2048995/. 10.1111/j.1469-7580.2006.00648.x .
- (5) Wang, L. et al. Why Do Woodpeckers Resist Head Impact Injury: A Biomechanical Investigation. PLOS ONE 6 (10), e26490 (2011). URL https://journals.plos.org/plosone/article?id=10.1371/journal.pone.0026490. 10.1371/journal.pone.0026490, publisher: Public Library of Science .
- (6) Gibson, I. J. & Ashby, M. F. The mechanics of three-dimensional cellular materials. Proceedings of the Royal Society of London. A. Mathematical and Physical Sciences 382 (1782), 43–59 (1982). URL https://royalsocietypublishing.org/doi/abs/10.1098/rspa.1982.0088. 10.1098/rspa.1982.0088, publisher: Royal Society .
- (7) Aubert, J. H. & Clough, R. L. Low-density, microcellular polystyrene foams. Polymer 26 (13), 2047–2054 (1985). URL https://www.sciencedirect.com/science/article/pii/0032386185901867. 10.1016/0032-3861(85)90186-7 .
- (8) Brumfield, H. & Estill, W. Characterization of Foam Structure by Use of the Scanning Electron Microscope. Journal of Cellular Plastics 5 (4), 212–220 (1969). URL https://doi.org/10.1177/0021955X6900500403. 10.1177/0021955X6900500403, publisher: SAGE Publications Ltd STM .
- (9) Almanza, O., Rodriguez-Pérez, M. A. & de Saja, J. A. The microestructure of polyethylene foams produced by a nitrogen solution process. Polymer 42 (16), 7117–7126 (2001). URL https://www.sciencedirect.com/science/article/pii/S0032386101001070. 10.1016/S0032-3861(01)00107-0 .
- (10) Gibson, L. J. & Ashby, M. F. Cellular Solids: Structure and Properties 2 edition edn (Cambridge University Press, Cambridge, 1999).
- (11) Xiang, X. M., Lu, G. & You, Z. Energy absorption of origami inspired structures and materials. Thin-Walled Structures 157, 107130 (2020). URL https://www.sciencedirect.com/science/article/pii/S026382312031003X. 10.1016/j.tws.2020.107130 .
- (12) Wang, Y. et al. Architected lattices with adaptive energy absorption. Extreme Mechanics Letters 33, 100557 (2019). URL https://www.sciencedirect.com/science/article/pii/S2352431619302251. 10.1016/j.eml.2019.100557 .
- (13) Kucewicz, M., Baranowski, P., Małachowski, J., Popławski, A. & Płatek, P. Modelling, and characterization of 3D printed cellular structures. Materials & Design 142, 177–189 (2018). URL https://www.sciencedirect.com/science/article/pii/S0264127518300364. 10.1016/j.matdes.2018.01.028 .
- (14) Mohsenizadeh, M., Gasbarri, F., Munther, M., Beheshti, A. & Davami, K. Additively-manufactured lightweight Metamaterials for energy absorption. Materials & Design 139, 521–530 (2018). URL https://www.sciencedirect.com/science/article/pii/S0264127517310687. 10.1016/j.matdes.2017.11.037 .
- (15) Al-Ketan, O., Soliman, A., AlQubaisi, A. M. & Abu Al-Rub, R. K. Nature-Inspired Lightweight Cellular Co-Continuous Composites with Architected Periodic Gyroidal Structures. Advanced Engineering Materials 20 (2), 1700549 (2018). URL https://onlinelibrary.wiley.com/doi/abs/10.1002/adem.201700549. 10.1002/adem.201700549, _eprint: https://onlinelibrary.wiley.com/doi/pdf/10.1002/adem.201700549 .
- (16) Ashby, M. F. & Medalist, R. F. M. The mechanical properties of cellular solids. Metallurgical Transactions A 14 (9), 1755–1769 (1983). URL https://doi.org/10.1007/BF02645546. 10.1007/BF02645546 .
- (17) Lakes, R. Materials with structural hierarchy. Nature 361 (6412), 511–515 (1993). URL https://www.nature.com/articles/361511a0. 10.1038/361511a0, number: 6412 Publisher: Nature Publishing Group .
- (18) Gosselin, R. & Rodrigue, D. Cell morphology analysis of high density polymer foams. Polymer Testing 24 (8), 1027–1035 (2005). URL https://www.sciencedirect.com/science/article/pii/S014294180500108X. 10.1016/j.polymertesting.2005.07.005 .
- (19) Gibson, L. J. Biomechanics of cellular solids. Journal of Biomechanics 38 (3), 377–399 (2005). URL https://www.sciencedirect.com/science/article/pii/S0021929004004919. 10.1016/j.jbiomech.2004.09.027 .
- (20) Schaedler, T. A. et al. Ultralight Metallic Microlattices. Science 334 (6058), 962–965 (2011). URL https://www.science.org/doi/full/10.1126/science.1211649. 10.1126/science.1211649, publisher: American Association for the Advancement of Science .
- (21) Kuang, X. et al. Advances in 4D Printing: Materials and Applications. Advanced Functional Materials 29 (2), 1805290 (2019). URL https://onlinelibrary.wiley.com/doi/abs/10.1002/adfm.201805290. 10.1002/adfm.201805290, _eprint: https://onlinelibrary.wiley.com/doi/pdf/10.1002/adfm.201805290 .
- (22) Thakar, C. M. et al. 3d Printing: Basic principles and applications. Materials Today: Proceedings 51, 842–849 (2022). URL https://www.sciencedirect.com/science/article/pii/S2214785321046575. 10.1016/j.matpr.2021.06.272 .
- (23) Teunis, v. M., Link to external site, t. l. w. o. i. a. n. w., Shahram, J., B, J. K. M. & Zadpoor, A. A. 4D printing of reconfigurable metamaterials and devices. Communications Materials 2 (1) (2021). URL https://www.proquest.com/docview/2536652098/abstract/4CA579280C4A4C09PQ/1. https://doi.org/10.1038/s43246-021-00165-8, place: London, United States Publisher: Nature Publishing Group .
- (24) Dalaq, A. S., Abueidda, D. W., Abu Al-Rub, R. K. & Jasiuk, I. M. Finite element prediction of effective elastic properties of interpenetrating phase composites with architectured 3D sheet reinforcements. International Journal of Solids and Structures 83, 169–182 (2016). URL https://www.sciencedirect.com/science/article/pii/S0020768316000202. 10.1016/j.ijsolstr.2016.01.011 .
- (25) Han, S. C., Choi, J. M., Liu, G. & Kang, K. A Microscopic Shell Structure with Schwarz’s D-Surface. Scientific Reports 7 (1), 13405 (2017). URL https://www.nature.com/articles/s41598-017-13618-3. 10.1038/s41598-017-13618-3, number: 1 Publisher: Nature Publishing Group .
- (26) Jiang, Y. & Wang, Q. Highly-stretchable 3D-architected Mechanical Metamaterials. Scientific Reports 6 (1), 34147 (2016). URL https://www.nature.com/articles/srep34147. 10.1038/srep34147, number: 1 Publisher: Nature Publishing Group .
- (27) Dalaq, A. S., Abueidda, D. W. & Abu Al-Rub, R. K. Mechanical properties of 3D printed interpenetrating phase composites with novel architectured 3D solid-sheet reinforcements. Composites Part A: Applied Science and Manufacturing 84, 266–280 (2016). URL https://www.sciencedirect.com/science/article/pii/S1359835X1600066X. 10.1016/j.compositesa.2016.02.009 .
- (28) Abou-Ali, A. M., Al-Ketan, O., Lee, D.-W., Rowshan, R. & Abu Al-Rub, R. K. Mechanical behavior of polymeric selective laser sintered ligament and sheet based lattices of triply periodic minimal surface architectures. Materials & Design 196, 109100 (2020). URL https://www.sciencedirect.com/science/article/pii/S0264127520306353. 10.1016/j.matdes.2020.109100 .
- (29) Habib, F. N., Iovenitti, P., Masood, S. H. & Nikzad, M. Fabrication of polymeric lattice structures for optimum energy absorption using Multi Jet Fusion technology. Materials & Design 155, 86–98 (2018). URL https://www.sciencedirect.com/science/article/pii/S0264127518304441. 10.1016/j.matdes.2018.05.059 .
- (30) Li, T., Jarrar, F., Abu Al-Rub, R. & Cantwell, W. Additive manufactured semi-plate lattice materials with high stiffness, strength and toughness. International Journal of Solids and Structures 230-231, 111153 (2021). URL https://www.sciencedirect.com/science/article/pii/S0020768321002432. 10.1016/j.ijsolstr.2021.111153 .
- (31) Abueidda, D. W. et al. Effective conductivities and elastic moduli of novel foams with triply periodic minimal surfaces. Mechanics of Materials 95, 102–115 (2016). URL https://www.sciencedirect.com/science/article/pii/S0167663616000053. 10.1016/j.mechmat.2016.01.004 .
- (32) Qureshi, Z. A., Addin Burhan Al-Omari, S., Elnajjar, E., Al-Ketan, O. & Al-Rub, R. A. On the effect of porosity and functional grading of 3D printable triply periodic minimal surface (TPMS) based architected lattices embedded with a phase change material. International Journal of Heat and Mass Transfer 183, 122111 (2022). URL https://www.sciencedirect.com/science/article/pii/S0017931021012175. 10.1016/j.ijheatmasstransfer.2021.122111 .
- (33) Abueidda, D. W., Dalaq, A. S., Abu Al-Rub, R. K. & Jasiuk, I. Micromechanical finite element predictions of a reduced coefficient of thermal expansion for 3D periodic architectured interpenetrating phase composites. Composite Structures 133, 85–97 (2015). URL https://www.sciencedirect.com/science/article/pii/S0263822315005991. 10.1016/j.compstruct.2015.06.082 .
- (34) Baobaid, N., Ali, M. I., Khan, K. A. & Abu Al-Rub, R. K. Fluid flow and heat transfer of porous TPMS architected heat sinks in free convection environment. Case Studies in Thermal Engineering 33, 101944 (2022). URL https://www.sciencedirect.com/science/article/pii/S2214157X22001903. 10.1016/j.csite.2022.101944 .
- (35) Alqahtani, S., Ali, H. M., Farukh, F., Silberschmidt, V. V. & Kandan, K. Thermal performance of additively manufactured polymer lattices. Journal of Building Engineering 39, 102243 (2021). URL https://www.sciencedirect.com/science/article/pii/S2352710221000991. 10.1016/j.jobe.2021.102243 .
- (36) Abueidda, D. W., Elhebeary, M., Shiang, C.-S. A., Abu Al-Rub, R. K. & Jasiuk, I. M. Compression and buckling of microarchitectured Neovius-lattice. Extreme Mechanics Letters 37, 100688 (2020). URL https://www.sciencedirect.com/science/article/pii/S2352431620300596. 10.1016/j.eml.2020.100688 .
- (37) Song, J. et al. Octet-truss cellular materials for improved mechanical properties and specific energy absorption. Materials & Design 173, 107773 (2019). URL https://www.sciencedirect.com/science/article/pii/S0264127519302102. 10.1016/j.matdes.2019.107773 .
- (38) Lakes, R. S. Viscoelastic Solids (CRC Press, 1998). Google-Books-ID: soZZl17sm5IC.
- (39) Ramirez, B. J., Misra, U. & Gupta, V. Viscoelastic foam-filled lattice for high energy absorption. Mechanics of Materials 127, 39–47 (2018). URL https://www.sciencedirect.com/science/article/pii/S0167663617308293. 10.1016/j.mechmat.2018.08.011 .
- (40) Lang, R. J. The science of origami. Physics World 20 (2), 30–31 (2007). URL https://doi.org/10.1088/2058-7058/20/2/31. 10.1088/2058-7058/20/2/31, publisher: IOP Publishing .
- (41) Kresling, B. The Fifth Fold: Complex Symmetries in Kresling-origami Patterns. Symmetry: Culture and Science 31, 403–416 (2020). 10.26830/symmetry_2020_4_403 .
- (42) Dalaq, A. S. & Daqaq, M. F. Experimentally-validated computational modeling and characterization of the quasi-static behavior of functional 3D-printed origami-inspired springs. Materials & Design 216, 110541 (2022). URL https://www.sciencedirect.com/science/article/pii/S0264127522001629. 10.1016/j.matdes.2022.110541 .
- (43) Kresling, B. Origami-structures in nature: lessons in designing “smart” materials. MRS Online Proceedings Library (OPL) 1420 (2012). URL https://www.cambridge.org/core/journals/mrs-online-proceedings-library-archive/article/abs/origamistructures-in-nature-lessons-in-designing-smart-materials/46181BA89E24CE3EFB598B411CBA9D96. 10.1557/opl.2012.536, publisher: Cambridge University Press .
- (44) Khazaaleh, S., Masana, R. & Daqaq, M. F. Combining advanced 3D printing technologies with origami principles: A new paradigm for the design of functional, durable, and scalable springs. Composites Part B: Engineering 236, 109811 (2022). URL https://www.sciencedirect.com/science/article/pii/S1359836822001913. 10.1016/j.compositesb.2022.109811 .
- (45) Zhai, Z., Wang, Y. & Jiang, H. Origami-inspired, on-demand deployable and collapsible mechanical metamaterials with tunable stiffness. Proceedings of the National Academy of Sciences 115 (9), 2032–2037 (2018). URL https://www.pnas.org/doi/10.1073/pnas.1720171115. 10.1073/pnas.1720171115, publisher: Proceedings of the National Academy of Sciences .
- (46) Hunt, G. W. & Ario, I. Twist buckling and the foldable cylinder: an exercise in origami. International Journal of Non-Linear Mechanics 40 (6), 833–843 (2005). URL https://www.sciencedirect.com/science/article/pii/S0020746204001581. 10.1016/j.ijnonlinmec.2004.08.011 .
- (47) The Kresling-Pattern and our origami world (2017). URL https://thekidshouldseethis.com/post/the-kresling-pattern-and-our-origami-world.
- (48) Li, Q. M., Magkiriadis, I. & Harrigan, J. J. Compressive Strain at the Onset of Densification of Cellular Solids. Journal of Cellular Plastics 42 (5), 371–392 (2006). URL https://doi.org/10.1177/0021955X06063519. 10.1177/0021955X06063519, publisher: SAGE Publications Ltd STM .
- (49) Storåkers, B. On material representation and constitutive branching in finite compressible elasticity. Journal of the Mechanics and Physics of Solids 34 (2), 125–145 (1986). URL https://www.sciencedirect.com/science/article/pii/0022509686900335. 10.1016/0022-5096(86)90033-5 .
- (50) Ishida, S., Suzuki, K. & Shimosaka, H. Design and Experimental Analysis of Origami-Inspired Vibration Isolator With Quasi-Zero-Stiffness Characteristic. Journal of Vibration and Acoustics 139 (5) (2017). URL https://doi.org/10.1115/1.4036465. 10.1115/1.4036465 .
- (51) Yasuda, H., Tachi, T., Lee, M. & Yang, J. Origami-based tunable truss structures for non-volatile mechanical memory operation. Nature Communications 8 (1), 962 (2017). URL https://www.nature.com/articles/s41467-017-00670-w. 10.1038/s41467-017-00670-w, number: 1 Publisher: Nature Publishing Group .
- (52) Deleo, A. A., O’Neil, J., Yasuda, H., Salviato, M. & Yang, J. Origami-based deployable structures made of carbon fiber reinforced polymer composites. Composites Science and Technology 191, 108060 (2020). URL https://www.sciencedirect.com/science/article/pii/S0266353819324996. 10.1016/j.compscitech.2020.108060 .
- (53) Butler, J. Highly Compressible Origami Bellows for Harsh Environments. Theses and Dissertations (2017). URL https://scholarsarchive.byu.edu/etd/6657 .
- (54) Liu, Y., Schaedler, T. A. & Chen, X. Dynamic energy absorption characteristics of hollow microlattice structures. Mechanics of Materials 77, 1–13 (2014). URL https://www.sciencedirect.com/science/article/pii/S0167663614001070. 10.1016/j.mechmat.2014.06.008 .
- (55) Duocel. Aluminum foam. URL https://www.duocelfoam.com/product-p/6010-028.htm.
- (56) Mieszala, M. et al. Micromechanics of Amorphous Metal/Polymer Hybrid Structures with 3D Cellular Architectures: Size Effects, Buckling Behavior, and Energy Absorption Capability. Small 13 (8), 1602514 (2017). URL https://onlinelibrary.wiley.com/doi/abs/10.1002/smll.201602514. 10.1002/smll.201602514, _eprint: https://onlinelibrary.wiley.com/doi/pdf/10.1002/smll.201602514 .
- (57) Caserta, G. D., Iannucci, L. & Galvanetto, U. Shock absorption performance of a motorbike helmet with honeycomb reinforced liner. Composite Structures 93 (11), 2748–2759 (2011). URL https://www.sciencedirect.com/science/article/pii/S0263822311002133. 10.1016/j.compstruct.2011.05.029 .
- (58) de Sousa, R. A., Gonçalves, D., Coelho, R. & Teixeira-Dias, F. Assessing the effectiveness of a natural cellular material used as safety padding material in motorcycle helmets. SIMULATION 88 (5), 580–591 (2012). URL https://doi.org/10.1177/0037549711414735. 10.1177/0037549711414735, publisher: SAGE Publications Ltd STM .
- (59) Hutchinson, J. W., Mear, M. E. & Rice, J. R. Crack Paralleling an Interface Between Dissimilar Materials. Journal of Applied Mechanics 54 (4), 828–832 (1987). URL https://doi.org/10.1115/1.3173124. 10.1115/1.3173124, https://asmedigitalcollection.asme.org/appliedmechanics/article-pdf/54/4/828/5459510/828_1.pdf .
- (60) Sharma, D. & Hiremath, S. S. Bio-inspired repeatable lattice structures for energy absorption: Experimental and finite element study. Composite Structures 283, 115102 (2022) .
- (61) Yang, C. & Li, Q. M. Advanced lattice material with high energy absorption based on topology optimisation. Mechanics of Materials 148, 103536 (2020). URL https://www.sciencedirect.com/science/article/pii/S0167663620305780. 10.1016/j.mechmat.2020.103536 .
- (62) Cadman, J., Zhou, S., Chen, Y. & Li, Q. Cuttlebone: characterisation, application and development of biomimetic materials. Journal of Bionic Engineering 9 (3), 367–376 (2012) .
- (63) Stratasys. Feel the difference. Stratasys J750™ Digital Anatomy™ 3D Printer. (2022). URL https://www.stratasys.com/3d-printers/j750-digital-anatomy.
- (64) Stratasys. Tango: A Soft Flexible 3D Printing Material (2018). URL https://www.stratasys.com/en/materials/materials-catalog/polyjet-materials/tango/.
- (65) Object. FullCure® Materials (2009). URL http://svl.wpi.edu/wp-content/uploads/2014/04/FullCure_Letter_low-1.pdf.
- (66) Stratasys. Vero: A Realistic Multi-Color 3D Printing Material - Stratasys (2018). URL https://www.stratasys.com/en/materials/materials-catalog/polyjet-materials/vero/.
- (67) Stratasys. Find Materials and Filaments for 3D Printing (2022). URL https://www.stratasys.com/materials/search.
- (68) Inc, I. T. W. Out of Production 5900 Series Universal Testing Systems; (2020). URL http://www.instron.com/en/products/testing-systems/universal-testing-systems/low-force-universal-testing-systems/5900-series.
- (69) SIMULIA. Abaqus Unified FEA - SIMULIA™ by Dassault Systèmes® (2022). URL https://www.3ds.com/products-services/simulia/products/abaqus/.
- (70) Smith, M. ABAQUS/Standard User’s Manual (Dassault Syst‘emes Simulia Corp, United States, 2019).
- (71) Kim, N.-H. & Sankar, B. V. Introduction to Finite Element Analysis and Design 1st edition edn (Wiley, New York Weinheim, 2008).