Revealing the unseen: Likely half of the Americans relied on others’ experience when deciding on taking the COVID-19 vaccine
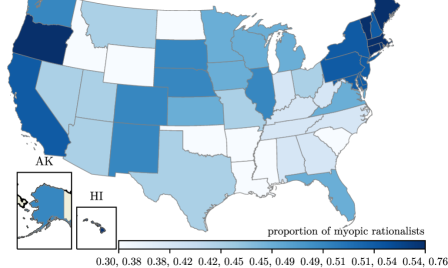
Efficient coverage for newly developed vaccines requires knowing which groups of individuals will accept the vaccine immediately and which will take longer to accept or never accept. Of those who may eventually accept the vaccine, there are two main types: success-based learners, basing their decisions on others’ satisfaction, and myopic rationalists, attending to their own immediate perceived benefit. We used COVID-19 vaccination data to fit a mechanistic model capturing the distinct effects of the two types on the vaccination progress. We estimated that of Americans behaved as myopic rationalists with a high variation across the jurisdictions, from in Mississippi to in Vermont. The proportion was correlated with the vaccination coverage, proportion of votes in favor of Democrats in 2020 presidential election, and education score.
Vaccination is a primary measure to reduce morbidity and mortality of new infectious diseases (?), especially in areas that admit high coverage (?). High vaccination coverage requires high vaccine acceptance–a collective outcome of individual-level decision-making processes (?). Particularly, when facing a new vaccine, people need to decide between the promised immunity followed by potential side-effects associated with accepting the vaccine versus the mortality risk and governmental restrictions of refusing the vaccine. Individuals, however, vary in their decision-making strategies (?, ?, ?), and different strategy compositions can result in different collective outcomes (?), including different vaccination rates and coverage (?, ?). Effective promotion of vaccination benefits from identifying the different types of decision-makers and deploying tailored communication methods.
In various contexts, people are known to be mainly one of the following two decision-making types (?, ?, ?, ?): (i) those who learn from others’ success, particularly, those who take the action of others with a higher payoff, known as success-based learners (?, ?), or imitators (?), and (ii) those who base their decisions on their own perceptions of the environment, often aiming to maximize their instant perceived payoff (?, ?), named myopic rationalists, or best-responders (?). Exclusive populations of myopic rationalists who perceive the social context similarly are likely to reach satisfactory decisions (?) whereas exclusive populations of success-based learners may undergo perpetual changes of decisions (?, ?). Mixed populations of the two may exhibit a wide range of behaviors depending on the proportions (?, ?). Understanding the collective outcome of mixed populations, hence, requires knowing the proportions of success-based learners and myopic rationalists.
The two types of decision makers also differ in the type of information they attend to (?). Myopic rationalists seek information that shapes their payoffs, whereas success-based learners focus on the satisfaction achieved by others. Hence, in addition to providing insights to the vaccination dynamics, knowing the proportions of the two types inform health management and media.
The proportion, however, is unknown and needs to be estimated from data – a yet unaccomplished challenging task. The challenge is mainly because the proportions of decision-makers are unobserved. A natural approach to tackle this problem is to build a mechanistic model with the proportion of decision-makers as a parameter and estimate it by fitting the equations to existing data on measured quantities such as vaccine uptake. However, for this approach to be successful, it must be first shown that such a parameter is identifiable. Several other challenges exist. There may be insufficient detail in data from previous seasonal or relatively old diseases, where decisions were made typically once a year (?, ?) or lifetime (?). Baseline trust regarding a vaccines’ effectiveness and safety may change as an initially distrustful public gradually becomes accustomed to it (?). The resulting hesitancy followed by the desire for immunity results in frequent decision revisions, e.g., on a bi-weekly basis (?). Finally, not all the population may be concerned about the vaccine as can be seen in some previously recorded vaccination programs (?).
The recorded data on COVID-19 in the US provides a unique opportunity to tackle each of these challenges. Although the proportion is unobservable, the two decision-making groups have different vaccination paces and differently shape the vaccination progress curve, which is observable. Indeed, we prove that the proportion of myopic rationalists is an identifiable parameter. Hence, by fitting the collective decision-making dynamics of the two types to vaccination data, we can estimate the proportion and use bootstrapping methods to obtain confidence intervals. Owing to the importance of timely vaccination and thanks to the advancement of technology, the vaccination data are available on a daily basis (?). The changes in baseline attitude toward the vaccine’s side effects were captured through longitudinal surveys (?). Moreover, almost every resident had to decide on vaccination (?).
Our objective was to estimate the proportions of myopic rationalists and success-based learners in each of the 50 states of the US and the District of Columbia (D.C.) separately, in deciding whether to take first dose of COVID-19 vaccination. We excluded later doses as they are influenced by the experience in the first dose (?). We developed a mechanistic model to capture the behavior of the two types of interacting individuals augmented by a third group vaccine refusers, those a priori known to refuse the vaccine based on surveys (?). A fixed parameter () was used as the proportion of myopic rationalists in the population in each jurisdiction. The perceived excess payoff of vaccination is shaped by the epidemiological conditions represented by weekly cases and deaths, the risk of vaccine side effects, and the social and governmental pressure on unvaccinated individuals.
Results
Our fitting results suggested that () of Americans aged years and above behaved as myopic rationalists in receiving the first dose of COVID-19 vaccine, i.e., about millions out of million Americans, an equal proportion acted as success-based learners, and the remaining were COVID-19 vaccine refusers. The estimated percentage of rationalists across the US varied from in Mississippi to in Vermont (Fig. 1). In fifteen states, myopic rationalists composed more than of residents.
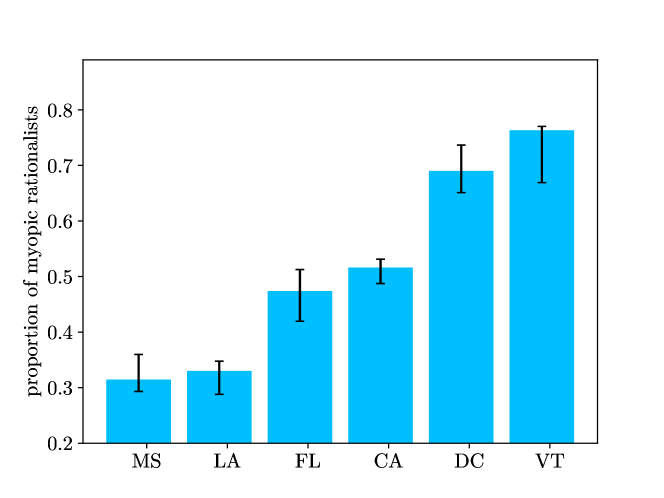
To ensure that the estimations were as robust as possible, we reported the confidence intervals (CIs) obtained from non-parametric bootstrapping as they resulted in larger CIs than parametric bootstrapping (Table S1). The length of CI of the proportion of myopic rationalists was or less for all jurisdictions (Table S1). For 20 states, the upper limit of the CI was lower than the estimated proportion across the US, i.e., , as well as the estimated proportions of 25 other states, implying a significant difference in the proportions. Particularly, the proportions of 46 states including California and Florida fell between the upper confidence limit of Mississippi, the state with the lowest proportion and the lower confidence limit of Vermont, the state with the greatest proportion (Fig. 2).
As of November 2021, all eligible American myopic rationalists were vaccinated. Success-based learners had lower vaccine coverage. While in all jurisdictions more than half of the imitators received at least one dose of a COVID-19 vaccine, in no jurisdiction were they all vaccinated.
The weekly number of vaccinated individuals, particularly rationalists, was greatly influenced by the vaccine doses available during the first months of vaccine rollout which was due to vaccine supply limitations (Fig. 3A, B, D, E). The changes in the perceived benefit of vaccination in some states were negligible compared to other states (Fig. 3C, F, Figs. S2-S26).
The proportion of myopic rationalists was correlated with the vaccination coverage, proportion of votes in favor of Democrats in the 2020 presidential election, and education score (Table 1–see Table S2 for the correlation with the other explanatory variables). The proportion of myopic rationalists was not highly correlated with the accessibility to the vaccination facilities (Table 1–last two rows). We evaluated the impact of each model component on the fitting results. The averaged residual sum of the squares (RSS) over all jurisdictions increased if any of the components were altered. More specifically, by assuming a fully myopically rational population (), the RSS increased by , whereas a population of success-based learners (), resulted in an increase of . To investigate the effect of the possible delay in delivering the vaccine doses compared to what was reported in the data, we introduced a 3-day delay based on California vaccine distribution plan (?). The estimated composition of myopic rationalists and success-based learners at the state level was fairly insensitive to the introduced delay. More specifically, the variations in the estimated proportion of myopic rationalists were less than (see Table S3).
| Predictor variable | Pearson-r | R-squared |
| Vaccination coverage | ||
| Proportion of votes in favor of Democrats | ||
| Education score | ||
| Proportion of people living further than 10 miles from vaccination facilities | ||
| \hdashline[0.5pt/5pt] Density of vaccination facilities |
Discussion
We considered vaccination coverage as a collective outcome resulting from decisions of individuals that are known to be mainly either myopic rationalists or success-based learners. Although crucial to the vaccination dynamics, the proportion of the two types of decision makers has to date been unknown and not measured directly. We tackled this problem by developing a mechanistic model capturing the evolution of vaccinated population with fixed ratios of the two types of decision-makers in the context of vaccine uptake. We additionally considered a third type of vaccine refusers who never intended to be vaccinated. By fitting the model to data on the number of first-dose COVID-19 vaccinated individuals in the US, we found that, excluding the vaccine refusers, about half of the Americans behaved as myopic rationalists, and half as success-based learners. The results may inform health management and guide tailored communication towards promoting vaccination uptake.
The main challenge in this work was how to estimate this unobserved proportion of myopic rationalists. We took the natural approach of building a mechanistic model with the proportion of decision-makers as a hidden parameter and then estimated it by fitting the equations to existing data on observed quantities such as vaccine uptake. However, there are two potential drawbacks with this approach. First, there could be parameter identifiability issues, resulting in a low estimation confidence. We tackled this issue by proving that the proportion of myopic rationalists is an identifiable parameter that can be uniquely estimated.
The fact that the proportion is identifiable implies that it can be estimated using a sufficiently rich dataset, which appeared to be the case for our study due to the sufficiently narrow confidence intervals. As the fitting errors did not follow a normal distribution and were temporally correlated, the confidence intervals could not be obtained based on the common assumption of independence and normally distribution. We addressed this issue by using non-parametric bootstrapping methods and applying an auto-regression to reduce the temporal correlation.
The second drawback is that even with a unique solution, there may be other possible models for the observed human behaviour. Alternative explanations of the vaccine uptake trends could be a population consisting of (i) multiple groups of success-based learners with different learning rates, (ii) multiple groups of myopic rationalists with different uptake rate, and (iii) multiple groups of both success-based learners learning at different rates and myopic rationalists with different uptake rates who are interacting. The first two hypotheses, however, ignore the evidence from other studies of the coexistence of success-based learners and myopic rationalists. Indeed, the dichotomy of decision-making populations has been acknowledged in previous vaccination studies (?, ?) as well as other contexts, such as marketing, psychology, and cultural evolution (?, ?, ?, ?, ?, ?). A population with multiple groups of both decision-makers is likely to be more realistic. Despite this, we have considered the simplest model that includes both myopic rationalists and success-based learners and the more complex models are left for future work.
The proportion of the two types of decision-makers has not been estimated in previous vaccination studies; only homogeneous models have been fitted to data (?, ?). Some marketing studies estimated the relative proportion of the two types in adopting several products using the Bass model (?, ?, ?). Our work complements these studies in that (i) rather than estimating the proportion among the final adopters, we estimated the proportion in the whole population, including unvaccinated individuals, (ii) we considered the influence of time-varying variables including epidemiological indices, and the perceived risk associated with vaccine side effects, (iii) we incorporated supply limitation in the model, and (iv) we showed that the proportions of these decision-makers are identifiable.
We found that myopic rationalists greatly determined the evolution of the number of weekly vaccinated individuals (vaccination speed) during the first months of the vaccine roll-out – a crucial factor in the success of vaccination programs (?, ?, ?). In later months, the vaccination speed was mainly determined by success-based learners. Considering the excess payoff formulation, the only factor capable of inducing a negative excess payoff is the perceived risk associated with side effects. This factor, however, according to a longitudinal survey, declines over time (?). This suggests that once vaccination has a higher payoff than remaining unvaccinated, which was the case during the first months, all myopic rationalists tended to take the vaccine–the only limiting factor being vaccine availability. Although success-based learners also tended to take the vaccine once the excess payoff is positive, they based their decisions on others’ success, determined by the magnitude of the excess payoff and the number of vaccinated individuals. Hence, they tend to delay vaccination during the first months of the vaccine roll-out but exhibit a higher vaccination speed when many are vaccinated and available to imitate.
Myopic rationalists also greatly determined the vaccination coverage – another key factor in the success of vaccination programs (?). Our findings suggest that as of November 2021, all American rationalists have received their first dose of vaccine and consequently, excluding the vaccine refusers, those who remained unvaccinated were success-based learners.
The results suggest the proportion of success-based learners as a factor behind the collective vaccination behavior and contributing to the success of mass vaccination programs. The beginning of vaccination programs may mainly address access issues to expedite vaccination among myopic rationalists. Later on, vaccine-promoting interventions should be tailored to success-based learners to increase their perceived benefit of vaccination. The initiation of this second phase depends on the composition of the decision-makers, i.e., the more success-based learners in the population, the sooner the second phase should be initiated.
We observed high variations in the estimated proportion of myopic rationalists across the US jurisdiction, ranging from to . The result is in line with studies highlighting the variation of different indices throughout the states (?, ?). The delivered doses in the first months shaped the number of vaccinated rationalists. However, the variation may not be attributed to vaccine supply disparity, because the doses were distributed proportionally to the state populations (?).
There are candidate factors to explain the inter-state differences in the ratio of myopic rationalists and success-based learners. The proportion of myopic rationalists was positively correlated with the vaccination coverage (Pearson-r = ). The proportion of myopic rationalists was also positively correlated with the proportion of votes in favor of Democrats in 2020 presidential election (Pearson-r = ). These findings are then consistent with the known relation between vaccination coverage and 2020 presidential election outcome (?). The ratio of myopic rationalists was also positively associated with education score. In view of the correlation between the ratio of myopic rationalists and vaccination coverage, this is indirectly corroborated by studies suggesting American adults with less education being less likely to receive the vaccine (?, ?).
Our model shows how interactions between myopic rationalist and success-based learner groups have determined the course of the vaccination for COVID-19 in the United States. Admittedly, true population could have additional heterogeneities, where different age, gender, or socio-economic status groups have different perception of the payoff (?, ?, ?). The extension of the model to capture this heterogeneity is subject to future work. Another limitation of this work comes from assuming a well-mixed population rather than the more realistic structured population as supported by Twitter echo-chambers (?). This assumption may not greatly affect myopic rationalists as important information about the excess payoff is often obtained from and shared by all reputable and publicly accessible news agencies. In the same way, online influencers – usually perceived as the most successful – make the interactions of success-based learners more well-mixed than structured (?). Overall, while acknowledging the aforementioned limitations, the results of this study provide strong evidence that the COVID-19 vaccine uptake dynamics were determined by interactions between myopic rationalists and success-based learners and at least half of the Americans relied on the success of others in taking COVID-19 vaccine.
![[Uncaptioned image]](/html/2304.09931/assets/x3.png)
Materials and Methods
Data
To calculate the cumulative number of available COVID-19 vaccine doses for administering the first shot, we used the temporal data on the number of delivered doses to each jurisdiction’s provider locations. The data were available on the website of Centers for Disease Control and Prevention (CDC) (?) and captured the last part of the vaccine distribution process (?). To avoid double-counting, the numbers of individuals completing the primary series of a two-dose vaccine, receiving the first and the second booster doses were subtracted from the data. In all jurisdictions across the US, the decision whether to vaccinate children under the age of 12 was left up to their guardians. Hence, we narrowed the population to those of 12 years and older. As the emergency authorization of vaccinating children of age 5 through 11 was issued on late October, 2021, we set October 30, 2021 as the last day of the dataset (?).
December 14, 2020 was selected as the starting date. Daily data on the total number of individuals who received their first dose, the number of individuals who completed the primary course of vaccination, and the number of individuals who received their first and second booster doses were collected from (?). State level data on daily new cases and deaths were obtained from (?). The negative values were replaced with zero and then we replaced zero new cases with their immediate non-zero values in the next day. We converted the temporal scale from daily to weekly. The state-wide estimated proportion of COVID-19 vaccine refusers was obtained from (?) (see SI).
To estimate the trend of reduction in perceived risk of vaccine side-effects, we used the data collected by the US Census Bureau (?). To determine the start date at which containment, closure or health policies differentiated based individuals’ vaccination status, we used the US sub-national data available in (?). The data on state level population by age was obtained from (?).
We additionally explored a number of features that could possibly relate to the proportions of success-based learners and rationalists. We collected data on votes in favor of each political party from (?), income per capita and proportion of people below the poverty line from (?), state-level education score from (?), proportion of population with driving distance greater than 10 miles to the closest vaccination facility and density of potential vaccination facilities from (?, ?), age, sex distribution, education level distribution, number of intensive care unit beds, ventilator capacity and percent insured residents, meat plants, religious congregation ratio and immigrant student ratio from (?).
Model Formulation
For each jurisdiction, we considered a large fixed population of interacting individuals of which an unknown fixed portion are myopic rationalists, a known fixed portion (refer to SI, Section Data) are COVID-19 vaccine refusers and the remainder are success-based learners. The individuals decide based on the conceived excess payoff of receiving a vaccine defined by
| (1) |
where and are the weekly number of confirmed cases and deaths from COVID-19 as a function of time. The conceived excess payoff of vaccination comprises of three terms: First, the quantity is the perceived benefit of vaccination in the absence of confirmed cases or deaths and is equal to the perceived socio-economic benefit of vaccination, minus the perceived risk of vaccine associated side-effects, . Second, the perceived vaccine-induced risk reduction of dying from COVID-19, , that is the perceived cost of dying, times the perceived effectiveness of the first dose, multiplied by , which is the perceived chance of death from COVID-19. Third, the perceived vaccine-induced risk reduction of COVID-19 infection is defined similarly as . According to Household Pulse survey, a longitudinal survey conducted by Census Bureau, the perceived risk of vaccine associated side-effects declines over time (?). Our fitting result indicates that this decreasing trend can be best described by a power law function of the form (see SI). Hence, is replaced with where is a free parameter (see SI). The perceived socio-economic benefit of vaccination is modeled by a free parameter, .
The myopic rationalists follow the best-response dynamics (?), that is, they compare the payoff to vaccination with that of remaining unvaccinated and choose to get vaccinated if the excess payoff is positive, i.e., . The success-based learners, however, base their decisions on their interactions with others in the population: Upon an interaction, they compare their own payoff with those of others. If the others have a higher payoff, the success-based learner imitates their decisions with a probability proportional to the excess payoff. The individuals may update their decisions over vaccination independently at an exponential rate, or over discrete periods of time. In either case, the collective decision making process can be approximated by the mean dynamics (?), which we do in (4) and (5). Focusing on the first dose, the vaccinated people never change their strategies.
Let (resp. ) denote the number of vaccinated myopic rationalists (resp. success-based learners). Similarly, define (resp. ) as the number of unvaccinated myopic rationalists (resp. success-based learners). Let (resp. ) denote the number of vaccine-seeker myopic rationalists (resp. success-based learners) that is those who are unvaccinated and want to receive a dose of vaccine. The number of vaccine-seeker myopic rationalists (resp. success-based learners) will be (resp. ), where (resp. ) denotes the proportion of unvaccinated myopic rationalists (resp. success-based learners) who are vaccine-seekers, which is influenced by the number and payoffs of vaccinated and unvaccinated individuals. Inspired by (?), the proportion of success-based learners who are vaccine seeker is , where denotes the cumulative number of vaccinated individuals up to time , which is equal to . Therefore, denotes the probability that an unvaccinated success-based learner meets a vaccinated individual. The term is proportional to the probability of being a vaccine-seeker after interacting with a vaccinated individual. A pairwise proportional comparison form is considered for , i.e., , where equals if and equals zero otherwise, and is the constant of proportionality (?). In other words, if the vaccinated individuals’ payoff is higher, i.e., , the success-based learners will be vaccine-seeker with a probability proportional to . The proportion of vaccine-seeker rationalists can be written as , where is the Heaviside function, which equals one for a positive argument and zero otherwise. The number of non vaccine-refusers is denoted by , which equals to the total non-hesitant population aged 12 years and above. The number of success-based learners then equals , where . By subtracting the number of vaccinated success-based learners , we obtain the number of unvaccinated success-based learners, . Similarly, the number of unvaccinated myopic rationalists, , equals from which the number of vaccinated rationalists is subtracted. The number of vaccine-seeker success-based learners at time is then
| (2) |
Similarly, for the myopic-rationalists we have,
| (3) |
Providing there are sufficient vaccine doses, each vaccine seeker can get vaccinated. In the presence of vaccine limitation, however, not all vaccine seekers can be inoculated at once. The available doses are then assigned randomly to the vaccine seekers of each group of decision-making types. The per capita available vaccine doses for vaccine-seekers can be formulated as where denotes the number of available doses at time for the first shot and represents the total demand for vaccination at time . Having simply means that given the available doses, each vaccine seeker has the opportunity to receive the vaccine. the rate of change of vaccinated success-based learners can be written as
| (4) |
where represents the vaccination rate. Similarly, for the rate of change of vaccinated myopic rationalists, we have
| (5) |
Both types of decision-makers share the same excess payoff function (1). The excess payoff function, however, impacts each group differently. Myopic rationalists verify whether the payoff of vaccination is higher than the that of remaining unvaccinated and if so proceed to vaccination immediately, although their vaccination rate will be affected by capturing, e.g., the limitation in facilities. Contrary to myopic rationalists, success-based learners are influenced by the value of the excess payoff.
Parameter Estimation
In Proposition 1 in the SI, we proved the identifiability of all parameters of the equations (2), (3), (4), and (5) that govern the evolution of the number of vaccinated individuals. The parameters were estimated by fitting the derived equations to time series data. The actual effectiveness of the first dose in death prevention was estimated to be (?). Its perceived effectiveness was set equal to and the cost of dying from COVID-19 was chosen to be (the highest possible value), which resulted in . For each jurisdiction, the valid interval for was capped at to limit the impact of morbidity on the excess payoff by that of mortality. The valid intervals for and were then capped at . The valid interval for was set to . The constant of proportionality, , was bounded at . A time-varying was also considered to capture possible impacts of differentiating policies based on vaccination on the perceived excess payoff of vaccination. In this regard, is allowed to be varying over the time following a piece-wise-linear function–Fig S1. A time-varying was captured by three additional parameters, i.e., , and . More specifically, as of the announcement date of the differentiating policies, a linear increment in the perceived cost of remaining unvaccinated is introduced with a start value, , inclination, , and the peak value , as free parameters. The increment was then followed by a linear reduction whose inclination was a free parameter denoted by .
The initial conditions, , were set to zero. The power law exponent, , was determined using the available data on Americans’ concern about vaccine side-effect (see SI). We fit the model to the reported number of weekly newly vaccinated individuals, i.e., with . The error function was chosen to be the residual sum of squares, i.e., , where denotes the estimated number of those who received their first dose of COVID-19 vaccine at time . The error was minimized using the dual annealing optimization algorithm (?) and its Python implementation (?). We obtained the confidence intervals of the estimated parameters using both parametric and non-parametric bootstrapping approaches. Following (?) bootstrapped datasets were synthesized. For implementing the parametric bootstrap, for each time , we assumed a Poisson error structure whose mean was the estimated number of newly vaccinated individuals at . For each bootstrapped dataset, the number of newly vaccinated individuals at time was drawn from the constructed Poisson distribution for week (?). To synthesize the datasets based on the non-parametric approach, due to serial correlation between residual data points, an auto-regressive model was constructed and out of the resultant uncorrelated residuals, time-series were drawn with replacements (?); see SI for more details. The confidence interval then was calculated using the percentile approach (?). After inferring the parameters of the excess payoff function with a time-varying , it turned out that this imposes high variability in the estimated parameters (Tables S17-S24), hence, we modeled as a constant free parameter. In addition, it turned out that although is identifiable, its point estimate is not reliable (Table S16). Hence, it is set to one. Fixing the constant of proportionality to one, did not, however, impact the estimated value of our parameter of interest, i.e., . More specifically, the percentage of variations in the estimated was less than for all jurisdictions.
Correlation with Explanatory Variables
The linear correlations between possible explanatory variables and the estimated proportion of people who behaved like myopic rationalists in taking the first dose of COVID-19 vaccine, were investigated. There was insufficient data available for the D.C. across most potential explanatory variables. Additionally, the distribution of the proportion of myopic rationalists did not follow a normal distribution, as indicated by the Shapiro test. The distribution, however, became normal by excluding the D.C. and the state of Vermont. Consequently, these two jurisdictions were excluded from the linear regression analysis. For linear correlation, we used Pearson-r coefficient and the simple linear regression was performed using the Python implementation of Ordinary Least Squares (?).
Acknowledgments
Funding: The project was funded by Emerging Infectious Disease Modelling Program (NSERC, CANMOD) and Brock University.
Competing interests: Authors declare that they have no competing interests.
References
- 1. D.-Y. Lin, Y. Gu, B. Wheeler, H. Young, S. Holloway, S.-K. Sunny, Z. Moore, and D. Zeng, “Effectiveness of covid-19 vaccines over a 9-month period in north carolina,” New England Journal of Medicine, vol. 386, no. 10, pp. 933–941, 2022.
- 2. “Strategy to achieve global Covid-19 vaccination by mid-2022,” online, 2021, World Health Organization, (Accessed Dec 20 2022). https://www.who.int/publications/m/item/strategy-to-achieve-global-covid-19-vaccination-by-mid-2022.
- 3. “Report of the SAGE working group on vaccine hesitancy,” 2014, SAGE Working Group on Vaccine Hesitancy, (Accessed Nov 25 2022). https://www.asset-scienceinsociety.eu/sites/default/files/sage_working_group_revised_report_vaccine_hesitancy.pdf.
- 4. L. Molleman, P. Van den Berg, and F. J. Weissing, “Consistent individual differences in human social learning strategies,” Nature Communications, vol. 5, no. 1, pp. 1–9, 2014.
- 5. U. Toelch, M. J. Bruce, L. Newson, P. J. Richerson, and S. M. Reader, “Individual consistency and flexibility in human social information use,” Proceedings of the Royal Society B: Biological Sciences, vol. 281, no. 1776, p. 20132864, 2014.
- 6. A. Mesoudi, “An experimental comparison of human social learning strategies: payoff-biased social learning is adaptive but underused,” Evolution and Human Behavior, vol. 32, no. 5, pp. 334–342, 2011.
- 7. C. Van den Bulte and Y. V. Joshi, “New product diffusion with influentials and imitators,” Marketing science, vol. 26, no. 3, pp. 400–421, 2007.
- 8. M. L. Ndeffo Mbah, J. Liu, C. T. Bauch, Y. I. Tekel, J. Medlock, L. A. Meyers, and A. P. Galvani, “The impact of imitation on vaccination behavior in social contact networks,” PLoS computational biology, vol. 8, no. 4, p. e1002469, 2012.
- 9. “COVID-19 Vaccinations in the United States,” online, 2023, COVID Data Tracker, (Accessed July 2023). https://covid.cdc.gov/covid-data-tracker/vaccinations-vacc-people-onedose-pop-12yr.
- 10. F. M. Bass, “A new product growth for model consumer durables,” Management science, vol. 15, no. 5, pp. 215–227, 1969.
- 11. S. M. Tanny and N. A. Derzko, “Innovators and imitators in innovation diffusion modelling,” Journal of Forecasting, vol. 7, no. 4, pp. 225–234, 1988.
- 12. R. McElreath, A. V. Bell, C. Efferson, M. Lubell, P. J. Richerson, and T. Waring, “Beyond existence and aiming outside the laboratory: estimating frequency-dependent and pay-off-biased social learning strategies,” Philosophical Transactions of the Royal Society B: Biological Sciences, vol. 363, no. 1509, pp. 3515–3528, 2008.
- 13. P. van den Berg, L. Molleman, and F. J. Weissing, “Focus on the success of others leads to selfish behavior,” Proceedings of the National Academy of Sciences, vol. 112, no. 9, pp. 2912–2917, 2015.
- 14. M. Pingle, “Imitation versus rationality: An experimental perspective on decision making,” The Journal of Socio-Economics, vol. 24, no. 2, pp. 281–315, 1995. [Online]. Available: https://www.sciencedirect.com/science/article/pii/1053535795900233
- 15. Y. M. Kaniovski, A. V. Kryazhimskii, and H. Young, “Adaptive dynamics in games played by heterogeneous populations,” Games and Economic Behavior, vol. 31, no. 1, pp. 50–96, 2000. [Online]. Available: https://www.sciencedirect.com/science/article/pii/S0899825699907364
- 16. P. Ramazi, J. Riehl, and M. Cao, “Networks of conforming or nonconforming individuals tend to reach satisfactory decisions,” Proceedings of the National Academy of Sciences, vol. 113, no. 46, pp. 12 985–12 990, 2016.
- 17. ——, “The lower convergence tendency of imitators compared to best responders,” Automatica, vol. 139, p. 110185, 2022.
- 18. H. Le and P. Ramazi, “Heterogeneous mixed populations of best-responders and imitators: Equilibrium convergence and stability,” IEEE Transactions on Automatic Control, vol. 66, no. 8, pp. 3475–3488, 2020.
- 19. S. Moore, E. M. Hill, M. J. Tildesley, L. Dyson, and M. J. Keeling, “Vaccination and non-pharmaceutical interventions for covid-19: a mathematical modelling study,” The Lancet Infectious Diseases, vol. 21, no. 6, pp. 793–802, 2021.
- 20. “Who needs a flu vaccine,” online, 2022, Centers for Disease Control and Prevention, National Center for Immunization and Respiratory Diseases, (Accessed Dec 25 2022). https://www.cdc.gov/flu/prevent/vaccinations.htm.
- 21. J. Cohen, “Waning immunity,” Science, vol. 364, no. 6437, pp. 224–227, 2019. [Online]. Available: https://www.science.org/doi/abs/10.1126/science.364.6437.224
- 22. T. Beleche, J. Ruhter, A. Kolbe, J. Marus, L. Bush, and B. Sommers, “Covid-19 vaccine hesitancy: demographic factors, geographic patterns, and changes over time,” Published online, vol. 27, 2021.
- 23. “Weekly Flu Vaccination Dashboard,” online, 2023, Centers for Disease Control and Prevention, (Accessed August 2023). https://www.cdc.gov/flu/fluvaxview/dashboard/vaccination-dashboard.html.
- 24. T. Hale, N. Angrist, R. Goldszmidt, B. Kira, A. Petherick, T. Phillips, S. Webster, E. Cameron-Blake, L. Hallas, S. Majumdar et al., “A global panel database of pandemic policies (oxford covid-19 government response tracker),” Nature human behaviour, vol. 5, no. 4, pp. 529–538, 2021.
- 25. “Household Pulse Survey Public Use File,” Online, 2022, United State Census Bureau, (Accessed Oct 24 2022). https://www.census.gov/programs-surveys/household-pulse-survey/datasets.html.
- 26. “Coronavirus (COVID-19) Update: FDA Authorizes Moderna and Pfizer-BioNTech COVID-19 Vaccines for Children Down to 6 Months of Age,” online, 2022, U.S. Food and Drug Administration, (Accessed Nov 26 2022). https://www.fda.gov/news-events/press-announcements/coronavirus-covid-19-update-fda-authorizes-moderna-and-pfizer-biontech-covid-19-vaccines-children.
- 27. A. Karaivanov, D. Kim, S. E. Lu, and H. Shigeoka, “Covid-19 vaccination mandates and vaccine uptake,” Nature Human Behaviour, pp. 1–10, 2022.
- 28. “Vaccine hesitancy for COVID-19: State, county, and local estimates,” online, 2021, Office of the assistant secretary for planning and evaluation,(Accessed Nov, 2022). https://aspe.hhs.gov/reports/vaccine-hesitancy-covid-19-state-county-local-estimates.
- 29. “Ordering and distribution cadence calendar,” online, 2022, California Department of Public Health, (Accessed Dec 25 2022). https://eziz.org/assets/docs/COVID19/IMM-1360.pdf.
- 30. A. d’Onofrio, P. Manfredi, and P. Poletti, “The interplay of public intervention and private choices in determining the outcome of vaccination programmes,” PLoS ONE, 2012.
- 31. V. Mahajan, E. Muller, and F. M. Bass, “New product diffusion models in marketing: A review and directions for research,” Journal of marketing, vol. 54, no. 1, pp. 1–26, 1990.
- 32. A. Mesoudi, L. Chang, K. Murray, and H. J. Lu, “Higher frequency of social learning in china than in the west shows cultural variation in the dynamics of cultural evolution,” Proceedings of the Royal Society B: Biological Sciences, vol. 282, no. 1798, p. 20142209, 2015.
- 33. A. Metz and T. Shultz, “Spatial factors in social and asocial learning,” in Proceedings of the Annual Meeting of the Cognitive Science Society, vol. 32, no. 32, 2010.
- 34. C. T. Bauch and S. Bhattacharyya, “Evolutionary game theory and social learning can determine how vaccine scares unfold,” PLoS computational biology, vol. 8, no. 4, p. e1002452, 2012.
- 35. M. C. Mills and T. Rüttenauer, “The effect of mandatory covid-19 certificates on vaccine uptake: synthetic-control modelling of six countries,” The Lancet Public Health, vol. 7, no. 1, pp. e15–e22, 2022.
- 36. H. Cavusoglu, N. Hu, Y. Li, and D. Ma, “Information technology diffusion with influentials, imitators, and opponents,” Journal of Management Information Systems, vol. 27, no. 2, pp. 305–334, 2010.
- 37. M. H. Nia, Social big data analytics of consumer choices: a two sided online platform perspective. The University of Texas at Dallas, 2016.
- 38. D. Kim, P. Keskinocak, P. Pekgün, and I. Yildirim, “The balancing role of distribution speed against varying efficacy levels of covid-19 vaccines under variants,” Scientific reports, vol. 12, no. 1, pp. 1–8, 2022.
- 39. M. J. Smith, “What constitutes success in the roll-out of covid-19 vaccines?” The Lancet, vol. 398, no. 10295, pp. 115–116, 2021.
- 40. K. P. Reddy, K. P. Fitzmaurice, J. A. Scott, G. Harling, R. J. Lessells, C. Panella, F. M. Shebl, K. A. Freedberg, and M. J. Siedner, “Clinical outcomes and cost-effectiveness of covid-19 vaccination in south africa,” Nature communications, vol. 12, no. 1, pp. 1–10, 2021.
- 41. A. Christie, J. T. Brooks, L. A. Hicks, E. K. Sauber-Schatz, J. S. Yoder, M. A. Honein, C. COVID, and R. Team, “Guidance for implementing covid-19 prevention strategies in the context of varying community transmission levels and vaccination coverage,” Morbidity and mortality weekly report, vol. 70, no. 30, p. 1044, 2021.
- 42. M. Adam, “Most and Least Innovative States in America,” online, 2022, (Accessed: Dec 22 2022). https://wallethub.com/edu/most-innovative-states/31890.
- 43. E. Falcettoni and V. M. Nygaard, “A comparison of living standards across the states of america,” Finance and Economics Discussion Series, 2020.
- 44. N. Singer, “Where do vaccine doses go, and who gets them? the algorithms decide,” Online, 2021, the New York Times, (Accessed Dec 23 2022). https://www.nytimes.com/2021/02/07/technology/vaccine-algorithms.html.
- 45. J. Kates, J. Tolbert, and R. Anna, “The red/blue divide in covid-19 vaccination rates continues: An update,” Online, 2022, kaiser Family Foundation, (Accessed April 19 2023). https://https://www.kff.org/policy-watch/the-red-blue-divide-in-covid-19-vaccination-rates-continues-an-update/.
- 46. K. H. Nguyen, A. Srivastav, H. Razzaghi, W. Williams, M. C. Lindley, C. Jorgensen, N. Abad, and J. A. Singleton, “Covid-19 vaccination intent, perceptions, and reasons for not vaccinating among groups prioritized for early vaccination—united states, september and december 2020,” pp. 1650–1656, 2021.
- 47. N. Ndugga, L. Hill, S. Artiga, and S. Haldar, “Latest data on covid-19 vaccinations by race/ethnicity,” Kais Family Found, 2021.
- 48. R. Saelee, E. Zell, B. P. Murthy, P. Castro-Roman, H. Fast, L. Meng, L. Shaw, L. Gibbs-Scharf, T. Chorba, L. Q. Harris et al., “Disparities in covid-19 vaccination coverage between urban and rural counties—united states, december 14, 2020–january 31, 2022,” Morbidity and Mortality Weekly Report, vol. 71, no. 9, p. 335, 2022.
- 49. “Summary who sage conclusions and recommendations on vaccine hesitancy,” 2015.
- 50. A. Cossard, G. D. F. Morales, K. Kalimeri, Y. Mejova, D. Paolotti, and M. Starnini, “Falling into the echo chamber: the italian vaccination debate on twitter,” in Proceedings of the International AAAI conference on web and social media, vol. 14, 2020, pp. 130–140.
- 51. “Social Networks Have Made the World Smaller — But Not Simpler,” online, 2019, The Wharton School, (Accessed July 2023). https://www.wharton.upenn.edu/story/social-networks-have-made-the-world-smaller-but-not-simpler/.
- 52. “COVID-19 vaccinations in the United states,jurisdiction,” Online, 2022, Centers for Disease Control and Prevention, (Accessed Sep 29 2022). https://data.cdc.gov/Vaccinations/COVID-19-Vaccinations-in-the-United-States-Jurisdi/unsk-b7fc.
- 53. “Data Definitions for COVID-19 Vaccinations in the United States,” Online, 2023, Centers for Disease Control and Prevention, (Accessed Feb 1 2023). https://www.cdc.gov/coronavirus/2019-ncov/vaccines/reporting-vaccinations.html.
- 54. “FDA Authorizes Pfizer-BioNTech COVID-19 Vaccine for Emergency Use in Children 5 through 11 Years of Age,” online, 2021, U.S. Food and Drug Administration, (Accessed July 2023). https://www.fda.gov/news-events/press-announcements/fda-authorizes-pfizer-biontech-covid-19-vaccine-emergency-use-children-5-through-11-years-age.
- 55. “COVID-19 vaccination trends in the United States, national and jurisdictional,” Online, 2022, Centers for Disease Control and Prevention, (Accessed Sep 29 2022). https://data.cdc.gov/Vaccinations/COVID-19-Vaccination-Trends-in-the-United-States-N/rh2h-3yt2.
- 56. “United States COVID-19 cases and deaths by state over time,” Online, 2022, Centers for Disease Control and Prevention, (Accessed Sep 29 2022) https://data.cdc.gov/Case-Surveillance/United-States-COVID-19-Cases-and-Deaths-by-State-o/9mfq-cb36.
- 57. “2019 Population Estimates by Age, Sex, Race and Hispanic Origin,” online, 2019, United State Census Bureau, (Accessed Sep 22 2022). https://www.census.gov/newsroom/press-kits/2020/population-estimates-detailed.html.
- 58. “U.S. President 1976–2020,” 2017, mIT Election Data and Science Lab. [Online]. Available: https://doi.org/10.7910/DVN/42MVDX
- 59. “Cdc/atsdr social vulnerability index,” Online, 2022, agency for Toxic Substances and Disease Registry, (Accessed Dec 25 2022). https://www.atsdr.cdc.gov/placeandhealth/svi/index.html.
- 60. M. Adam, “Most and Least Educated States in America,” online, 2022.
- 61. L. A. Berenbrok, S. Tang, K. C. Coley, C. Boccuti, S. Dickson, and I. Hernandez, “Access to potential covid-19 vaccine administration facilities: a geographic information systems analysis,” Report. University of Pittsburgh School of Pharmacy, 2021.
- 62. L. A. Berenbrok, S. Tang, K. C. Coley, C. Boccuti, J. Guo, U. R. Essien, S. Dickson, and I. Hernandez, “VaxMap 2.0: West Health Policy Center and University of Pittsburgh School of Pharmacy Develop County-Level Map of Potential COVID-19 Vaccine Locations,” online, 2021, (Accessed: Sep 09 2022). https://www.westhealth.org/resource/vaxmap-potential-covid-19-vaccine-locations/. [Online]. Available: https://www.westhealth.org/resource/vaxmap-potential-covid-19-vaccine-locations/
- 63. A. Haratian, H. Fazelinia, Z. Maleki, P. Ramazi, H. Wang, M. A. Lewis, R. Greiner, and D. Wishart, “Dataset of covid-19 outbreak and potential predictive features in the usa,” Data in Brief, vol. 38, p. 107360, 2021.
- 64. W. H. Sandholm, Population games and evolutionary dynamics. MIT press, 2010.
- 65. Z. Wang, C. T. Bauch, S. Bhattacharyya, A. d’Onofrio, P. Manfredi, M. Perc, N. Perra, M. Salathé, and D. Zhao, “Statistical physics of vaccination,” Physics Reports, vol. 664, pp. 1–113, 2016, statistical physics of vaccination. [Online]. Available: https://www.sciencedirect.com/science/article/pii/S0370157316303349
- 66. J. L. Bernal, N. Andrews, C. Gower, C. Robertson, J. Stowe, E. Tessier, R. Simmons, S. Cottrell, R. Roberts, M. O’Doherty et al., “Effectiveness of the pfizer-biontech and oxford-astrazeneca vaccines on covid-19 related symptoms, hospital admissions, and mortality in older adults in england: test negative case-control study,” bmj, vol. 373, 2021.
- 67. Y. Xiang, S. Gubian, B. Suomela, and J. Hoeng, “Generalized simulated annealing for global optimization: the gensa package.” R Journal., vol. 5, no. 1, p. 13, 2013.
- 68. P. Virtanen, R. Gommers, T. E. Oliphant, M. Haberland, T. Reddy, D. Cournapeau, E. Burovski, P. Peterson, W. Weckesser, J. Bright, S. J. van der Walt, M. Brett, J. Wilson, K. J. Millman, N. Mayorov, A. R. J. Nelson, E. Jones, R. Kern, E. Larson, C. J. Carey, İ. Polat, Y. Feng, E. W. Moore, J. VanderPlas, D. Laxalde, J. Perktold, R. Cimrman, I. Henriksen, E. A. Quintero, C. R. Harris, A. M. Archibald, A. H. Ribeiro, F. Pedregosa, P. van Mulbregt, and SciPy 1.0 Contributors, “SciPy 1.0: Fundamental Algorithms for Scientific Computing in Python,” Nature Methods, vol. 17, pp. 261–272, 2020.
- 69. A. Farcomeni, A. Maruotti, F. Divino, G. Jona-Lasinio, and G. Lovison, “An ensemble approach to short-term forecast of covid-19 intensive care occupancy in italian regions,” Biometrical Journal, vol. 63, no. 3, pp. 503–513, 2021.
- 70. G. Chowell, “Fitting dynamic models to epidemic outbreaks with quantified uncertainty: A primer for parameter uncertainty, identifiability, and forecasts,” Infectious Disease Modelling, vol. 2, no. 3, pp. 379–398, 2017.
- 71. S. Bhattacharjee, S. Liao, D. Paul, and S. Chaudhuri, “Inference on the dynamics of covid-19 in the united states,” Scientific reports, vol. 12, no. 1, pp. 1–15, 2022.
- 72. A. C. Davison and D. V. Hinkley, Bootstrap methods and their application. Cambridge university press, 1997, no. 1.
- 73. S. Seabold and J. Perktold, “statsmodels: Econometric and statistical modeling with python,” in 9th Python in Science Conference, 2010.