Giant planet engulfment by evolved giant stars: light curves, asteroseismology, and survivability
Abstract
About ten percent of Sun-like (–) stars will engulf a – planet as they expand during the red giant branch (RGB) or asymptotic giant branch (AGB) phase of their evolution. Once engulfed, these planets experience a strong drag force in the star’s convective envelope and spiral inward, depositing energy and angular momentum. For these mass ratios, the inspiral takes – years (– orbits); the planet undergoes tidal disruption at a radius of . We use the Modules for Experiments in Stellar Astrophysics (MESA) software instrument to track the stellar response to the energy deposition while simultaneously evolving the planetary orbit. For RGB stars, as well as AGB stars with planets, the star responds quasistatically but still brightens measurably on a timescale of years. In addition, asteroseismic indicators, such as the frequency spacing or rotational splitting, differ before and after engulfment. For AGB stars, engulfment of a planet drives supersonic expansion of the envelope, causing a bright, red, dusty eruption similar to a “luminous red nova.” Based on the peak luminosity, color, duration, and expected rate of these events, we suggest that engulfment events on the AGB could be a significant fraction of low-luminosity red novae in the Galaxy. We do not find conditions where the envelope is ejected prior to the planet’s tidal disruption, complicating the interpretation of short-period giant planets orbiting white dwarfs as survivors of common-envelope evolution.
1 Introduction
The engulfment of planets by their host stars occurs a few times per decade in the Galaxy (e.g. Metzger et al., 2012; MacLeod et al., 2018). Engulfment can occur during all stages of stellar evolution. Around main-sequence (MS) stars, short-period () giant planets () are vulnerable to tidal destruction on Gyr timescales (e.g. Jackson et al., 2008; Levrard et al., 2009; Hamer & Schlaufman, 2019). More distant planets can also be ingested after destabilization by a companion (e.g. Rasio & Ford, 1996; Chatterjee et al., 2008; Nagasawa et al., 2008; Naoz et al., 2012; Petrovich, 2015a, b; Anderson et al., 2016, 2020; Stephan et al., 2018). Numerous previous studies have explored the potential signatures of planetary engulfment by MS stars, including spin-up (Qureshi et al., 2018; Stephan et al., 2020), chemical enrichment (Oh et al., 2018; Spina et al., 2021; Sevilla et al., 2022; Behmard et al., 2022a, b), and both transient and secular brightness changes (Metzger et al., 2012, 2017; MacLeod et al., 2018).
Long before the discovery of exoplanets, it was recognized that stellar expansion during post-MS evolutionary stages would overtake nearby planets (e.g. Alexander, 1967). The interplay of stellar mass loss, tidal friction, and planet–planet interactions during post-MS evolution complicates the question of whether and when a given planet will be engulfed (Villaver & Livio, 2007, 2009; Mustill & Villaver, 2012; Ronco et al., 2020). Recent discoveries of short-period giant planet candidates orbiting single WDs (Vanderburg et al., 2020; Gaia Collaboration et al., 2022) provide further motivation to investigate the outcomes of planetary engulfment by evolved stars (Lagos et al., 2021; Chamandy et al., 2021; Merlov et al., 2021).
Based on exoplanet demographics, the majority of engulfment events around evolved Sun-like stars involve super-Earths or sub-Neptunes – planets of a predominantly rocky composition, with radii of –. These occur around of Sun-like stars on orbital scales of – (e.g. Fressin et al., 2013; Petigura et al., 2013; Zhu et al., 2018), typically with to planets per star (Zhu et al., 2018; Zink et al., 2019). They are engulfed during the host star’s first ascent of the red giant branch (RGB) or on the asymptotic giant branch (AGB) before the onset of thermal pulses. However, their small masses have little effect on the host star, making their engulfment nearly unobservable (apart from the moment of first contact, e.g. Metzger et al. 2012).
More impactful engulfment events involve giant planets (mass –, radius ). Around Sun-like stars, giant planets are relatively scarce at orbital separations less than , with an occurrence fraction of (Cumming et al., 2008; Mayor et al., 2011). However, they are more abundant between and , with an occurrence rate of – (Fernandes et al., 2019; Fulton et al., 2021). Thus, the majority of the giant planet population around Sun-like stars will be engulfed when the host star has a radius of (): near the tip of the RGB or on the AGB (Mustill & Villaver, 2012).
Many previous studies have explored the effects of an engulfed planet or brown dwarf on the internal structure and observable properties of a giant star, including Livio & Soker (1984), Soker et al. (1984), Harpaz & Soker (1994), Nelemans & Tauris (1998), Soker (1998a), Siess & Livio (1999a, b), Retter & Marom (2003), Carlberg et al. (2009, 2012), and Staff et al. (2016). Others have considered the possible role of substellar companions in the origin of hot subdwarf stars (e.g. Soker, 1998b; Nelemans, 2010; Bear & Soker, 2011) and single helium-core WDs (e.g. Nelemans & Tauris, 1998; Zorotovic & Schreiber, 2022), as well as the morphology of planetary nebulae (e.g. Nordhaus & Blackman, 2006; Clyne et al., 2014; Boyle, 2018). Many basic predictions are well established regarding the evolution of the host star during engulfment, including large-scale expansion, brightening, and enhanced mass loss powered by the companion’s orbital energy; spin-up from the companion’s orbital angular momentum; and chemical enrichment of the convection zone. We revisit the problem, leveraging contemporary improvements in input physics and computational methods for 1D stellar models, to develop a consistent understanding of planetary engulfment and inform the interpretation of recent and future observations.
We focus on the engulfment of so-called ‘warm Jupiters’ and ‘cold Jupiters’, giant planets with orbital separations of – and , respectively. We consider host stars with mass – and radius –. A parallel study of ‘hot Jupiter’ engulfment by more compact stars is being carried out by M. Cantiello et al. (in prep.).
We conduct numerical simulations of engulfment using the open-knowledge software instrument Modules for Experiments in Stellar Astrophysics (MESA: Paxton et al. 2011, 2013, 2015, 2018, 2019; Jermyn et al. 2022). Our main goal is to provide a self-consistent assessment of the response of the stellar envelope to energy dissipated by an engulfed planet, including potentially observable signatures, for an illustrative range of stellar and planetary properties. We also outline the conditions under which a substellar companion can eject the stellar envelope and perhaps survive in a short-period post-common-envelope binary with a white dwarf.
In Section 2, we discuss the early stages of planetary engulfment and describe our fiducial stellar models. In Section 3, we summarize the major physical mechanisms governing the orbital trajectory of an engulfed planet and its eventual tidal disruption deep within the envelope (). In Section 4, we discuss the response of the stellar envelope to the local deposition of heat by shocks in the vicinity of the inspiraling planet. In Section 5, we discuss the implementation of planetary engulfment effects in MESA and present simulation results. In Section 6, we evaluate the observability of ongoing and previous engulfment events for post-MS stars. In Section 7, we summarize our main findings, discuss open questions, and make recommendations for future work.
2 Preliminaries
2.1 Pre-contact and grazing phases
Prior to contact between the star and planet, two effects bring the planet and the stellar surface closer together: stellar radius expansion and orbital decay. Orbital decay is driven by tidal friction, most likely due to turbulent dissipation in the star’s convective envelope (e.g. Zahn, 1977, 1989; Vick & Lai, 2020). Drag forces exerted by the stellar corona and wind are negligible (Duncan & Lissauer, 1998).
When the planet makes contact with the star, drag forces begin to dominate over tidal friction. The ‘grazing’ hydrodynamical interaction of the star and planet is complex and three-dimensional (cf. MacLeod & Loeb, 2020a; Yarza et al., 2022). Various observable phenomena, such as expulsion of stellar matter (MacLeod & Loeb, 2020b; Lau et al., 2022) and shock-powered optical and X-ray transients (Metzger et al., 2012; Stephan et al., 2020), may occur during the grazing phase. Those are beyond the scope of this study. We focus on the later ‘inspiral’ phase of engulfment, when the planet is completely immersed in the envelope.
2.2 Stellar models
We use a set of fiducial stellar models obtained with MESA-r22.05.1 (see Section 5 for software details), meant as representative models of RGB and AGB stars. We evolved a non-rotating star of initial mass from the pre-MS through the end of the thermally pulsing AGB stage. We adopted an initial chemical composition using the protosolar abundances of Asplund et al. (2009). We included wind-driven mass loss using the prescriptions of Reimers (1975) from the zero-age MS through the RGB and Blöcker (1995) on the AGB, with respective scaling factors and . We treated convective boundaries using the Schwarzschild criterion and neglecting overshooting. Our stellar models are snapshots of this single evolutionary sequence. Table 1 summarizes their major properties. Each model is labeled in the form ABCxyz, where ABC refers to the star’s evolutionary stage and xyz is its approximate radius in units of .
| Model | |||||||||||
|---|---|---|---|---|---|---|---|---|---|---|---|
| [] | [] | [] | [erg] | [erg] | [] | [K] | – | [yr] | [yr] | – | |
| RGB50 | 50.1 | 1.493 | 0.362 | 549 | 3950 | 1.8 | 0.015 | 2500 | 150 | ||
| RGB100 | 100.0 | 1.420 | 0.424 | 1511 | 3599 | 2.2 | 0.042 | 420 | 340 | ||
| RGB150 | 149.3 | 1.357 | 0.474 | 2672 | 3396 | 3.1 | 0.079 | 150 | 550 | ||
| AGB200 | 203.7 | 1.278 | 0.555 | 4124 | 3242 | 4.9 | 0.13 | 60 | 833 | ||
| AGB275 | 276.7 | 1.000 | 0.568 | 5602 | 3003 | 4.0 | 0.23 | 20 | 1950 |
Note. — All stellar models were evolved from a ZAMS model. Definitions: is the enclosed mass at the bottom of the convection zone. The global dynamical time and Kelvin–Helmholtz time . The gravitational binding energy of the envelope is . The total binding energy and factor are defined in Eq. (21). The total number of orbits undergone by a giant planet is .
3 Physics of inspiral
In this section, we summarize the local hydrodynamical interaction between an engulfed giant planet and the envelope of a typical late-stage giant star, with an emphasis on the drag force exerted on the planet and the associated energy deposition. We describe the planet’s trajectory in a ‘passive’ stellar envelope and its eventual tidal disruption.
3.1 Drag force
The drag force acting on an engulfed planet is determined by the flow of stellar matter around it. We assume that the planet instantaneously follows a circular orbit with radius and velocity , with
| (1) |
where is the stellar mass enclosed by a shell of radius . The planet’s Mach number is
| (2) |
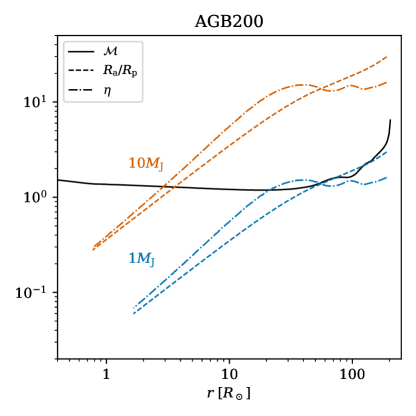
where is the local speed of sound in the stellar envelope. We can safely assume that and are much greater than the bulk velocity of fluid near the planet due to stellar rotation and convection. The planet’s motion is always supersonic, with in general and in the deepest portion of the envelope (where the most energy is dissipated). The run of for stellar model AGB200 is shown by the solid curve in Figure 1.
Despite the supersonic motion through the envelope, the interior of the inspiraling giant planet remains in hydrostatic equilibrium for most of the inspiral because the ram pressure exerted by the medium is small compared to the planet’s central pressure. The drag on the planet comprises hydrodynamic friction (a.k.a. ram pressure or geometric friction), which arises from the non-uniform fluid stress exerted across the object’s surface; and gravitational dynamical friction, which arises from the wake formed behind the object by gravitational focusing. The importance of each component is determined by the planet’s radius and gravitational focusing (a.k.a. Bondi–Hoyle) radius
| (3) |
where is the planet’s mass. For an object with velocity moving through a uniform medium of density , the hydrodynamic and gravitational drag forces may be written
| (4) | ||||
| (5) |
The coefficients and (see below) are determined by the global flow structure, which depend on the dimensionless quantities and . Note that our definition of absorbs a leading factor that others prefer to be explicit. All else being equal, gravitational (hydrodynamical) drag dominates when is small (large), which tends to occur at large (small) within the envelope. The transition between the drag regimes occurs when is of the order of the planet’s surface escape velocity, .
Thun et al. (2016) and Yarza et al. (2022) studied the flow around a gravitating supersonic projectile using 2D-axisymmetric and 3D hydrodynamics simulations, respectively. Both used a ‘wind tunnel’ setup to characterize the steady-state flow structure and numerically derive the hydrodynamic and gravitational drag forces on the projectile (see also MacLeod et al. 2017). For supersonic motion, a shock develops ahead of the projectile. The structure of the post-shock material depends on the Mach number and the ‘compactness’ parameter . Thun et al. (2016) found that the stand-off distance of the shock from the center of the projectile is given approximately by
| (6) |
where
| (7) |
is a nonlinearity parameter (Kim & Kim, 2009) and the factor depends on the adiabatic exponent . We take and throughout this work. The hydrodynamic crossing time () is short compared to the Keplerian orbital period and the orbital decay time, so we assume that the shock structure is in a steady state determined by local conditions. Fig. 1 shows the run of and for model for two planet masses, and .
When gravitational focusing is negligible (), the post-shock material is compressed ahead of the projectile and rarefied behind it. The total drag force is then dominated by hydrodynamic friction. The drag coefficient is weak function of Mach number and can be estimated using laboratory ballistics data (Bailey & Hiatt, 1972). We use the following fitting formula:
| (8) |
which provides an adequate estimate for a non-gravitating projectile with Reynolds number (appropriate for our case).
In the limit of strong gravitational focusing (), post-shock material accumulates around the projectile, creating a quasi-spherical ‘halo’ of subsonic matter with radius (Thun et al., 2016). This structure arises from the impenetrable boundary condition at the projectile’s surface; it does not occur in simulations with absorbing or outflowing boundary conditions (e.g. MacLeod et al., 2017; Li et al., 2020). The halo is approximately in hydrostatic equilibrium and exerts almost uniform pressure on the projectile; thus hydrodynamic drag is negligible () in this limit. The gravitational drag coefficient is given by (Ostriker, 1999; Thun et al., 2016):
| (9) |
where is the maximum extent of the wake formed behind the sphere.
In order for the ‘wind tunnel’ results of Thun et al. (2016) to be applicable to the motion of a body orbiting within a stratified stellar envelope, must not exceed the local density scale height, . The importance of the density gradient is measured by the parameter
| (10) |
Yarza et al. (2022) conducted wind-tunnel simulations with and . They found that the presence of a density gradient introduces asymmetry to the flow structure around the object but otherwise does not change the main conclusions of Thun et al. (2016). Notably, the total drag force increases by less than a factor of relative to that exerted by a uniform medium. For our cases, we find that for , indicating that corrections to the local drag-force law due to the envelope’s density gradient are negligible for giant planets whose ‘spheres of influence’ ( few ) are well separated from the stellar surface.
The results summarized above indicate that, because the structure of the flow around the planet depends mainly on , the hydrodynamic and gravitational regimes of the drag force are almost mutually exclusive. We adopt the following prescription for the total drag force during the inspiral phase:
| (11) |
3.2 Orbital decay and heat deposition
The rate of orbital decay is directly related to the rate of non-conservative work by drag forces:
| (12) |
where
| (13) |
and is a characteristic inspiral time at a given separation. We assume that the orbital energy loss is deposited in the vicinity of the planet as heat. The heat deposition rate is
| (14) |
Heat is deposited at the shock that develops around the planet (Thun et al., 2016; Yarza et al., 2022) and diffuses via convection into the surroundings (e.g. Wilson & Nordhaus, 2022). For further discussion of the role of stellar convection, see Section 4.
When gravitational dynamical friction dominates, the inspiral timescale is roughly
| (15) |
where is the local Keplerian orbital period. When hydrodynamic drag dominates, it is roughly
| (16) |
In all cases we consider, the planet undergoes – orbits in total during the inspiral.
3.2.1 Angular momentum deposition
Drag forces also exert a torque that reduces the planet’s orbital angular momentum and spins up the star. In principle, one could study the differential rotation induced by deposition of the planet’s angular momentum in successive layers of the star using MESA. Since our focus is the effect of energy deposition by the planet, we neglect spin-up in our calculations. It suffices to say that the engulfment would greatly increase the star’s rotation rate (e.g. Livio & Soker, 2002; Carlberg et al., 2009, 2012; Privitera et al., 2016; Stephan et al., 2020). Assuming the star spins up rigidly and has negligible initial angular momentum, the post-engulfment rotation rate is
| (17) |
where is the Keplerian angular velocity at the stellar surface (a.k.a. the breakup rate) and where the stellar moment of inertia is with . For – and , final rotation rates – are expected. Such rapid rotation would be a lasting signature of engulfment detectable via spectroscopic broadening, photometric modulation, and asteroseismic mode splitting. It could also generate magnetic dynamo activity in the envelope (e.g. Livio & Soker, 2002; Nordhaus & Blackman, 2006).
3.3 Disruption of the planet
Engulfed planets are usually destroyed in the stellar interior. This can occur either catastrophically or gradually, depending on the planet’s properties and the envelope conditions.
Livio & Soker (1984) proposed that an engulfed substellar body is thermally disrupted (“dissolved”) upon reaching a location where the local sound speed exceeds the body’s surface escape velocity. Though frequently quoted in the literature (e.g. Siess & Livio, 1999a, b; Carlberg et al., 2009; Aguilera-Gómez et al., 2016; Privitera et al., 2016; Lau et al., 2022; Cabezón et al., 2022), this criterion is only the first step needed for dissolution. The second is to compare the inspiral time with the timescale for heating of the planetary interior by the ambient medium. For irradiated giant planets, the rate-limiting processes are conductive and radiative heat transfer, as the rising entropy of the outer layers suppresses convection (Guillot et al., 1996; Arras & Bildsten, 2006). This implies a heating time far exceeding the predicted inspiral time; hence, we do not consider thermal disruption to be relevant for giant planets.
Alternatively, planets can be disrupted by ram pressure or ablation due to their supersonic motion in a stellar envelope (Jia & Spruit, 2018). Neither of these is relevant for us because the planet is much denser than its surroundings, even near the base of the convection zone.
Based on these considerations, we assume that an engulfed planet survives in the stellar envelope until it fills its Roche lobe, whereupon it is undergoes rapid tidal disruption (cf. Reyes-Ruiz & López, 1999; Nordhaus & Blackman, 2006; Nordhaus et al., 2011; Guidarelli et al., 2022). The orbital radius where this occurs is (Eggleton, 1983)
| (18) | ||||
where is the mass of the compact stellar core. Planets are disrupted long before making physical contact with the core (). We do not consider the subsequent evolution of tidal debris in this work. However, previous studies have considered various possibilities (Reyes-Ruiz & López, 1999; Siess & Livio, 1999a, b; Nordhaus & Blackman, 2006; Nordhaus et al., 2011; Guidarelli et al., 2022).
3.4 Energy budget considerations
When a planet undergoes inspiral from an initial separation to a final separation , the total energy deposited in the envelope is given by
| (19) |
setting the overall energy budget for the inspiral. If heat deposition ceases (or at least slows down) when the planet is tidally disrupted, then by setting , we find an estimate of the characteristic energy budget:
| (20) |
This should be compared with the total binding energy of the stellar envelope:
| (21) |
where is the mass of the envelope, and is the specific internal energy of stellar gas. Although the disruption radius varies as a function of planet mass, the mass enclosed by the terminal orbit is always very close to . Table 1 lists the values of and for our fiducial stellar models. We also give the gravitational binding energy of the envelope, computed by ommiting in Eq. (21).
Both and range from to in order of magnitude. The envelope’s is usually negative () but becomes positive () on the upper AGB, where ionization energy overwhelms gravitational potential energy (Paczyński & Ziółkowski, 1968).
Comparison of and gives a sense of whether the deposition of heat by the planet leads to significant changes in the overall structure of the stellar envelope during inspiral. By setting and solving for , we obtain a characteristic planetary mass for which we expect a major structural adjustment:
| (22) |
However, as we show in Section 5, energetic arguments alone cannot predict the range of possible outcomes.
Our calculation of the inspiral energy budget is somewhat incomplete in that we ignore the evolution of the debris from the planet’s tidal disruption (see previous section). The continued release of gravitational potential energy by the sinking debris (e.g. Siess & Livio, 1999a, b) would contribute additional energy over a timescale , assuming that the debris sinks to a final radius . Since the central temperature of a gas giant or brown dwarf is typically much less than the ambient temperature , the debris would also absorb energy as heat from the environment on a timescale (Harpaz & Soker, 1994). The quantity of heat absorbed is
| (23) |
where is the mass of a proton and is Boltzmann’s constant. This happens also to be of the order of in the cases we consider. These additional process act as residual sources and sinks of energy after a planetary inspiral. The timescales and are somewhat uncertain; they depend in detail on the dynamical evolution of the tidal debris. If either timescale is comparable to, or shorter than, the inspiral time just before tidal disruption (; see Section 3.6), these effects could potentially alter the evolution of the host star to a significant degree. On the other hand, if , then the effects may cancel one another because . It would be possible to incorporate these effects in MESA using a parametrized prescription for the sinking and thermal evolution of tidal debris. We leave this for future work.
3.5 The passive-envelope approximation
A crude but useful approximation of the inspiral trajectory can be obtained by assuming that an engulfed planet has no effect on the stellar envelope. We call this the ‘passive-envelope’ approximation. As the inspiral is brief compared to the stellar evolutionary timescale, a snapshot of the stellar structure is sufficient to compute the planet’s trajectory.
The right-hand side of Eq. (12) determines the inspiral rate in terms of the properties of the envelope and planet. In the passive-envelope approximation, the planet’s orbital separation at time is given by
| (24) |
where is the separation of the planet at time . The instantaneous heating rate due to drag () along the planet’s trajectory can also be computed.
3.6 The importance of the ‘late’ inspiral
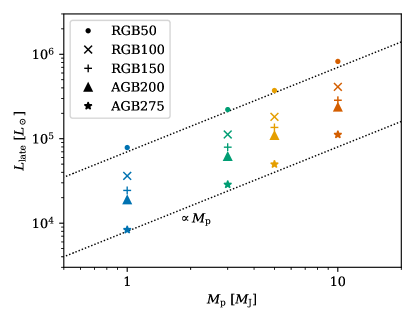
As the planet spirals inward, the cumulative heat deposited in the star grows like . Roughly half of the total heat is deposited between and . We dub this the ‘late’ stage of inspiral. This stage is critical for determining the qualitative behavior of the stellar envelope response. We denote the energy deposited in the envelope during this stage as . The duration of the late inspiral, denoted , is of the order of the local inspiral time evaluated at ; in the passive-envelope approximation, can be computed exactly by way of Eq. (24). The average heating rate due to drag during the late inspiral is .
In Figure 2, we show as a function of for all stellar models, as computed under the passive-envelope approximation. For a given star, often exceeds the intrinsic luminosity and is nearly proportional to . The latter fact implies that depends weakly on , in qualitative agreement with the scaling predicted by Eqs. (16) and (18). Our MESA experiments confirm that the passive-envelope approximation predicts the planet’s trajectory accurately in many cases; they also allow for a prediction of when the approximation breaks down.
4 Stellar response
The planet’s supersonic motion through the stellar envelope dissipates orbital energy (via shocks) as heat along its trajectory. The planet acts like an embedded heat source, localized in a region of characteristic size (Eq. 6), emitting an instantaneous power determined by local properties of the envelope. The structural response of the stellar envelope to this energy deposition may be determined in a first approximation via a local analysis of heat transport in the planet’s vicinity.
The dominant mode of heat transport in the envelope of a giant star is convection, which is treated using the traditional mixing-length theory (MLT). Turbulence causes heat diffusion on a local eddy turnover timescale
| (25) |
where is the local pressure scale height, is the convective turbulent velocity, and is a free parameter. In this section, we set for convenience; we use in our MESA simulations. The quantity will be compared with local dynamical timescales, namely the sound propagation time
| (26) |
and the Keplerian orbital period . In most of the envelope, these timescales have a hierarchy . All of these timescales are short compared to the inspiral time . For further discussion of the role of convection in common-envelope events (and planetary engulfment events), we refer the reader to some recent works by Sabach et al. (2017), Grichener et al. (2018), and Wilson & Nordhaus (2019, 2020, 2022).
We can reasonably describe heat transport near the planet as follows: In the immediate wake of the companion, fluid elements compressed and heated by the shock re-expand on a timescale . After reaching a size of order , the heated region equilibrates and loses excess heat to its surroundings. This implies that, over the orbital timescale, the companion directly heats a toroidal region of major radius and minor radius . However, over the longer timescale , fluid motions due to both convection and the repeated passages of the companion should redistribute the excess heat roughly along isobars.111 The actual rate of lateral heat transport in a convective layer is uncertain. If the corresponding velocity is not too different from , the lateral transport time is only a factor of a few longer than . This is because is only a factor of few smaller than deep inside an RGB or AGB envelope. In other words, over timescales longer than , we may consider the heat dissipated by drag to be deposited inside a spherical shell of radius and thickness . This is our ‘shellular heating’ approximation.
Assuming uniform heat deposition per unit mass in the heated shell, the heating rate per unit mass is
| (27) |
and zero elsewhere. We define a local heating timescale
| (28) |
where is the envelope’s specific heat at constant pressure and its ambient temperature. We also define a local thermal cooling time for comparison:
| (29) |
where is the star’s intrinsic luminosity. As we will show, when , the shell heated by the planet remains nearly in thermal equilibrium with the rest of the stellar envelope; the star can accommodate the additional luminosity with a negligible adjustment of its thermal structure. Conversely, when , the heated shell is no longer in thermal equilibrium and expands on a timescale . Provided that , thermal expansion is locally hydrostatic and occurs nearly at constant pressure.
We expect the shellular approximation to hold provided that is long compared to and the size of the shock-heated region is smaller than . If the latter is not satisfied, then a reasonable correction is to use as the shell thickness in lieu of .
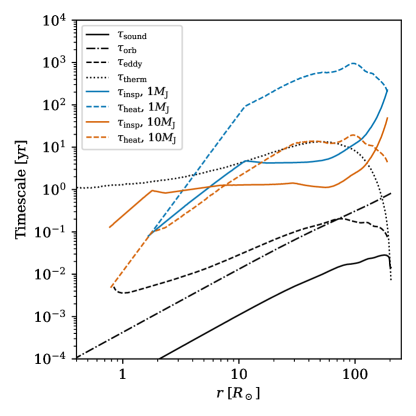
The validity of the shellular approximation is fundamental to our ability to study the effects of an engulfed planet using spherical 1D hydrodynamics. Hence, we examine the run of these relevant local timescales during inspiral under the passive-envelope approximation. Figure 3 for model AGB200 with planets of and . In both cases, the hierarchy of timescales necessary for the shellular approximation, , is satisfied for . At greater radii, the approximation is not strictly valid because the convective turnover time is shorter than the orbital period. However, negligible heat deposition occurs in this region.
The main differences between the and cases are the locations where the planet’s gravitational focusing effect becomes unimportant (and thus the drag force regime changes) and where heating causes thermal expansion of the surroundings. The former can be seen as the abrupt change in the slope of at and , respectively. The latter occurs roughly where the curves of and cross, at and , respectively. In the late stages of inspiral, thermal expansion occurs rapidly compared to the inspiral time in a passive envelope (). This signals the breakdown of the passive-envelope approximation for massive bodies.
If is ever shorter than , a time-dependent treatment of convection is warranted. We have therefore included time-dependent convection (TDC) in our MESA experiments (see Jermyn et al. 2022 and references therein). Intermittent local disruption of convection can occur for planets with , but the global stellar response does not change significantly as a result.
Another minor complication is that evolved giant stars possess an inner radiative zone between the nuclear-burning shell and the base of the convective envelope. This zone has negligible mass compared to the core, but its radius () is such that a massive planet () will interact with it before filling its Roche lobe. We continue to use the shellular approximation in such cases for simplicity.
5 MESA simulations
We now describe our implementation of the effects of an engulfed planet in MESA and the main results of our numerical experiments. The star’s response to engulfment has two main regimes: a “quasistatic” regime (Section 5.3), where the star remains nearly in hydrostatic equilibrium with subsonic flows; and a “disruptive” regime (Section 5.4), where it is far from equilibrium with supersonic flows.
5.1 Software information
The MESA equation of state (EOS) is a blend of the OPAL (Rogers & Nayfonov, 2002), SCVH (Saumon et al., 1995), FreeEOS (Irwin, 2004), HELM (Timmes & Swesty, 2000), PC (Potekhin & Chabrier, 2010), and Skye (Jermyn et al., 2021) EOSs. Radiative opacities are primarily from OPAL (Iglesias & Rogers, 1993, 1996), with low-temperature data from Ferguson et al. (2005). Electron conduction opacities are from Cassisi et al. (2007) and Blouin et al. (2020). Nuclear reaction rates are from JINA REACLIB (Cyburt et al., 2010), NACRE (Angulo et al., 1999) and additional tabulated weak reaction rates (Fuller et al., 1985; Oda et al., 1994; Langanke & Martínez-Pinedo, 2000). Screening is included via the prescription of Chugunov et al. (2007). Thermal neutrino loss rates are from Itoh et al. (1996). The inlist and extension files required to reproduce our results are available online.22210.5281/zenodo.7692746
 |
 |
 |
 |
5.2 Methods
In all runs, we enable MESA’s 1D hydrodynamics module and treated convection using the recently added TDC option (Jermyn et al., 2022). We include localized heating from an engulfed planet using the drag-force formula from Section 3 and the shellular approximation described in Section 4. We evolve the the planetary orbit simultaneously with the stellar model using Eq. (12) with the initial . We use Eq. (18) to determine when the planet is tidally disrupted and switch off the extra heating immediately thereafter. In order to focus on the hydrodynamical effects of inspiral heating, we do not allow for wind-driven mass loss during these simulations.
By default, we terminated each MESA run after an elapsed time since the planet’s disruption, where is the stellar Kelvin–Helmholtz time. In most cases, this is ample time for the star to revert to its original structure. However, a few runs ended early because convergence could not be attained with a reasonable simulation time-step. In those cases, planetary engulfment had triggered supersonic expansion of the envelope (see Section 5.4).
We refer to our MESA experiments using an abbreviated notation: for example, RGB150-3MJ refers to the simulation with stellar model RGB150 (see Table 1) and a planet.
5.3 Results: Quasistatic envelopes
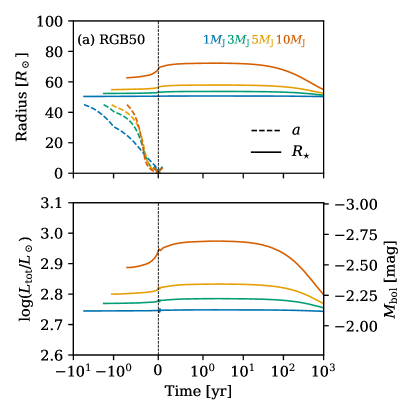
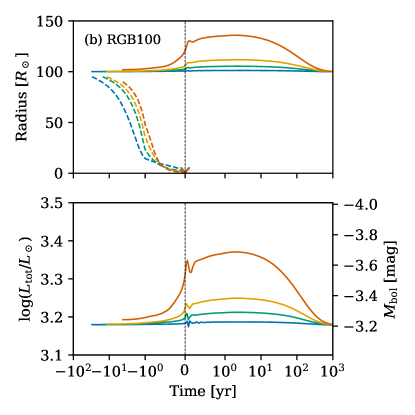
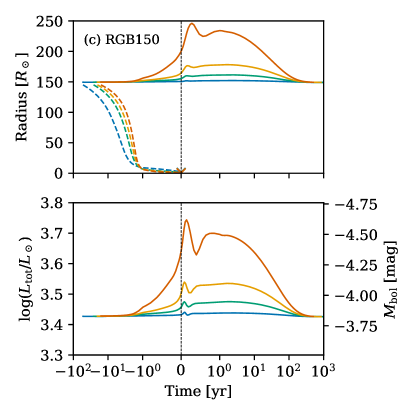
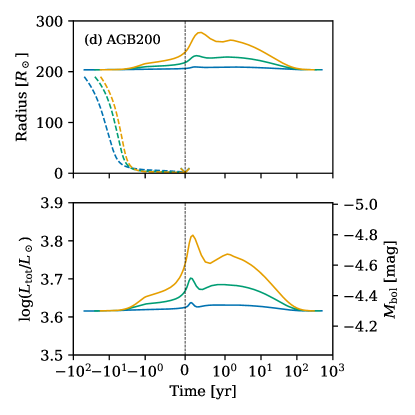
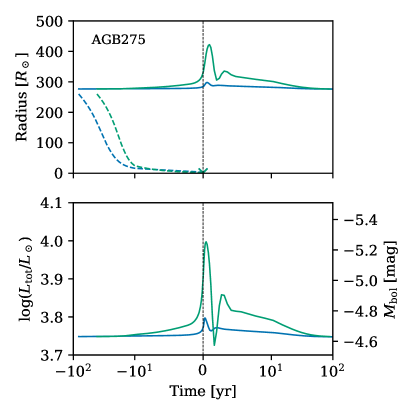
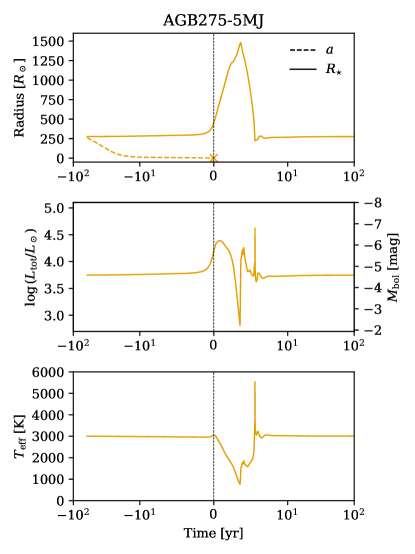
Figures 4abc show the simultaneous evolution of the planet and stellar structure with stellar models RGB50, RGB100, and RGB150 for –. Fig. 4d shows AGB200-1MJ, 3MJ, and 5MJ; and Fig. 5 shows AGB275-1MJ and 3MJ. Each shows the evolution of the planetary orbital radius, stellar radius, and stellar bolometric luminosity and absolute magnitude. To facilitate comparison between simulations, we define the time at which the planet is tidally disrupted to be , with negative and positive values of corresponding to the time before and after disruption.
The inspiral of a massive planet triggers expansion and brightening of the envelope, followed by protracted Kelvin–Helmholtz contraction and gradual dimming. The more massive the planet, the larger the disturbance it creates. For –, the star’s initial brightening is plausibly detectable with a ground-based optical or near-infrared telescope, with typical photometric deviations of mag over . The effective temperature also decreases by – as the star expands, so a mild amount of intrinsic reddening is expected. We emphasize that the brightening is powered by the planet’s descent in the deep interior, not by a ‘grazing’ interaction at the stellar surface. A star may not brighten noticeably for decades to centuries after engulfment begins.
The expected shape of the light curve in this phase depends mostly on the host star’s evolutionary stage: compact, early-stage red giants such as RGB50 and RGB100 tend to brighten in a monotonic fashion before leveling off. The puffy, more evolved RGB150, AGB200, and AGB275 display two distinct peaks in their light curves separated by . Smaller secondary peaks can also be seen for RGB50 and RGB100. We discuss the physical origin of the double-peaked light curve below.
The results for AGB275 are notable because the star’s convective envelope has , perhaps making it more susceptible to ejection (Paczyński & Ziółkowski, 1968). Although planets of and cause relatively large disturbances, they do not unbind the envelope, likely because of efficient radiative cooling in the expanding outer layers (see below).
5.4 Results: Disrupted envelopes
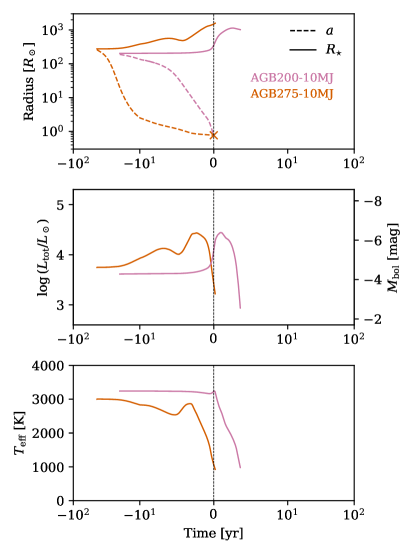
We now examine the subset of our MESA experiments in which planetary engulfment disrupts the stellar envelope, namely AGB200-10MJ, AGB275-5MJ, and AGB275-10MJ. These represent a transitional regime between the quasistatic and subsonic responses described above and the dynamical ejection of matter during a true common-envelope event.
Figure 6 shows the results of experiment AGB275-5MJ, including the evolution of . The evolution of the stellar radius resembles a more extreme version of experiment AGB275-3MJ in that the star undergoes large-scale expansion and contraction, reaching a maximum radius of (). However, this representation obscures the rich hydrodynamics of interior mass shells (see below). The light curve and evolution reflect this complexity more effectively. The star initially brightens by mag over before fading by mag on a similar timescale. At the same time, it reddens from to just under . When the expansion reverses, the star abruptly returns almost to the same peak luminosity and . Unlike in the previous experiments, the star’s outer layers are essentially in free-fall at this stage. The luminosity at is generated by an accretion shock at the interface between the expanding/collapsing ‘ejecta’ and the quasistatic interior, rather than by residual heat from the planetary inspiral.
The final ‘spike’ in the light curve, accompanied by an increase in to , coincides with the re-accretion of the photosphere and is analogous to a shock breakout in a stellar explosion. Its duration is , where is the free-fall velocity at the shock and is the thickness of an outer shell of optical depth .
Despite the drastic expansion of the envelope, no material is ejected from the star above escape velocity. We note that MESA’s equation of state takes the ionization energy of hydrogen and helium into account. This extra energy reservoir is evidently insufficient to eject the envelope in our scenario. However, we have not accounted for the formation of dust grains as the envelope expands and cools. Dust-driven winds may play a crucial role in the late stages of a common-envelope event (Glanz & Perets, 2018). If the grain opacity is large enough during the envelope’s initial expansion, it may reduce radiative losses and allow the outer layers to reach escape velocity. The evolution predicted by MESA at late times () therefore should be regarded with caution.
Other effects not included in our simulations, such as stellar rotation and magnetic activity, would likely influence the evolution of a disrupted, dusty stellar envelope. If the spinning-up of the envelope by the planet generates a magnetic dynamo, then magnetic ‘cool spots’ on the stellar surface may form dust grains more readily; this would likely change the geometry and mass-loss rate of a dust-driven outflow (e.g. Soker, 1998b; Livio & Soker, 2002; Nordhaus & Blackman, 2006; Rapoport et al., 2021).
Figure 7 shows AGB200-10MJ and AGB275-10MJ. In these cases, the MESA runs were terminated early because the required time-step for convergence became prohibitively short. Consequently, we cannot characterize the ejecta dynamics or light curve at late times in these cases. However, each model was evolved through the planet’s tidal disruption with satisfactory accuracy. Broadly speaking, the star’s initial expansion phase resembles that of AGB275-5MJ in both cases.
5.4.1 Hydrodynamics of the interior
Figs. 6 and 7 show that the stellar photosphere eventually stops expanding and falls back. In Figure 8, we show selected snapshots of the radial velocity and entropy profiles of the stellar interior from AGB275-5MJ. The envelope does not expand and contract monotonically throughout the evolution. Instead, a given mass shell undergoes multiple phases of expansion and contraction in general, and different mass shells can expand and contract simultaneously. The maximum expansion velocity is of the escape speed.
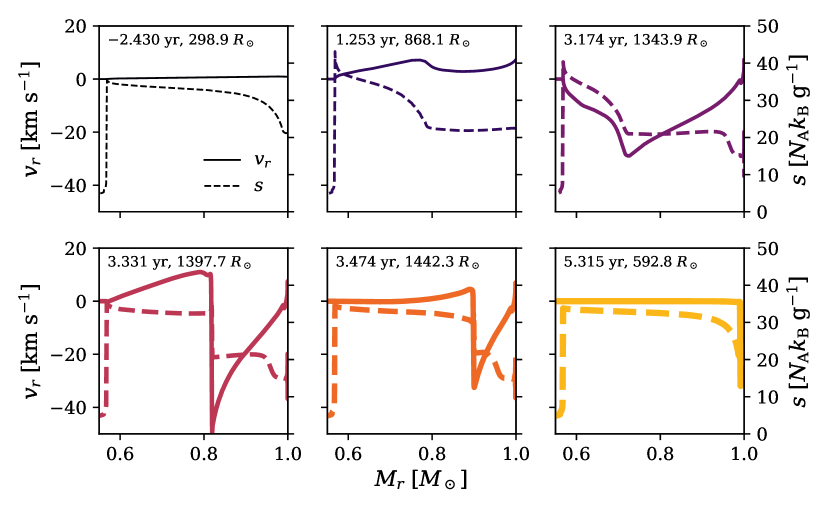
Initially, the star expands and contracts uniformly in the sense that the sign of the radial velocity is the same everywhere. The expansion is initially adiabatic, but subsequently the entropy of the outer layers drops abruptly as a result of hydrogen recombination (see Section 5.4.2). Radiative energy transport temporarily dominates in a large fraction of the envelope, due to the presence of an inverted entropy gradient (Fig. 8). Radiative cooling in these regions further deprives the expanded envelope of pressure support, leading to collapse. This accounts for the precipitous decline in stellar luminosity after the initial broad peak. However, the stellar interior eventually becomes over-pressurized from the collapse and rebounds. Thus, for a time, the star contains two dynamically disconnected regions: a subsonic expanding interior and an envelope of ejecta in supersonic free fall. A strong shock is present at the contact layer, visible as a discontinuity in the velocity and entropy profiles. This shock converts the kinetic energy of collapse into thermal and ionization energy, allowing the star to return to equilibrium.
Although the planet fails to eject the stellar envelope in our MESA models, we have nonetheless identified a significant transition in their qualitative behavior: For very advanced stages of stellar evolution, there is a critical planetary mass above which the outer layers of the envelope expand supersonically and develop shocks (even if they do not become unbound). For AGB200 (AGB275), the critical mass is between and ( and ). This agrees roughly with the quantity estimated in Section 3.4 via energy-budget considerations (equation 22).
However, the inspiral energy budget alone cannot determine whether the stellar model undergoes a nonlinear hydrodynamical response. This depends rather on the rate of heat deposition during the planet’s late inspiral (, see Section 3.6), which is proportional to for a given star. Assuming that the star initially undergoes quasistatic evolution, with giving the work per unit time against self-gravity, the expansion rate at the surface, , can be estimated as follows:
| (30) |
This can be compared with the sound speed near the surface:
| (31) |
where and are the gas’ adiabatic index and average mass per particle. In AGB stars, can be comparable to because is large. If the expansion continues with held constant, increases in proportion to and drops due to adiabatic cooling. Consequently, the expansion becomes supersonic for large enough (), as we have seen.
We have verified this picture by conducting additional AGB200-10MJ runs in which the drag force on the planet is artificially reduced by a constant factor. Although the same amount of heat is deposited in the star in each case, the stellar response becomes quasistatic when the drag force is reduced by roughly an order of magnitude. This is because (a) the envelope expanded more slowly and (b) convection carries a greater fraction of .
5.4.2 Recombination and radiative losses (without dust)
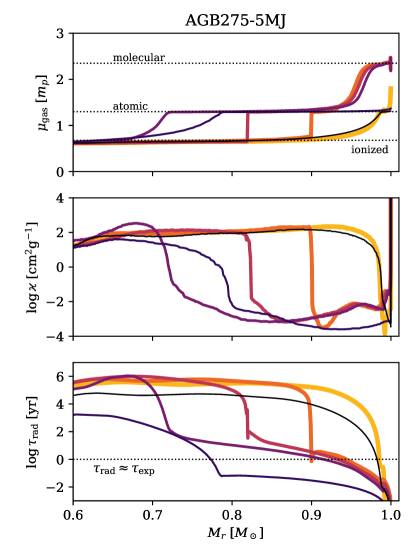
Interior structure profiles reveal that a large portion of the envelope undergoes recombination as a result of adiabatic cooling during the star’s initial expansion. The top panel of Figure 9 shows the evolution of throughout the envelope for experiment AGB275-5MJ as a proxy for the predominant phase of hydrogen. As the envelope expands following the planet’s inspiral, more than half of the envelope’s mass undergoes recombination. (The temperature near the surface can be low enough to form molecules and dust grains, but this is a secondary effect in terms of energetics.)
In the study of CE evolution, the role of ionization energy in ejecting the envelope is uncertain (see discussions in the reviews of Ivanova et al. 2013 and Röpke & De Marco 2022, as well as e.g. Sabach et al. 2017, Grichener et al. 2018, and Ivanova 2018). The crux of the issue is whether a sufficient portion of the ionization energy can be converted to mechanical work to accelerate the envelope to escape velocity. Several previous studies, including Sabach et al. (2017), Grichener et al. (2018), and Wilson & Nordhaus (2019), have argued that convection can efficiently transport heat derived from orbital and ionization energy from the deep interior to radiative zones near the surface, reducing the amount of energy available to do work (but see Ivanova 2018). We find that much of the envelope’s initial ionization energy is lost as radiation during the initial large-scale expansion of the envelope (see Section 5.4.2). Subsequently, the remaining heat deposited by the planet flows outward, re-ionizining the envelope in the process. This implies that the fluid absorbs a substantial amount of thermal energy that could otherwise have been used as work to eject the envelope. The ionization energy therefore acts as a ‘buffer’ for the planet’s orbital energy, arguably preventing envelope ejection rather than aiding it. These findings demonstrate the nontrivial effects of ionization energy transport in CE evolution: even if it does not contribute to ejecting the envelope, it may be necessary to include ionization effects in numerical calculations in order to accurately predict a system’s evolution and observable characteristics. However, we reiterate that our conclusions are provisional, due to the lack of dust effects in our simulations.
Recombination has two main effects on stellar matter in our MESA models: The ionization energy converts to radiation, and the opacity plummets. Even though the envelope remains optically thick, the reduced opacity enables efficient radiative cooling. To demonstrate this, the middle and bottom panels of Fig. 9 show the evolution of the radiative opacity reported by MESA and a local radiative cooling timescale . The cooling time is defined as
| (32) |
where is the optical depth at radius , is the speed of light, and and are the local gas pressure and radiation pressure. In the layers that undergo recombination, becomes comparable to, or shorter than, the envelope expansion time . Roughly speaking, layers with can cool efficiently.
This line of reasoning also reproduces the maximum luminosity during the initial expansion of the envelope. Assuming that a shell of mass loses all of its hydrogen ionization energy as radiation over a time , we find that the star’s maximum luminosity is given by:
| (33) |
where is the hydrogen mass fraction and . This agrees with the MESA results for AGB200-10MJ, AGB275-5MJ, and AGB275-10MJ. (All else being equal, accounting for the ionization energy of helium increases by .) Recombination is also responsible for the first peak in the light curves of experiments RGB150-10MJ, AGB200-5MJ, and AGB275-3MJ (Figs. 4cd, 5). In those cases, the envelope expands by a smaller factor and remains subsonic, so and are reduced relative to the reference values above.
As noted above, dust grains are expected to form as the stellar envelope expands and cools. Their additional opacity may reduce radiative energy losses, allowing more efficient ejection of the envelope. In order for this to occur, the grain opacity must be large enough that remains longer than . Referring to the bottom panel of Fig. 9, we see that the grain opacity must be 2–3 orders of magnitude greater than the low-temperature MESA opacity to eliminate radiative losses completely in AGB275-5MJ.
6 Observational implications
6.1 Optical and infrared transients
Previous studies have suggested that planet engulfment (or tidal disruption) may lead to an observable optical/infrared transient, including Retter & Marom (2003), Retter et al. (2006, 2007), Bear et al. (2011a), Metzger et al. (2012, 2017), Kashi & Soker (2017), Soker (2018), MacLeod et al. (2018), Kashi et al. (2019), Stephan et al. (2020), and Gurevich et al. (2022). Our results confirm this prediction and characterize the relationship between transient properties and underlying planetary and stellar parameters.
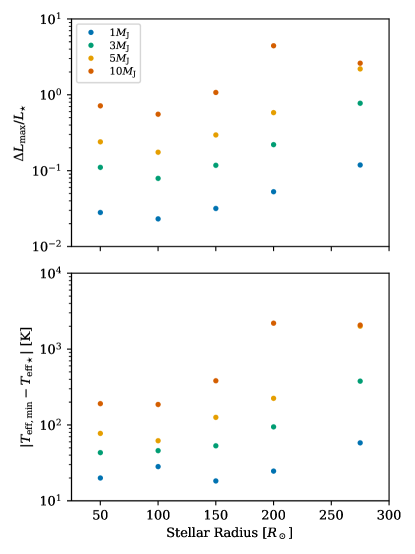
The most informative quantity to constrain the engulfed planet’s mass is the excess stellar luminosity. Let be the difference between the star’s instantaneous bolometric luminosity and its intrinsic luminosity . Let the maximum value be occurring at time . The upper panel of Figure 10 shows the quantity for our MESA simulations. For stars that experience quasistatic or subsonic responses (which generally correspond to ), it may be possible to estimate the planetary mass from the peak luminosity, provided that the host’s properties are well constrained prior to the flare-up. However, when the planet creates a major disturbance in the star (Section 5.4), non-linear effects make the relation between and more complex.
The maximum change of the host’s intrinsic color (which we characterize via ) also correlates with planetary mass. The effective temperature tends to decrease somewhat during the transient, reddening the star. The lower panel of Fig. 10 shows the maximum change of from its initial value. Cases with more massive planets and more evolved host stars exhibit larger changes. Again, however, non-linear effects dominate when the planet disrupts the envelope.
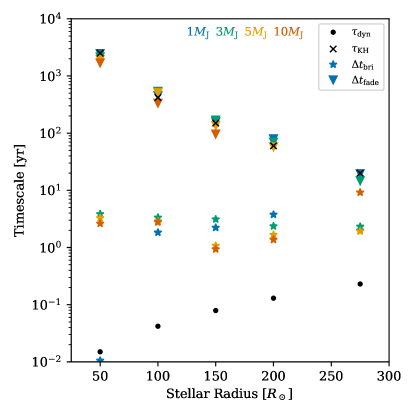
The brightening and fading timescales of engulfment-powered transients are also important. In Figure 11, we show the values of the empirical quantities and , defined as follows: and , where and .
For systems with quasistatic or subsonic responses, the fading time matches the Kelvin–Helmholtz time,
| (34) |
This shows that the star contracts quasistatically as the planet’s orbital energy is lost as radiation. Since is longer than a century for stars with radii , the secular dimming of star following engulfment is measurable only for TRGB and AGB stars. However, it may be possible to detect the contraction of stars in the – range by indirect means (see below).
The brightening time varies within the range of – across almost all of our runs, without any apparent trend with planetary mass for a given stellar model or between stellar models. It is long compared to the global dynamical timescale,
| (35) |
which reflects the star’s expansion below escape velocity. If we assume that the star undergoes quasistatic expansion during the planet’s late inspiral, we estimate an expansion timescale (see Eq. 30)
| (36) |
Using – for the appropriate stellar parameters (Fig. 2), Eq. (36) reproduces the range of seen in our MESA results. Run RGB50-1MJ is an exception because the stellar response is so weak that small acoustic oscillations (with period ) excited during the late inspiral dominate the light curve.
6.1.1 Weak red transients
Broadly speaking, the electromagnetic signatures of planetary inspiral can be separated into two qualitative categories based on whether the stellar response was quasistatic/subsonic or supersonic. The main signature of a quasistatic/subsonic envelope is an abrupt () increase in luminosity with mild reddening (see Figs. 4, 5 for examples). TRGB and AGB stars may exhibit a prominent ‘double peak’ in bolometric luminosity due to H recombination. In most cases, the transient phase is followed by a long plateau (–) at nearly constant and as Kelvin–Helmholtz contraction takes over. The bolometric amplitudes of these transients are – mag for planets between and . Despite their modest amplitudes, these “weak red transients” may be observable by ground- and space-based wide-field time-domain surveys operating at optical and near-infrared wavelengths, such as the Zwicky Transient Facility, the Vera C. Rubin Observatory, and the Nancy Grace Roman Space Telescope.
6.1.2 Red novae from engulfment on the AGB
Despite some physical uncertainties and computational limitations, our MESA experiments clearly predict that sufficiently massive planets can disrupt an AGB star’s envelope, producing a major eruption lasting several years (Figs. 6, 7). These eruptions likely resemble the luminous red novae (LRNe) produced by coalescing binary stars (e.g. Tylenda & Soker, 2006). However, they are much dimmer at peak brightness and evolve more slowly than typical LRNe (e.g. Kochanek et al., 2014; Karambelkar et al., 2022). Additionally, their progenitors are already bright, dusty, late-type sources by virtue of their evolutionary stage, whereas the progenitors of LRNe display a wide range of properties.
If the fraction of WD progenitors with a cold Jupiter is , the rate of engulfment-powered RNe in the Galaxy is
| (38) |
where we again estimate based on the occurrence rate among Sun-like stars (Fernandes et al., 2019; Fulton et al., 2021). If the giant-planet occurrence rate is greater for stars somewhat more massive than the Sun (Johnson et al., 2010; Reffert et al., 2015; Jones et al., 2016; Ghezzi et al., 2018), then a somewhat larger value of may be appropriate for typical single WD progenitors (– on the MS). The higher rate and peak luminosity of these eruptions relative to weak red transients makes them a more promising target population for transient surveys.
When an AGB star is disrupted by an engulfed planet, it reaches a typical peak luminosity and lasts several years. These properties, combined with the expected event rate , suggest that planetary engulfment events could be responsible for a significant fraction of the lower-luminosity red novae observed in the Galaxy (Kochanek et al., 2014; Howitt et al., 2020). The transient OGLE-2002-BLG-360 (Tylenda et al., 2013), which was “less violent” and of longer duration than a typical LRN, and whose progenitor was a late-type giant star, may be an example.
6.1.3 Observational complications
Here we note some possible complications in associating an observed transient with the engulfment of a giant planet. For AGB host stars, there is potential for confusion between planet-engulfment events and other sources of short-term variability. Many AGB stars display long-period intrinsic variability, especially Mira-like pulsations. The typical pulsation period and photometric amplitude of a Mira variable are and (e.g. Iwanek et al., 2022). Variability at this level could mask the expansion and brightening of an AGB star due to engulfment of a lower-mass () companion.
AGB stars also experience brief, recurrent increases in their luminosity and mass-loss rate due to helium shell flashes (a.k.a. thermal pulses). These events have been associated with the creation of detached shells of gas and dust observed around some nearby AGB stars (e.g. Olofsson et al., 1988; Maercker et al., 2016; Kerschbaum et al., 2017; Brunner et al., 2019; Kastner & Wilson, 2021). Detached shells have a visible lifetime of (Kastner & Wilson, 2021). A few stars display multiple shells (Izumiura et al., 1997; Mečina et al., 2014), each presumably resulting from a distinct mass-loss episode. Engulfment of a giant planet could also create a detached shell, for a large enough increase of the stellar luminosity.
The observational consequences of a thermal pulse in an AGB star may be broadly similar to those of planetary engulfment. However, in practice, we do not expect thermal pulses to contaminate searches for transients caused by planetary engulfment. This is because the duration of elevated luminosity and mass loss resulting from a helium shell flash () is much longer than that of a red nova due to an engulfment event in our models (–).
Finally, we noted that the maximum luminosity and change do not correlate with for AGB stars engulfing – planets (Fig. 10). This raises the question of whether one could distinguish between the engulfment of a – planet by an AGB star and the engulfment of a brown dwarf (–) or low-mass M dwarf (–). We have argued that the maximum luminosity of a disrupted AGB envelope scales with (see Eq. 33 and surrouding text). Observational evidence shows that a companion can survive the CE phase (e.g. Maxted et al., 2006; van Roestel et al., 2021; Kruckow et al., 2021; Zorotovic & Schreiber, 2022). The inspiral of such a companion proceeds on the global dynamical timescale (Eq. 15 for ) and results in a complete envelope ejection. Eq. (33) predicts a much more luminous eruption, assuming and . If the companion stalls on a short-period orbit, then the residual envelope may experience additional eruptions on a timescale of years (Clayton et al., 2017). In the intermediate regime of –, it is unclear whether or would change significantly. We have not attempted to simulate this regime in MESA because the conditions for our 1D spherical approximation may not be met in that case. Further study is required to determine to what extent giant-planet and low-mass brown-dwarf engulfment events are distinguishable.
6.2 Seismology of post-engulfment giants
In the ‘weak red transient’ regime, the dimming timescale following planet engulfment is longer than the brightening timescale by a factor of –, depending on evolutionary stage. Thus, there are – times more stars in the dimming phase than the brightening phase at any given time. For the most part, the dimming is too gradual to be measured on human timescales. However, it may be possible to detect the star’s quasistatic contraction using asteroseismology. Specifically, a contracting star would display a secular increasing trend in the large seismic frequency spacing . The Kepler mission produced a homogeneous set of measurements with a typical fractional uncertainty of for several thousand RGB stars monitored continuously over (Yu et al., 2018). Stars contracting at rates may have a detectable trend.
Additionally, giant stars that have engulfed a giant planet rotate more rapidly than is typically observed or expected based on theoretical models of single stellar evolution (see Section 3.2.1 and references therein). Rapid rotation would cause rotational mode splitting in the seismic spectrum and would be a longer-lasting signature of planet engulfment than brightness changes. The spin-down timescale of a red giant due to stellar mass loss is , where is the rate of mass loss due to a stellar wind and is the radius from which the wind is launched. For , the spin-down time is of the star’s remaining lifetime (). A giant displaying both strong mode splitting and upward secular drift of would be a strong candidate for having recently engulfed a substellar companion.
6.3 Planetary survival
As mentioned previously, this work is motivated in part by the question of whether an engulfed giant planet can survive on a short-period orbit around a WD after ejecting the stellar envelope (Vanderburg et al., 2020; Lagos et al., 2021; Chamandy et al., 2021; Merlov et al., 2021). In all of our MESA experiments, the planet undergoes Roche-lobe overflow (RLO) before the end of the simulation. We have assumed that, once RLO begins, the planet is disrupted rapidly compared to the ongoing dynamical evolution of the envelope. This assumption bears further scrutiny.
In principle, RLO of a short-period giant planet can lead to stable mass transfer, halting or even reversing its orbital decay (Valsecchi et al., 2014; Jackson et al., 2016; Jia & Spruit, 2017). In our case, the inspiral/mass-transfer timescale is much shorter than the planet’s thermal timescale. The planet’s radius therefore evolves at a fixed entropy per unit mass, increasing or remaining nearly constant (e.g. Zapolsky & Salpeter, 1969; Paxton et al., 2013). Thus, the mass transfer is unstable and runaway disruption ensues.
RLO can be prevented if the stellar envelope expands to such a degree that the planet’s inspiral time becomes longer than the global dynamical time, ‘stalling’ the planet at until the envelope has dissipated completely. In ‘successful’ CE ejections, these self-regulating behaviors prevent a complete merger and set the post-CE binary separation (e.g. Ivanova et al., 2013; Clayton et al., 2017; Gagnier & Pejcha, 2023). The only experiment in which the inspiral became somewhat self-regulating was AGB275-10MJ (Fig. 7). However, this merely delayed RLO by , much less than the expected timescale of dust-driven mass loss from an AGB or post-CE envelope (e.g. Glanz & Perets, 2018). This suggests that planetary survival is possible only for and only when engulfment occurs during the thermally pulsing AGB stage. This, in turn, implies that short-period giant planets can only be found orbiting WDs with carbon/oxygen cores (as opposed to close ‘WD + brown dwarf’ binaries, which often contain helium-core WDs; see Zorotovic & Schreiber 2022 and references therein).
Currently, two intact, short-period giant planets (or planet candidates) are known orbiting single WDs. The transiting planet WD 1856+534 b (Vanderburg et al., 2020) orbits a WD at a separation of (). Its mass is constrained to be (Vanderburg et al., 2020; Xu et al., 2021). Our MESA simulations suggest that a planet would struggle to avoid tidal disruption through most of the allowed mass range, even if it succeeded in ejecting the envelope with the aid of dust-driven winds. For this system, high-eccentricity tidal migration is a plausible alternative formation scenario (Muñoz & Petrovich, 2020; O’Connor et al., 2021; Stephan et al., 2021). Meanwhile, WD 0141–675 has an astrometric planet candidate with mass and semi-major axis () according to the Gaia DR3 astrometric solution (Gaia Collaboration et al., 2022). If confirmed, this system would be difficult to explain as a CE survivor: the planet’s large orbit implies an insufficient energy budget to disrupt the envelope (but see Bear & Soker, 2011, 2014; Bear et al., 2021; Chamandy et al., 2021) . The microlensing giant planet MOA-2010-BLG-477Lb is also associated with a WD (Blackman et al., 2021). Based on its large sky-projected separation from the host (), this planet likely avoided engulfment during late-stage stellar evolution.
Over the years, several studies have reported short-period planet candidates orbiting horizontal branch stars or hot subdwarfs (e.g. Geier et al., 2009; Setiawan et al., 2010; Charpinet et al., 2011). However, none has been confirmed to date (e.g. Norris et al., 2011; Jones & Jenkins, 2014; Krzesinski, 2015). Such objects would have survived engulfment during the first RGB and may have ejected a portion of the stellar envelope (e.g. Bear & Soker, 2011, 2014). We do not find conditions under which this can occur for . Some recent works have suggested that planetary survival is possible if engulfment coincides with the host’s core helium flash (Bear et al., 2011b, 2021; Merlov et al., 2021). Our MESA extension could be used to reexamine this scenario.
7 Conclusion
We have studied the evolution of bright giant stars of – following the engulfment of a Jupiter-sized planet of – using MESA. We employed 1D spherical approximations of both the heating of the envelope by the planet and the resulting hydrodynamical evolution.
For host stars on the first-ascent RGB, as well as for AGB stars with low-mass () planets, an engulfed planet causes a mild-to-moderate adjustment of the stellar structure. The star brightens by up to mag over a few years and dims again on a Kelvin–Helmholtz timescale. Bright RGB and AGB stars display a prominent ‘double peak’ in the light curve. The first peak is associated with hydrogen recombination in the outer layers.
For late AGB stars, an engulfed planet of sufficient mass deposits a major disturbance in the envelope, characterized by supersonic expansion of the outer layers. In the short term, these systems produce bright, red, dusty eruptions powered by hydrogen recombination, similar to LRNe. Their long-term evolution is unclear due to a combination of numerical limitations, the potential importance of 3D hydrodynamical effects, and the uncertain role of dust grains. Future works may be able to address some of these issues following recent studies of red supergiant stars undergoing pre-supernova outbursts and failed supernovae (e.g. Ro & Matzner, 2017; Fuller, 2017; Coughlin et al., 2018; Linial et al., 2021; Matzner & Ro, 2021; Tsang et al., 2022). Regardless of the fate of the envelope, we find that the planet is always tidally disrupted.
The optical/infrared transients produced by planetary engulfment events may be observed by current and upcoming time-domain facilities. The expected Galactic event rates for ‘weak red transients’ and ‘red novae’ caused by planetary engulfment are and , respectively. These RNe are dimmer and of longer duration than those caused by stellar mergers.
We find that short-period, Jupiter-mass planets around WDs are unlikely to have arrived in their observed orbits via a CE phase. However, we have only considered engulfment events involving a single planet. In a multi-planet system, it is possible for the star to engulf several planets successively. In principle, our method could be extended to apply to this scenario, with each planet acting as an independent heat source embedded in the envelope, provided the planets’ mutual gravitational interactions are negligible. Successive engulfment events offer better prospects for envelope ejection: even if the first planet cannot eject the envelope, it may do enough ‘damage’ that the second ejects the envelope and survives (Chamandy et al., 2021). Multi-planet engulfment events may in fact be common: roughly of cold Jupiters have an outer companion of comparable mass (Bryan et al., 2016). A common-envelope origin for massive, short-period giant planets around WDs cannot be categorically dismissed.
We close by remarking on the main uncertainties and caveats of this work. Some obvious limitations arise from the assumption of 1D spherical symmetry in both the heating of the envelope by an engulfed planet and the dynamical and thermal responses. This is an adequate approximation while the planet is engulfed well below the stellar surface and if the stellar response is in the quasistatic regime. There may be observable phenomena associated with the grazing phase of an engulfment event that we do not consider. In cases where the envelope is hydrodynamically disrupted, 3D hydrodynamics simulations of the envelope are desirable to characterize the evolution of the ejecta (cf. Staff et al., 2016; Tsang et al., 2022). We note that several first-ascent RGB stars possess extended, dusty circumstellar disks that may have formed during the engulfment of low-mass companions (e.g. Jura, 2003; Zuckerman et al., 2008; Melis et al., 2009; Melis, 2020).
We neglected the transfer of the planet’s orbital angular momentum to the stellar envelope. This would affect the late stages of inspiral (including prospects for planetary survival) and the dynamics of envelope ejection. We plan to incorporate angular-momentum evolution in a future study using MESA.
Finally, we did not consider the fate of planetary debris after tidal disruption. This may alter the total energy budget of the engulfment process (see Section 3.4), potentially altering the predictions we have made in this work. Additional mixing and thermal processes after tidal disruption therefore should also be addressed in a future study.
References
- Aguilera-Gómez et al. (2016) Aguilera-Gómez, C., Chanamé, J., Pinsonneault, M. H., & Carlberg, J. K. 2016, ApJ, 829, 127, doi: 10.3847/0004-637X/829/2/127
- Alexander (1967) Alexander, J. B. 1967, The Observatory, 87, 238
- Anderson et al. (2020) Anderson, K. R., Lai, D., & Pu, B. 2020, MNRAS, 491, 1369, doi: 10.1093/mnras/stz3119
- Anderson et al. (2016) Anderson, K. R., Storch, N. I., & Lai, D. 2016, MNRAS, 456, 3671, doi: 10.1093/mnras/stv2906
- Angulo et al. (1999) Angulo, C., Arnould, M., Rayet, M., et al. 1999, Nucl. Phys. A, 656, 3, doi: 10.1016/S0375-9474(99)00030-5
- Arras & Bildsten (2006) Arras, P., & Bildsten, L. 2006, ApJ, 650, 394, doi: 10.1086/506011
- Asplund et al. (2009) Asplund, M., Grevesse, N., Sauval, A. J., & Scott, P. 2009, ARA&A, 47, 481, doi: 10.1146/annurev.astro.46.060407.145222
- Bailey & Hiatt (1972) Bailey, A. B., & Hiatt, J. 1972, AIAA Journal, 10, 1436, doi: 10.2514/3.50387
- Bear et al. (2011a) Bear, E., Kashi, A., & Soker, N. 2011a, MNRAS, 416, 1965, doi: 10.1111/j.1365-2966.2011.19171.x
- Bear et al. (2021) Bear, E., Merlov, A., Arad, Y., & Soker, N. 2021, MNRAS, 507, 414, doi: 10.1093/mnras/stab2149
- Bear & Soker (2011) Bear, E., & Soker, N. 2011, MNRAS, 411, 1792, doi: 10.1111/j.1365-2966.2010.17808.x
- Bear & Soker (2014) —. 2014, MNRAS, 444, 1698, doi: 10.1093/mnras/stu1529
- Bear et al. (2011b) Bear, E., Soker, N., & Harpaz, A. 2011b, ApJ, 733, L44, doi: 10.1088/2041-8205/733/2/L44
- Behmard et al. (2022a) Behmard, A., Dai, F., Brewer, J. M., Berger, T. A., & Howard, A. W. 2022a, arXiv e-prints, arXiv:2210.12121. https://arxiv.org/abs/2210.12121
- Behmard et al. (2022b) Behmard, A., Sevilla, J., & Fuller, J. 2022b, arXiv e-prints, arXiv:2210.11679. https://arxiv.org/abs/2210.11679
- Blackman et al. (2021) Blackman, J. W., Beaulieu, J. P., Bennett, D. P., et al. 2021, Nature, 598, 272, doi: 10.1038/s41586-021-03869-6
- Blöcker (1995) Blöcker, T. 1995, A&A, 297, 727
- Blouin et al. (2020) Blouin, S., Shaffer, N. R., Saumon, D., & Starrett, C. E. 2020, ApJ, 899, 46, doi: 10.3847/1538-4357/ab9e75
- Boyle (2018) Boyle, L. A. 2018, PhD thesis, National University of Ireland Galway
- Brunner et al. (2019) Brunner, M., Mecina, M., Maercker, M., et al. 2019, A&A, 621, A50, doi: 10.1051/0004-6361/201833652
- Bryan et al. (2016) Bryan, M. L., Knutson, H. A., Howard, A. W., et al. 2016, ApJ, 821, 89, doi: 10.3847/0004-637X/821/2/89
- Cabezón et al. (2022) Cabezón, R. M., Abia, C., Domínguez, I., & García-Senz, D. 2022, arXiv e-prints, arXiv:2210.17363. https://arxiv.org/abs/2210.17363
- Carlberg et al. (2012) Carlberg, J. K., Cunha, K., Smith, V. V., & Majewski, S. R. 2012, ApJ, 757, 109, doi: 10.1088/0004-637X/757/2/109
- Carlberg et al. (2009) Carlberg, J. K., Majewski, S. R., & Arras, P. 2009, ApJ, 700, 832, doi: 10.1088/0004-637X/700/1/832
- Cassisi et al. (2007) Cassisi, S., Potekhin, A. Y., Pietrinferni, A., Catelan, M., & Salaris, M. 2007, ApJ, 661, 1094, doi: 10.1086/516819
- Chamandy et al. (2021) Chamandy, L., Blackman, E. G., Nordhaus, J., & Wilson, E. 2021, MNRAS, 502, L110, doi: 10.1093/mnrasl/slab017
- Charpinet et al. (2011) Charpinet, S., Fontaine, G., Brassard, P., et al. 2011, Nature, 480, 496, doi: 10.1038/nature10631
- Chatterjee et al. (2008) Chatterjee, S., Ford, E. B., Matsumura, S., & Rasio, F. A. 2008, ApJ, 686, 580, doi: 10.1086/590227
- Chugunov et al. (2007) Chugunov, A. I., Dewitt, H. E., & Yakovlev, D. G. 2007, Phys. Rev. D, 76, 025028, doi: 10.1103/PhysRevD.76.025028
- Clayton et al. (2017) Clayton, M., Podsiadlowski, P., Ivanova, N., & Justham, S. 2017, MNRAS, 470, 1788, doi: 10.1093/mnras/stx1290
- Clyne et al. (2014) Clyne, N., Redman, M. P., Lloyd, M., et al. 2014, A&A, 569, A50, doi: 10.1051/0004-6361/201322118
- Coughlin et al. (2018) Coughlin, E. R., Quataert, E., Fernández, R., & Kasen, D. 2018, MNRAS, 477, 1225, doi: 10.1093/mnras/sty667
- Cumming et al. (2008) Cumming, A., Butler, R. P., Marcy, G. W., et al. 2008, PASP, 120, 531, doi: 10.1086/588487
- Cyburt et al. (2010) Cyburt, R. H., Amthor, A. M., Ferguson, R., et al. 2010, ApJS, 189, 240, doi: 10.1088/0067-0049/189/1/240
- Duncan & Lissauer (1998) Duncan, M. J., & Lissauer, J. J. 1998, Icarus, 134, 303, doi: 10.1006/icar.1998.5962
- Eggleton (1983) Eggleton, P. P. 1983, ApJ, 268, 368, doi: 10.1086/160960
- Ferguson et al. (2005) Ferguson, J. W., Alexander, D. R., Allard, F., et al. 2005, ApJ, 623, 585, doi: 10.1086/428642
- Fernandes et al. (2019) Fernandes, R. B., Mulders, G. D., Pascucci, I., Mordasini, C., & Emsenhuber, A. 2019, ApJ, 874, 81, doi: 10.3847/1538-4357/ab0300
- Fressin et al. (2013) Fressin, F., Torres, G., Charbonneau, D., et al. 2013, ApJ, 766, 81, doi: 10.1088/0004-637X/766/2/81
- Fuller et al. (1985) Fuller, G. M., Fowler, W. A., & Newman, M. J. 1985, ApJ, 293, 1, doi: 10.1086/163208
- Fuller (2017) Fuller, J. 2017, MNRAS, 470, 1642, doi: 10.1093/mnras/stx1314
- Fulton et al. (2021) Fulton, B. J., Rosenthal, L. J., Hirsch, L. A., et al. 2021, ApJS, 255, 14, doi: 10.3847/1538-4365/abfcc1
- Gagnier & Pejcha (2023) Gagnier, D., & Pejcha, O. 2023, arXiv e-prints, arXiv:2302.00691, doi: 10.48550/arXiv.2302.00691
- Gaia Collaboration et al. (2022) Gaia Collaboration, Arenou, F., Babusiaux, C., et al. 2022, arXiv e-prints, arXiv:2206.05595, doi: 10.48550/arXiv.2206.05595
- Geier et al. (2009) Geier, S., Edelmann, H., Heber, U., & Morales-Rueda, L. 2009, ApJ, 702, L96, doi: 10.1088/0004-637X/702/1/L96
- Ghezzi et al. (2018) Ghezzi, L., Montet, B. T., & Johnson, J. A. 2018, ApJ, 860, 109, doi: 10.3847/1538-4357/aac37c
- Glanz & Perets (2018) Glanz, H., & Perets, H. B. 2018, MNRAS, 478, L12, doi: 10.1093/mnrasl/sly065
- Grichener et al. (2018) Grichener, A., Sabach, E., & Soker, N. 2018, MNRAS, 478, 1818, doi: 10.1093/mnras/sty1178
- Guidarelli et al. (2022) Guidarelli, G., Nordhaus, J., Carroll-Nellenback, J., et al. 2022, MNRAS, 511, 5994, doi: 10.1093/mnras/stac463
- Guillot et al. (1996) Guillot, T., Burrows, A., Hubbard, W. B., Lunine, J. I., & Saumon, D. 1996, ApJ, 459, L35, doi: 10.1086/309935
- Gurevich et al. (2022) Gurevich, O., Bear, E., & Soker, N. 2022, MNRAS, 511, 1330, doi: 10.1093/mnras/stac081
- Hamer & Schlaufman (2019) Hamer, J. H., & Schlaufman, K. C. 2019, AJ, 158, 190, doi: 10.3847/1538-3881/ab3c56
- Harpaz & Soker (1994) Harpaz, A., & Soker, N. 1994, MNRAS, 270, 734, doi: 10.1093/mnras/270.4.734
- Harris et al. (2020) Harris, C. R., Millman, K. J., van der Walt, S. J., et al. 2020, Nature, 585, 357, doi: 10.1038/s41586-020-2649-2
- Howitt et al. (2020) Howitt, G., Stevenson, S., Vigna-Gómez, A., et al. 2020, MNRAS, 492, 3229, doi: 10.1093/mnras/stz3542
- Hunter (2007) Hunter, J. D. 2007, Computing in Science and Engineering, 9, 90, doi: 10.1109/MCSE.2007.55
- Iglesias & Rogers (1993) Iglesias, C. A., & Rogers, F. J. 1993, ApJ, 412, 752, doi: 10.1086/172958
- Iglesias & Rogers (1996) —. 1996, ApJ, 464, 943, doi: 10.1086/177381
- Irwin (2004) Irwin, A. W. 2004, The FreeEOS Code for Calculating the Equation of State for Stellar Interiors. http://freeeos.sourceforge.net/
- Itoh et al. (1996) Itoh, N., Hayashi, H., Nishikawa, A., & Kohyama, Y. 1996, ApJS, 102, 411, doi: 10.1086/192264
- Ivanova (2018) Ivanova, N. 2018, ApJ, 858, L24, doi: 10.3847/2041-8213/aac101
- Ivanova et al. (2013) Ivanova, N., Justham, S., Chen, X., et al. 2013, A&A Rev., 21, 59, doi: 10.1007/s00159-013-0059-2
- Iwanek et al. (2022) Iwanek, P., Soszyński, I., Kozłowski, S., et al. 2022, ApJS, 260, 46, doi: 10.3847/1538-4365/ac6676
- Izumiura et al. (1997) Izumiura, H., Waters, L. B. F. M., de Jong, T., et al. 1997, A&A, 323, 449
- Jackson et al. (2008) Jackson, B., Greenberg, R., & Barnes, R. 2008, ApJ, 678, 1396, doi: 10.1086/529187
- Jackson et al. (2016) Jackson, B., Jensen, E., Peacock, S., Arras, P., & Penev, K. 2016, Celestial Mechanics and Dynamical Astronomy, 126, 227, doi: 10.1007/s10569-016-9704-1
- Jermyn et al. (2021) Jermyn, A. S., Schwab, J., Bauer, E., Timmes, F. X., & Potekhin, A. Y. 2021, ApJ, 913, 72, doi: 10.3847/1538-4357/abf48e
- Jermyn et al. (2022) Jermyn, A. S., Bauer, E. B., Schwab, J., et al. 2022, arXiv e-prints, arXiv:2208.03651. https://arxiv.org/abs/2208.03651
- Jia & Spruit (2017) Jia, S., & Spruit, H. C. 2017, MNRAS, 465, 149, doi: 10.1093/mnras/stw1693
- Jia & Spruit (2018) —. 2018, ApJ, 864, 169, doi: 10.3847/1538-4357/aad77c
- Johnson et al. (2010) Johnson, J. A., Aller, K. M., Howard, A. W., & Crepp, J. R. 2010, PASP, 122, 905, doi: 10.1086/655775
- Jones & Jenkins (2014) Jones, M. I., & Jenkins, J. S. 2014, A&A, 562, A129, doi: 10.1051/0004-6361/201322132
- Jones et al. (2016) Jones, M. I., Jenkins, J. S., Brahm, R., et al. 2016, A&A, 590, A38, doi: 10.1051/0004-6361/201628067
- Jura (2003) Jura, M. 2003, ApJ, 582, 1032, doi: 10.1086/344704
- Karambelkar et al. (2022) Karambelkar, V. R., Kasliwal, M. M., Blagorodnova, N., et al. 2022, arXiv e-prints, arXiv:2211.05141, doi: 10.48550/arXiv.2211.05141
- Kashi et al. (2019) Kashi, A., Michaelis, A. M., & Feigin, L. 2019, Galaxies, 8, 2, doi: 10.3390/galaxies8010002
- Kashi & Soker (2017) Kashi, A., & Soker, N. 2017, MNRAS, 468, 4938, doi: 10.1093/mnras/stx767
- Kastner & Wilson (2021) Kastner, J. H., & Wilson, E. 2021, ApJ, 922, 24, doi: 10.3847/1538-4357/ac1f2e
- Kerschbaum et al. (2017) Kerschbaum, F., Maercker, M., Brunner, M., et al. 2017, A&A, 605, A116, doi: 10.1051/0004-6361/201730665
- Kim & Kim (2009) Kim, H., & Kim, W.-T. 2009, ApJ, 703, 1278, doi: 10.1088/0004-637X/703/2/1278
- Kluyver et al. (2016) Kluyver, T., Ragan-Kelley, B., Pérez, F., et al. 2016, in IOS Press, 87–90, doi: 10.3233/978-1-61499-649-1-87
- Kochanek et al. (2014) Kochanek, C. S., Adams, S. M., & Belczynski, K. 2014, MNRAS, 443, 1319, doi: 10.1093/mnras/stu1226
- Kruckow et al. (2021) Kruckow, M. U., Neunteufel, P. G., Di Stefano, R., Gao, Y., & Kobayashi, C. 2021, ApJ, 920, 86, doi: 10.3847/1538-4357/ac13ac
- Krzesinski (2015) Krzesinski, J. 2015, A&A, 581, A7, doi: 10.1051/0004-6361/201526346
- Lagos et al. (2021) Lagos, F., Schreiber, M. R., Zorotovic, M., et al. 2021, MNRAS, 501, 676, doi: 10.1093/mnras/staa3703
- Langanke & Martínez-Pinedo (2000) Langanke, K., & Martínez-Pinedo, G. 2000, Nuclear Physics A, 673, 481, doi: 10.1016/S0375-9474(00)00131-7
- Lau et al. (2022) Lau, M. Y. M., Cantiello, M., Jermyn, A. S., et al. 2022, arXiv e-prints, arXiv:2210.15848. https://arxiv.org/abs/2210.15848
- Levrard et al. (2009) Levrard, B., Winisdoerffer, C., & Chabrier, G. 2009, ApJ, 692, L9, doi: 10.1088/0004-637X/692/1/L9
- Li et al. (2020) Li, X., Chang, P., Levin, Y., Matzner, C. D., & Armitage, P. J. 2020, MNRAS, 494, 2327, doi: 10.1093/mnras/staa900
- Linial et al. (2021) Linial, I., Fuller, J., & Sari, R. 2021, MNRAS, 501, 4266, doi: 10.1093/mnras/staa3969
- Livio & Soker (1984) Livio, M., & Soker, N. 1984, MNRAS, 208, 763, doi: 10.1093/mnras/208.4.763
- Livio & Soker (2002) —. 2002, ApJ, 571, L161, doi: 10.1086/341411
- MacLeod et al. (2017) MacLeod, M., Antoni, A., Murguia-Berthier, A., Macias, P., & Ramirez-Ruiz, E. 2017, ApJ, 838, 56, doi: 10.3847/1538-4357/aa6117
- MacLeod et al. (2018) MacLeod, M., Cantiello, M., & Soares-Furtado, M. 2018, ApJ, 853, L1, doi: 10.3847/2041-8213/aaa5fa
- MacLeod & Loeb (2020a) MacLeod, M., & Loeb, A. 2020a, ApJ, 893, 106, doi: 10.3847/1538-4357/ab822e
- MacLeod & Loeb (2020b) —. 2020b, ApJ, 895, 29, doi: 10.3847/1538-4357/ab89b6
- Maercker et al. (2016) Maercker, M., Vlemmings, W. H. T., Brunner, M., et al. 2016, A&A, 586, A5, doi: 10.1051/0004-6361/201527128
- Matzner & Ro (2021) Matzner, C. D., & Ro, S. 2021, ApJ, 908, 23, doi: 10.3847/1538-4357/abd03b
- Maxted et al. (2006) Maxted, P. F. L., Napiwotzki, R., Dobbie, P. D., & Burleigh, M. R. 2006, Nature, 442, 543, doi: 10.1038/nature04987
- Mayor et al. (2011) Mayor, M., Marmier, M., Lovis, C., et al. 2011, arXiv e-prints, arXiv:1109.2497. https://arxiv.org/abs/1109.2497
- Melis (2020) Melis, C. 2020, Research Notes of the American Astronomical Society, 4, 238, doi: 10.3847/2515-5172/abd32a
- Melis et al. (2009) Melis, C., Zuckerman, B., Song, I., Rhee, J. H., & Metchev, S. 2009, ApJ, 696, 1964, doi: 10.1088/0004-637X/696/2/1964
- Merlov et al. (2021) Merlov, A., Bear, E., & Soker, N. 2021, ApJ, 915, L34, doi: 10.3847/2041-8213/ac0f7d
- Metzger et al. (2012) Metzger, B. D., Giannios, D., & Spiegel, D. S. 2012, MNRAS, 425, 2778, doi: 10.1111/j.1365-2966.2012.21444.x
- Metzger et al. (2017) Metzger, B. D., Shen, K. J., & Stone, N. 2017, MNRAS, 468, 4399, doi: 10.1093/mnras/stx823
- Mečina et al. (2014) Mečina, M., Kerschbaum, F., Groenewegen, M. A. T., et al. 2014, A&A, 566, A69, doi: 10.1051/0004-6361/201321117
- Muñoz & Petrovich (2020) Muñoz, D. J., & Petrovich, C. 2020, ApJ, 904, L3, doi: 10.3847/2041-8213/abc564
- Mustill & Villaver (2012) Mustill, A. J., & Villaver, E. 2012, ApJ, 761, 121, doi: 10.1088/0004-637X/761/2/121
- Nagasawa et al. (2008) Nagasawa, M., Ida, S., & Bessho, T. 2008, ApJ, 678, 498, doi: 10.1086/529369
- Naoz et al. (2012) Naoz, S., Farr, W. M., & Rasio, F. A. 2012, ApJ, 754, L36, doi: 10.1088/2041-8205/754/2/L36
- Nelemans (2010) Nelemans, G. 2010, Ap&SS, 329, 25, doi: 10.1007/s10509-010-0392-0
- Nelemans & Tauris (1998) Nelemans, G., & Tauris, T. M. 1998, A&A, 335, L85, doi: 10.48550/arXiv.astro-ph/9806011
- Nordhaus & Blackman (2006) Nordhaus, J., & Blackman, E. G. 2006, MNRAS, 370, 2004, doi: 10.1111/j.1365-2966.2006.10625.x
- Nordhaus et al. (2011) Nordhaus, J., Wellons, S., Spiegel, D. S., Metzger, B. D., & Blackman, E. G. 2011, Proceedings of the National Academy of Science, 108, 3135, doi: 10.1073/pnas.1015005108
- Norris et al. (2011) Norris, J. M., Wright, J. T., Wade, R. A., Mahadevan, S., & Gettel, S. 2011, ApJ, 743, 88, doi: 10.1088/0004-637X/743/1/88
- O’Connor et al. (2021) O’Connor, C. E., Liu, B., & Lai, D. 2021, MNRAS, 501, 507, doi: 10.1093/mnras/staa3723
- Oda et al. (1994) Oda, T., Hino, M., Muto, K., Takahara, M., & Sato, K. 1994, Atomic Data and Nuclear Data Tables, 56, 231, doi: 10.1006/adnd.1994.1007
- Oh et al. (2018) Oh, S., Price-Whelan, A. M., Brewer, J. M., et al. 2018, ApJ, 854, 138, doi: 10.3847/1538-4357/aaab4d
- Olofsson et al. (1988) Olofsson, H., Eriksson, K., & Gustafsson, B. 1988, A&A, 196, L1
- Ostriker (1999) Ostriker, E. C. 1999, ApJ, 513, 252, doi: 10.1086/306858
- Paczyński & Ziółkowski (1968) Paczyński, B., & Ziółkowski, J. 1968, Acta Astron., 18, 255
- Paxton et al. (2011) Paxton, B., Bildsten, L., Dotter, A., et al. 2011, ApJS, 192, 3, doi: 10.1088/0067-0049/192/1/3
- Paxton et al. (2013) Paxton, B., Cantiello, M., Arras, P., et al. 2013, ApJS, 208, 4, doi: 10.1088/0067-0049/208/1/4
- Paxton et al. (2015) Paxton, B., Marchant, P., Schwab, J., et al. 2015, ApJS, 220, 15, doi: 10.1088/0067-0049/220/1/15
- Paxton et al. (2018) Paxton, B., Schwab, J., Bauer, E. B., et al. 2018, ApJS, 234, 34, doi: 10.3847/1538-4365/aaa5a8
- Paxton et al. (2019) Paxton, B., Smolec, R., Schwab, J., et al. 2019, ApJS, 243, 10, doi: 10.3847/1538-4365/ab2241
- Pérez & Granger (2007) Pérez, F., & Granger, B. E. 2007, Computing in Science and Engineering, 9, 21, doi: 10.1109/MCSE.2007.53
- Petigura et al. (2013) Petigura, E. A., Howard, A. W., & Marcy, G. W. 2013, Proceedings of the National Academy of Science, 110, 19273, doi: 10.1073/pnas.1319909110
- Petrovich (2015a) Petrovich, C. 2015a, ApJ, 799, 27, doi: 10.1088/0004-637X/799/1/27
- Petrovich (2015b) —. 2015b, ApJ, 808, 120, doi: 10.1088/0004-637X/808/2/120
- Potekhin & Chabrier (2010) Potekhin, A. Y., & Chabrier, G. 2010, Contributions to Plasma Physics, 50, 82, doi: 10.1002/ctpp.201010017
- Privitera et al. (2016) Privitera, G., Meynet, G., Eggenberger, P., et al. 2016, A&A, 593, A128, doi: 10.1051/0004-6361/201628758
- Qureshi et al. (2018) Qureshi, A., Naoz, S., & Shkolnik, E. L. 2018, ApJ, 864, 65, doi: 10.3847/1538-4357/aad562
- Rapoport et al. (2021) Rapoport, I., Bear, E., & Soker, N. 2021, MNRAS, 506, 468, doi: 10.1093/mnras/stab1774
- Rasio & Ford (1996) Rasio, F. A., & Ford, E. B. 1996, Science, 274, 954, doi: 10.1126/science.274.5289.954
- Reffert et al. (2015) Reffert, S., Bergmann, C., Quirrenbach, A., Trifonov, T., & Künstler, A. 2015, A&A, 574, A116, doi: 10.1051/0004-6361/201322360
- Reimers (1975) Reimers, D. 1975, Memoires of the Societe Royale des Sciences de Liege, 8, 369
- Retter & Marom (2003) Retter, A., & Marom, A. 2003, MNRAS, 345, L25, doi: 10.1046/j.1365-8711.2003.07190.x
- Retter et al. (2006) Retter, A., Zhang, B., Siess, L., & Levinson, A. 2006, MNRAS, 370, 1573, doi: 10.1111/j.1365-2966.2006.10585.x
- Retter et al. (2007) Retter, A., Zhang, B., Siess, L., Levinson, A., & Marom, A. 2007, in Astronomical Society of the Pacific Conference Series, Vol. 363, The Nature of V838 Mon and its Light Echo, ed. R. L. M. Corradi & U. Munari, 271, doi: 10.48550/arXiv.astro-ph/0606497
- Reyes-Ruiz & López (1999) Reyes-Ruiz, M., & López, J. A. 1999, ApJ, 524, 952, doi: 10.1086/307827
- Ro & Matzner (2017) Ro, S., & Matzner, C. D. 2017, ApJ, 841, 9, doi: 10.3847/1538-4357/aa6d5c
- Rogers & Nayfonov (2002) Rogers, F. J., & Nayfonov, A. 2002, ApJ, 576, 1064, doi: 10.1086/341894
- Ronco et al. (2020) Ronco, M. P., Schreiber, M. R., Giuppone, C. A., et al. 2020, ApJ, 898, L23, doi: 10.3847/2041-8213/aba35f
- Röpke & De Marco (2022) Röpke, F. K., & De Marco, O. 2022, arXiv e-prints, arXiv:2212.07308, doi: 10.48550/arXiv.2212.07308
- Sabach et al. (2017) Sabach, E., Hillel, S., Schreier, R., & Soker, N. 2017, MNRAS, 472, 4361, doi: 10.1093/mnras/stx2272
- Saumon et al. (1995) Saumon, D., Chabrier, G., & van Horn, H. M. 1995, ApJS, 99, 713, doi: 10.1086/192204
- Setiawan et al. (2010) Setiawan, J., Klement, R. J., Henning, T., et al. 2010, Science, 330, 1642, doi: 10.1126/science.1193342
- Sevilla et al. (2022) Sevilla, J., Behmard, A., & Fuller, J. 2022, MNRAS, 516, 3354, doi: 10.1093/mnras/stac2436
- Siess & Livio (1999a) Siess, L., & Livio, M. 1999a, MNRAS, 304, 925, doi: 10.1046/j.1365-8711.1999.02376.x
- Siess & Livio (1999b) —. 1999b, MNRAS, 308, 1133, doi: 10.1046/j.1365-8711.1999.02784.x
- Soker (1992a) Soker, N. 1992a, ApJ, 386, 190, doi: 10.1086/171004
- Soker (1992b) —. 1992b, ApJ, 399, 185, doi: 10.1086/171915
- Soker (1998a) —. 1998a, AJ, 116, 1308, doi: 10.1086/300503
- Soker (1998b) —. 1998b, MNRAS, 299, 1242, doi: 10.1046/j.1365-8711.1998.01884.x
- Soker (2018) —. 2018, Galaxies, 6, 58, doi: 10.3390/galaxies6020058
- Soker et al. (1984) Soker, N., Livio, M., & Harpaz, A. 1984, MNRAS, 210, 189, doi: 10.1093/mnras/210.2.189
- Spina et al. (2021) Spina, L., Sharma, P., Meléndez, J., et al. 2021, Nature Astronomy, 5, 1163, doi: 10.1038/s41550-021-01451-8
- Staff et al. (2016) Staff, J. E., De Marco, O., Wood, P., Galaviz, P., & Passy, J.-C. 2016, MNRAS, 458, 832, doi: 10.1093/mnras/stw331
- Stephan et al. (2018) Stephan, A. P., Naoz, S., & Gaudi, B. S. 2018, AJ, 156, 128, doi: 10.3847/1538-3881/aad6e5
- Stephan et al. (2021) —. 2021, ApJ, 922, 4, doi: 10.3847/1538-4357/ac22a9
- Stephan et al. (2020) Stephan, A. P., Naoz, S., Gaudi, B. S., & Salas, J. M. 2020, ApJ, 889, 45, doi: 10.3847/1538-4357/ab5b00
- Thun et al. (2016) Thun, D., Kuiper, R., Schmidt, F., & Kley, W. 2016, A&A, 589, A10, doi: 10.1051/0004-6361/201527629
- Timmes & Swesty (2000) Timmes, F. X., & Swesty, F. D. 2000, ApJS, 126, 501, doi: 10.1086/313304
- Tsang et al. (2022) Tsang, B. T. H., Kasen, D., & Bildsten, L. 2022, ApJ, 936, 28, doi: 10.3847/1538-4357/ac83bc
- Tylenda & Soker (2006) Tylenda, R., & Soker, N. 2006, A&A, 451, 223, doi: 10.1051/0004-6361:20054201
- Tylenda et al. (2013) Tylenda, R., Kamiński, T., Udalski, A., et al. 2013, A&A, 555, A16, doi: 10.1051/0004-6361/201321647
- Valsecchi et al. (2014) Valsecchi, F., Rasio, F. A., & Steffen, J. H. 2014, ApJ, 793, L3, doi: 10.1088/2041-8205/793/1/L3
- van Roestel et al. (2021) van Roestel, J., Kupfer, T., Bell, K. J., et al. 2021, ApJ, 919, L26, doi: 10.3847/2041-8213/ac22b7
- Vanderburg et al. (2020) Vanderburg, A., Rappaport, S. A., Xu, S., et al. 2020, Nature, 585, 363, doi: 10.1038/s41586-020-2713-y
- Vick & Lai (2020) Vick, M., & Lai, D. 2020, MNRAS, 496, 3767, doi: 10.1093/mnras/staa1784
- Villaver & Livio (2007) Villaver, E., & Livio, M. 2007, ApJ, 661, 1192, doi: 10.1086/516746
- Villaver & Livio (2009) —. 2009, ApJ, 705, L81, doi: 10.1088/0004-637X/705/1/L81
- Virtanen et al. (2020) Virtanen, P., Gommers, R., Oliphant, T. E., et al. 2020, Nature Methods, 17, 261, doi: 10.1038/s41592-019-0686-2
- Wilson & Nordhaus (2019) Wilson, E. C., & Nordhaus, J. 2019, MNRAS, 485, 4492, doi: 10.1093/mnras/stz601
- Wilson & Nordhaus (2020) —. 2020, MNRAS, 497, 1895, doi: 10.1093/mnras/staa2088
- Wilson & Nordhaus (2022) —. 2022, MNRAS, 516, 2189, doi: 10.1093/mnras/stac2300
- Xu et al. (2021) Xu, S., Diamond-Lowe, H., MacDonald, R. J., et al. 2021, AJ, 162, 296, doi: 10.3847/1538-3881/ac2d26
- Yarza et al. (2022) Yarza, R., Razo Lopez, N., Murguia-Berthier, A., et al. 2022, arXiv e-prints, arXiv:2203.11227. https://arxiv.org/abs/2203.11227
- Yu et al. (2018) Yu, J., Huber, D., Bedding, T. R., et al. 2018, ApJS, 236, 42, doi: 10.3847/1538-4365/aaaf74
- Zahn (1977) Zahn, J. P. 1977, A&A, 57, 383
- Zahn (1989) —. 1989, A&A, 220, 112
- Zapolsky & Salpeter (1969) Zapolsky, H. S., & Salpeter, E. E. 1969, ApJ, 158, 809, doi: 10.1086/150240
- Zhu et al. (2018) Zhu, W., Petrovich, C., Wu, Y., Dong, S., & Xie, J. 2018, ApJ, 860, 101, doi: 10.3847/1538-4357/aac6d5
- Zink et al. (2019) Zink, J. K., Christiansen, J. L., & Hansen, B. M. S. 2019, MNRAS, 483, 4479, doi: 10.1093/mnras/sty3463
- Zorotovic & Schreiber (2022) Zorotovic, M., & Schreiber, M. 2022, MNRAS, 513, 3587, doi: 10.1093/mnras/stac1137
- Zuckerman et al. (2008) Zuckerman, B., Melis, C., Song, I., et al. 2008, ApJ, 683, 1085, doi: 10.1086/587448