Simulating Atomic Dark Matter in Milky Way Analogues
Abstract
Dark sector theories naturally lead to multi-component scenarios for dark matter where a sub-component can dissipate energy through self-interactions, allowing it to efficiently cool inside galaxies. We present the first cosmological hydrodynamical simulations of Milky Way analogues where the majority of dark matter is collisionless Cold Dark Matter (CDM), but a sub-component (6%) is strongly dissipative minimal Atomic Dark Matter (ADM). The simulations, implemented in GIZMO and utilizing FIRE-2 galaxy formation physics to model the standard baryonic sector, demonstrate that the addition of even a small fraction of dissipative dark matter can significantly impact galactic evolution despite being consistent with current cosmological constraints. We show that ADM gas with roughly Standard-Model-like masses and couplings can cool to form a rotating “dark disk” with angular momentum closely aligned with the visible stellar disk. The morphology of the disk depends sensitively on the parameters of the ADM model, which affect the cooling rates in the dark sector. The majority of the ADM gas gravitationally collapses into dark “clumps” (regions of black hole or mirror star formation), which form a prominent bulge and a rotating thick disk in the central galaxy. These clumps form early and quickly sink to the inner kpc of the galaxy, affecting the galaxy’s star-formation history and present-day baryonic and CDM distributions.
1 Introduction
The Cold Dark Matter (CDM) model successfully describes structure on the largest scales of the Universe (Aghanim et al., 2020). However, strong theoretical arguments motivate extensions to the CDM framework that alter structure on sub-galactic scales: a more complex “dark sector” may contain multiple DM particles and new forces (Bertone & Tait, 2018). These include Hidden Valleys (Strassler & Zurek, 2007) and theories where the dark sector is related to the Standard Model by a discrete symmetry, such as the Twin Higgs model (Chacko et al., 2006, 2017, 2018), which solves the electroweak hierarchy problem, and Mirror DM (Berezhiani et al., 2006; Foot, 2004; Mohapatra & Teplitz, 2000).
Dark sectors frequently include a fraction of DM with dissipative self-interactions, which can cool and clump in opposition to the purely gravitational dynamics of CDM. A useful benchmark model for such scenarios is Atomic Dark Matter (ADM), which consists of a dark proton, , and dark electron, , that interact through a massless dark photon with coupling, (Kaplan et al., 2009). The ADM can form a dark hydrogen bound-state and radiatively cools in direct analogy to the Standard Model. We assume a minimal model that has no dark nuclear physics and only couples to the Standard Model through gravity. Moreover, we assume that the ADM abundance is set asymmetrically, so that the abundance of dark anti-particles is negligible (Zurek, 2013; Kaplan et al., 2011). Minimal ADM is a plausible theory in its own right, but also arises within the more complete frameworks mentioned above, making it a highly motivated subject for detailed study.
| Simulation | Included Species | ||||||||||
| CDM | CDM+Bar. | 0.83 | 2.79 | 0 | - | 0.17 | - | - | - | - | |
| CDM-NF | CDM+Bar., no FB | 0.83 | 2.79 | 0 | - | 0.17 | - | - | - | - | |
| ADM-1 | CDM+ADM-1+Bar. | 0.78 | 2.62 | 0.06 | 1.67 | 0.17 | 0.39 | ||||
| ADM-2 | CDM+ADM-2+Bar. | 0.78 | 2.62 | 0.06 | 1.67 | 0.17 | 0.39 | ||||
On cosmic scales, ADM manifests through dark acoustic oscillations and contributions to (Cyr-Racine et al., 2014; Gurian et al., 2022a). Current cosmological constraints allow for ADM to comprise of the DM for a wide range of parameters (Bansal et al., 2022b, a). On much smaller scales, the signatures of an ADM sub-component can potentially be spectacular. ADM gas clouds can collapse and condense into dark compact objects, giving rise to dark white dwarfs (Ryan & Radice, 2022) and non-stellar-mass black holes (Shandera et al., 2018; Fernandez et al., 2022), as well as mirror (neutron) stars (Curtin & Setford, 2020a, b; Hippert et al., 2022b, a) (if there is dark nuclear physics).
On galactic scales, the effects of a dissipative DM subcomponent could be equally dramatic, including the formation of a dark disk and modifications to halo structure (Fan et al., 2013; Ghalsasi & McQuinn, 2017; Chang et al., 2018; Huo et al., 2020; Shen et al., 2021, 2022; Ryan et al., 2022b). This behavior is remarkably different from CDM, which survives in an extended halo because it experiences no energy loss. However, a quantitative understanding of ADM on galactic scales is almost completely lacking, since the formation of galactic structures and their time evolution depend on non-linear gravitational interactions involving the ADM, CDM and baryons. This Letter presents the first cosmological hydrodynamical simulations of Milky Way analogs that include ADM, opening a window into the detailed galactic physics of strongly dissipative DM.
To build intuition, Sec. 2 introduces the cooling physics of ADM by comparison to baryons. Sec. 3 describes the development of an ADM module for the GIZMO multi-physics code (Hopkins, 2015), which is used to perform Milky Way zoom-ins of a cosmology where ADM comprises 6% of DM.
Sec. 4 demonstrates that, for the two benchmarks studied here, the presence of a strongly cooling ADM sub-component leads to the formation of a centrally rotating ADM disk in the host galaxy. However, the majority of the ADM exists in dense concentrations of collapsed gas (referred to as “clumps”), which form early and rapidly accumulate in the inner of the host. The presence of the ADM can dramatically affect the distribution of the baryonic gas and stars in the inner galaxy, even though it comprises only a small fraction of the total DM. These results are supplemented by several appendices. Appendices A–C detail the cooling physics and assumptions made in the simulations, while App. D contains supplementary figures and tables.
2 ADM Cooling Physics
We simulate two ADM benchmarks that are consistent with cosmological bounds (Bansal et al., 2022a), but near the boundary of constrained parameter space, making additional astrophysical probes especially interesting. These benchmarks, described in Tab. 1, feature Standard-Model-like masses and couplings, but still produce remarkably different outcomes.
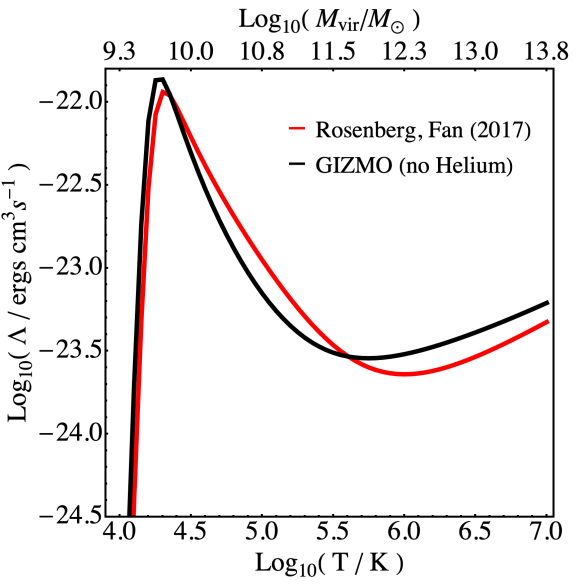
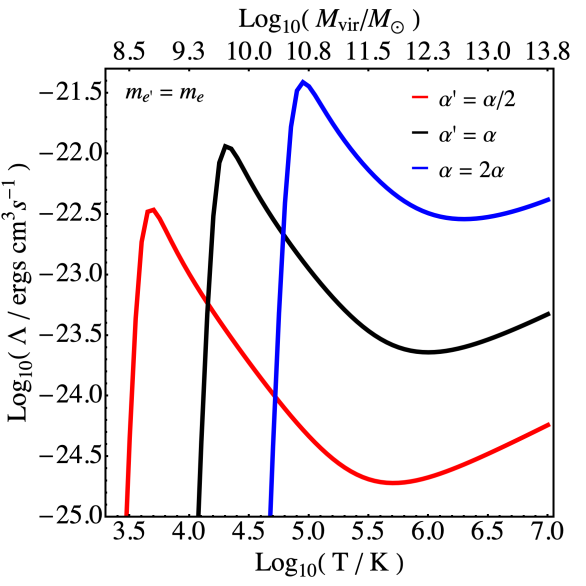
Fig. 1 displays volumetric cooling rates for dark hydrogen and baryons, as a function of temperature: , with the rate of energy loss per unit volume and the species number density. All cooling curves include collisional ionisation and excitation, recombination, and Bremsstrahlung processes. ADM cooling is modeled using the equations derived in Rosenberg & Fan (2017), assuming ionisation-recombination equilibrium (App. A). Dark molecular cooling (Ryan et al., 2022a) is not considered in this work as it affects dense regions of ADM gas below the resolution of our simulations, but can be added in the future (Ryan et al., 2022b).
The baryonic cooling curve is distinguished by two peaks above the hydrogen binding energy K: the first arises primarily from collisional excitation of hydrogen and the second from collisional excitation of helium. Above K, the baryonic gas is largely ionized and Bremsstrahlung dominates.
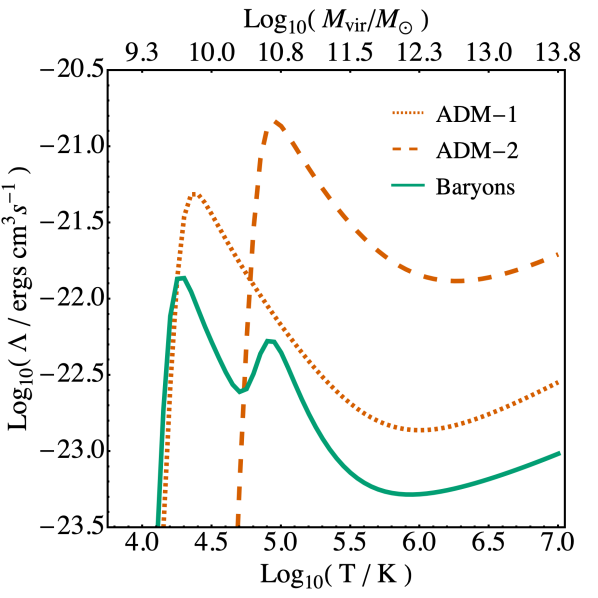
There are three key differences between the baryonic and ADM cooling curves. First, the ADM curves do not have the characteristic second peak observed at low temperatures in the baryons because there is no dark helium present. Second, the volumetric cooling rate for each ADM model is faster than that for baryons. This is a function of the chosen mass and coupling, and it governs how quickly a species collapses towards the central galaxy as well as the properties of the structures that it ultimately forms. We give the ADM greater volumetric cooling rates so that it achieves similar cooling timsecales to baryons, despite having a lower mass fraction. Lastly, differences in the binding energy of the (dark) hydrogen shift the cut-off temperature of each species, which dictates when atomic cooling effectively stops. This, in turn, dictates the minimum sound speed of the central (ADM) gas and its ability to gravitationally collapse, with greater cut-off temperatures corresponding to greater densities that have to be reached before loss of pressure support.
3 Simulations
Our suite includes four cosmological hydrodynamical zoom-in simulations of Milky Way analogues (Tab. 1). For a baseline comparison, we include two simulations where the matter component is comprised of only baryons and CDM. Referenced as CDM and CDM-NF , the former includes stellar feedback while the latter does not. We also run two simulations for ADM (ADM-1 and ADM-2) that each include CDM and baryons with feedback.
All simulations utilize GIZMO (Hopkins, 2015), with hydrodynamics solved using the mesh-free Lagrangian Godunov “MFM” method and gravity solved with an improved version of the Tree–PM solver (Springel, 2005). Baryons are modeled using the hydrodynamics and galaxy formation physics from the Feedback In Realistic Environments (FIRE) project (Hopkins et al., 2014), specifically the “FIRE-2” version (Hopkins et al., 2017a, b). The baryons include gas cooling down to the molecular phase (–) (Ferland et al., 1998; Wiersma et al., 2009), heating from a meta-galactic radiation background (Oñorbe et al., 2016; Faucher-Giguère, 2020) and stellar sources, star formation, as well as explicit models for stellar and supernovae feedback (Hopkins et al., 2014). For CDM-NF, we remove stellar and supernovae feedback, as well as radiative feedback. The baryonic gas particles in both CDM simulations are converted into collisionless star particles once the gas reaches a density greater than , hosts non-zero molecular fractions (Krumholz & Gnedin, 2011) and becomes Jeans-unstable and locally self-gravitating (Hopkins et al., 2013).
ADM is implemented in GIZMO as a separate gas species that is completely decoupled from the baryonic gas, except for gravity. The dynamics of the ADM gas are solved with the same quasi-Lagrangian method used for baryons. The ADM cooling functions are implemented as described in App. A, assuming no meta-galactic dark radiation background in the ADM sector except for the dark CMB. ADM gas cells that are locally self-gravitating and Jeans-unstable are turned into “clump” particles over the free-fall time scale. These dense clumps are expected to collapse in a run-away fashion to compact objects that effectively behave as collisionless particles at the resolved scale of the simulations, see e.g. Gurian et al. (2022b). The clump formation criteria for ADM gas are different from the ones used for stellar particles because baryons have further constraints on molecular gas fractions and a set density threshold. We underscore that the ADM gas has no self-driven feedback, experiences no baryonic feedback, and does not undergo molecular cooling. For the ADM gas in ADM-2, after , we additionally allow clump formation if they have physical softening lengths and temperatures to prevent isolated dark “molecular” clouds from slowing the run time.
The force softening for both the baryonic and ADM gas particles uses the fully conservative adaptive algorithm from Price & Monaghan (2007), where the gravitational force assumes the identical mass distribution as the hydrodynamic equations.The minimum gas softening reached is . The CDM force resolution of the simulations is set to .
The main target halo(s) in the zoom-in region are picked from the standard FIRE-2 suite as described in Wetzel et al. (2022); Hopkins et al. (2014). This Letter focuses specifically on the Milky Way-like halo m12i, which has a total CDM mass of , a stellar disk of mass , and a quiet merger history below for CDM (Hopkins et al., 2017b). The initial transfer functions for the baryons, CDM, and ADM particles are calculated using a modified version of CLASS (Blas et al., 2011; Bansal et al., 2022b, a). MUSIC (Hahn & Abel, 2011) is then used to generate initial conditions at for the requisite mixture of baryons, CDM, and ADM. The cosmological parameters that must be specified include the dark Cosmic Microwave Background (CMB) temperature, , and the ADM mass fraction.
4 Galaxy Evolution in ADM

This section describes the resultant distributions of ADM gas and clumps, as well as their effects on baryons and CDM. Throughout, we use several metrics to quantify the spatial morphology and kinematics of the distributions (Tab. E1). When calculating these metrics, the coordinate system is aligned with the angular momentum of the youngest 25% of baryonic stars within of the galactic center.
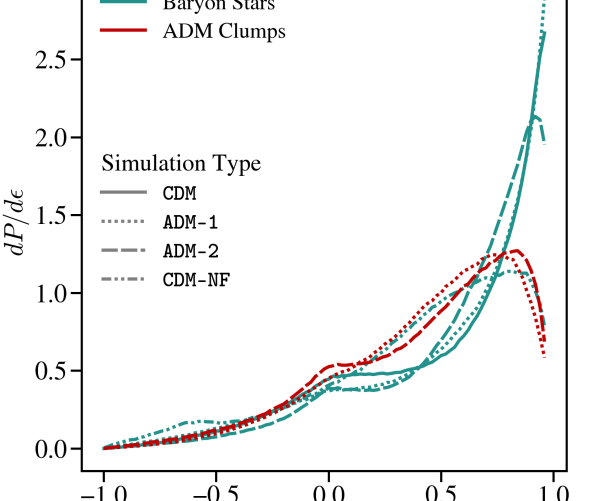
To characterize the kinematics, we use the distribution of orbital circularities (Fig. E1), , defined as the ratio of the -component of angular momentum to the angular momentum of a particle with the same energy on a circular orbit (Abadi et al., 2002). Thin-disk orbits correspond to , thick-disk orbits to , and spheroid-like orbits to (Yu et al., 2021). The mass fraction of particles within the cylindrical region and in each of these ranges is denoted by , , , respectively.
To characterize the spatial morphology, we define as the vertical height in which the fraction of particles is contained in a cylindrical region of . Similarly, is the half-mass containment radius for particles within a cylindrical region .
4.1 ADM Gas
In the standard picture of galaxy formation, gas collapses within the potential well of a DM halo, ultimately forming a rotationally-supported disk near its center. Gas that accretes onto this central disk may have been previously shocked to the virial temperature or may have originated from cold, filamentary flows. The stability of the resulting disk will be compromised if its self-gravity overwhelms its internal pressure. Disk fragmentation is suppressed as the pressure support in the disk increases with the cut-off temperature of the cooling curve, which depends on the (dark) hydrogen binding energy.
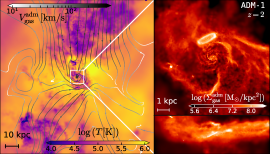
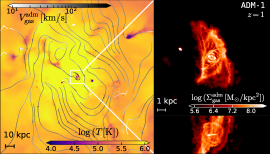
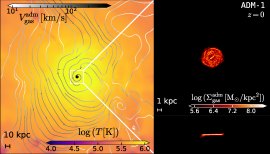
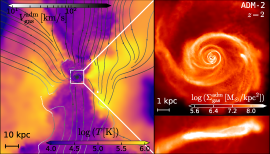
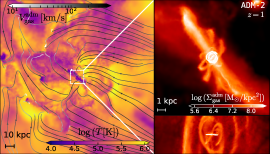
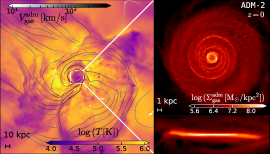
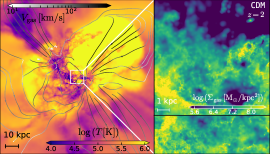
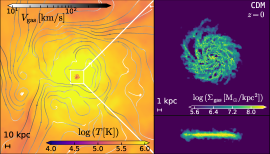
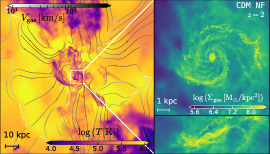
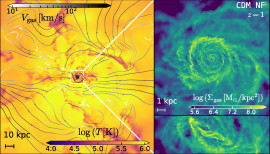
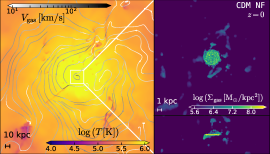
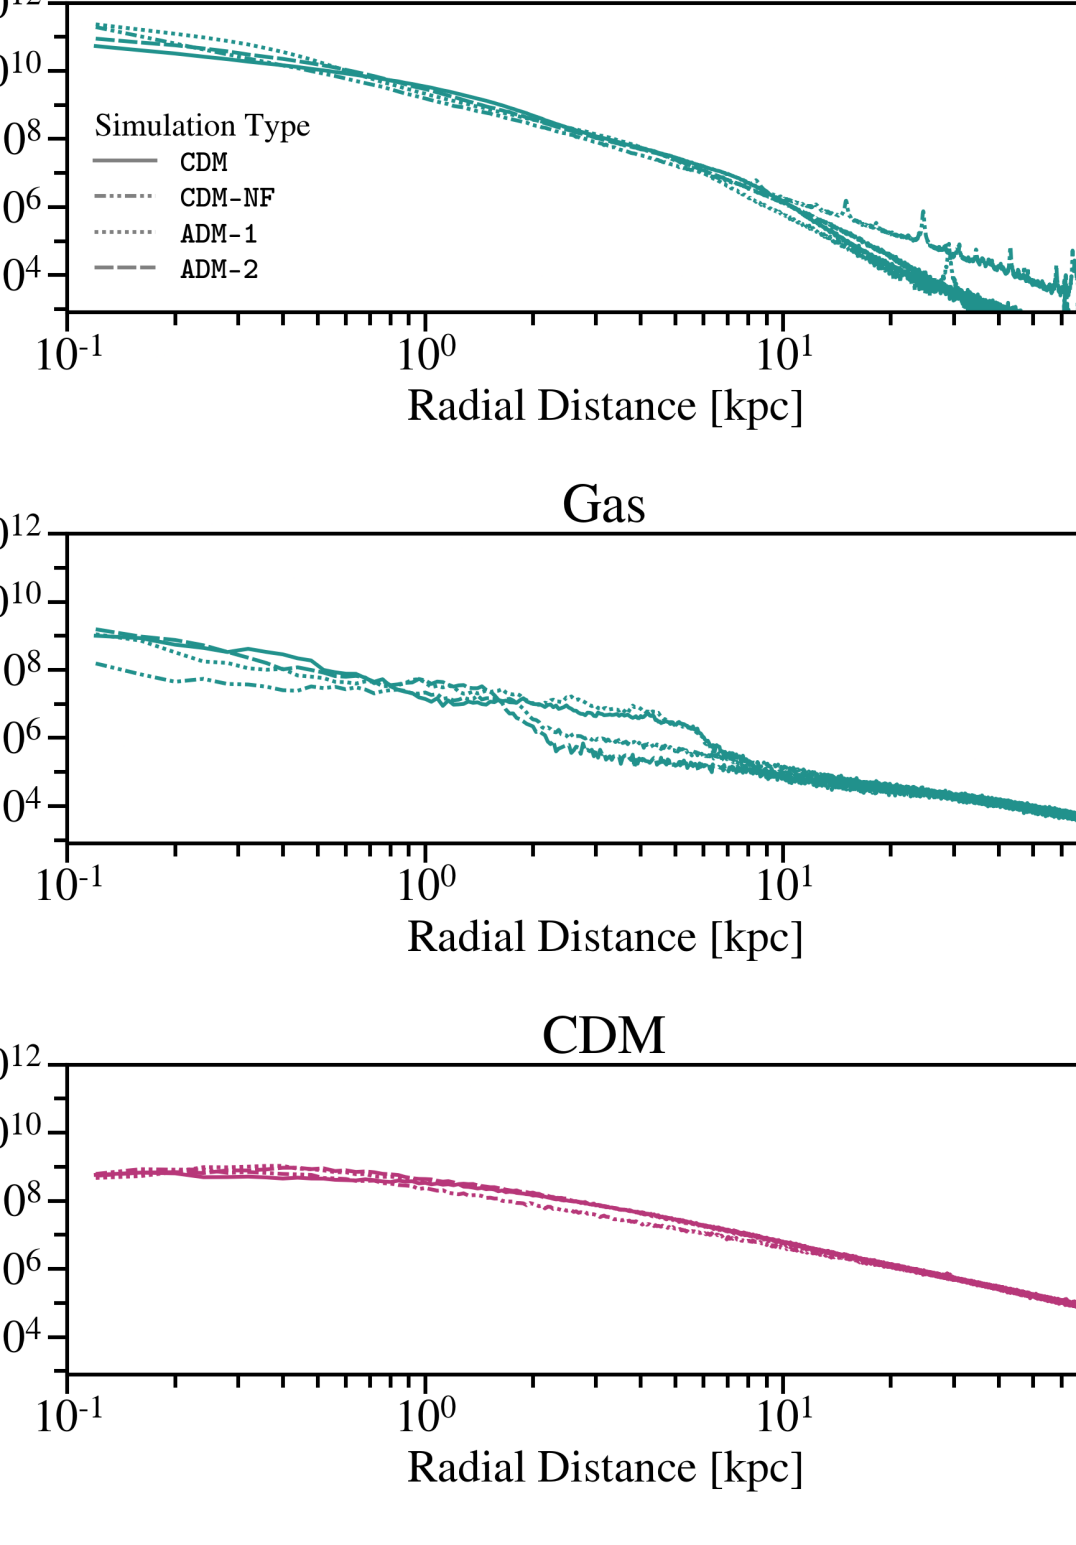
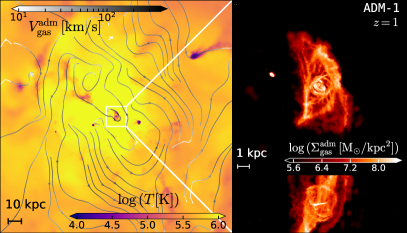
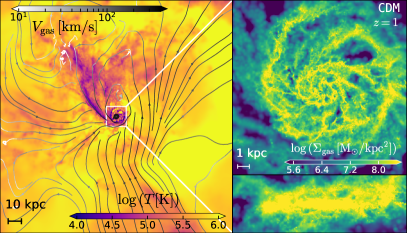
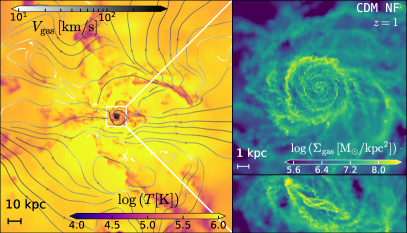
Figure 2 displays the temperature and velocity distribution of the outer galactic gas (circumgalactic medium, CGM), on the left of each panel and the zoomed-in density profile of the central cold, neutral gas (interstellar medium, ISM), on the right of each panel. All species are cooling efficiently and forming high-density disks at this redshift. For the baryonic gas in both the CDM and CDM-NF simulations, most of the CGM is shock-heated and at the virial temperature ; the same is true for the ADM gas in ADM-1. In contrast, the ADM gas in ADM-2 cools too rapidly to be held at the virial temperature and its CGM is dominated by high-density flows that free-fall into the ISM at , more than twice that of the other gas species. This is because the gas infall speed is approximately proportional to the cooling rate, which is greater for ADM-2.
The presence or lack of feedback also strongly influences disk formation. As demonstrated by the surface density subpanels, the ADM gas in ADM-1 and ADM-2 accretes onto the central dark disk via dense filaments with poor alignment to its angular momentum. This is only possible because there is no feedback in the ADM sector to heat and disperse the filaments into the CGM. Moreover, the ADM disks are quite compact at this redshift and are much smaller than the baryonic gas disk in CDM; they are more comparable in size to the baryonic disk in CDM-NF at , although the latter is still larger, possibly due to enhanced accretion from helium cooling.
We quantify gas fragmentation in the central galaxy () at by defining as the fraction of total baryonic or ADM mass within 10 kpc that is made up of uncollapsed gas of that species. In CDM (), the baryons are significantly more gas-rich than those in CDM-NF (). The lack of feedback contributes to gas depletion because there is no mechanism to prevent runaway gravitational collapse. Similar depletion is observed for the ADM gas in ADM-1 () and ADM-2 (). ADM-2 has a binding energy times greater than ADM-1, which may explain the relatively higher gas fraction.
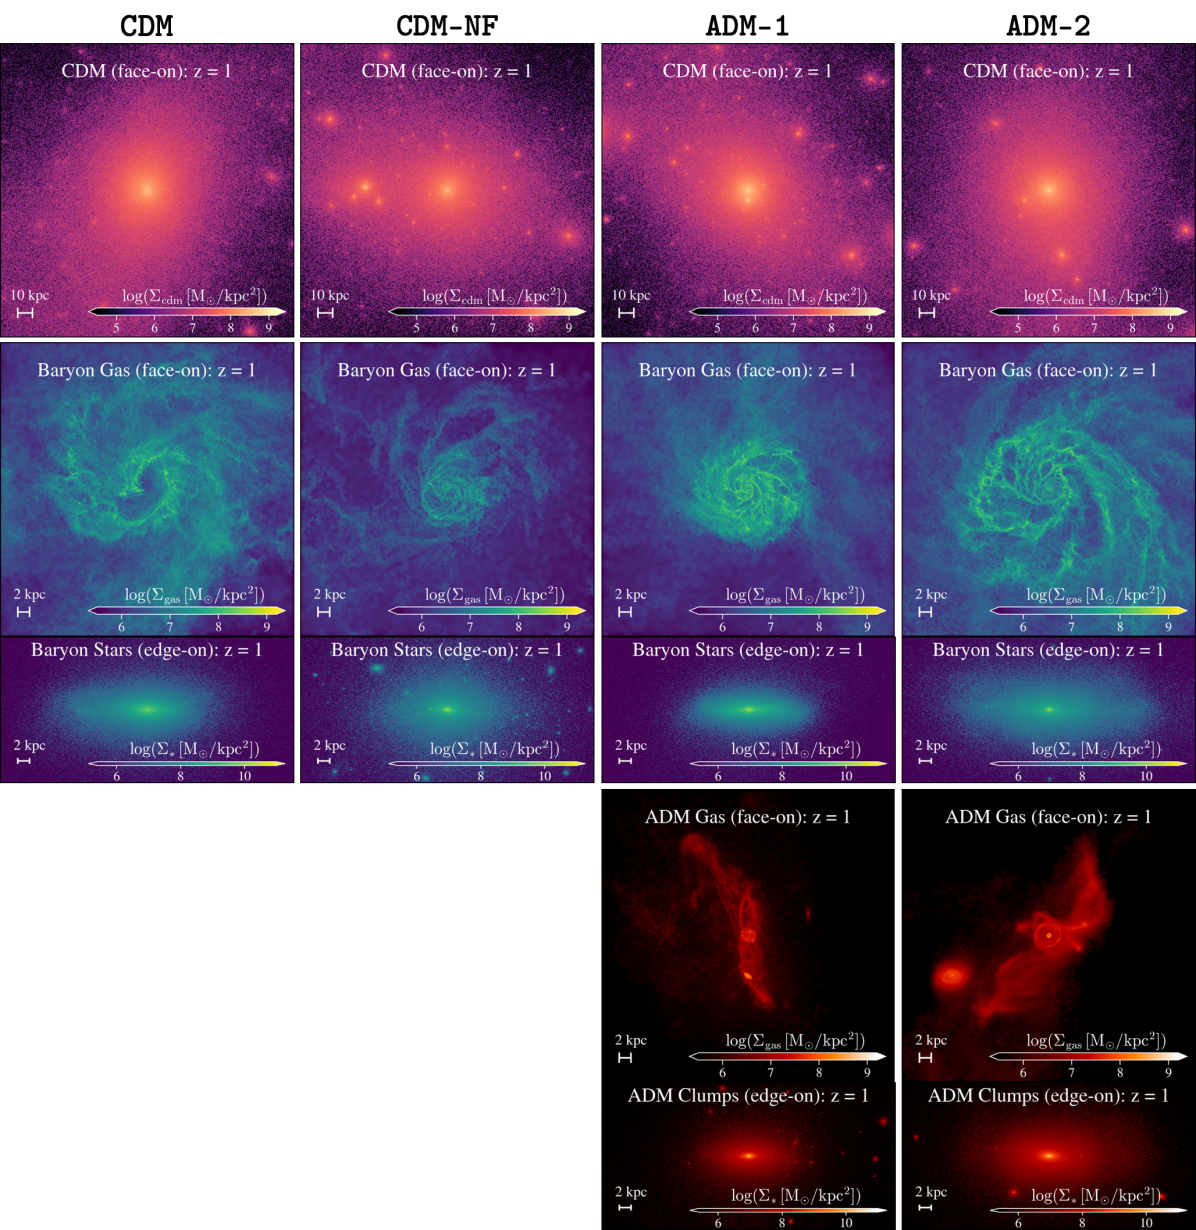
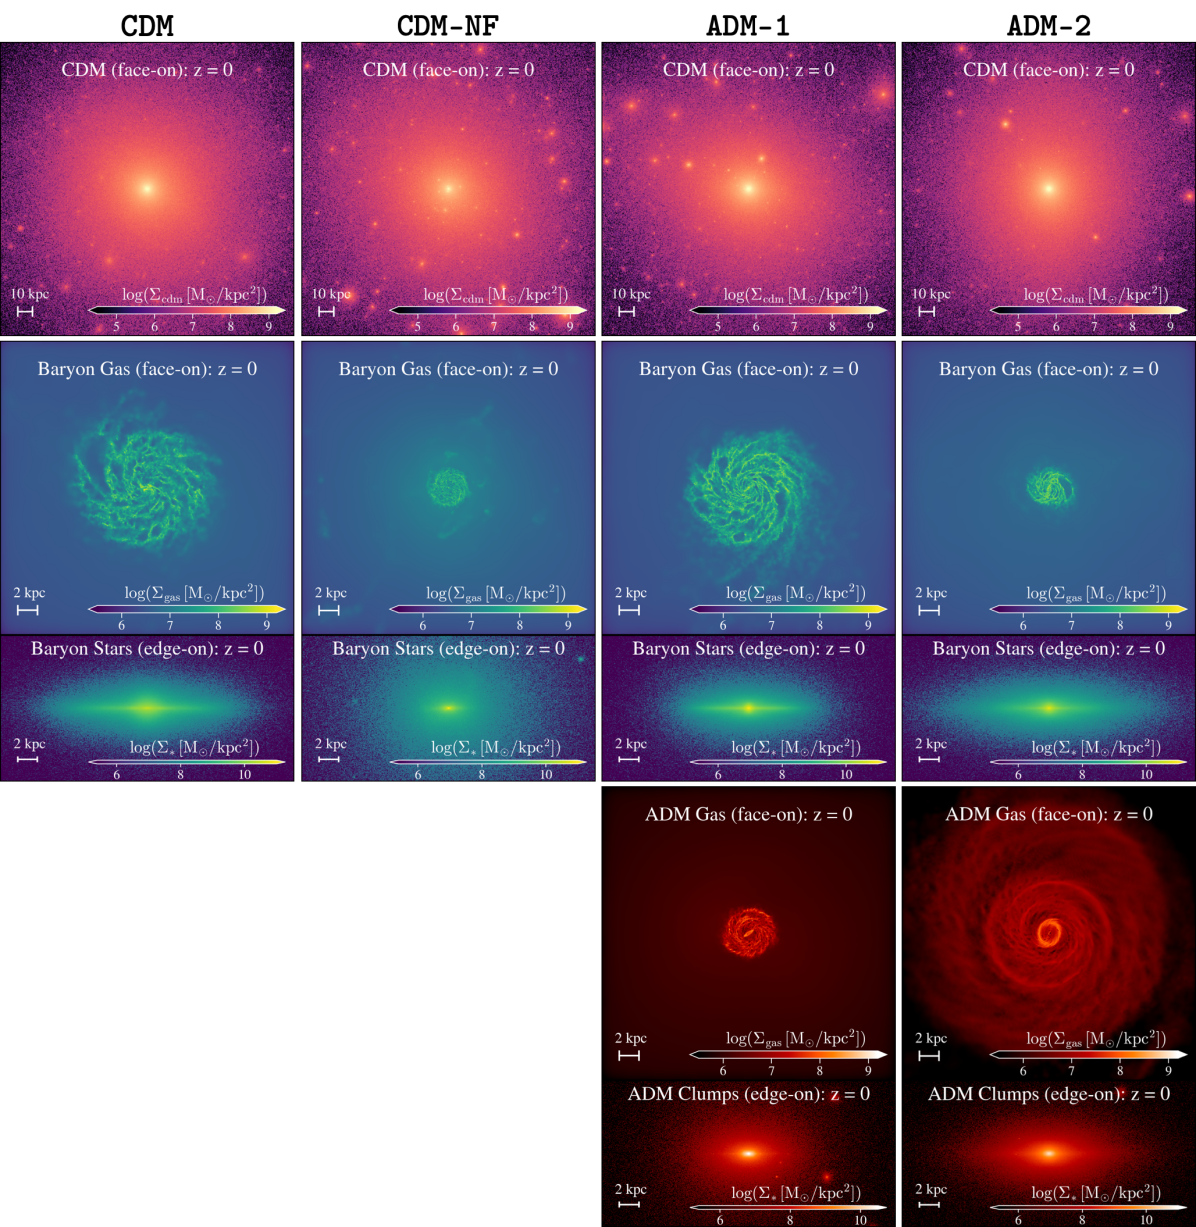
Figure 3 presents the final density projections for the baryonic and ADM species in all simulations. The ADM gas in ADM-1 forms a disk that is morphologically similar to that of baryons in CDM-NF. This is to be expected given the similar cooling timescales, identical binding energies, and lack of feedback. The ADM gas forms a more extended disk in ADM-2 than in ADM-1 due to increased cooling and central halo accretion rates, as well as lower fragmentation rates.
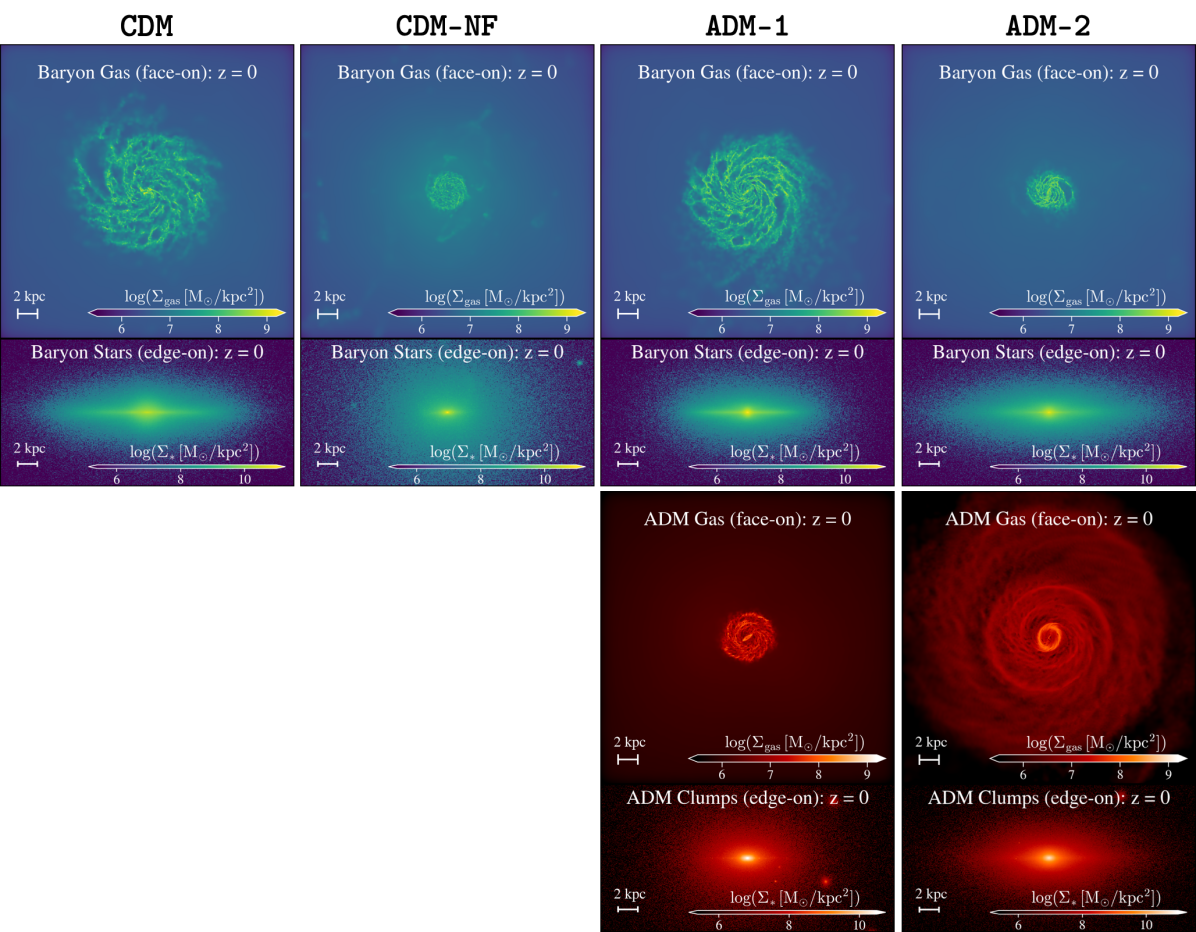
In both ADM-1 and ADM-2, the ADM gas disks rotate along circular, gravitationally supported orbits. More than 90% of the ADM gas in each case is in a thin-disk configuration with . Additionally, the angular momentum of the ADM gas disk is aligned with that of the baryonic gas disk in each simulation. The alignment is likely the result of two effects. Firstly, the initial density and velocity power spectra for baryons and ADM align closely with those of CDM, so the initial net angular momenta for ADM and baryons are similar. Secondly, the baryonic and ADM disks also likely maintain alignment through mutual gravitational torques, which dominate in the inner galaxy (Cadiou et al., 2021).
4.2 ADM Clumps
When an ADM gas particle becomes so dense that it is Jeans-unstable, it converts into a clump. This is similar to the process by which baryonic gas gets converted into stars, except that fewer formation criteria are applied in the ADM case. ADM clump particles have masses of , while baryonic star particles have masses of . Both are collisionless and do not interact hydrodynamically with the remaining gas. At , stars dominate the central density of the galaxy, accounting for 95% of the total baryonic mass within the inner ; similar fractions of ADM are in clumps versus gas in this region.
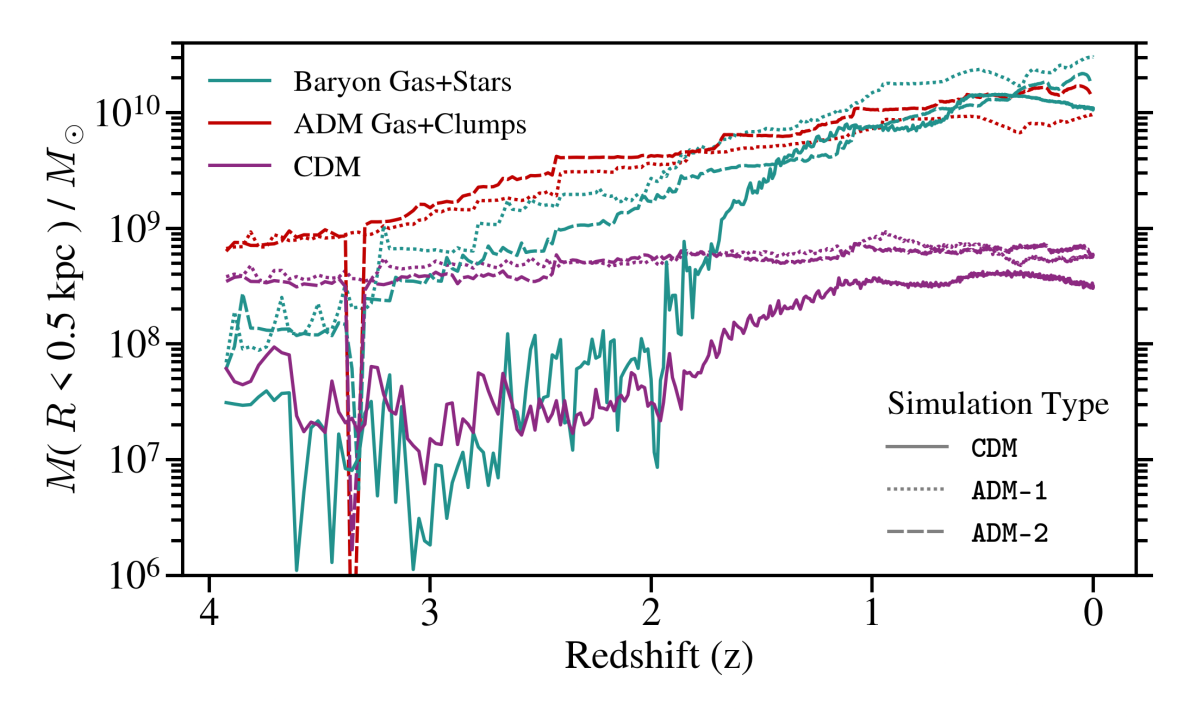
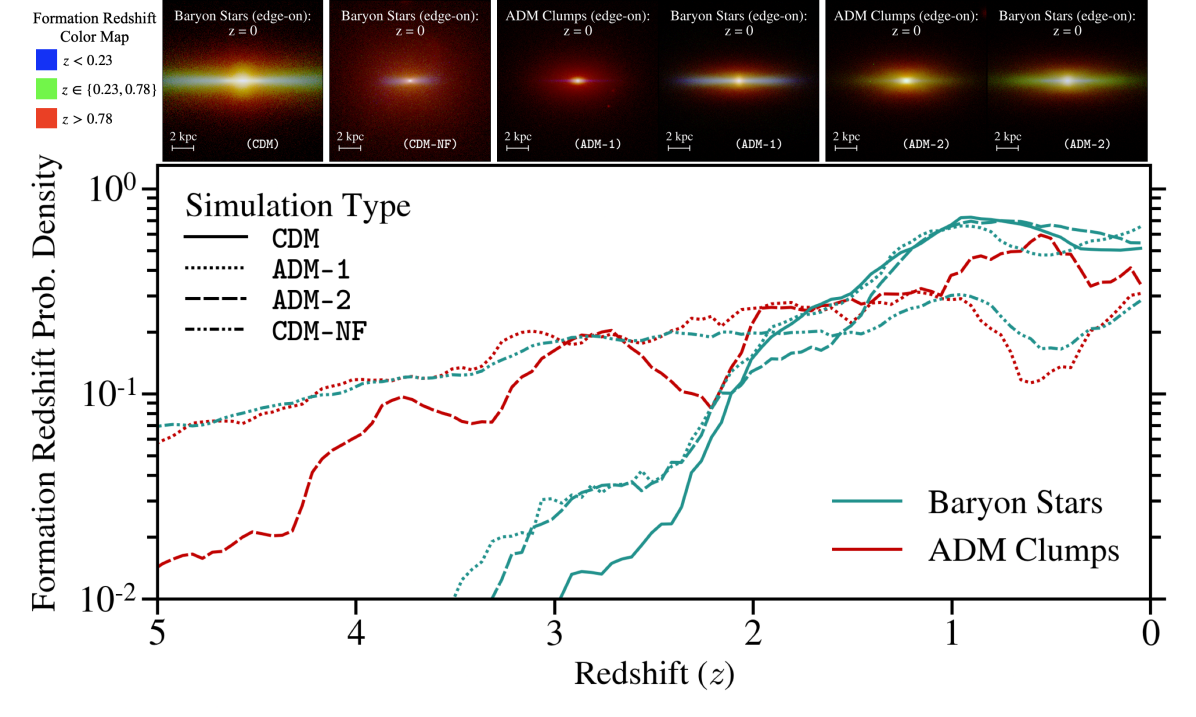
Figure 4 illustrates the formation history of the baryonic stars and ADM clumps in the inner for all simulations. The figure also includes images showcasing the edge-on projections of the baryonic stars and ADM clumps at , synthesized with surface density maps of stars/clumps in three age bins.
In CDM, 60% of the baryonic stars within the inner form at when the galaxy’s evolution is relatively quiet (Anglés-Alcázar et al., 2016; Stern et al., 2020; Hafen et al., 2022; Yu et al., 2021). Star formation is suppressed at earlier redshifts because the gravitational potential of the halo is not deep enough to prevent dense gas from being ejected by supernovae feedback (Hopkins et al., 2023). The corresponding color-map image shows that baryonic stars separate out visually: thin-disk stars are blue, thick-disk stars are green, bulge stars are a mix of blue and green (appearing yellow), and halo stars are red. In CDM-NF, baryonic star formation occurs more uniformly across redshifts and only 23% of stars form at . The fraction of stars in the thick disk is enhanced relative to that in CDM ( versus ). The older distribution of stars is also evidenced by the redder edge-on color map. Stars formed during the early, bursty periods of star formation in FIRE-2 simulations have been shown to dominate the thick disk (Yu et al., 2021).
The spatial and kinematic distributions of ADM clumps in ADM-1 and ADM-2 resemble those of baryonic stars in CDM-NF. In both simulations, the ADM clumps start to form at , and their evolution is characterized by periods of “bursty” formation following merger events. The impact of bursty formation events is even more prominent since the ADM gas accounts for a lower total mass fraction than baryonic gas and thus has a lower average density. Because the ADM clumps form early, as evidenced by their deep red color maps, they are kinematically hotter, with a larger proportion having thick-disk and spheroidal circularities. For both ADM-1 and ADM-2, of the clumps have orbital circularities consistent with a thin disk, compared to for baryonic stars in CDM.
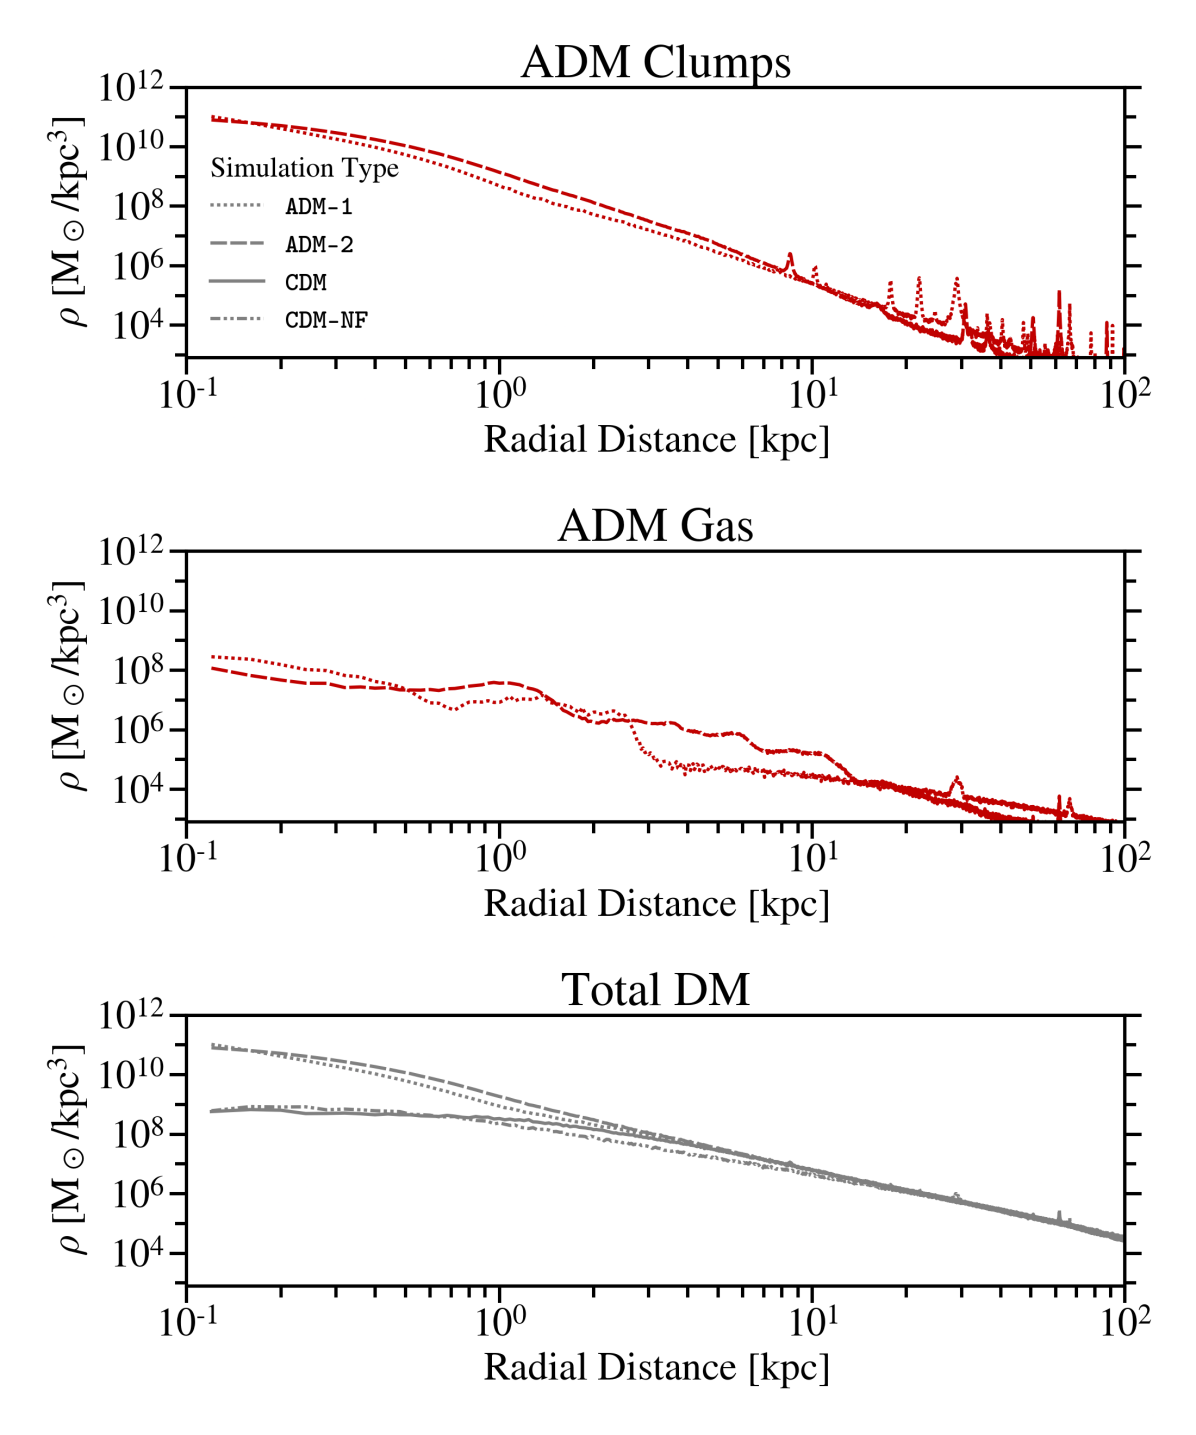
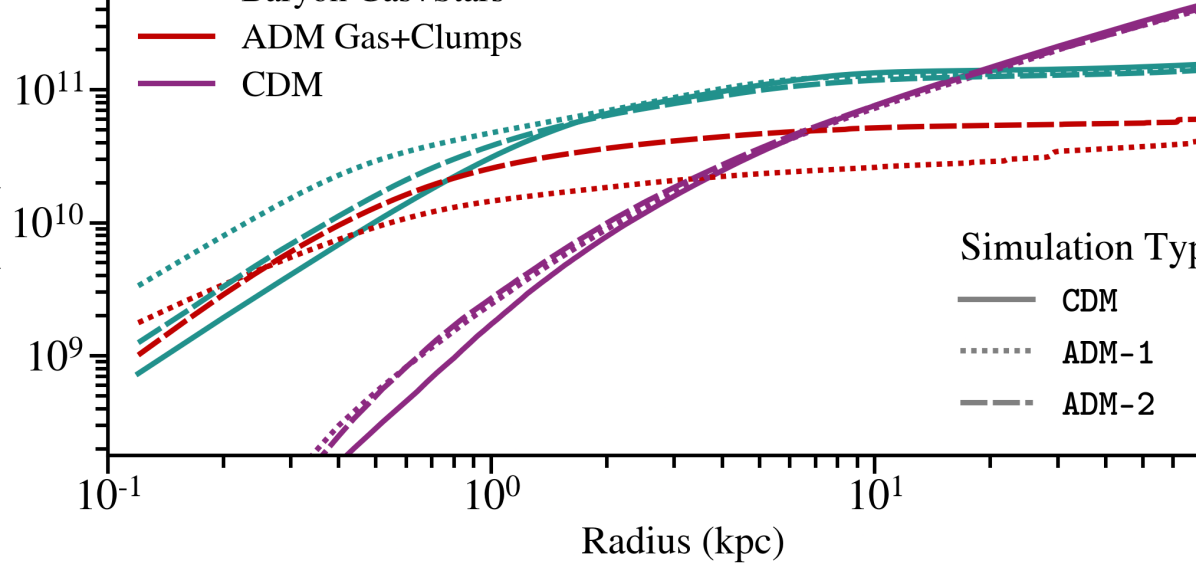
Generally, the ADM clumps are concentrated within the inner of the galaxy, as demonstrated by the enclosed mass profiles in Fig. 4. In this central region, the total enclosed mass of ADM is almost an order-of-magnitude greater than that of CDM. The spatial distributions of ADM-1 and ADM-2 clumps are also more concentrated, with values nearly 2–3 times smaller than that of baryonic stars in CDM. This is reasonable since, in the absence of feedback, ADM clumps and stars can form in greater quantities in the central galaxy where densities are higher. The for baryonic stars in CDM-NF is greater than that of ADM clumps in ADM-1 and ADM-2. One explanation is that baryonic cooling is enhanced due to helium, while ADM cooling is artificially suppressed without dark molecular cooling, allowing the baryonic gas disk to cool and collapse into stars at larger radii.
4.3 ADM Backreaction on Baryons and CDM
The ability of ADM gas to cool efficiently without feedback to limit collapse means that it dominates the inner galactic densities at early times, which has important consequences for baryons. At in ADM-1 and ADM-2, the mass of ADM gas in the inner of the galaxy is already more than ten times greater than that of baryons (Fig. E5).
The build-up of ADM mass deepens the central gravitational potential, leading to more centrally concentrated baryonic distributions, as is visually apparent in Fig. 3 and Figs. E6–E7. Compared to CDM, at the total enclosed mass of baryons within in ADM-1 (ADM-2) is enhanced by () in Fig. 4. Beyond this radius, the baryonic mass profiles in these three simulations are essentially indistinguishable. In general, the distributions of baryonic gas and stars in ADM-1 have lower by %. However, the effect is more dramatic for ADM-2: the baryonic gas disk collapses and depletes to of its value in CDM, almost certainly excluding this particular ADM scenario.
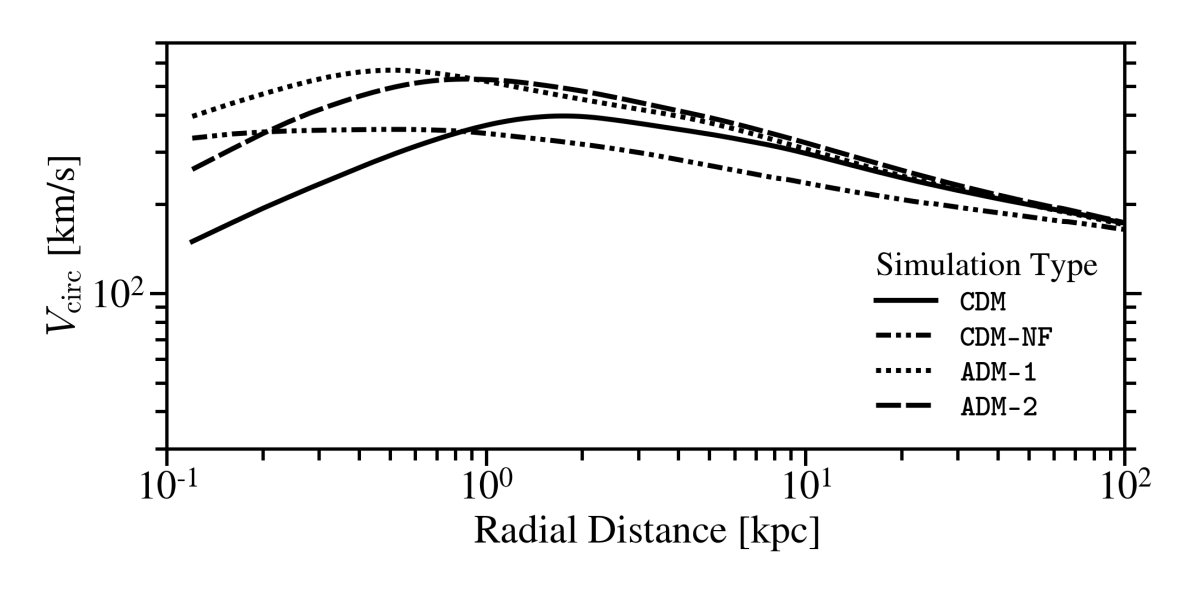
The CDM distribution is also contracted, with the enclosed mass within enhanced by for both ADM-1 and ADM-2. The total enhancement to the inner enclosed mass can have observable effects on the rotation curve and the galactic bar. The greater inner galactic rotation speeds (Fig. E8) may place both ADM scenarios in tension with galactic velocity measurements (Sohn et al., 2017) although higher resolution simulations are necessary to confirm this.
Lastly, the enhancement of the central baryonic density due to an efficiently cooling, dense ADM core, noticeably enhances star formation at early times: the fraction of stars that form at large redshift in CDM, ADM-1 and ADM-2 is 4%, 7% and 6%, respectively.
5 Conclusions
This Letter presents the first cosmological hydrodynamical simulations with multiple DM species: CDM as well as a dissipative subcomponent, ADM. We developed an ADM module for GIZMO and simulated Milky Way-analogues. We considered two benchmark ADM scenarios with distinctive cooling properties that affect the accretion rate onto the central galaxy as well as gas fragmentation. In both cases, the ADM has no self-driven feedback.
For each benchmark, the ADM gas cools efficiently and forms a central gas disk aligned with the baryonic stellar disk in the galaxy. Only a small fraction of the ADM in the central galaxy exists in cold, neutral gas. The vast majority () is in collisionless clumps of collapsed gas. These ADM clumps form relatively early in the galaxy’s evolution and sink to its center, where their total mass in the inner-most of the galaxy is comparable to that in baryons. The collapse of ADM at early times deepens the central galactic potential, in turn significantly increasing the central density of baryons and CDM. This affects the rotational kinematics of the inner galaxy and increases baryonic star formation at earlier redshifts (). In ADM-2, the baryonic gas disk is severely depleted compared to the observed Milky Way, very likely excluding this scenario. In ADM-1, the enhanced inner rotation curve could place it in tension with galactic velocity measurements (Sohn et al., 2017), but higher resolution simulations are necessary to confirm this.
The distribution of ADM gas near the Solar position is relevant for direct detection searches (Chacko et al., 2021; Curtin & Setford, 2021) and can be lower than the naive expectation set by the ADM fraction. This is because the majority of ADM gas that collapses into a disk ultimately fragments into centrally-concentrated clumps. Gravitational signatures of the dark disk depend sensitively on its morphology. For ADM-1 and ADM-2, the thin dark-disk constraints from Kramer & Randall (2016); Schutz et al. (2017); Buch et al. (2019); Widmark et al. (2021) do not apply, but microlensing searches will be highly sensitive (Winch et al., 2022).
Our simulations will enable quantitative predictions for specific galactic observables that may reveal the presence of an ADM subcomponent. These include: modifications to the baryonic stellar disk, differences in stellar formation histories, changes to the subhalo mass function, and novel properties of dwarf galaxies. When extended to include molecular cooling, such simulations will also lead to an improved understanding of the populations of dark compact objects that result from dissipative interactions.
The study of strongly dissipative DM has long been hampered by the challenges of making reliable predictions on galactic scales. This work makes possible a wide variety of new investigations that will illuminate the astrophysical dynamics of this generic class of DM.
6 acknowledgments
This work would not be possible without the helpful comments and expertise of the following individuals: Tom Abel, Jared Barron, Peter Berggren, Malte Bushmann, Francis-Yan Cyr-Racine, Ben Dodge, Kareem El-Badry, Caleb Gemmell, Akshay Ghalsasi, James Gurian, Donhui Jeong, Laura Keating, Andrey Kravtsov, Hongwan Liu, Lina Necib, Michael Ryan, Sarah Shandera, Oren Slone, David Spergel, Romain Teyssier, Francisco Villaescusa-Navarro and Andrew Wetzel. A special thanks goes to Jack Setford for theoretical discussions and support during the early stages of the project. We are also grateful to JiJi Fan and Lisa Randall for their helpful comments on our draft. ML and SR are supported by the Department of Energy (DOE) under Award Number DE-SC0007968. ML also acknowledges support from the Simons Investigator in Physics Award. The research of DC was supported in part by a Discovery Grant from the Natural Sciences and Engineering Research Council of Canada, the Canada Research Chair program, the Alfred P. Sloan Foundation, the Ontario Early Researcher Award, and the University of Toronto McLean Award. NM acknowledges the support of the Natural Sciences and Engineering Research Council of Canada (NSERC) funding reference number RGPIN-2017-06459. This work was performed in part at the Aspen Center for Physics, which is supported by the National Science Foundation (NSF) grant PHY-1607611. Support for XS & PFH was provided by the NSF Research Grants 1911233, 20009234, 2108318, the NSF Faculty Early Career Development Program (CAREER) grant 1455342, the National Aeronautics and Space Administration (NASA) grants 80NSSC18K0562, HST-AR-15800.
Numerical simulations were run on the supercomputer Frontera at the Texas Advanced Computing Center (TACC) under the allocations AST21010 and AST20016 supported by the NSF and TACC, and NASA HEC SMD-16-7592. Early testing and analyses were done on the Niagara cluster. The work presented in this paper was performed on computational resources managed and supported by Princeton Research Computing. This research made extensive use of the publicly available codes IPython (Pérez & Granger, 2007), Jupyter (Kluyver et al., 2016), matplotlib (Hunter, 2007), NumPy (Harris et al., 2020), SciPy (Virtanen et al., 2020), SWIFTsimIO (Borrow & Borrisov, 2020), unyt (Goldbaum et al., 2018), gizmo-analysis (Wetzel et al., 2020) and Python Imaging Library (Clark, 2015).
References
- Abadi et al. (2002) Abadi, M. G., Navarro, J. F., Steinmetz, M., & Eke, V. R. 2002, The Astrophysical Journal, 597, 21, doi: 10.1086/378316
- Aghanim et al. (2020) Aghanim, N., et al. 2020, Astron. Astrophys., 641, A6, doi: 10.1051/0004-6361/201833910
- Anglés-Alcázar et al. (2016) Anglés-Alcázar, D., Faucher-Giguère, C.-A., Kereš, D., et al. 2016, Monthly Notices of the Royal Astronomical Society, 470, 4698, doi: 10.1093/mnras/stx1517
- Bansal et al. (2022a) Bansal, S., Barron, J., Curtin, D., & Tsai, Y. 2022a. https://arxiv.org/abs/2212.02487
- Bansal et al. (2022b) Bansal, S., Kim, J. H., Kolda, C., Low, M., & Tsai, Y. 2022b, JHEP, 05, 050, doi: 10.1007/JHEP05(2022)050
- Berezhiani et al. (2006) Berezhiani, Z., Cassisi, S., Ciarcelluti, P., & Pietrinferni, A. 2006, Astropart. Phys., 24, 495, doi: 10.1016/j.astropartphys.2005.10.002
- Bertone & Tait (2018) Bertone, G., & Tait, M. P., T. 2018, Nature, 562, 51, doi: 10.1038/s41586-018-0542-z
- Blas et al. (2011) Blas, D., Lesgourgues, J., & Tram, T. 2011, Journal of Cosmology and Astroparticle Physics, 2011, doi: 10.1088/1475-7516/2011/07/034
- Borrow & Borrisov (2020) Borrow, J., & Borrisov, A. 2020, Journal of Open Source Software, 5, 2430, doi: 10.21105/joss.02430
- Bryan & Norman (1997) Bryan, G. L., & Norman, M. L. 1997, The Astrophysical Journal, 495, 80, doi: 10.1086/305262
- Buch et al. (2019) Buch, J., Leung, S. C. J., & Fan, J. 2019, JCAP, 04, 026, doi: 10.1088/1475-7516/2019/04/026
- Cadiou et al. (2021) Cadiou, C., Dubois, Y., & Pichon, C. 2021, Monthly Notices of the Royal Astronomical Society, 514, 5429, doi: 10.1093/mnras/stac1663
- Chacko et al. (2017) Chacko, Z., Craig, N., Fox, P. J., & Harnik, R. 2017, JHEP, 07, 023, doi: 10.1007/JHEP07(2017)023
- Chacko et al. (2018) Chacko, Z., Curtin, D., Geller, M., & Tsai, Y. 2018, JHEP, 09, 163, doi: 10.1007/JHEP09(2018)163
- Chacko et al. (2021) —. 2021, JHEP, 11, 198, doi: 10.1007/JHEP11(2021)198
- Chacko et al. (2006) Chacko, Z., Goh, H.-S., & Harnik, R. 2006, Phys. Rev. Lett., 96, 231802, doi: 10.1103/PhysRevLett.96.231802
- Chang et al. (2018) Chang, J. H., Egana-Ugrinovic, D., Essig, R., & Kouvaris, C. 2018, Journal of Cosmology and Astroparticle Physics, 2019, doi: 10.1088/1475-7516/2019/03/036
- Clark (2015) Clark, A. 2015, Pillow (PIL Fork) Documentation, readthedocs. https://buildmedia.readthedocs.org/media/pdf/pillow/latest/pillow.pdf
- Curtin & Setford (2020a) Curtin, D., & Setford, J. 2020a, JHEP, 03, 041, doi: 10.1007/JHEP03(2020)041
- Curtin & Setford (2020b) —. 2020b, Phys. Lett. B, 804, 135391, doi: 10.1016/j.physletb.2020.135391
- Curtin & Setford (2021) —. 2021, JHEP, 03, 166, doi: 10.1007/JHEP03(2021)166
- Cyr-Racine et al. (2014) Cyr-Racine, F.-Y., de Putter, R., Raccanelli, A., & Sigurdson, K. 2014, Phys. Rev. D, 89, 063517, doi: 10.1103/PhysRevD.89.063517
- Fan et al. (2013) Fan, J., Katz, A., Randall, L., & Reece, M. 2013, Phys. Dark Univ., 2, 139, doi: 10.1016/j.dark.2013.07.001
- Faucher-Giguère (2020) Faucher-Giguère, C.-A. 2020, MNRAS, 493, 1614, doi: 10.1093/mnras/staa302
- Ferland et al. (1998) Ferland, G. J., Korista, K. T., Verner, D. A., et al. 1998, Publications of the Astronomical Society of the Pacific, 110, 761, doi: 10.1086/316190
- Fernandez et al. (2022) Fernandez, N., Ghalsasi, A., Profumo, S., Smyth, N., & Santos-Olmsted, L. 2022. https://arxiv.org/abs/2208.08557
- Foot (2004) Foot, R. 2004, Int. J. Mod. Phys. D, 13, 2161, doi: 10.1142/S0218271804006449
- Ghalsasi & McQuinn (2017) Ghalsasi, A., & McQuinn, M. 2017, Physical Review D, 97, doi: 10.1103/PhysRevD.97.123018
- Goldbaum et al. (2018) Goldbaum, N. J., ZuHone, J. A., Turk, M. J., Kowalik, K., & Rosen, A. L. 2018, Journal of Open Source Software, 3, 809, doi: 10.21105/joss.00809
- Gurian et al. (2022a) Gurian, J., Jeong, D., Ryan, M., & Shandera, S. 2022a, Astrophys. J., 934, 121, doi: 10.3847/1538-4357/ac75e4
- Gurian et al. (2022b) Gurian, J., Ryan, M., Schon, S., Jeong, D., & Shandera, S. 2022b, Astrophys. J. Lett., 939, L12, doi: 10.3847/2041-8213/ac997c
- Hafen et al. (2022) Hafen, Z., Stern, J., Bullock, J., et al. 2022, Monthly Notices of the Royal Astronomical Society, 514, 5056, doi: 10.1093/mnras/stac1603
- Hahn & Abel (2011) Hahn, O., & Abel, T. 2011, MNRAS, 415, 2101, doi: 10.1111/j.1365-2966.2011.18820.x
- Harris et al. (2020) Harris, C. R., Millman, K. J., van der Walt, S. J., et al. 2020, Nature, 585, 357, doi: 10.1038/s41586-020-2649-2
- Hippert et al. (2022a) Hippert, M., Dillingham, E., Tan, H., et al. 2022a. https://arxiv.org/abs/2211.08590
- Hippert et al. (2022b) Hippert, M., Setford, J., Tan, H., et al. 2022b, Phys. Rev. D, 106, 035025, doi: 10.1103/PhysRevD.106.035025
- Hopkins (2015) Hopkins, P. F. 2015, MNRAS, 450, 53, doi: 10.1093/mnras/stv195
- Hopkins et al. (2013) Hopkins, P. F., Cox, T. J., Hernquist, L., et al. 2013, MNRAS, 430, 1901, doi: 10.1093/mnras/stt017
- Hopkins et al. (2014) Hopkins, P. F., Kereš, D., Oñorbe, J., et al. 2014, MNRAS, 445, 581, doi: 10.1093/mnras/stu1738
- Hopkins et al. (2017a) Hopkins, P. F., Wetzel, A., Keres, D., et al. 2017a, Monthly Notices of the Royal Astronomical Society, 477, 1578, doi: 10.1093/mnras/sty674
- Hopkins et al. (2017b) —. 2017b, Monthly Notices of the Royal Astronomical Society, 480, 800, doi: 10.1093/mnras/sty1690
- Hopkins et al. (2023) Hopkins, P. F., Gurvich, A. B., Shen, X., et al. 2023, doi: 10.48550/arxiv.2301.08263
- Hunter (2007) Hunter, J. D. 2007, Computing in Science & Engineering, 9, 90, doi: 10.1109/MCSE.2007.55
- Huo et al. (2020) Huo, R., Yu, H. B., & Zhong, Y. M. 2020, JCAP, 06, 051, doi: 10.1088/1475-7516/2020/06/051
- Kaplan et al. (2009) Kaplan, D. E., Krnjaic, G. Z., Rehermann, K. R., & Wells, C. M. 2009, Journal of Cosmology and Astroparticle Physics, 2010, doi: 10.1088/1475-7516/2010/05/021
- Kaplan et al. (2011) —. 2011, Journal of Cosmology and Astroparticle Physics, 2011, doi: 10.1088/1475-7516/2011/10/011
- Kluyver et al. (2016) Kluyver, T., Ragan-Kelley, B., Pérez, F., et al. 2016, Positioning and Power in Academic Publishing: Players, Agents and Agendas - Proceedings of the 20th International Conference on Electronic Publishing, ELPUB 2016, 87, doi: 10.3233/978-1-61499-649-1-87
- Kramer & Randall (2016) Kramer, E. D., & Randall, L. 2016, Astrophys. J., 824, 116, doi: 10.3847/0004-637X/824/2/116
- Krumholz & Gnedin (2011) Krumholz, M. R., & Gnedin, N. Y. 2011, ApJ, 729, 36, doi: 10.1088/0004-637X/729/1/36
- Mohapatra & Teplitz (2000) Mohapatra, R. N., & Teplitz, V. L. 2000, Phys. Rev. D, 62, 063506, doi: 10.1103/PhysRevD.62.063506
- Oñorbe et al. (2016) Oñorbe, J., Hennawi, J. F., & Lukić, Z. 2016, The Astrophysical Journal, 837, 106, doi: 10.3847/1538-4357/aa6031
- Pérez & Granger (2007) Pérez, F., & Granger, B. E. 2007, Computing in Science and Engineering, 9, 21, doi: 10.1109/MCSE.2007.53
- Price & Monaghan (2007) Price, D. J., & Monaghan, J. J. 2007, MNRAS, 374, 1347, doi: 10.1111/j.1365-2966.2006.11241.x
- Rosenberg & Fan (2017) Rosenberg, E., & Fan, J. 2017, Phys. Rev. D, 96, 123001, doi: 10.1103/PhysRevD.96.123001
- Ryan et al. (2022a) Ryan, M., Gurian, J., Shandera, S., & Jeong, D. 2022a, Astrophys. J., 934, 120, doi: 10.3847/1538-4357/ac75ef
- Ryan & Radice (2022) Ryan, M., & Radice, D. 2022, Phys. Rev. D, 105, 115034, doi: 10.1103/PhysRevD.105.115034
- Ryan et al. (2022b) Ryan, M., Shandera, S., Gurian, J., & Jeong, D. 2022b, Astrophys. J., 934, 122, doi: 10.3847/1538-4357/ac75e5
- Schutz et al. (2017) Schutz, K., Lin, T., Safdi, B. R., & Wu, C.-L. 2017, Physical Review Letters, 121, doi: 10.1103/PhysRevLett.121.081101
- Shandera et al. (2018) Shandera, S., Jeong, D., & Gebhardt, H. S. G. 2018, Phys. Rev. Lett., 120, 241102, doi: 10.1103/PhysRevLett.120.241102
- Shen et al. (2021) Shen, X., Hopkins, P. F., Necib, L., et al. 2021, Monthly Notices of the Royal Astronomical Society, 506, 4421, doi: 10.1093/mnras/stab2042
- Shen et al. (2022) Shen, X., Hopkins, P. F., Necib, L., et al. 2022, arXiv e-prints, arXiv:2206.05327, doi: 10.48550/arXiv.2206.05327
- Sohn et al. (2017) Sohn, J., Zahid, H. J., & Geller, M. J. 2017, The Astrophysical Journal, 845, 73, doi: 10.3847/1538-4357/aa7de3
- Springel (2005) Springel, V. 2005, MNRAS, 364, 1105, doi: 10.1111/j.1365-2966.2005.09655.x
- Stern et al. (2020) Stern, J., Faucher-Giguère, C.-A., Fielding, D., et al. 2020, The Astrophysical Journal, 911, 88, doi: 10.3847/1538-4357/abd776
- Strassler & Zurek (2007) Strassler, M. J., & Zurek, K. M. 2007, Phys. Lett. B, 651, 374, doi: 10.1016/j.physletb.2007.06.055
- Virtanen et al. (2020) Virtanen, P., Gommers, R., Oliphant, T. E., et al. 2020, Nature Methods, 17, 261, doi: 10.1038/s41592-019-0686-2
- Wetzel et al. (2020) Wetzel, A., Garrison-Kimmel, S., Wetzel, A., & Garrison-Kimmel, S. 2020, ascl, ascl:2002.015. https://ui.adsabs.harvard.edu/abs/2020ascl.soft02015W/abstract
- Wetzel et al. (2022) Wetzel, A., Hayward, C. C., Sanderson, R. E., et al. 2022, doi: 10.48550/arxiv.2202.06969
- Widmark et al. (2021) Widmark, A., Laporte, C. F. P., de Salas, P. F., & Monari, G. 2021, Astronomy and Astrophysics, 653, doi: 10.1051/0004-6361/202141466
- Wiersma et al. (2009) Wiersma, R. P., Schaye, J., & Smith, B. D. 2009, Monthly Notices of the Royal Astronomical Society, 393, 99, doi: 10.1111/J.1365-2966.2008.14191.X/2/MNRAS0393-0099-F6.JPEG
- Winch et al. (2022) Winch, H., Setford, J., Bovy, J., & Curtin, D. 2022, Astrophys. J., 933, 177, doi: 10.3847/1538-4357/ac7467
- Yu et al. (2021) Yu, S., Bullock, J. S., Klein, C., et al. 2021, Monthly Notices of the Royal Astronomical Society, 505, 889, doi: 10.1093/mnras/stab1339
- Zurek (2013) Zurek, K. M. 2013, Physics Reports, 537, 91, doi: 10.1016/j.physrep.2013.12.001
Appendix A ADM Cooling Rates
The Atomic Dark Matter (ADM) model considered in this work consists of a dark electron, , dark proton, , and a massless dark photon, . In this paper, we consider the scenario where the majority of the dark matter (DM) exists in Cold Dark Matter (CDM), and a subdominant fraction () is in ADM. While the CDM forms stable halos, the ADM acts in wholly novel ways given its strongly dissipative nature. In the early Universe, the dark electrons and protons combine to form neutral, bound-state dark hydrogen, , with binding energy , within a galaxy’s host halo. As the galaxy evolves, however, the ADM gas is shock-heated to the virial temperature and ionized. Therefore, the ADM in a galaxy exists as a mixture of both neutral gas and ionized plasma. The fraction in each is set by the cooling rate in the dark sector, which depends on the fundamental parameters of the ADM model.
We use the atomic cooling equations derived in Rosenberg & Fan (2017) (see also, Ryan et al. (2022a, b); Gurian et al. (2022a)) and neglect molecular cooling. The latter assumption suppresses gas collapse rates in the central galaxy at late times since gas temperatures cannot decrease below the dark hydrogen binding energy. The inclusion of molecular cooling processes is necessary for detailed modeling of the dark interstellar medium, which is beyond the scope of this work. In more detail, the ADM cooling processes considered here include the following:
-
•
Collisional excitation:
-
•
Collisional ionization:
-
•
Inverse Compton Scattering (from dark CMB):
-
•
Recombination:
-
•
Bremsstrahlung: ,
where is an excited state. Collisional excitation of dark hydrogen dominates the cooling rate at low temperatures, while Bremsstrahlung dominates at high temperatures,
| (A1) |
where the ADM is mostly ionized (see Ryan et al. (2022b) for baryonic cooling rate re-scalings).
For process with velocity-dependent cross section, , the cooling rate is given by
| (A2) |
where are the number densities of the initial species, assumed to move with some relative speed . The corresponding cooling rate is
| (A3) |
where is the energy of the initial state in either species . The thermal averages in Eqs. A2–A3 are performed assuming that the dark electron speeds at temperature are well-modeled by a Maxwell-Boltzmann distribution,
| (A4) |
where is the dark electron mass. Because we only consider parameters where the dark proton is much more massive than the dark electron (), the relative speed between the and either or will be approximately equal to the dark electron speed.
Rosenberg & Fan (2017) detail the assumptions that are made to obtain their ADM cooling rates, and we refer the interested reader to their work for a comprehensive overview. Here, we highlight three of the most important assumptions. The first is that the ADM gas is optically thin, so that any dark photons emitted in the cooling process are not reabsorbed. Second, is that , which—as described above—has implications when modeling the relative speeds of the different species, but also means that the reduced mass of the dark hydrogen can be approximated as simply . Lastly, the calculated rates omit the Gaunt factors, so one should consider the resulting rates to be the correct order-of-magnitude, but not exact. This approximate agreement is seen in Fig. A1 where we compare the standard cooling rates to those of Rosenberg & Fan (2017) with the Standard Model particle parameters.
To compute the complete cooling rates in Eq. A3, we need the number densities of the interacting species. To do this, we assume that the collisional ionisation (CI) rate balances the recombination (R) rate:
| (A5) |
where , with , and the ADM gas is assumed to be neutral so that and thus . It thus follows that
| (A6) |
This assumption, namely ionisation equilibrium (IE), is valid for the densities typical in Milky Way-mass galaxies. We verify the validity of this assumption in Sec. B.
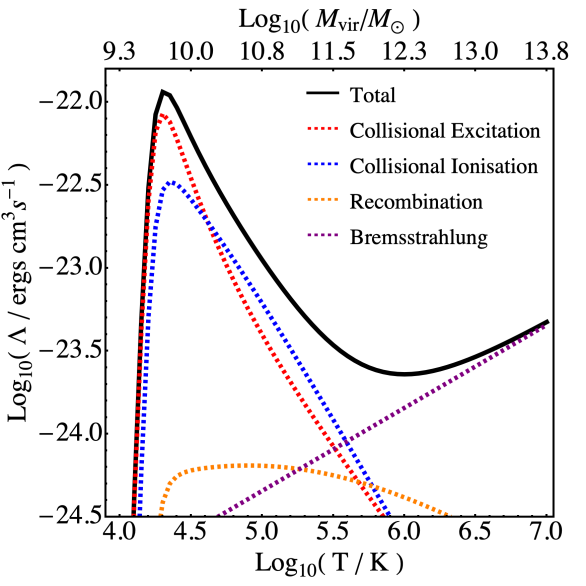
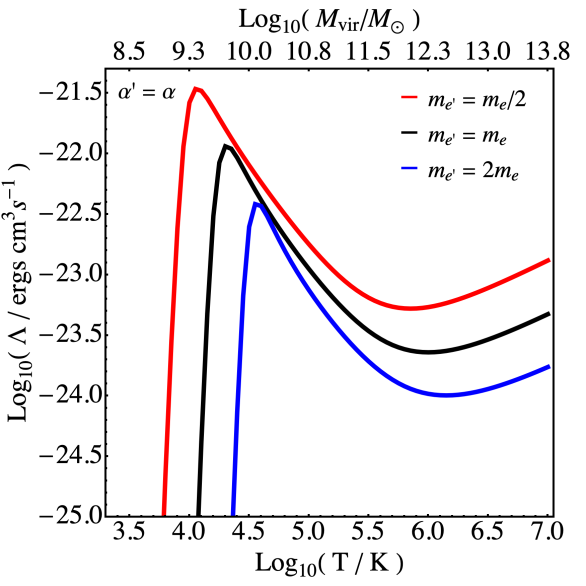
Figures A1 and A2 show the breakdown of ADM cooling processes and how the total rate varies with the choice of parameters. The right panel of Fig. A1 shows how the different cooling processes (collisional excitiation and ionization, inverse Compton scattering, recombination, and Brehmsstrahlung) contribute to the total cooling rate for ADM with , and . Collisional excitation dominates at low temperatures , while Bremsstrahlung dominates at higher temperatures . In Fig. A2, one can see that varying the and alters the cut-off temperature since it scales with the binding energy, . The peak collisional excitation cooling rate and ionised free-free cooling rates also increase monotonically with decreasing and increasing at temperatures above .
Appendix B Validating Ionisation-Recombination Equilibrium
The reason that ionisation equilibrium holds for galactic densities and temperatures is that the typical ionisation and recombination timescales are much smaller than the dynamical timescales. In particular, the IE timescale is approximately
| (A1) |
where the last approximation follows from the assumption of Eq. A6. The other relevant timescale is the dynamical time (or free-fall time),
| (A2) |
where is Newton’s gravitational constant and is the average density of the dark gaseous halo. For IE to be valid, .
We can check that this is valid for the densities and temperatures typical of the Milky Way-like galaxy m12i. For the densities and temperatures typical of the circumgalactic medium (CGM) of the galaxy, fitting a simple power law to the baryonic gas in CDM gives the following fit for :
For ADM, we use the same functional forms, but scaled as and (since ). We do not fit directly to the ADM gas in ADM-1 and ADM-2 since the simulation cooling rates explicitly rely on ionisation-recombination equilibrium; however, the approximate re-scalings presented here do provide a reasonable fit to the simulated ADM gas distributions. Calculating the ratio for the ADM-1 and ADM-2 parameters gives us between 10 and 100 kpc. This validates the use of ionisation-equilibrium in the ADM cooling module. Within the dark ISM at , the temperatures will be near the peak of the cooling curve in Fig. 1 and will have much greater densities than those in the dark CGM. Thus, ionisation-equilibrium will also hold for the efficiently cooling gas in the dark ISM.
Appendix C Brief Overview of GIZMO Implementation of ADM Physics
ADM is implemented in GIZMO as a separate gas species. This is achieved using a separate identification number in the code’s gas structure: ADMType. It is an integer with different values for ADM and for baryons. Within GIZMO’s hydrodynamic routine, we separate ADM and baryons by requiring that all gas particle neighbhour-finding routines that compute pressure, temperature and density gradients only search for gas particles with the same ADMType. We tested the hydrodynamic implementation by validating on differing initialisations of baryonic and ADM gases, making sure that both species were separate hydrodynamically.
For cooling rates, we wrote separate routines containing all the ADM cooling functions in Rosenberg & Fan (2017) with the correct scalings with ADM particle physics parameters. For each ADM cooling process listed in Sec. A, we checked the output values from the functions as well as the GIZMO output during controlled hydrodynamic tests to verify the implementation and the ADM gas cooling scaling with varying ADM parameters according to Fig. A2.
We also ensured that all essential baryonic feedback processes such as baryonic star formation criteria, baryonic feedback, etc. were completely decoupled from the ADM gas. Moreover, the ADM gas has an entirely different clump-formation criteria as well as dark feedback physics (in this investigation, there is no dark feedback).
Appendix D Supplementary Figures and Tables
| CDM | CDM-NF | ADM-1 | ADM-2 | |||||||||
| Baryons | Baryons | Baryons | ADM | Baryons | ADM | |||||||
| Gas | Stars | Gas | Stars | Gas | Stars | Gas | Clumps | Gas | Stars | Gas | Clumps | |
| 3.83 | 1.83 | 1.42 | 1.58 | 3.35 | 1.34 | 1.64 | 0.63 | 1.19 | 1.59 | 2.91 | 0.78 | |
| 0.039 | 0.28 | 0.035 | 0.22 | 0.022 | 0.17 | 0.014 | 0.14 | 0.022 | 0.21 | 0.015 | 0.18 | |
| 0.12 | 0.99 | 0.119 | 1.64 | 0.087 | 0.63 | 0.045 | 0.75 | 0.086 | 0.75 | 0.035 | 0.71 | |
| 0.94 | 0.38 | 0.67 | 0.20 | 0.97 | 0.39 | 0.86 | 0.19 | 0.81 | 0.37 | 0.99 | 0.21 | |
| 0.05 | 0.39 | 0.32 | 0.53 | 0.03 | 0.40 | 0.14 | 0.57 | 0.18 | 0.45 | 0.01 | 0.52 | |
| 0.01 | 0.23 | 0.01 | 0.27 | 0.00 | 0.21 | 0.00 | 0.24 | 0.01 | 0.18 | 0.00 | 0.27 | |
| 0.95 | 0.71 | 0.95 | 0.51 | 0.96 | 0.71 | 0.98 | 0.53 | 0.96 | 0.68 | 0.97 | 0.50 | |