An Offline Metric for the Debiasedness of Click Models
Abstract.
A well-known problem when learning from user clicks are inherent biases prevalent in the data, such as position or trust bias. Click models are a common method for extracting information from user clicks, such as document relevance in web search, or to estimate click biases for downstream applications such as counterfactual learning-to-rank, ad placement, or fair ranking. Recent work shows that the current evaluation practices in the community fail to guarantee that a well-performing click model generalizes well to downstream tasks in which the ranking distribution differs from the training distribution, i.e., under covariate shift. In this work, we propose an evaluation metric based on conditional independence testing to detect a lack of robustness to covariate shift in click models. We introduce the concept of debiasedness and a metric for measuring it. We prove that debiasedness is a necessary condition for recovering unbiased and consistent relevance scores and for the invariance of click prediction under covariate shift. In extensive semi-synthetic experiments, we show that our proposed metric helps to predict the downstream performance of click models under covariate shift and is useful in an off-policy model selection setting.
1. Introduction
Search and recommender systems aim to rank items in order of relevance to a given search query or user context (Liu, 2009). Operational search engines have access to large logs of user behavior that are valuable sources for improving ranking systems (Serdyukov et al., 2012; Qin and Liu, 2013; Chapelle and Chang, 2011). However, implicit user feedback in the form of clicks is well-known to be biased (Craswell et al., 2008; Joachims et al., 2005). E.g., clicks can only occur on items exposed to users, introducing selection bias (Ovaisi et al., 2020; Oosterhuis and de Rijke, 2020a). Also, the rank at which a document is displayed greatly impacts the number of users seeing and clicking an item, leading to position bias (Joachims et al., 2005, 2017). And trust bias arises when users rely on their search engine to place relevant documents at the top leading to clicks on top-ranked items regardless of their relevance (Agarwal et al., 2019; Vardasbi et al., 2020b).
Click models. Click models have a long history in web search for modeling user behavior by learning to predict how a user would interact with a given list of items (Chuklin et al., 2015; Craswell et al., 2008; Chapelle and Zhang, 2009; Dupret and Piwowarski, 2008; Borisov et al., 2016). Click models explicitly model effects that impact a user’s click decision, such as item relevance, position bias, or trust bias, and are thus a valuable tool for understanding users (Craswell et al., 2008), predicting ad clicks (Zhu et al., 2010; Chen and Yan, 2012; McMahan et al., 2013), as offline evaluation metrics (Chuklin et al., 2013), or estimating biases that the field of unbiased learning-to-rank aims to mitigate (Joachims et al., 2017; Vardasbi et al., 2020b; Ai et al., 2021).
Commonly, two aspects of click models are evaluated (Grotov et al., 2015; Chuklin et al., 2015). First, a model’s ability to accurately predict clicks is commonly measured using the perplexity of the model on a hold-out test set of clicks (Dupret and Piwowarski, 2008). Second, if a model estimates document relevance, metrics such as nDCG or MRR can be computed using relevance annotations gathered by human experts (Chapelle and Zhang, 2009). Recently, Deffayet et al. (2023) have shown that the current evaluation protocol of perplexity and nDCG does not guarantee that the best-performing model generalizes well to predicting clicks on unseen rankings. By simulating a variety of user behaviors on rankings created by different ranking policies, the authors show that the best-performing models on one ranking policy are not guaranteed to perform well when presented with the same documents in a different order. This setting simulates a covariate shift in the ranking distribution (also called policy shift).
Failure of generalization. Deffayet et al. (2023) identify two cases where the current evaluation protocol breaks down. First, they find that biased click prediction methods can achieve high nDCG scores, especially when the policy that collected the click data is already near-optimal and tends to generate similar rankings. Picture the case in which all documents are ranked in order of relevance to the user. In this setting, position bias perfectly correlates with document relevance, and naive methods such as using a document’s average click-through rate (CTR) as relevance and click prediction will lead to strong nDCG and perplexity scores. But this method fails to predict clicks on the inverted ranking in which the most relevant item is displayed at the bottom and is, thus, highly affected by position bias. In this case, predicting the average CTR of a document as inferred from the original dataset is not a good prediction of user behavior on the inverted ranking, and the model fails to generalize. This model is not invariant under policy shift because it gives different predictions depending on the train rankings.
Second, the authors find that click model mismatch, a case in which the assumptions of the click models do not match the user behavior in the collected dataset, can lead to wrong conclusions about which models generalize well to unseen rankings. While Deffayet et al. (2023) evaluate a variety of click models and identify trends about which click models tend to generalize better, we still lack a principled approach to reliably select a click model from a set of candidates for deployment in downstream applications.
Debiasedness of a click model. In this work, we introduce the notion of debiasedness of a click model w.r.t. the logging policy, the concept that the inferred relevance of a newly trained click model should not be correlated with the relevance predictions of the policy that was used to collect the training data, beyond the true relevance signal. First, we prove that debiasedness is a necessary condition (i) for obtaining consistent and unbiased estimations of document relevance, and (ii) for the invariance of click prediction under policy shift. Secondly, we present conditional mutual information with the logging policy (CMIP), a method based on conditional independence testing, that measures the degree of debiasedness of a newly trained model with regard to the logging policy.
In our semi-synthetic experiments, we first reproduce the findings in (Deffayet et al., 2023) on strong but narrow logging policies. Then, we verify, on a wide array of training configurations, that CMIP helps to predict the performance of models outside of their training distribution. Lastly, we show that off-policy selection strategies based on CMIP incur lower regret than those based on perplexity and nDCG only.
Contributions. Our contributions can be summarized as follows:
-
•
We introduce the notion of debiasedness of a click model and show that it is necessary for unbiasedness, consistency, and invariance under policy shift of click models.
-
•
We propose CMIP, a metric using relevance annotations that measures debiasedness of a click model.
-
•
We show in semi-synthetic experiments that CMIP improves predicting the downstream performance of click models as well as the regret of off-policy model selection strategies.
To support the reproducibility of this work, we release the code for this paper111https://github.com/philipphager/sigir-cmip and a standalone implementation of our metric.222https://github.com/philipphager/cmip Below, we first introduce related work on click models and conditional independence testing (Section 2). Then, we present the current evaluation protocol for click models and its deficiencies (Section 3) before introducing the concept of debiasedness and our proposed metric (Section 4). We end by evaluating our metric in extensive semi-synthetic experiments (Section 5 and 6).
2. Related Work
2.1. Click models and their evaluation
Click models emerged to model user behavior in web search (Craswell et al., 2008; Dupret and Piwowarski, 2008; Chapelle and Zhang, 2009; Liu et al., 2016). Early methods use probabilistic graphical models to encode assumptions about user behavior in order to disentangle the influence of the presentation of a search result and its intrinsic relevance. The examination hypothesis, for example, introduced with the position-based model (PBM) (Craswell et al., 2008), assumes that the user examine and perceive the document as relevant in order to click on it. The cascade model (Craswell et al., 2008) assumes that users browse results from top to bottom, click on the first relevant result and then leave the page. For an overview of common click models, see (Chuklin et al., 2015).
More recently, click models based on neural architectures have emerged (Borisov et al., 2016; Dai et al., 2021; Chen et al., 2020; Borisov et al., 2018; Zheng et al., 2019; Lin et al., 2021) to model more complex browsing behavior (Borisov et al., 2018) and user preferences across sessions (Chen et al., 2020; Lin et al., 2021). Neural click models typically also use more expressive representations of queries, documents, and other meta-data (Chen et al., 2020; Borisov et al., 2018; Lin et al., 2021). Combined with recent optimization techniques, these models enable efficient training on large-scale click logs. In this work, we use three click models originally proposed as probabilistic graphical models and implement them with current gradient-based optimization techniques. We also include two neural click models, and two baselines based on click statistics. These models are presented in Section 5.2.2.
Click models are commonly evaluated using the log-likelihood of clicks in a test set, measuring how well a model approximates the observed data (Grotov et al., 2015). Craswell et al. (2008) evaluate models by measuring cross-entropy. More widely used nowadays is the perplexity metric, which measures how surprised a model is to observe a click on a given document and rank (Dupret and Piwowarski, 2008). Another line of work compares predicted and actual click-through-rates (CTRs) on a test set, typically using MAE or RMSE (Chapelle and Zhang, 2009; Zhu et al., 2010; Grotov et al., 2015). Dai et al. (2021) introduced distributional coverage, a metric quantifying whether the distribution of click sequences predicted by a model matches the true distribution of clicks. Moving beyond click prediction, Chapelle and Zhang (2009) evaluate the ranking performance of click models by computing retrieval metrics (e.g., MAP or nDCG) on an additional test set of human relevance annotations. We introduce perplexity, nDCG, and their limitations in Section 3.2.
2.2. Conditional independence testing
This work introduces the concept of debiasedness, which requires a test for conditional independence (Dawid, 1979). Given a set of three random variables , , and , conditional independence assesses if, given , knowing is helpful for predicting (and vice versa). Conditional independence tests are widely applied in statistics and causal inference, e.g., to verify edges in Bayesian networks (Koller and Friedman, 2009), to discover causal graphs (Pearl, 2009), or for feature selection (Koller and Sahami, 1996).
We require a non-parameteric conditional independence test for continuous random variables. Approaches include binning continuous variables to apply tests for discrete data (Margaritis, 2005), reframing the problem as measuring the distance between two conditional densities (Su and White, 2007), estimating conditional mutual information (Mukherjee et al., 2019), or using kernel-based methods (Fukumizu et al., 2004; Doran et al., 2014). We use methods from (Sen et al., 2017; Mukherjee et al., 2019) to estimate conditional mutual information. Their approach is inspired by the use of model-powered independence testing (Lopez-Paz and Oquab, 2017; Sen et al., 2017; Mukherjee et al., 2019), reformulating statistical tests as supervised learning problems, which can be solved using standard classification or regression models. We introduce the approach we follow in Section 4.3.
3. Background
3.1. Notation and assumptions
Notation. Let be a document. A ranking is an ordered list of documents: . Note that is a list of length and is the document displayed at position . We retrieve the position of a document in using . A policy serves a ranking in response to a search query . We consider stochastic ranking policies , which are probability distributions over rankings, given a query. For each ranking displayed to a user, we observe a vector of binary feedback of length , with each entry denoting a click or no click on the displayed item: . Thus, our final dataset contains observations of a user query, the displayed ranking, and the recorded clicks: . The production ranker that collects this training dataset is commonly called the logging policy, which we denote as .
Assumptions. We follow a common assumption in learning-to-rank (L2R), that user clicks are a noisy and biased indicator of how relevant a document is to a given query (Joachims et al., 2017; Oosterhuis, 2022). We denote the relevance of an item to a query as . As explained before, clicks are usually influenced by bias factors such as the item’s position or the user’s trust in the system. Depending on the specific click model, bias factors can depend only on the position of a document or even on other documents in the same ranking. We refer to the vector of bias factors for documents in a given ranking as .
Our theory considers the family of click models that follow the structure of the examination hypothesis (Craswell et al., 2008; Chuklin et al., 2015), which assumes that to be clicked, a document has to be observed by a user and deemed as relevant. In a general form, the examination hypothesis demands that relevance and bias factors factorize as:
| (1) |
This generic formulation of the examination hypothesis, also used in (Zhuang et al., 2021), can account for users observing an item based on its position or even based on the relevance of surrounding documents. For simplicity, we assume that , , excluding any bias that leads to an item having no chance of being clicked (Joachims et al., 2017), such as item selection bias. However, our work can be extended to this case. Lastly, our discussions below consider only a single query to simplify our notation. All statements can be extended to a setting with multiple queries.
3.2. Evaluating click models
Click models are trained on an objective quantifying the quality of their click prediction. However, their primary goal, arguably, is to recover accurate estimates of the latent factors of user feedback. Hence, the literature on click models has adopted metrics for both of these objectives, respectively perplexity (PPL) and normalized discounted cumulative gain (nDCG).
The click prediction quality on a test set
is measured by the perplexity at each rank and by the average perplexity over all ranks:
| (2) | ||||
| (3) |
where is a vector of click probabilities predicted by the model for a ranking . Perplexity measures how surprised a model is to observe a given click behavior in the test set, given the model’s parameters (Dupret and Piwowarski, 2008). Perplexity is at least one and can be arbitrarily high. However, since a model predicting clicks at random has a perplexity of two, a realistic click model should achieve a perplexity between one and two (Chuklin et al., 2015).
The quality of relevance estimates
for documents is measured by the ranking metric nDCG, comparing predicted relevance scores against human annotations of relevance:
| (4) |
where and are obtained by ranking documents in order of relevance, as predicted by human annotators and the click model, respectively.
These two metrics are complementary in the sense that perplexity quantifies the goodness-of-fit of the model to the logged data while nDCG quantifies the quality of the rankings produced by the recovered relevance estimates. However, as we recall below, previous work has warned about the poor generalizability of these two metrics in many practical scenarios.
3.3. Perplexity fails to generalize, especially under model misfit
Perplexity measures how well a model fits the conditional distribution of clicks given rankings observed in the dataset. However, the performance measured by perplexity only holds on a separate test set as long as the i.i.d. assumption is satisfied (Shen et al., 2021), which notably requires that the rankings in the test set are sampled from the same distribution as rankings in the training set. This assumption is often violated when using click models to predict and evaluate ranking policies that differ from the one used for training (e.g., (Chen and Yan, 2012; Joachims et al., 2017)). This mismatch creates a covariate shift in the input distribution of the model. In such cases, no guarantee can be derived on the out-of-distribution performance of the trained models, and we are likely to observe a drop in performance.
Deffayet et al. (2023) show the empirical effect of covariate shift on click model prediction. Model misfit, searching within model classes that do not contain the Bayes-optimal function, likely aggravates the performance drop on click predictions out-of-distribution. Model misfit is not the only cause for the lack of robustness. E.g., deep neural networks, that have high capacity and potentially include the Bayes-optimal predictor, can also suffer from covariate shift due to training sets covering only a narrow space of all possible rankings. Hence, PPL measured in-distribution is not a good predictor of click model performance out-of-distribution in many practical scenarios, including model misfit and narrow logging policies.
3.4. nDCG fails to generalize when the logging policy is good
nDCG assesses the ordering of documents based on their predicted relevance scores. As a list-wise metric, nDCG does not evaluate the accuracy of the estimated relevance probabilities but only how ordering by these relevance estimates correlates with rankings obtained through expert annotations. This ranking task is a use case for click models, but many scenarios require accurate estimation of relevance and examination probabilities, such as off-policy evaluation (Oosterhuis and de Rijke, 2020b), counterfactual learning-to-rank with inverse propensity scoring (Agarwal et al., 2019), or click maximization in reinforcement learning (Slivkins, 2019). Performance measured by nDCG can be misleading for these tasks since highly biased and poorly predictive click models can obtain high nDCG scores (Deffayet et al., 2023). Indeed, when the logging policy already achieves a high nDCG, one cannot use nDCG to differentiate between a model predicting accurate relevance probabilities from a model replicating the logging policy, e.g., by sorting documents by their number of impressions. In more realistic scenarios, this misleading behavior of nDCG might manifest itself only for a group of queries (e.g., tail queries), enabling a model to achieve an improved nDCG score at the cost of biased relevance estimates for these queries. Consequently, nDCG is not a good predictor of click model debiasing capabilities in many realistic settings.
Faced with the lack of metrics evaluating the robustness of click models to shifts in the input rankings, we propose the idea of measuring debiasedness in the next section.
4. Towards healthy benchmarks:
A metric to quantify debiasedness
To establish CMIP, which measures the robustness of click models to covariate shift, we first introduce the notion of debiasedness in Section 4.1. We then explain how to test for this property in Section 4.2, and finally instantiate our proposed metric in Section 4.3.
4.1. Debiasedness in click modeling
Let be a set containing three relevance scores for each document: , where is the true relevance as annotated by human experts and the relevance estimate of the logging policy, which we define as the expected rank of a document: . We assume this quantity to be known in our experiments but it can easily be estimated otherwise. Finally, is a set of relevance scores as estimated, e.g., by a new model.
We consider the following random experiment. We draw triplets of relevance scores from at random and with replacement, revealing a document’s relevance scores but not the document itself. We write , and for the random variables that return the respective relevance scores over all documents.333In the remainder, we will use a set and its corresponding random variable interchangeably. We can now define the debiasedness of a set of scores :
Definition 4.1.
A set of scores is debiased w.r.t. the logging policy if its corresponding random variable is independent of the relevance of the logging policy , conditioned on the true relevance :
| (5) |
Intuitively, debiasedeness means that the score of a document cannot be predicted by knowing where the logging policy placed it. Click models aim to disentangle the factors influencing user behavior, thereby also alleviating biases induced by the logging policy. Therefore, a natural property that we may expect of a well-behaved click model is that its estimated relevance of an item cannot be predicted by revealing the relevance of that same item according to the logging policy, i.e., debiasedness:
Definition 4.2.
A click model is debiased w.r.t. the logging policy if its estimated relevance after training is independent of the relevance of the logging policy, conditionally on the true relevance as well as the dataset it has been trained on:
| (6) |
where is the set of relevance scores estimated by a click model trained on dataset .
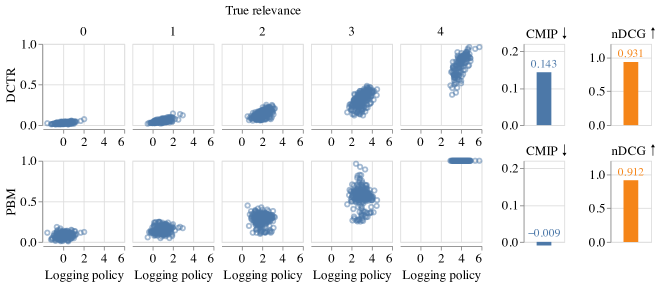
We give a visual intuition of debiasedness and our proposed metric CMIP in Figure 1. We display the relevance estimates obtained by a PBM click model and a model predicting the average CTR of each document (DCTR) as relevance. In the plot, we group all documents by their true annotated relevance. In contrast to the PBM, the DCTR model does not account for position bias simulated in the click data. We can observe a clear correlation of the relevance estimates of the DCTR model with those of the logging policy, meaning we can predict the estimated relevance of a randomly drawn document by knowing where the logging policy placed it. Thus, the DCTR model is not debiased in this setting, which is captured in a higher score of CMIP.
Debiasedness alone does not guarantee high performance of a click model, e.g., a model assigning random relevance scores is trivially debiased. Below, we show that debiasedness is a necessary condition for common goals in unbiased learning-to-rank.
Debiasedness is a necessary condition for both consistency and unbiasedness. Unbiasedness has been introduced in different subfields as a common goal of unbiased learning-to-rank (Oosterhuis, 2022; Joachims et al., 2017). Extending the meaning of unbiasedness from estimators to click models, an unbiased click model recovers the true relevance parameters for each document, in expectation over possible training datasets. Using to denote the relevance of document , as predicted by a click model after being trained on dataset , a click model is unbiased if, and only if:
| (7) |
where we use the notation to illustrate that the dataset is generated by users interacting with the logging policy. Consistency has been introduced more recently (Oosterhuis, 2022), as a more attainable goal for click models. A consistent click model recovers the true relevance parameters in the limit of infinite data:
| (8) |
Since the relevance scores recovered by a consistent click model in the limit of infinite data are equal to the true relevance , a consistent click model is trivially debiased: . Similarly, the expected relevance scores of an unbiased click model are debiased since .
Debiasedness is a necessary condition for invariance under policy shift. In this work, we evaluate the click prediction capabilities of click models outside of their training distribution. Therefore, we define the notion of invariance under policy shift as a model predicting the same click probabilities for a document, regardless of the dataset it was trained on:
Definition 4.3.
A click model is said to be invariant under policy shift if its estimated click probabilities are the same regardless of the training set, i.e., for every ranking and any two datasets and :
| (9) |
where are the click predictions obtained after training a click model on .
This definition allows us to introduce our main theorem that for every click model following the examination-hypothesis (Eq. 1), debiasedness is a necessary condition for invariance under policy shift:
Theorem 4.4.
A click model that is invariant under policy shift is debiased. For every dataset and ranking :
| (10) |
Proof.
First, a model such that is debiased since , and therefore satisfies Eq. 10. Next, assume in the remainder. For a model following the examination-hypothesis, we can write, for any rank , ranking and training dataset :
Consider two documents and with . Consider also two rankings that differ only by their first document: , , and for . Let these rankings share the same examination probability on their first position: , then we can write down the two click probabilities:
Because of the equality of examination probabilities, we have:
When the left-hand side of Eq. 10 is true, this ratio does not depend on and relevance scores are determined up to a document-independent constant, so knowing does not help predict the relevance of a newly picked document: . Thus, the model is debiased: . ∎
A key observation is that the estimated relevance of a document may depend on the training dataset and ultimately on the logging policy, yet revealing might not help to predict . Take, for example, the PBM model. Without explicit constraints, we can scale its inferred relevance scores up or down, and by adjusting the examination scores accordingly, the click probabilities stay constant. Then a perfectly fitted PBM may be invariant under policy shift, while the exact set of parameters it recovers depends on the training dataset. However, for a fixed dataset, knowing does not help to predict in this setting.
In conclusion, while debiasedness alone does not guarantee that a click model inferred the correct parameters during training, it is a necessary condition for consistency, unbiasedness, and invariance under policy shift. We, therefore, propose to systematically verify that this property holds, using a protocol based on relevance annotations, which we describe in the following sections.
4.2. Testing for debiasedness with mutual information
Given a set of annotated documents and the expected rank of these documents under the logging policy, we can test for the debiasedness of a candidate click model using any conditional independence test for continuous variables. Using independence tests, given some significance level, would yield a binary answer to whether the click model is debiased. In practice, however, we may be more interested in picking the best model from a set of candidates for deployment, i.e., off-policy selection (OPS). For example, which model should we select if multiple candidates are debiased, or none are? Therefore, we choose to quantify the degree of debiasedness using the effect size of an independence test: conditional mutual information (CMI).
We first recall the concept of mutual information (MI), which measures the average reduction in uncertainty of a random variable obtained when knowing the value of a second random variable . \AclMI, usually expressed as , can capture non-linear relationships between variables. Conditioning the mutual information between two variables on a third variable is strongly connected to conditional independence testing:
| (11) |
where are the relevance scores predicted by a click model, the implicit relevance scores of the logging policy, and the human annotations of relevance. Meaning, conditional on , knowing does not reduce the uncertainty of predicting and vice-versa. Thus, conditional independence testing is a special use case of CMI and we can interpret a lower value of CMI as a higher degree of debiasedness, with a CMI of zero indicating that the relevance scores of a newly trained click model are independent of the policy that collected the dataset, conditional on the true relevance. We refer to the CMI when computed w.r.t. the logging policy as CMIP.
4.3. Estimating conditional mutual information with the logging policy (CMIP)
In this section, we cover how to estimate the CMIP metric to quantify debiasedness. First, we note that CMI can be expressed as the Kullback-Leibler divergence between two distributions:
| (12) |
which is a pseudo-distance between the joint distribution of all three variables occurring together and the distribution in which the predicted relevance scores and the relevance of the logging policies are independent, conditional on . If the divergence between both distributions is zero, the joint distribution (which we actually observe) is equivalent to the distribution on which conditional independence holds. Given this divergence-based formulation of CMI, we employ a two-step approach suggested in (Mukherjee et al., 2019). First, we obtain samples from the marginal distribution on which conditional independence holds. Second, we estimate the KL-divergence between the observed dataset and the generated samples, which is the estimate of our CMIP metric.
4.3.1. Sampling from the marginal distribution
How can we obtain samples from the conditional independence distribution given our observational dataset ? For a proof that this methodology actually approximates , we refer to (Sen et al., 2017, Theorem 1). We use a knn-based approach suggested in (Sen et al., 2017); its simplicity and computational speed make it suitable for an evaluation metric. Given a dataset of observed relevance labels for each document, , we split the data into two equal parts and . For each document in , we find the nearest neighbor document in with the most similar true relevance. In the case of using relevance annotations, this method simplifies to sampling any document from with the same relevance label. By exchanging the relevance estimates of the logging policy between the two documents, the resulting dataset , is now a sample from .
4.3.2. Estimating KL-divergence
Given samples from the original relevance dataset and samples from the marginal distribution , we can compute the CMI as the KL-divergence between both distributions. We follow Mukherjee et al. (2019) and frame the task of divergence estimation between two continuous joint distributions as a binary classification problem. The main idea is to label samples from with and samples from with . After shuffling the two datasets into one, we train a binary classifier to predict to which distribution a given triplet of relevance values belongs to. The better the classifier can assign samples to their original distribution, the higher the divergence between the two distributions. Using the Donsker-Varadhan reformulation of KL-divergence (Mukherjee et al., 2019, Definition 3), we use the classifier’s predictions of on a test set to compute the conditional mutual information with the logging policy (CMIP) as:
| (13) |
The above procedure requires a well-calibrated classifier and we clip predictions to avoid extremely large likelihood ratios when dividing by predictions close to zero. Lastly, we bootstrap the metric, performing multiple repetitions of k-nn sampling and KL divergence estimation, reporting the average over five repetitions. In order to simplify the usage of our metric, we release a standalone implementation of CMIP.444https://github.com/philipphager/cmip
5. Experimental Setup
We test if CMIP helps to predict which click models are robust to covariate shift by performing experiments using a semi-synthetic click simulation setup prevalent in unbiased learning-to-rank (Joachims et al., 2017; Oosterhuis and de Rijke, 2020a; Vardasbi et al., 2020b, a). The setup is semi-synthetic since we generate synthetic user clicks on real search queries and documents. To simulate shifts in the ranking distribution, we train models on click data collected under one logging policy and evaluate the model on clicks obtained under a different policy. Below, we introduce our simulation setup and the click models used in our experiments.
5.1. Semi-synthetic click simulation
5.1.1. Overview
We generate click datasets by repeatedly: (i) sampling a query and its candidate documents from a preprocessed real-world dataset; (ii) sampling a ranking of the candidate documents using a stochastic logging policy; and (iii) presenting the ranked search results to a synthetic user model to sample clicks. In the following, we cover each step in more detail.
5.1.2. Dataset and preprocessing
Our click simulation is based on the MSLR-WEB10K dataset (Qin and Liu, 2013). We use the training dataset of the first fold, containing 6,000 search queries, each with a set of candidate documents. Each query-document pair was judged by experts on a five point relevance scale: , which we use as ground-truth in our experiments. During preprocessing, we reduce the number of documents per query to ten using stratified sampling on the human relevance annotation. Thereby, we reduce the number of candidate documents, while keeping a similar distribution of relevance grades. After discarding all queries with less than ten documents, we obtain a total of 5,888 queries.
5.1.3. Stochastic policies
For each new simulated user session, we first pick a query from the preprocessed dataset uniformly at random, a common practice in simulation for unbiased learning-to-rank (Joachims et al., 2017), to avoid high variance on rare queries in this study. After sampling a query, we sample rankings of the candidate set of documents. For that, we first obtain relevance estimates for each document using one of three policies of different quality:
- Uniform::
-
A policy assigning the same relevance to all documents.
- LambdaMART::
-
A LambdaMART ranker (Burges, 2010) trained on feature vectors and relevance annotations provided in MSLR-WEB10K.555LightGBM version 3.3.2, using 100 trees, 31 leafs, and learning rate 0.1.
- NoisyOracle::
-
A near-optimal policy using perturbed human relevance annotations after adding Gaussian noise of variance 0.5.
After using one of these three policies to obtain relevance estimates for each document, we sample stochastic rankings using a Plackett-Luce model (Plackett, 1975; Luce, 1959). We sample multiple rankings per query to observe documents in different positions since a deterministic ranking would not allow our click models to disentangle effects such as position bias or relevance during training. We use the Gumbel Softmax trick to efficiently sample rankings from a Plackett-Luce distribution (Bruch et al., 2020; Oosterhuis, 2021) and control the degree of stochasticity in the sampled rankings using the temperature parameter of the softmax. We sample rankings with a low degree of stochasticity in our experiments, using a temperature of by default.
5.1.4. User models
After sampling rankings, we generate synthetic clicks on our documents. We define how relevant each document is to the synthetic user based on the expert relevance annotations (Chapelle et al., 2009): , with noise to also sample clicks on irrelevant documents. To examine our metric under a variety of click behaviors, we simulate four different users:
- PBM::
- DBN::
-
A user for whom relevance is split into two concepts: attractiveness and satisfaction. Attractiveness measures how likely a user is to click on a document after observing it in the ranking, while satisfaction estimates how likely a user is satisfied with the document after opening it. Documents are examined from top to bottom until the user is satisfied or abandons the list (Chapelle and Zhang, 2009). Thus, examination of a document not only depends on its rank, but also on the documents examined before. We use the probability of relevance to define the attractiveness of a document as and its satisfaction as , so that even on near-optimal policies, fulfilling a user’s information need sometimes requires more than one click.
- MixtureDBN::
-
This setting simulates platforms presenting results horizontally, where users may not inspect the document in order (Borisov et al., 2018). This mixture is composed of two DBN users: 70% of the time, the user inspects the results in the usual order from first to last rank, but 30% of the time, the user inspects the ranking in reverse order.
- Carousel::
-
This last user simulates settings in which documents are grouped in vertical rows or carousels (Rahdari et al., 2022). For this specific setting only, we use 25 documents per query instead of ten. The user chooses one of five carousels, according to a PBM, where the relevance of a carousel is taken to be the average relevance of the five documents that compose it. Then the user clicks on documents within the chosen carousels according to a DBN.
Next, we introduce the click models that we use, but we note that none fits the MixtureDBN and Carousel user behavior. We include these complex click behaviors to evaluate the usefulness of our metric under model mismatch.
5.2. Click model overview
We compare seven click models in our simulations; two are naive baselines using click statistics; five are prominent click models from the literature. In line with earlier studies, the models we compare do not input document features beyond the document’s id. Below, we only summarize the main idea for each approach. For details, we refer to (Deffayet et al., 2023), which we follow closely in our implementation.
5.2.1. Naive baselines
- DCTR::
-
The document CTR model uses the mean click-through-rate of a document as both click and relevance prediction. Since the CTR is averaged over all document positions, this model naively assumes that users examine all ranks equally.
- RDCTR::
-
The ranked document CTR model predicts the mean click-through-rate of a document at a given rank as click probability. We follow (Deffayet et al., 2023, Eq. 3) and estimate relevance as the sum of a document’s CTR at each rank, weighted by the inverse of the average CTR of all documents at the given rank.
In both methods, rarely examined documents can cause extreme click predictions, such as predicting a click probability of zero for a document that was never clicked. To mitigate predictions that lead to arbitrarily high perplexity values, we use the empirical Bayes method and initialize each prediction with Beta priors estimated on our training data as suggested in (Chapelle and Zhang, 2009).
| User model | Logging policy | Test policy | ind PPL | nDCG | CMIP | ind PPL, nDCG | CMIP, ind PPL | CMIP, nDCG | Joint |
|---|---|---|---|---|---|---|---|---|---|
| PBM | NoisyOracle | LambdaMART | 0.276 | 0.256 | 0.439 | 0.395 | 0.938▲ | 0.972▲ | 0.963▲ |
| Uniform | 0.277 | 0.346 | 0.725▲ | 0.304 | 0.966▲ | 0.969▲ | 0.970▲ | ||
| LambdaMART | NoisyOracle | 0.369▼ | 0.907 | 0.904 | 0.861 | 0.883 | 0.962▲ | 0.944▲ | |
| Uniform | 0.347▼ | 0.965▲ | 0.931 | 0.889 | 0.974▲ | 0.977▲ | 0.975▲ | ||
| DBN | NoisyOracle | LambdaMART | 0.235▼ | 0.978▲ | 0.517▼ | 0.693 | 0.787▲ | 0.977▲ | 0.897▲ |
| Uniform | 0.254▼ | 0.984▲ | 0.545▼ | 0.688 | 0.821▲ | 0.983▲ | 0.963▲ | ||
| LambdaMART | NoisyOracle | 0.941▼ | 0.997▲ | 0.997▲ | 0.974 | 0.970 | 0.997▲ | 0.983 | |
| Uniform | 0.958▼ | 0.999▲ | 0.999▲ | 0.983 | 0.982 | 0.999▲ | 0.982 | ||
| MixtureDBN | NoisyOracle | LambdaMART | 0.805▼ | 0.149▼ | 0.843 | 0.869 | 0.910▲ | 0.906▲ | 0.914▲ |
| Uniform | 0.618▼ | 0.266▼ | 0.859▲ | 0.767 | 0.884▲ | 0.909▲ | 0.880▲ | ||
| LambdaMART | NoisyOracle | 0.985 | 0.167▼ | 0.625▼ | 0.988 | 0.990 | 0.862▼ | 0.985 | |
| Uniform | 0.951▼ | 0.167▼ | 0.735▼ | 0.987 | 0.984 | 0.902▼ | 0.987 | ||
| Carousel | NoisyOracle | LambdaMART | 0.974 | 0.811▼ | 0.993▲ | 0.970 | 0.977 | 0.978 | 0.973 |
| Uniform | 0.954 | 0.941 | 0.994▲ | 0.947 | 0.968 | 0.995▲ | 0.942 | ||
| LambdaMART | NoisyOracle | 0.993 | 0.129▼ | 0.688▼ | 0.990 | 0.991 | 0.773▼ | 0.994 | |
| Uniform | 0.993 | 0.113▼ | 0.722▼ | 0.996 | 0.994 | 0.759▼ | 0.998 | ||
| Average | 0.683 | 0.574 | 0.782 | 0.831 | 0.939 | 0.933 | 0.959 | ||
5.2.2. Click models
We implement a PBM and a DBN click model matching the user behaviors introduced in Section 5.1.4. In addition, we implement three other models:
- UBM::
-
Extending the position-based model (PBM), the user browsing model assumes that examining an item depends in addition to its position also on the position of the latest clicked document (Dupret and Piwowarski, 2008).
- NCM::
-
The neural click model uses an RNN to iterate over the list of documents and predicts clicks at every step. While the model only predicts clicks and does not explicitly model relevance, Borisov et al. (2016) suggest to use the click probability of an item when placed on top of a ranking as its relevance.
- CACM::
-
We implement another RNN-based model iterating over rankings; instead of predicting clicks it predicts the user’s probability of examination at each rank. The resulting examination probability is multiplied with an estimated relevance probability to obtain the click prediction. The model is a variant of the context-aware click model introduced in (Chen et al., 2020) as proposed in (Deffayet et al., 2023, Eq. 14).
All models are implemented using PyTorch, and are trained by minimizing a binary cross-entropy loss between the predicted clicks and the observed clicks in the training dataset. Further implementation details are openly accessible in our code.666https://github.com/philipphager/sigir-cmip
5.3. Experiments
In our experiments, we evaluate whether CMIP helps to predict the performance of click models under covariate shift. Therefore, we first generate 5M training, 1M validation, and 1M test clicks on a strong baseline policy (LambdaMART or NoisyOracle). We use the training/validation sets to train models and the test set to compute the in-distribution perplexity (ind PPL). We simulate a covariate shift with a second test set of 1M clicks generated by a different policy, called test policy, and report the out-of-distribution perplexity (ood PPL). Lastly, we use the human-annotated relevance labels from the MSLR-WEB10K dataset to compute nDCG and CMIP.
6. Results
6.1. Evaluation with CMIP: A visual example
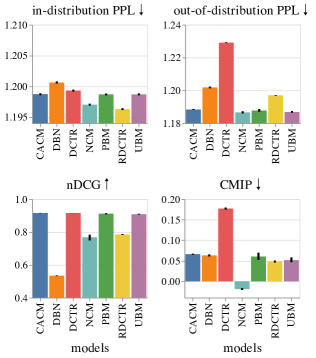
We introduce our experimental results by giving a visual intuition of CMIP. In Figure 2, we use a near-optimal logging policy (NoisyOracle) and generate clicks according to a PBM user model. We train seven click models and observe their in-distribution perplexity (ind PPL), nDCG, and our proposed metric CMIP, as well as the models’ performance under policy shift as measured by the out-of-distribution perplexity (ood PPL). We can see that neither ind PPL nor nDCG are sufficient to predict the downstream performance in ood PPL. E.g., the competitive nDCG score of the DCTR model fails to capture the model’s poor generalizability. On the contrary, CMIP correctly identifies this model as biased by assigning it a high value. Similarly, despite a low nDCG, NCM retains a good performance out-of-distribution as indicated by a low debiasedness score.
This visual example helps understand how CMIP can be generally useful to evaluate click models, but the results are dependent on the configuration used for training and evaluating the models. Below, we assess the predictive power of CMIP more systematically.
6.2. CMIP helps predict out-of-distribution perplexity
Next, we systematically evaluate whether adding CMIP to the existing metrics (ind PPL and nDCG) helps to predict the out-of-distribution perplexity of click models. To do so, we test click models in a total of 16 configurations, where the user model, logging policy, and test policy vary. Moreover, we evaluate each model configuration over ten independent runs of our click simulation.
To quantify how well ind PPL, nDCG, CMIP, and their combinations predict ood PPL, we use the metrics as input to a decision tree regressor predicting ood PPL. Since the metric ranges depend on the policy and user model, we train separate regressors for each of the 16 user/policy configurations and seven metric combinations. We report predictive performance using the adjusted score on 2-fold cross validation with a thousand repetitions. We test differences between each metric combination and the current evaluation protocol of jointly using nDCG and ind PPL using a two-tailed Welch’s t-test with a significance level of , accounting for multiple comparisons using the Bonferroni correction.
We report the results in Table 1. First, neither ind PPL, nDCG, nor CMIP are sufficient on their own to predict the ood PPL well, even though CMIP has a better mean predictive power than the other two metrics across all configurations. Second, using a combination of multiple metrics leads to better predictions of ood performance. However, we can observe that combining CMIP with any other of the two metrics leads to an average greater than which is not attainable just using ind PPL and nDCG. More importantly, by inspecting the performance across configurations, we see that metric combinations including CMIP are notably more consistent across different configurations, with their score rarely dropping below . This suggests that CMIP improves the safety and reliability of click model evaluation for deployments in downstream tasks. Lastly, the joint usage of all three metrics is either significantly better or on-par with the usage of nDCG and ind PPL. These trends are consistent when using linear regression and other regression metrics such as MSE. Our results strongly indicate that adding CMIP to click modeling benchmarks should lead to more reliable predictions of downstream performance, and therefore help practitioners to mitigate the risks of deploying policies based on click models.
| Policies | Average regret |
|---|---|
| PPL | |
| nDCG | |
| top-4 nDCG: PPL | |
| top-4 PPL: nDCG | |
| CMIP | |
| top-4 CMIP: PPL | |
| top-4 CMIP: nDCG | |
| top-4 CMIP, top-4 nDCG: PPL | |
| top-4 CMIP, top-4 PPL: nDCG |
6.3. Strategies based on CMIP incur lower regret in Off-Policy Selection Problems
Next, we use CMIP in an off-policy selection (OPS) problem where we have a set of candidate click models and need to decide which one to use for downstream applications. To quantify how CMIP helps practitioners select the best model, we design simple OPS strategies based on the three metrics and compare the amount of regret they incur, i.e., how much click prediction performance, measured by ood PPL, is lost by following a given strategy instead of selecting the optimal model. Every selection strategy is based on the maximization or minimization of a metric among the set of candidates. E.g., “nDCG” is the strategy that selects the model with the highest nDCG. In addition to the three basic strategies defined this way, we define conditional strategies: e.g., “top-4 CMIP: PPL” selects the model with the lowest perplexity among the four models with the lowest CMIP. The strategy “top-4 CMIP, top-4 PPL: nDCG” selects the model with the highest nDCG among the intersection of the four models with lowest CMIP and the four models with the lowest PPL. If this intersection is empty, the model with highest nDCG is selected.
Table 2 reports the average regret incurred by these strategies over the same configurations of user model, logging policy, and test policy as in Table 1. For better readability, we multiply the obtained regret in terms of difference in ood PPL by a factor . Also, the regret in OPS is very sensitive to the exact set of candidates in the comparison, so in order to obtain more robust results, we apply each strategy on all possible combinations of five, six, or seven models from our set of seven candidates and report the average regret over these combinations. We observe that most strategies based on CMIP outperform those without it, and that the lowest average regret is obtained by “top-4 CMIP, top-4 PPL: nDCG”, confirming that CMIP is useful in off-policy selection problems.
7. Conclusion
We propose conditional mutual information with the logging policy (CMIP), an evaluation metric for click modeling benchmarks in unbiased learning-to-rank. CMIP addresses the problem that existing metrics do not ensure that click models are robust to shifts in the ranking policy and therefore fail to predict their performance on downstream tasks. CMIP evaluates how relevance scores of trained models correlate with relevance scores of the logging policy beyond the true relevance signal, i.e., measuring how biased a new model is by the model that collected the training data.
Findings and broader impact. We gave visual interpretations of CMIP and its use for selecting best-performing click models. We quantified its usefulness in click modeling benchmarks by showing that it (i) improves the prediction of downstream performance when coupled with existing metrics, and (ii) lowers the regret incurred by off-policy selection strategies. The effectiveness of CMIP suggests that distributional approaches to offline evaluation, i.e., that consider the distribution of model outputs instead of individual predictions, may be useful to derive generalization properties.
Limitations and future work. First, CMIP uses pointwise relevance annotations, but pairwise or listwise annotations could also be used. Second, we have assumed that annotations are a perfect predictor of relevance. It remains unclear how to interpret nDCG and CMIP in case annotator disagreement and biases render annotations less reliable. Finally, click feedback collected on fully randomized rankings could replace the need for expert annotations; we leave an analysis of CMIP in that case for future work.
Acknowledgements.
We thank Onno Zoeter for insightful discussions and comments. This research was (partially) funded by the Hybrid Intelligence Center, a 10-year program funded by the Dutch Ministry of Education, Culture and Science through the Netherlands Organisation for Scientific Research, https://hybrid-intelligence-centre.nl. All content represents the opinion of the authors, which is not necessarily shared or endorsed by their respective employers and/or sponsors.References
- (1)
- Agarwal et al. (2019) Aman Agarwal, Xuanhui Wang, Cheng Li, Michael Bendersky, and Marc Najork. 2019. Addressing Trust Bias for Unbiased Learning-to-Rank. In The World Wide Web Conference (San Francisco, CA, USA) (WWW ’19). Association for Computing Machinery, New York, NY, USA, 4–14. https://doi.org/10.1145/3308558.3313697
- Ai et al. (2021) Qingyao Ai, Tao Yang, Huazheng Wang, and Jiaxin Mao. 2021. Unbiased Learning to Rank: Online or Offline? ACM Trans. Inf. Syst. 39, 2, Article 21 (feb 2021), 29 pages. https://doi.org/10.1145/3439861
- Borisov et al. (2016) Alexey Borisov, Ilya Markov, Maarten de Rijke, and Pavel Serdyukov. 2016. A Neural Click Model for Web Search. In Proceedings of the 25th International Conference on World Wide Web (Montréal, Québec, Canada) (WWW ’16). International World Wide Web Conferences Steering Committee, Republic and Canton of Geneva, CHE, 531–541. https://doi.org/10.1145/2872427.2883033
- Borisov et al. (2018) Alexey Borisov, Martijn Wardenaar, Ilya Markov, and Maarten de Rijke. 2018. A Click Sequence Model for Web Search. In The 41st International ACM SIGIR Conference on Research and Development in Information Retrieval (Ann Arbor, MI, USA) (SIGIR ’18). Association for Computing Machinery, New York, NY, USA, 45–54. https://doi.org/10.1145/3209978.3210004
- Bruch et al. (2020) Sebastian Bruch, Shuguang Han, Michael Bendersky, and Marc Najork. 2020. A Stochastic Treatment of Learning to Rank Scoring Functions. In Proceedings of the 13th International Conference on Web Search and Data Mining (Houston, TX, USA) (WSDM ’20). Association for Computing Machinery, New York, NY, USA, 61–69. https://doi.org/10.1145/3336191.3371844
- Burges (2010) Christopher J. C. Burges. 2010. From RankNet to LambdaRank to LambdaMART: An Overview. Technical Report. Microsoft Research. http://research.microsoft.com/en-us/um/people/cburges/tech_reports/MSR-TR-2010-82.pdf
- Chapelle and Chang (2011) Olivier Chapelle and Yi Chang. 2011. Yahoo! Learning to Rank Challenge Overview. In Proceedings of the Learning to Rank Challenge (Proceedings of Machine Learning Research, Vol. 14), Olivier Chapelle, Yi Chang, and Tie-Yan Liu (Eds.). PMLR, Haifa, Israel, 1–24. https://proceedings.mlr.press/v14/chapelle11a.html
- Chapelle et al. (2009) Olivier Chapelle, Donald Metlzer, Ya Zhang, and Pierre Grinspan. 2009. Expected Reciprocal Rank for Graded Relevance. In Proceedings of the 18th ACM Conference on Information and Knowledge Management (Hong Kong, China) (CIKM ’09). Association for Computing Machinery, New York, NY, USA, 621–630. https://doi.org/10.1145/1645953.1646033
- Chapelle and Zhang (2009) Olivier Chapelle and Ya Zhang. 2009. A Dynamic Bayesian Network Click Model for Web Search Ranking. In Proceedings of the 18th International Conference on World Wide Web (Madrid, Spain) (WWW ’09). ACM, New York, NY, USA, 1–10. https://doi.org/10.1145/1526709.1526711
- Chen et al. (2020) Jia Chen, Jiaxin Mao, Yiqun Liu, Min Zhang, and Shaoping Ma. 2020. A Context-Aware Click Model for Web Search. In Proceedings of the 13th International Conference on Web Search and Data Mining (Houston, TX, USA) (WSDM ’20). ACM, New York, NY, USA, 88–96. https://doi.org/10.1145/3336191.3371819
- Chen and Yan (2012) Ye Chen and Tak W. Yan. 2012. Position-Normalized Click Prediction in Search Advertising (KDD ’12). Association for Computing Machinery, New York, NY, USA, 795–803. https://doi.org/10.1145/2339530.2339654
- Chuklin et al. (2015) Aleksandr Chuklin, Ilya Markov, and Maarten de Rijke. 2015. Click Models for Web Search. Morgan & Claypool. https://doi.org/10.2200/S00654ED1V01Y201507ICR043
- Chuklin et al. (2013) Aleksandr Chuklin, Pavel Serdyukov, and Maarten de Rijke. 2013. Click Model-Based Information Retrieval Metrics. In Proceedings of the 36th International ACM SIGIR Conference on Research and Development in Information Retrieval (Dublin, Ireland) (SIGIR ’13). Association for Computing Machinery, New York, NY, USA, 493–502. https://doi.org/10.1145/2484028.2484071
- Craswell et al. (2008) Nick Craswell, Onno Zoeter, Michael Taylor, and Bill Ramsey. 2008. An Experimental Comparison of Click Position-Bias Models. In Proceedings of the 2008 International Conference on Web Search and Data Mining (Palo Alto, CA, USA) (WSDM ’08). ACM, New York, NY, USA, 87–94. https://doi.org/10.1145/1341531.1341545
- Dai et al. (2021) Xinyi Dai, Jianghao Lin, Weinan Zhang, Shuai Li, Weiwen Liu, Ruiming Tang, Xiuqiang He, Jianye Hao, Jun Wang, and Yong Yu. 2021. An Adversarial Imitation Click Model for Information Retrieval. In Proceedings of the Web Conference 2021 (Ljubljana, Slovenia) (WWW ’21). ACM, New York, NY, USA, 1809–1820. https://doi.org/10.1145/3442381.3449913
- Dawid (1979) Alexander Philip Dawid. 1979. Conditional Independence in Statistical Theory. Journal of the Royal Statistical Society: Series B (Methodological) 41, 1 (1979), 1–15. https://doi.org/10.1111/j.2517-6161.1979.tb01052.x
- Deffayet et al. (2023) Romain Deffayet, Jean-Michel Renders, and Maarten de Rijke. 2023. Evaluating the Robustness of Click Models to Policy Distributional Shift. ACM Trans. Inf. Syst. 41, 4, Article 84 (mar 2023), 28 pages. https://doi.org/10.1145/3569086
- Doran et al. (2014) Gary Doran, Krikamol Muandet, Kun Zhang, and Bernhard Schölkopf. 2014. A Permutation-Based Kernel Conditional Independence Test. In Proceedings of the Thirtieth Conference on Uncertainty in Artificial Intelligence (Quebec City, Quebec, Canada) (UAI’14). AUAI Press, Arlington, Virginia, USA, 132–141.
- Dupret and Piwowarski (2008) Georges E. Dupret and Benjamin Piwowarski. 2008. A User Browsing Model to Predict Search Engine Click Data from Past Observations.. In Proceedings of the 31st Annual International ACM SIGIR Conference on Research and Development in Information Retrieval (Singapore, Singapore) (SIGIR ’08). ACM, New York, NY, USA, 331–338. https://doi.org/10.1145/1390334.1390392
- Fukumizu et al. (2004) Kenji Fukumizu, Francis R. Bach, and Michael I. Jordan. 2004. Dimensionality Reduction for Supervised Learning with Reproducing Kernel Hilbert Spaces. J. Mach. Learn. Res. 5 (dec 2004), 73–99. https://dl.acm.org/doi/10.5555/1005332.1005335
- Grotov et al. (2015) Artem Grotov, Aleksandr Chuklin, Ilya Markov, Luka Stout, Finde Xumara, and Maarten de Rijke. 2015. A Comparative Study of Click Models for Web Search. In Proceedings of the 6th International Conference on Experimental IR Meets Multilinguality, Multimodality, and Interaction - Volume 9283 (Toulouse, France) (CLEF’15). Springer-Verlag, Berlin, Heidelberg, 78–90. https://doi.org/10.1007/978-3-319-24027-5_7
- Joachims et al. (2005) Thorsten Joachims, Laura Granka, Bing Pan, Helene Hembrooke, and Geri Gay. 2005. Accurately Interpreting Clickthrough Data as Implicit Feedback. In Proceedings of the 28th Annual International ACM SIGIR Conference on Research and Development in Information Retrieval (Salvador, Brazil) (SIGIR ’05). Association for Computing Machinery, New York, NY, USA, 154–161. https://doi.org/10.1145/1076034.1076063
- Joachims et al. (2017) Thorsten Joachims, Adith Swaminathan, and Tobias Schnabel. 2017. Unbiased Learning-to-Rank with Biased Feedback. In Proceedings of the Tenth ACM International Conference on Web Search and Data Mining (Cambridge, United Kingdom) (WSDM ’17). Association for Computing Machinery, New York, NY, USA, 781–789. https://doi.org/10.1145/3018661.3018699
- Koller and Friedman (2009) Daphne Koller and Nir Friedman. 2009. Probabilistic graphical models: principles and techniques. MIT press. https://mitpress.mit.edu/9780262013192/probabilistic-graphical-models/
- Koller and Sahami (1996) Daphne Koller and Mehran Sahami. 1996. Toward Optimal Feature Selection. In Proceedings of the Thirteenth International Conference on International Conference on Machine Learning (Bari, Italy) (ICML’96). Morgan Kaufmann Publishers Inc., San Francisco, CA, USA, 284–292. https://dl.acm.org/doi/10.5555/3091696.3091731
- Lin et al. (2021) Jianghao Lin, Weiwen Liu, Xinyi Dai, Weinan Zhang, Shuai Li, Ruiming Tang, Xiuqiang He, Jianye Hao, and Yong Yu. 2021. A Graph-Enhanced Click Model for Web Search. In Proceedings of the 44th International ACM SIGIR Conference on Research and Development in Information Retrieval (Virtual Event, Canada) (SIGIR ’21). Association for Computing Machinery, New York, NY, USA, 1259–1268. https://doi.org/10.1145/3404835.3462895
- Liu (2009) Tie-Yan Liu. 2009. Learning to Rank for Information Retrieval. Found. Trends Inf. Retr. 3, 3 (mar 2009), 225–331. https://doi.org/10.1561/1500000016
- Liu et al. (2016) Yiqun Liu, Xiaohui Xie, Chao Wang, Jian-Yun Nie, Min Zhang, and Shaoping Ma. 2016. Time-Aware Click Model. ACM Trans. Inf. Syst. 35, 3, Article 16 (dec 2016), 24 pages. https://doi.org/10.1145/2988230
- Lopez-Paz and Oquab (2017) David Lopez-Paz and Maxime Oquab. 2017. Revisiting Classifier Two-Sample Tests. In International Conference on Learning Representations. https://openreview.net/forum?id=SJkXfE5xx
- Luce (1959) Duncan Luce. 1959. Individual Choice Behavior: A Theoretical Analysis. Courier Corporation. https://psycnet.apa.org/record/1960-03588-000
- Margaritis (2005) Dimitris Margaritis. 2005. Distribution-Free Learning of Bayesian Network Structure in Continuous Domains. In Proceedings of the 20th National Conference on Artificial Intelligence - Volume 2 (Pittsburgh, Pennsylvania) (AAAI’05). AAAI Press, 825–830. https://dl.acm.org/doi/10.5555/1619410.1619465
- McMahan et al. (2013) H. Brendan McMahan, Gary Holt, D. Sculley, Michael Young, Dietmar Ebner, Julian Grady, Lan Nie, Todd Phillips, Eugene Davydov, Daniel Golovin, Sharat Chikkerur, Dan Liu, Martin Wattenberg, Arnar Mar Hrafnkelsson, Tom Boulos, and Jeremy Kubica. 2013. Ad Click Prediction: A View from the Trenches. In Proceedings of the 19th ACM SIGKDD International Conference on Knowledge Discovery and Data Mining (Chicago, Illinois, USA) (KDD ’13). Association for Computing Machinery, New York, NY, USA, 1222–1230. https://doi.org/10.1145/2487575.2488200
- Mukherjee et al. (2019) Sudipto Mukherjee, Himanshu Asnani, and Sreeram Kannan. 2019. CCMI : Classifier based Conditional Mutual Information Estimation. In Proceedings of the Thirty-Fifth Conference on Uncertainty in Artificial Intelligence, (UAI) (Proceedings of Machine Learning Research, Vol. 115). AUAI Press, 1083–1093. http://proceedings.mlr.press/v115/mukherjee20a.html
- Oosterhuis (2021) Harrie Oosterhuis. 2021. Computationally Efficient Optimization of Plackett-Luce Ranking Models for Relevance and Fairness. In Proceedings of the 44th International ACM SIGIR Conference on Research and Development in Information Retrieval. Association for Computing Machinery, New York, NY, USA, 1023–1032. https://doi.org/10.1145/3404835.3462830
- Oosterhuis (2022) Harrie Oosterhuis. 2022. Reaching the End of Unbiasedness: Uncovering Implicit Limitations of Click-Based Learning to Rank. In Proceedings of the 2022 ACM SIGIR International Conference on Theory of Information Retrieval (Madrid, Spain) (ICTIR ’22). Association for Computing Machinery, New York, NY, USA, 264–274. https://doi.org/10.1145/3539813.3545137
- Oosterhuis and de Rijke (2020a) Harrie Oosterhuis and Maarten de Rijke. 2020a. Policy-Aware Unbiased Learning to Rank for Top-k Rankings. Association for Computing Machinery, New York, NY, USA, 489–498. https://doi.org/10.1145/3397271.3401102
- Oosterhuis and de Rijke (2020b) Harrie Oosterhuis and Maarten de Rijke. 2020b. Taking the Counterfactual Online: Efficient and Unbiased Online Evaluation for Ranking. In Proceedings of the 2020 ACM SIGIR on International Conference on Theory of Information Retrieval (Virtual Event, Norway) (ICTIR ’20). Association for Computing Machinery, New York, NY, USA, 137–144. https://doi.org/10.1145/3409256.3409820
- Ovaisi et al. (2020) Zohreh Ovaisi, Ragib Ahsan, Yifan Zhang, Kathryn Vasilaky, and Elena Zheleva. 2020. Correcting for Selection Bias in Learning-to-Rank Systems. In Proceedings of The Web Conference 2020 (Taipei, Taiwan) (WWW ’20). Association for Computing Machinery, New York, NY, USA, 1863–1873. https://doi.org/10.1145/3366423.3380255
- Pearl (2009) Judea Pearl. 2009. Causality. Cambridge university press. https://doi.org/10.1017/CBO9780511803161
- Plackett (1975) Robin Plackett. 1975. The Analysis of Permutations. Journal of the Royal Statistical Society 24, 2 (1975). https://doi.org/10.2307/2346567
- Qin and Liu (2013) Tao Qin and Tie-Yan Liu. 2013. Introducing LETOR 4.0 Datasets. https://arxiv.org/abs/1306.2597
- Rahdari et al. (2022) Behnam Rahdari, Branislav Kveton, and Peter Brusilovsky. 2022. From Ranked Lists to Carousels: A Carousel Click Model. https://arxiv.org/abs/2209.13426
- Sen et al. (2017) Rajat Sen, Ananda Theertha Suresh, Karthikeyan Shanmugam, Alexandres G. Dimakis, and Sanjay Shakkettai. 2017. Model-Powered Conditional Independence Test. In Proceedings of the 31st International Conference on Neural Information Processing Systems (Long Beach, California, USA) (NIPS’17). Curran Associates Inc., Red Hook, NY, USA, 2955–2965. https://dl.acm.org/doi/10.5555/3294996.3295055
- Serdyukov et al. (2012) Pavel Serdyukov, Nick Craswell, and Georges Dupret. 2012. WSCD 2012: Workshop on Web Search Click Data 2012. In Proceedings of the Fifth ACM International Conference on Web Search and Data Mining (Seattle, Washington, USA) (WSDM ’12). ACM, New York, NY, USA, 771–772. https://doi.org/10.1145/2124295.2124396
- Shen et al. (2021) Zheyan Shen, Jiashuo Liu, Yue He, Xingxuan Zhang, Renzhe Xu, Han Yu, and Peng Cui. 2021. Towards Out-Of-Distribution Generalization: A Survey. https://doi.org/10.48550/ARXIV.2108.13624
- Slivkins (2019) Aleksandrs Slivkins. 2019. Introduction to multi-armed bandits. Foundations and Trends in Machine Learning 12, 1-2 (2019), 1–286. https://doi.org/10.1561/2200000068
- Su and White (2007) Liangjun Su and Halbert White. 2007. A consistent characteristic function-based test for conditional independence. Journal of Econometrics 141, 2 (2007), 807–834. https://doi.org/10.1016/j.jeconom.2006.11.006
- Vardasbi et al. (2020a) Ali Vardasbi, Maarten de Rijke, and Ilya Markov. 2020a. Cascade Model-Based Propensity Estimation for Counterfactual Learning to Rank. In Proceedings of the 43rd International ACM SIGIR Conference on Research and Development in Information Retrieval (Virtual Event, China) (SIGIR ’20). Association for Computing Machinery, New York, NY, USA, 2089–2092. https://doi.org/10.1145/3397271.3401299
- Vardasbi et al. (2020b) Ali Vardasbi, Harrie Oosterhuis, and Maarten de Rijke. 2020b. When Inverse Propensity Scoring Does Not Work: Affine Corrections for Unbiased Learning to Rank. In Proceedings of the 29th ACM International Conference on Information and Knowledge Management (Virtual Event, Ireland) (CIKM ’20). Association for Computing Machinery, New York, NY, USA, 1475–1484. https://doi.org/10.1145/3340531.3412031
- Zheng et al. (2019) Yukun Zheng, Jiaxin Mao, Yiqun Liu, Cheng Luo, Min Zhang, and Shaoping Ma. 2019. Constructing Click Model for Mobile Search with Viewport Time. ACM Trans. Inf. Syst. 37, 4 (sep 2019), 34 pages. https://doi.org/10.1145/3360486
- Zhu et al. (2010) Zeyuan Allen Zhu, Weizhu Chen, Tom Minka, Chenguang Zhu, and Zheng Chen. 2010. A Novel Click Model and Its Applications to Online Advertising. In Proceedings of the Third ACM International Conference on Web Search and Data Mining (New York, New York, USA) (WSDM ’10). Association for Computing Machinery, New York, NY, USA, 321–330. https://doi.org/10.1145/1718487.1718528
- Zhuang et al. (2021) Honglei Zhuang, Zhen Qin, Xuanhui Wang, Michael Bendersky, Xinyu Qian, Po Hu, and Dan Chary Chen. 2021. Cross-Positional Attention for Debiasing Clicks. In Proceedings of the Web Conference 2021 (Ljubljana, Slovenia) (WWW ’21). Association for Computing Machinery, New York, NY, USA, 788–797. https://doi.org/10.1145/3442381.3450098