Does Feedback from Supermassive Blackhole Co-evolve With Host In Type 2 Quasars?
Abstract
The feedback from accretion of central supermassive black holes (SMBHs) is a hot topic in the co-evolution of the SMBHs and their host galaxies. By tracing the large scale outflow by the line profile and bulk velocity shift of [O III], the evolutionary role of outflow is studied here on a large sample of 221 type 2 quasars (QSO2s) extracted from Reyes et al. By following our previous study on local Seyfert 2 galaxies, the current spectral analysis on the SDSS spectroscopic database enables us to arrive at following results: (1) by using the Lick indices, we confirm that QSO2s are on average associated with younger stellar populations than Seyfert galaxies; (2) QSO2s with a stronger outflow are tend to be associated with a younger stellar population, which implies a coevolution between the feedback from SMBH and the host in QSO2s; (3) although an occupation at the high end, the QSO2s follow the - sequence established from local, less-luminous Seyfert galaxies, which suggests a decrease of accretion activity of SMBH and feedback as the circumnuclear stellar population continuously ages.
1 Introduction
There is accumulating evidence supporting a fact that feedback process from supermassive black holes (SMBHs) plays an important role in the conception of co-evolution of growth of SMBHs and their host galaxies where the SMBHs reside in (see reviews in Heckman et al., 2004; Alexander & Hickox, 2012; Fabian, A. C., 2012). In both secular and merger evolutionary scenarios proposed in past decades (e.g., Sanders et al., 1988; Di Matteo et al., 2008; Hopkins et al., 2008; Hopkins & Hernquist, 2009; Draper & Ballantyne, 2012; Shankar et al., 2012; Hopkins et al., 2013; Heckman & Best, 2014), the feedback is generally required in not only semianalytic models but also in numerical simulations to self-regulate growth of SMBH and star formation occuring in the host galaxy by either suppressing star formation through sweeping out circumnuclear gas or triggering star formation by compressing the gas (e.g., Alexander & Hickox, 2012; Page et al., 2012; Kormendy & Ho, 2013; Zubovas et al., 2013; Ishibashi & Fabian, 2014; Cresci et al., 2015; Carniani et al., 2016; Villar et al., 2016; Woo et al., 2017; Cresci & Maiolino, 2018; Perna et al., 2020; Scholtz et al., 2021; Shin et al., 2021); In fact, the models with feedback can reproduce the firmly established relation, luminosity functions of both quasars and normal galaxies (e.g., Haehnelt et al., 1998; Silk & Rees, 1998; Fabian, 1999; Kauffmann & Haehnelt, 2000; Granato et al., 2004; Springel et al., 2005; Croton et al., 2006; Di Matteo et al., 2007; Hopkins et al., 2008; Khalatyan et al., 2008; Menci et al., 2008; Somerville et al., 2008). Furthermore, the “over cooling” problem in the cold dark matter (CDM) galaxy formation model can be solved by an additional heating contributed by the feedback from SMBHs (e.g., Ciotti & Ostriker, 2007; Somerville et al., 2008; Hirschmann et al., 2014).
On the observational ground, the feedback is usually traced by the frequently observed outflows from central SMBHs to study not only its origin but also its effect on host galaxies (see reviews in Veilleux & Rupke, 2005; Fabian, A. C., 2012). Among the different diagnosis of the outflows, the mostly used is the blue asymmetry of the prominent [O III]4959, 5007 doublet and its bulk blueshift with respect to the local system, which is found to be quite prevalent in both local and distant active galactic nuclei (AGNs,e.g., Heckman et al., 1981; Véron-Cetty et al., 2001; Zamanov et al., 2002; Marziani et al., 2003; Aoki et al., 2005; Boroson, 2005; Komossa et al., 2008; Xu & Komossa, 2009; Villar-Martín et al., 2011; Liu et al., 2013; Mullaney et al., 2013; Zhang et al., 2013; Harrison et al., 2014; Villar Martín et al., 2014; Karouzos et al., 2016; Wang et al., 2016, 2018).
Using the line profile of the [O III] line emission, Wang et al. (2011) performed a comprehensive study on a large sample of local obscured AGNs, which is extracted from MPA/JHU value-added catalog (e.g., Kauffmann et al., 2003) based on the Sloan Digital Sky Survey (e.g., York et al., 2000), to explore the relation between outflows and properties of the host galaxies, according to the widely accepted AGN’s unification model (e.g., Antonucci, 1993) in which the central AGN’s continuum and emission from the broad-line region (BLR) are obscured by the torus. The authors proposed a trend that the local Seyfert 2 galaxies with stronger blue asymmetries tend to be associated with not only younger stellar populations, but also higher AGN Eddington ratio (, where is the Eddington luminosity). This result is further confirmed in Wang (2015) for a sample of nearby partially obscured AGNs.
A question is therefore naturally arisen: is the dependence of strength of outflow on both stellar population ages and revealed in local Seyfert galaxies still valid for their either high luminosity or high redshift cousin? This question is motivated from two facts. On the one hand, there is ample evidence supporting that the growth of small SMBHs in low luminosity AGNs (e.g., Seyfert galaxies) is dominantly through a secular evolution in which the gas inflow towards a central SMBH is mainly caused by an instability or viscous of the gas (e.g., Heckman & Best, 2014; Wang et al., 2016, 2019, and references therein) . On the contrary, a gas-rich major merger is preferred for the luminous quasars with a large SMBH as implied by the studies of the host galaxies of quasars and ultra-luminous infrared galaxies (ULIRGs, e.g., Sander & Friedl, 1988; Bahcall et al., 1997; Kirhakos et al., 1999; Hao et al., 2005; Hou et al., 2011). On the other hand, the cosmic co-evolution of SHBM growth and star formation implies that the feedback from AGNs is strong in early universe when the peaks of both AGN activity and star formation occur roughly coincident (e.g., Hou et al., 2011; Ishibashi et al., 2013; Harrison, 2017) .
In this paper, we try to answer the aforementioned question by extending the study in Wang et al. (2011) to type 2 quasars (QSO2s), the high luminosity counterparts of the local Seyfert 2 galaxies. In fact, previous studies through different methods indicate that the outflow phenomenon is quite popular in QSO2s (e.g., Villar-Martín et al., 2011; Liu et al., 2013; Villar Martín et al., 2014; Karouzos et al., 2016; Sánchez Almeida et al., 2017). The scale of the violent outflow in QSOs ranges from a few pc () to kpc () (e.g., Pounds et al., 2003; Harrison et al., 2016; Förster Schreiber et al., 2019; Kakkad et al., 2020). An outflow with an extension of 13pc from the center SMBH has been identified for the ionized gas in the obscured AGN XID 2028 at (Carniani et al., 2016), which is recently confirmed by the Early Release Science JWST NIRSpec observations (e.g., Cresci et al., 2023). Compared with the VLA 3 GHz map, the authors argue that the extended outflow in the object is likely related with the low-luminosity radio jet.
The outline of this paper is as follows. The sample selection and spectral analysis are described in Sections 2 and 3, respectively. Section 4 shows the statistical results. A discussion is presented in Section 5. A CDM cosmology with parameters , , and (Spergel et al., 2003) is used throughout the paper.
2 Sample selection
A couple of QSO2s samples have been published in past decades (e.g., Zakamska et al., 2003; Reyes et al., 2008; Yuan et al., 2016), thanks to the SDSS survey. We start from the QSO2s sample provided by Reyes et al. (2008), simply because Kong & Ho (2018) performed a comprehensive study on their black hole mass and by adopting the narrow emission lines, such as [O III] as an indicator.
The used QSO2s catalog contains in total 887 objects with redshift , whose [O III] line luminosity ranges from to . They are selected from the seventh data release of SDSS (Abazajian et al., 2009) by following the four main selection rules (please see selection details in Zakamska et al. 2003; Reyes et al. 2008):
-
1.
In order to retain objects with weak continuum and strong narrow [O III]5007 emission lines, its rest-frame equivalent width is greater than 4 and the corresponding signal-to-noise ratio () is over the entire spectroscopic range of 3800-9200 Å.
-
2.
For objects with , H+[O III]4959,5007, H+[N II] 6548,6583 and [S II]6716, 6731 lines are required to be available. AGNs are distinguished from star-forming galaxies by using the line ratio diagnostic criteria presented by Kewley et al. (2001), i.e., , and .
-
3.
For objects with redshift , the H line is required to either be undetected or have a line ratio of if the flux of the H line is available with .
-
4.
Moreover, for objects with , the FWHM of Mg II2800 emission line is required to be less than 2000 if the line is above the noise level.
The SDSS spectra of the 887 QSO2s candidates were then checked visually one-by-one by us. More than 40 objects with unambiguous double-peaked line profile were excluded to avoid unreliable [O III] emission-line profile measurements. The double-peaked profiles may be caused by galaxy mergers, disk rotation in large scale, or bipolar outflows (e.g., Liu et al. 2010; Ge et al. 2012). Objects with either [O III] line S/N less than 10 or incomplete line profile were additionally removed. Finally, there are 772 QSO2s for subsequent spectral analysis.
3 Spectral Analysis
For each of the objects listed in the sample, the SDSS spectrum is at first corrected for Galactic extinction by using the extinction curve of Cardelli et al. (1989) and the extinction value adopted from Schlafly & Finkbeiner (2011). The redshift provided by the SDSS pipelines is then used to transform the observed spectrum to the rest-frame.
3.1 Continuum and Stellar Subtraction
Before the [O III] emission line measurements, the underlying stellar component including stellar continuum and stellar absorption features must be carefully substracted. This substraction was carried out by the publicly automatic procedure of the penalized pixel-fitting (pPXF) (Cappellari & Emsellem, 2004; Cappellari, 2017) method. We refer the readers to Kong & Ho (2018) for the details of the stellar component subtraction for this sample and stress here some key issues as follows:
-
1.
The spectral fitting region covers 4100–5400 Å including H, [O III] emission line.
-
2.
The Indo-U.S. stellar spectral library (Valdes et al., 2004) is adapted for fitting the continuum of the host galaxies. The stellar spectral library has a spectral resolution of FWHM = 1.35Å and with a wavelength range 3460–9464 Å.
-
3.
The IDL package mpfit (Markwardt, 2009) is used to determine the best fitted parameters through a minimization in which the nonlinear Levenberg-Marquardt algorithm is adopted.
-
4.
In addition to the strong emission lines (such as He II , H, and [O III] , 5007), the H , [O III] , [O II], [Ne III] and Mg I , 5173, 5184 triplets are excluded from the the fitting. The Mg I triplets were also masked because of their potential systematic effects caused by [Mg/Fe] enhancement.
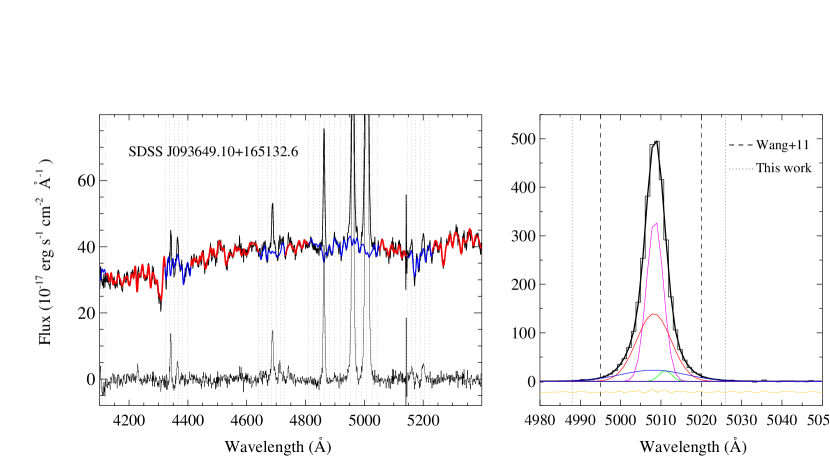
An example of continuum and stellar fitting can be seen from the left panel in Figure 1.
3.2 Measurements of emission-line profile parameters
After the continuum and absorption stellar components are subtracted from each spectrum, a set of shape parameters are measured for the [O III]line profile in this section111 As illustrated in Figure 2, the continuum removal is necessary before an emission-line analysis in type-II AGNs, because the measured [O III] line profile asymmetry strongly depends on the behavior of line wing and the determined continuum level, which can be distorted heavily by the absorption features of the starlight component..
3.2.1 Line profile fitting
Many ways are used to parameterize emission-line profile. Parameters included the FWHM and the second moment of the line are commonly used. The second moment is defined to be
| (1) |
where is the flux density of the continuum-subtracted spectrum, is the line centroid and is defined as . Both two parameters comparably describe the line broadening for a pure Gaussian profile, i.e., . As described in Greene & Ho (2005), is more sensitive to the line wings and becomes relatively broader, which indicates that contains more information on the line profile broadening if the profile is not a pure Gaussian profile. In fact, in addition to as presented in Binney & Merrifield (1998), and , which is the high-order dimensionless line shape parameters, can be used to parameterize line profile deviation from a pure Gaussian profile.
is defined as
| (2) |
where is the second-moment defined above, and the -order moment defined below
| (3) |
, the so-called “skewness”, measures a deviation from a symmetric profile. corresponds to a symmetry profile. Meanwhile, denotes a red asymmetry, and a blue asymmetry.
, the so-called “kurtosis”, measures a symmetric deviation from a pure Gaussian profile with . corresponds to an peaked emission line profile superposed on a broad base, and to a emission line profile like a “boxy” shape. We refer the readers to Figure 11.5 in Binney & Merrifield (1998) for how the line shapes change with the values of and in details.
The [O III] blue wings are found to overlap with the [O III] lines in some objects with strong outflows. In order to avoid a distortion due to this overlapping, we first fit each [O III] doublet with a linear combination of a set of Gaussian components, in which the doublets have the same width and fixed line flux ratio of the theoretical value of 1:3. An example of the profile modeling is shown in the right panel of Figure 2. The [O III] 5007 line profile parameters are then measured from the modeled line profile. The wavelength range over which the line profile parameters are measured should be carefully choiced. The wavelength range of 4995-5020ÅÅ was used for measuring and for Seyfert 2 galaxies sample in Wang et al. (2011). However, this wavelength range can not cover most of the [O III] profiles well for the type 2 quasar (QSO2s) sample, because their [O III] line profiles usually have relatively broader line wings. We therefore instead measure their parameters within the wavelength range where the line flux level is 2 times of the continuum fluctuation that is assessed in the wavelength range free of strong emission or absorption lines, i.e., between 4400–4600ÅÅ. In Section 3.2.5, we discuss the wavelength range effect on the parameters measurements.
3.2.2 Instrumental resolution
The observed is resulted from a convolution of the true line profile and the instrumental profile. By assuming the profiles can be described as a pure Gaussian function, the intrinsic line width can be estimated approximately by , where and are the observed line width and the instrumental resolution, respectively. However, as stated in the Appendix of Wang et al. (2011), the correction of the instrumental resolution is not a easy task for a non-Gaussian line profile, where the correction depends on the amount of deviation from a pure Gaussian profile. In their work, only the [O III] line width greater than were kept for subsequent analysis. By following this sample selection rule, there are only six objects with , and 767 objects are left.
3.2.3 [O III] line relative velocity shifts
Given the measured line centroids , we measure the bulk velocity shift of [O III] emission line in each stellar-subtracted emission-line spectrum, where is the [O III] line wavelength shift relative to the galaxy rest frame determined from the absorption features of the host galaxy, the wavelength of the [O III] emission line in the rest frame, and the light velocity. A positive value of denotes a red bulk velocity shift, and a negative one a blue shift.
3.2.4 and
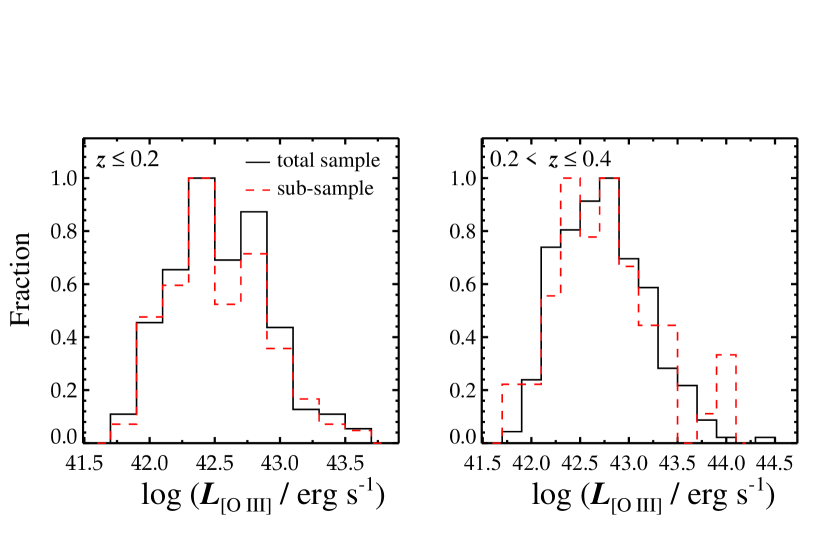
The two Lick indices of (the 4000Å break) and (the equivalent width of the H absorption feature of A-type stars) are good age indicators of the stellar populations of galaxies (e.g., Bruzual A., 1983; Worthey & Ottaviani, 1997; Balogh et al., 1999). The 4000Å break is defined as . The index H is defined as , where is the flux within the feature bandpass of , and is the flux of the pseudo-continuum assessed from the two beside regions: blue and red . In order to avoid distortion by unreliable values, the is measured for only 221 objects with not only a continuum median S/N, but also obvious stellar features, such as absorption lines of Ca II H,K ,3968, after an one-by-one visual inspection. For each of the 221 objects, we measure both and from the modeled starlight component, rather than the original spectrum, which suggests that the contamination caused by the [Ne III] emission line is negligible for the resulted . In addition, the adopted continuum S/N requirement leads to a bias against QSO2s at a high redshift. The redshifts of the 221 objects with measured actually range from 0.05 to 0.35, which shows overlaps with a fraction of the Seyfert galaxies with high redshifts (see Section 4.4 and Figure 8 for the details). The distributions of the [O III] line luminosity of the 221 QSO2s are shown and compared with those of the total sample in two redshift bins in Figure 2.
3.2.5 Wavelength range effect on the and
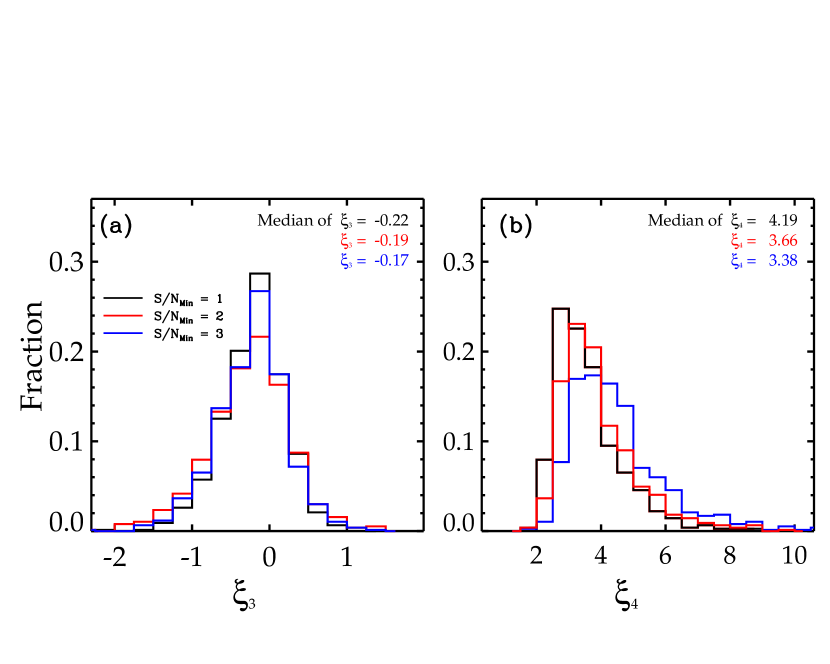
Before subsequent statistical study, we first study the systematic of and due to different wavelength ranges where the two parameters are assessed. Based on the continuum flux fluctuation estimated between 4400–4600 Å, both parameters are measured in three different wavelength ranges in which the specific line flux is above a base at different significance levels , 2, 3, where is defined as the ratio between the level of the base and the continuum flux fluctuation.
We argue that the systematics on due to the adopted wavelength range is negligible, although it is not true for . Figure 3 compares the distributions of and measured within different wavelength ranges (or ). The corresponding median values are compared in Column (2) in Table 1. Columns (3)-(4) tabulate the matrix of two-sided Kolmogorov–Smirnov (K-S) tests, in which each entry denotes the maximum distance between the two distributions, along with the corresponding probability that the two distributions come from the same parent sample shown in the bracket. The tests show that there is no significant difference between the three distributions, although larger the wavelength range used, slightly higher the median of will be. However, with the increasing wavelength range, the distributions of clearly become wide, along with an increasing median value. The same tests yield a probability that the distributions are from the same parent sample as low as .
As an additional test, we measure both and by extending the wavelength range to 4000 (about 60 Å), which is twice the critical value that distinguishes the broad and narrow emission lines of AGNs. By comparing the values obtained with , the change of the median is less than 1%, but the median of changes from 4.19 to 5.08. This test again verifies the above statement that the adopted wavelength range has small (large) effect on measurements of ().
| Median | 1 | 2 | 3 | |
|---|---|---|---|---|
| (1) | (2) | (3) | (4) | (5) |
| 1 | ||||
| 2 | 0.051 (0.267) | |||
| 3 | 0.092 (0.003) | 0.052 (0.241) | ||
| 1 | ||||
| 2 | 0.21 () | |||
| 3 | 0.32 () | 0.14 () | ||
Finally, without further statement, the values of both and measured under the condition of are adopted for subsequent statistical studies, taking into account of a comparison with our previous studies in Wang et al. (2011) that was based on the observed spectra rather than the modeled line spectral profile.
4 Results
The measured parameters of the QSO2s are compared with our previous studies on Seyfert 2 galaxies in this section.
4.1 Statistic of line Shape Parameters and
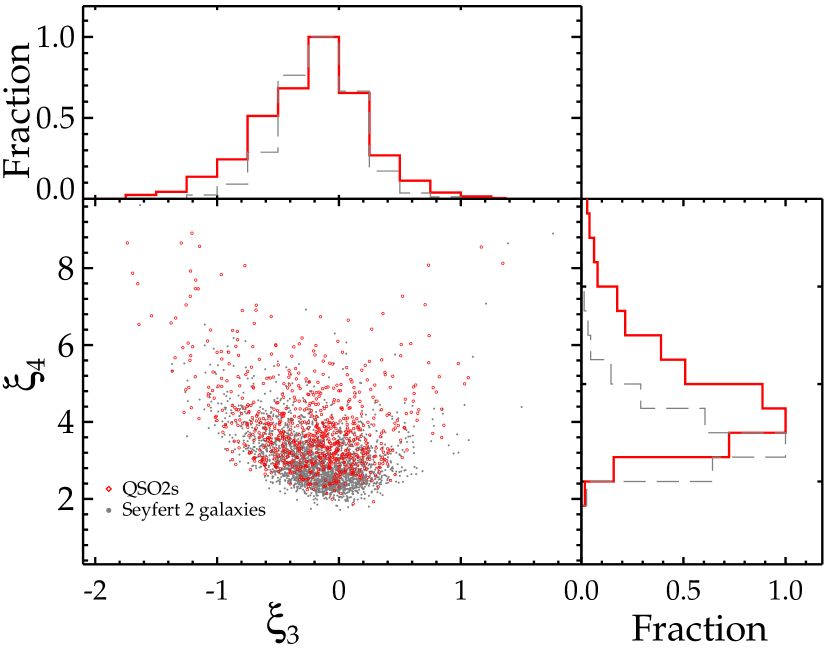
The occupations in the versus diagram are compared between QSO2s and Seyfert 2 galaxies in Figure 4.
The main panel in the figure shows that both QSO2s and Seyfert 2 galaxies form a sequence starting from the pure Gaussian region (i.e., and ) to the upper left corner. Larger the blue asymmetry of the [O III] line profile, more peaked profile will be identified, which is consistent with the fact that two or more Gaussian components are usually required to properly reproduce both narrow core and blue wing of the observed [O III] line profiles.
The distributions of and are presented in the upper and right sub-panels in Figure 4, respectively. Compared to the Seyfert 2 galaxies, the QSO2s tend to have stronger [O III] blue asymmetry. The median value of is for the QSO2s, and for the Seyfert 2 galaxies. A two-sided K-S test yields a difference between the two distributions at a significance level of with a maximum absolute discrepancy of 0.16. A significant difference can be found for the distributions, in which the median value of is for the QSO2s, and for the Seyfert 2 galaxies. Again, the same K-S test yields a difference at a significance level of with a maximum absolute discrepancy of 0.39. In fact, this significant discrepancy is not hard to be understood according to the fact that QSO2s typically have stronger [O III] emission (mostly contributed by the narrow line core) than local Seyfert 2 galaxies. The large also indicates that QSO2s have stronger [O III] wings than the Seyfert 2 galaxies.
4.2 Dependence of line profile on stellar population
The evolution of the [O III] line profile is examined in this section by using the two Lick indices and , which are widely used as age indicators of the circumnuclear stellar populations.
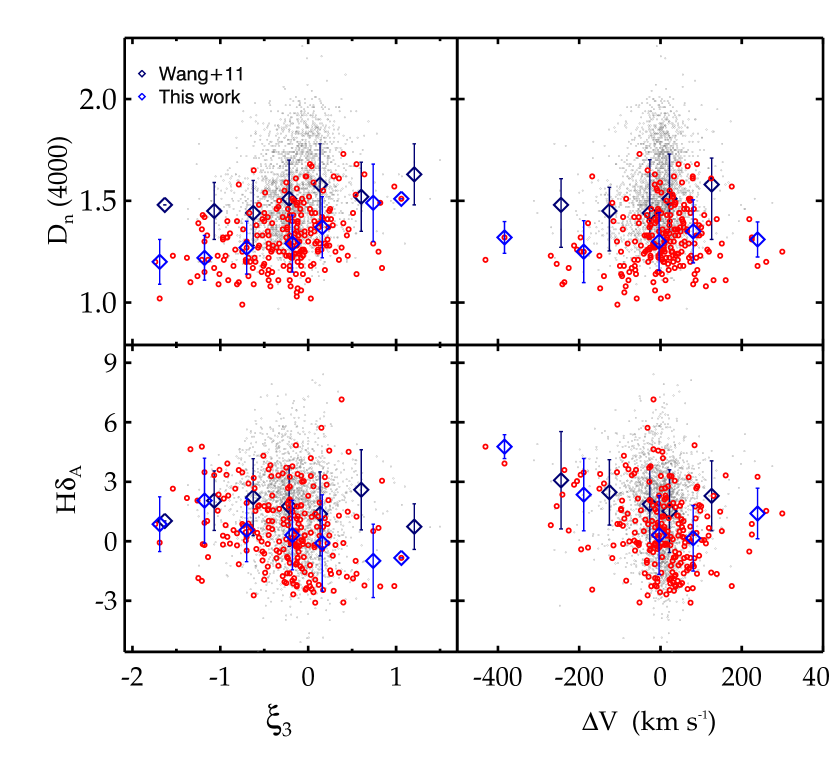
Both lick indices are plotted against the and [O III] line relative velocity shifts in Figure 5 for both QSO2s and Seyfert 2 galaxies222It is noted that the values of in Wang et al. (2011) are calculated according to the narrow H line for the Seyfert galaxies.. One can see from the figure that, compared to the Seyfert 2 galaxies, the QSO2s are biased towards the small end. For the QSO2s sample, about 90% of the is less than 1.5, and there is almost no above 1.8. However, a large range extending to 2.0 can be found for the of the Seyfert 2 galaxies. The fact that increases with stellar population age therefore suggests a young stellar population in QSO2s. In fact, = 1.5 is usually used to distinguish young stellar populations from old ones (Kauffmann et al., 2003). Based on the Spearman rank-order test, the corresponding correlation coefficients are tabulated in Table 3. For each entry, the value in the bracket is the probability that the two variables are not correlated. In addition to , as shown in the figure, the bias against old stellar population in QSO2s can also be learned from the lower two panels in which the index is used.
| Property | ||
|---|---|---|
| (1) | (2) | |
| Sample: QSO2s | ||
| Sample: QSO2s+Seyfert 2s | ||
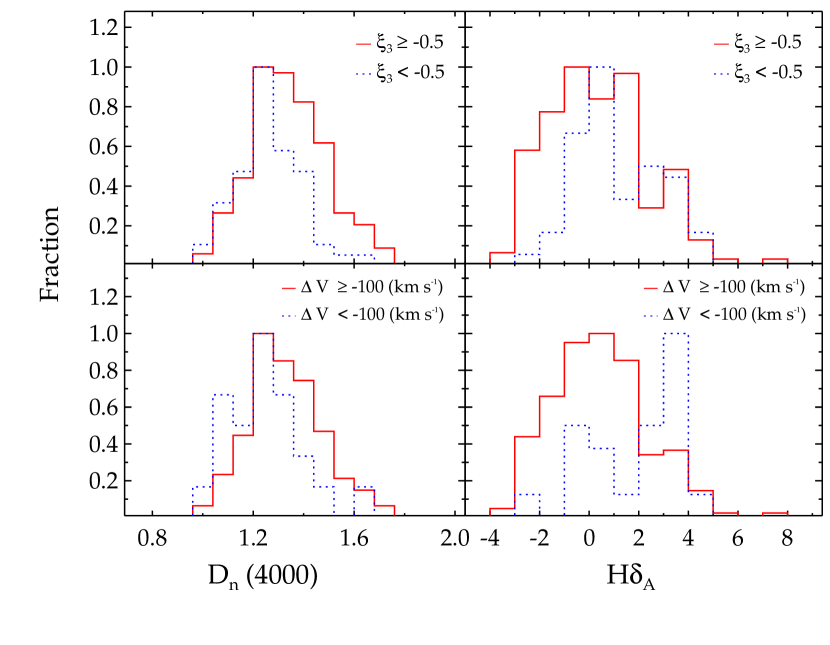
To examine the dependence of [O III] line profile on stellar population, we divide the QSO2s into two groups, according to their values: one group has and the other has , by following the method used in Wang et al. (2011). The corresponding distributions of and are compared between the two groups in the two upper panels in Figure 6, respectively. These plots show that, similar as in the Seyfert 2 galaxies, the QSO2s with relatively stronger blue asymmetry of the [O III] line profile tend to be associated with younger stellar populations assessed by the smaller and larger . A similar result can be learned for from the two lower panels, in which the QSO2s with larger bulk blue velocity shifts tend to have younger stellar populations. The difference between the two distributions shown in each panel of Figure 6 is examined by the two-sided K-S tests. The calculated maximum distance between the two distributions (see Figure 6 for the details) are tabulated in Table 3. The values in the brackets are the corresponding significance level at which the two distributions come from the same parent sample.
| Property | ||
|---|---|---|
| (1) | (2) | |
4.3 Role of Eddington ratio
The Eddington ratio is an important physical parameter driving the AGN’s activity. Nelson et al. (2004) showed a correlation between the [O III] line blue asymmetry and Eigenvector-I space in the PG quasars. Shen & Ho (2014) confirmed that is the main physical driver of the Eigenvector-I space of AGNs. Wang et al. (2011) indicated that stronger blue asymmetry is not only correlated with younger stellar populations but also with higher for a sample of nearby Seyfert 2 galaxies. This trend was then confirmed by a sample of nearby partially obscured AGNs.
4.3.1 Estimation of
In order to estimate of the QSO2s, the bolometric luminosity is transformed from the intrinsic extinction-corrected [O III]5007 line luminosity through the bolometric correction (Heckman et al., 2004), which is consistent with that used in Wang et al. (2011). The extinction-corrected is obtained from Kong & Ho (2018), in which the extinction was estimated from the observed Balmer decrement in the standard case B recombination (Halpern & Steiner, 1983) and the extinction cure of Cardelli et al. (1989) with . A median value of is adopted for the objects without a measured Balmer decrement.
The black hole mass of each object is estimated from the well-documented relationship: (Tremaine et al., 2002), in which the stellar velocity dispersion of bulge is replaced by the width of the core of the [O III] line. As presented in Kong & Ho (2018), the width of the core of the [O III] line can trace the stellar velocity dispersion well for QSO2s. In addition, a heavy blend between stellar absorption features and AGN’s emission lines, such as an overlap of Ca II H,K [N III] and lines, leads to a large uncertainty of the measured .
4.3.2 Statistics
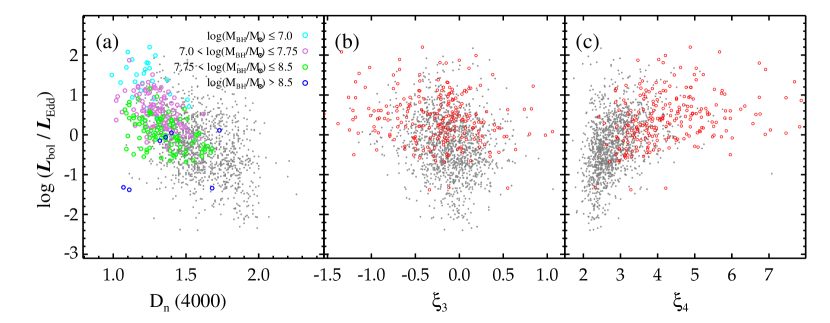
Figure 7 plots as a function of , and from left to right for both QSO2s and Seyfert 2 galaxies sample. One can see from the left panel that the QSO2s with younger stellar population and higher closely follow the anti-correlation between and that was previously well established in local AGNs (e.g., Kewley et al., 2006; Wang et al., 2011; Mullaney et al., 2013), which suggests a decrease of as the circumnuclear stellar population continuously ages. A Spearman rank-order test yields a correlation coefficient of with for the QSO2s. The correlation coefficient is enhanced to be with when the QSO2s and Seyfert 2 galaxies samples are combined.
Could the anti-correlation be understood by an underlying driver due to the mass of the host galaxies (or SMBHs)? For example, Stanley et al. (2017) indicates that the enhanced star formation rate in luminous QSOs is resulted from a fact that luminous QSOs tend to occur in massive galaxies. To test this alternative, we separate the QSO2s into four groups according to their SMBH masses that are believed to be related with the mass of the bugle of the host galaxies, and show the four groups in the panel (a) of Figure 7 by different colors. It is clearly that the sequence is still valid for the QSO2s with comparable SMBH masses, although there is a dependence of the sequence on the SMBH masses.
The relationships between and the [O III] emission line profile parameters and are examined in the middle and right panels of Figure 7, respectively. Again, the corresponding Spearman rank-order test results are listed in Table 3. Thanks to their high luminosity, an including of the QSO2s therefore reinforces our previous claim that high is necessary for both strong blue asymmetry and strong broad component of the [O III] emission line. In fact, Zhang (2021) recently analyzed the properties of line wing of [O III] emission line of 535 type I quasars by using SDSS optical spectral data, and pointed out a dependence of the line wing on the .
Similar as in Wang et al. (2011), correlation between and is found neither in the QSO2s sample or a merged sample containing both QSO2s and Seyfert 2 galaxies.
5 Discussion
5.1 The young stellar population associated with the QSO2s
We argue that the young stellar populations identified in the QSO2s by the Lick index is hard to be explained by a contamination caused by a underlying AGN’s continuum. On the one hand, a two-order polynomial, which accounts for a AGN’s continuum and an intrinsic extinction, has been involved in our modeling of the continuum of the QSO2s in the pPXF package. On the other hand, even without an inclusion of the contribution of the AGN’s continuum, although a comparison study in Wang (2015) shows that ignoring the AGN’s continuum will cause a little underestimation of the measured value, the level of the underestimation has no evident effect on the fact that QSO2s are typically associated with a young stellar population.
We argue that the fact that the QSO2s are associated with a younger stellar population than the Seyfert galaxies is not due to the aperture effect caused by the fixed 3″ fiber width adopted by the SDSS. The measured is plotted as a function of in Figure 8 for a comparison between the QSO2s and the Seyfert 2 galaxies. At first, the QSO2s and Seyfert galaxies overlap with each other within a redshift range from 0.05 to 0.15. In this common redshift range, the median values of within each redshift bin of 0.05 reinforce the conclusion that QSO2s are generally associated with younger stellar populations than Seyfert galaxies do. Secondly, the stellar population age of the bulge of the high-redshift QSO2s is expected to be likely overestimated due to the fixed aperture size, because of the radial color gradient of galaxies, which is partially resulted from stellar population age (e.g., Liao & Cooper, 2023, and references therein).
Finally, although being not as strong as in the Seyfert galaxies, the value of sightly decreases with redshift for the QSO2s, which is likely due to a cosmic evolution effect. It seems that the slight decrease of with redshift could not be only explained by a selection effect on luminosity, in which high-z QSO2s tend to be more luminous and be associated with younger stellar populations. The comparisons in Figure 2, in fact, show that distributions of [O III] line luminosity have no clear difference between the 221 QSO2s and the parent sample in both redshift bins.

The young stellar populations in QSO2s have been frequently claimed in previous studies, which implies a quasi-simultaneously triggered central AGN’s activity and circumnuclear starburst (e.g., Heckman, 1997; Canalizo & Stockton, 2000, 2001; Brotherton et al., 2002; Holt et al., 2007; Wills et al., 2008; Liu et al., 2009; Tadhunter et al., 2011; Villar-Martín et al., 2012; Bessiere et al., 2014, 2017). For instance, by fitting the spectra of 21 QSO2s through the galaxy stellar populations analysis method, Bessiere et al. (2017) shows that 71% of the QSO2s in the sample contain young stellar populations with the age less than the maximum lifetime of 100 Myr (see also in Bessiere et al., 2014) expected for an AGN (Martini & Weinberg, 2001). By an identification of the UV absorption features such as Si III1417 caused by late O and early B supergiants, a young stellar population with an age of 6 Myr has been revealed in the nearby QSO2s Mrk 447 (Heckman, 1997). In addition, young stellar populations with Gyr are frequently or dominantly found in the quasar-like luminous objects with (e.g., Canalizo & Stockton, 2000; Holt et al., 2007; Wills et al., 2008; Tadhunter et al., 2011).
5.2 -driven feedback
Our study shows that the outflow from central SMBH in QSO2s as traced by the [O III] line profile (i.e., and ) generally increases with the (see panels b and c in Figure 7), which suggests a -driven feedback and is consistent with not only the observational studies in the past decade, but also the model predictions. On the observational ground, there were plentiful studies focusing on the relation between the outflow kinematics and the accretion activity of central SMBH in past decade for not only Seyfert galaxies, but also their luminous cousin, quasars. Briefly speaking, the outflow strength is found to increase with SMBH’s accretion activity assessed by multiple ways, including bolometric luminosity , [O III] line luminosity, intrinsic hard X-ray luminosity, , and radio power (e.g., Greene & Ho, 2005; Mullaney et al., 2013; Bae & Woo, 2014; Harrison et al., 2014; Zakamska & Greene, 2014; Woo et al., 2016; Wang et al., 2016; Kong & Ho, 2018; Wang et al., 2018; Davies et al., 2020). In addition, as shown in Figure 7, the QSO2s show stronger feedback than the Seyfert galaxies due to their higher .
On the theoretical ground, the observed outflow is believed to be resulted from the wind/radiation pressure launched from the inner accretion disk in the wind/radiation model (e.g., Murray & Chiang, 1995; Proga et al., 2000; Crenshaw et al., 2003; King & Pounds, 2003; Pounds et al., 2003; King, 2005; Ganguly et al., 2007; Reeves et al., 2009; Alexander et al., 2010; Dunn et al., 2010; King et al., 2011; Fabian, A. C., 2012; Zubovas & King, 2012), which successfully explained the fast outflows suggested by the blueshifted ultraviolet and X-ray absorption lines (such as Fe XV and Fe XVI )(e.g., Tombesi et al., 2012; Higginbottom et al., 2014). Even though the specific launch mechanism is still under debate, the extension of the wind launched from the accretion disk can reach at the inner NLR (Proga et al., 2008), which is supported by recent observations (e.g., Fischer et al., 2018; Kang & Woo, 2018; Husemann et al., 2019). In addition, in the merger scenario (e.g., Di Matteo et al., 2005; Springel et al., 2005; Hopkins et al., 2006), a strong feedback attributed to the AGN activity is required not only to make the quasar activity to be detectable in optics by removing the material enshrouding the central SMBH (e.g., Hopkins et al., 2005), but also to regulate SMBH growth through quenching the surrounding star formation activity by a feedback (e.g., Alexander & Hickox, 2012; Fabian, A. C., 2012; Kormendy & Ho, 2013).
5.3 Feedback in co-evolution of AGNs and their hosts
Similar as in Seyfert galaxies, we here identify a dependence of ionized gas outflow caused by SMBH’s accretion on the circumnuclear stellar population in QSO2s: young stellar population (and also high ) is related to a strong outflow. This result follows the co-evolutionary scenario proposed previously (e.g., Wang, 2015) in which AGNs likely evolve from a high- state with strong outflow to a low- state with weak outflow as the newly formed circumnuclear massive stars fades out continually. Recent integral-field spectroscopic observations of AGNs in fact reveal that stronger the outflows, higher star formation rate (SFR) and higher H I gas fraction will be (e.g., Figures 6 and 9 in Luo et al., 2021; Woo et al., 2020, and references therein).
The revealed dependence of outflow on stellar population implies an evolution of feedback of AGNs with their host galaxies. However, the feedback effect cause by the outflow is still under hot debate. In the evolution scenario proposed in Sanders et al. (1988) , a quasar is produced by expelling the surrounding gas and dust by a wind from the central SMBH after a merger of two gas-rich galaxies. Such feedback from the powerful AGN’s wind is actually involved in the early numerical and semi-analytical galaxy evolution models to reproduce the relation and luminosity functions of AGNs by quenching the star formation and blowing the gas or dust away, especially in the young AGN phase (e.g., Fabian, 1999; Di Matteo et al., 2005; Hopkins et al., 2005; Springel et al., 2005; Croton et al., 2006; Hopkins et al., 2008, 2008; Khalatyan et al., 2008; Somerville et al., 2008; Kauffmann & Heckman, 2009).
Recent observations, however, indicate that the AGN’s feedback has positive, negative and even no effect on the evolution of the host galaxies of Seyfert galaxies and quasars (e.g., Almeida et al., 2022; Smirnova-Pinchukova et al., 2022, and references therein). By comparing the specific SFR of AGNs with and without outflows, Woo et al. (2020) proposed a delayed effect of feedback on host galaxies, due to the dynamical time required for outflows to travel the large galaxy disks. The MUSE integral-field spectroscopic observation of nine nearby Palomar-Green quasars show that the fraction of kinetic power of outflow is (and see also in Baron & Netzer, 2019; Fiore et al., 2017; Rojas et al., 2020; Molina et al., 2022) which is much lower than the theoretical requirement of (e.g., Di Matteo et al., 2005; Springel et al., 2005; Hopkins & Quataert, 2010; Zubovas & King, 2012).
6 Summary
The evolutionary role of the outflow from QSO2s is examined on a large sample of 221 QSO2s extracted from the QSO2s catalog provided in Reyes et al. (2008). Given our spectral analysis on both AGN and its host galaxies, the main results are listed as follows:
-
1.
Using the Lick indices as indicators, QSO2s are confirmed to be on average associated with younger stellar populations than do Seyfert galaxies;
-
2.
Even though an occupation at the high end, the QSO2s follow the - sequence established from the local, less-luminous Seyfert galaxies, which suggests a coevolution between the accretion activity of SMBH and the host galaxy.
-
3.
QSO2s with a stronger outflow and higher activity () are tend to be associated with a younger stellar population, which implies a coevolution between the feedback from SMBH and the host in QSO2s driven by : AGNs likely evolve from a high state with strong feedback to a low state with weak feedback as the circumnuclear stellar population continually ages.
References
- Abazajian et al. (2009) Abazajian, K. N., Adelman-McCarthy, J. K., Agüeros, M. A., et al. 2009, ApJS, 182, 543, doi: 10.1088/0067-0049/182/2/543
- Alexander & Hickox (2012) Alexander, D. M., & Hickox, R. C. 2012, New A Rev., 56, 93, doi: 10.1016/j.newar.2011.11.003
- Alexander et al. (2010) Alexander, D. M., Swinbank, A. M., Smail, I., McDermid, R., & Nesvadba, N. P. H. 2010, MNRAS, 402, 2211, doi: 10.1111/j.1365-2966.2009.16046.x
- Almeida et al. (2022) Almeida, I., Duarte, R., & Nemmen, R. 2022, MNRAS, 509, 5657, doi: 10.1093/mnras/stab3353
- Antonucci (1993) Antonucci, R. 1993, ARA&A, 31, 473, doi: 10.1146/annurev.aa.31.090193.002353
- Aoki et al. (2005) Aoki, K., Kawaguchi, T., & Ohta, K. 2005, ApJ, 618, 601, doi: 10.1086/426075
- Bae & Woo (2014) Bae, H.-J., & Woo, J.-H. 2014, ApJ, 795, 30, doi: 10.1088/0004-637X/795/1/30
- Bahcall et al. (1997) Bahcall, J. N., Kirhakos, S., Saxe, D. H., & Schneider, D. P. 1997, ApJ, 479, 642, doi: 10.1086/303926
- Balogh et al. (1999) Balogh, M. L., Morris, S. L., Yee, H. K. C., Carlberg, R. G., & Ellingson, E. 1999, ApJ, 527, 54, doi: 10.1086/308056
- Baron & Netzer (2019) Baron, D., & Netzer, H. 2019, MNRAS, 486, 4290, doi: 10.1093/mnras/stz1070
- Bessiere et al. (2014) Bessiere, P. S., Tadhunter, C. N., Ramos Almeida, C., & Villar Martín, M. 2014, MNRAS, 438, 1839, doi: 10.1093/mnras/stt2333
- Bessiere et al. (2017) Bessiere, P. S., Tadhunter, C. N., Ramos Almeida, C., Villar Martín, M., & Cabrera-Lavers, A. 2017, MNRAS, 466, 3887, doi: 10.1093/mnras/stw3175
- Binney & Merrifield (1998) Binney, J., & Merrifield, M. 1998, Galactic Astronomy, Princeton University Press
- Boroson (2005) Boroson, T. 2005, AJ, 130, 381, doi: 10.1086/431722
- Brotherton et al. (2002) Brotherton, M. S., Green, R. F., Kriss, G. A., et al. 2002, ApJ, 565, 800, doi: 10.1086/324694
- Bruzual A. (1983) Bruzual A., G. 1983, ApJ, 273, 105, doi: 10.1086/161352
- Canalizo & Stockton (2000) Canalizo, G., & Stockton, A. 2000, AJ, 120, 1750, doi: 10.1086/301585
- Canalizo & Stockton (2001) Canalizo, G. v., & Stockton, A. 2001, ApJ, 555, 719, doi: 10.1086/321520
- Cappellari (2017) Cappellari, M. 2017, MNRAS, 466, 798, doi: 10.1093/mnras/stw3020
- Cappellari & Emsellem (2004) Cappellari, M., & Emsellem, E. 2004, PASP, 116, 138, doi: 10.1086/381875
- Cardelli et al. (1989) Cardelli, J. A., Clayton, G. C., & Mathis, J. S. 1989, ApJ, 345, 245, doi: 10.1086/167900
- Carniani et al. (2016) Carniani, S., Marconi, A., Maiolino, R., et al. 2016, A&A, 591, A28, doi: 10.1051/0004-6361/201528037
- Ciotti & Ostriker (2007) Ciotti, L., & Ostriker, J. P. 2007, ApJ, 665, 1038, doi: 10.1086/519833
- Crenshaw et al. (2003) Crenshaw, D. M., Kraemer, S. B., & George, I. M. 2003, ARA&A, 41, 117, doi: 10.1146/annurev.astro.41.082801.100328
- Cresci & Maiolino (2018) Cresci, G., & Maiolino, R. 2018, Nature Astronomy, 2, 179, doi: 10.1038/s41550-018-0404-5
- Cresci et al. (2015) Cresci, G., Mainieri, V., Brusa, M., et al. 2015, ApJ, 799, 82, doi: 10.1088/0004-637X/799/1/82
- Cresci et al. (2023) Cresci, G., Tozzi, G., Perna, M., et al. 2023, arXiv e-prints, arXiv:2301.11060, doi: 10.48550/arXiv.2301.11060
- Croton et al. (2006) Croton, D. J., Springel, V., White, S. D. M., et al. 2006, MNRAS, 365, 11, doi: 10.1111/j.1365-2966.2005.09675.x
- Davies et al. (2020) Davies, R., Baron, D., Shimizu, T., et al. 2020, MNRAS, 498, 4150, doi: 10.1093/mnras/staa2413
- Di Matteo et al. (2008) Di Matteo, P., Bournaud, F., Martig, M., et al. 2008, A&A, 492, 31, doi: 10.1051/0004-6361:200809480
- Di Matteo et al. (2007) Di Matteo, P., Combes, F., Melchior, A. L., & Semelin, B. 2007, A&A, 468, 61, doi: 10.1051/0004-6361:20066959
- Di Matteo et al. (2005) Di Matteo, T., Springel, V., & Hernquist, L. 2005, in Growing Black Holes: Accretion in a Cosmological Context, ed. A. Merloni, S. Nayakshin, & R. A. Sunyaev, 340–345, doi: 10.1007/11403913_65
- Draper & Ballantyne (2012) Draper, A. R., & Ballantyne, D. R. 2012, in American Astronomical Society Meeting Abstracts, Vol. 219, American Astronomical Society Meeting Abstracts #219, 154.03
- Dunn et al. (2010) Dunn, J. P., Bautista, M., Arav, N., et al. 2010, ApJ, 709, 611, doi: 10.1088/0004-637X/709/2/611
- Fabian (1999) Fabian, A. C. 1999, MNRAS, 308, L39, doi: 10.1046/j.1365-8711.1999.03017.x
- Fabian, A. C. (2012) Fabian, A. C. 2012, ARA&A, 50, 455, doi: 10.1146/annurev-astro-081811-125521
- Fiore et al. (2017) Fiore, F., Feruglio, C., Shankar, F., et al. 2017, A&A, 601, A143, doi: 10.1051/0004-6361/201629478
- Fischer et al. (2018) Fischer, T. C., Kraemer, S. B., Schmitt, H. R., et al. 2018, ApJ, 856, 102, doi: 10.3847/1538-4357/aab03e
- Förster Schreiber et al. (2019) Förster Schreiber, N. M., Übler, H., Davies, R. L., et al. 2019, ApJ, 875, 21, doi: 10.3847/1538-4357/ab0ca2
- Ganguly et al. (2007) Ganguly, R., Brotherton, M. S., Cales, S., et al. 2007, ApJ, 665, 990, doi: 10.1086/519759
- Ge et al. (2012) Ge, J.-Q., Hu, C., Wang, J.-M., Bai, J.-M., & Zhang, S. 2012, ApJS, 201, 31, doi: 10.1088/0067-0049/201/2/31
- Granato et al. (2004) Granato, G. L., Silva, L., Danese, L., de Zotti, G., & Bressan, A. 2004, in Multiwavelength AGN Surveys, ed. R. Mújica & R. Maiolino, 379–384, doi: 10.1142/9789812702432_0091
- Greene & Ho (2005) Greene, J. E., & Ho, L. C. 2005, ApJ, 627, 721, doi: 10.1086/430590
- Haehnelt et al. (1998) Haehnelt, M. G., Natarajan, P., & Rees, M. J. 1998, MNRAS, 300, 817, doi: 10.1046/j.1365-8711.1998.01951.x
- Halpern & Steiner (1983) Halpern, J. P., & Steiner, J. E. 1983, ApJ, 269, L37, doi: 10.1086/184051
- Hao et al. (2005) Hao, L., Strauss, M. A., Tremonti, C. A., et al. 2005, AJ, 129, 1783, doi: 10.1086/428485
- Harrison (2017) Harrison, C. M. 2017, Nature Astronomy, 1, 0165, doi: 10.1038/s41550-017-0165
- Harrison et al. (2014) Harrison, C. M., Alexander, D. M., Mullaney, J. R., & Swinbank, A. M. 2014, MNRAS, 441, 3306, doi: 10.1093/mnras/stu515
- Harrison et al. (2016) Harrison, C. M., Alexander, D. M., Mullaney, J. R., et al. 2016, MNRAS, 456, 1195, doi: 10.1093/mnras/stv2727
- Harrison et al. (2014) Harrison, C. M., Alexander, D. M., Mullaney, J. R., & Swinbank, A. M. 2014, MNRAS, 441, 3306, doi: 10.1093/mnras/stu515
- Heckman (1997) Heckman, T. 1997, The Host Galaxies of Radio-Quiet High- Redshift Quasars, HST Proposal ID 7864. Cycle 7
- Heckman & Best (2014) Heckman, T. M., & Best, P. N. 2014, ARA&A, 52, 589, doi: 10.1146/annurev-astro-081913-035722
- Heckman et al. (2004) Heckman, T. M., Kauffmann, G., Brinchmann, J., et al. 2004, ApJ, 613, 109, doi: 10.1086/422872
- Heckman et al. (1981) Heckman, T. M., Miley, G. K., van Breugel, W. J. M., & Butcher, H. R. 1981, ApJ, 247, 403, doi: 10.1086/159050
- Higginbottom et al. (2014) Higginbottom, N., Proga, D., Knigge, C., et al. 2014, ApJ, 789, 19, doi: 10.1088/0004-637X/789/1/19
- Hirschmann et al. (2014) Hirschmann, M., De Lucia, G., Wilman, D., et al. 2014, MNRAS, 444, 2938, doi: 10.1093/mnras/stu1609
- Holt et al. (2007) Holt, J., Tadhunter, C. N., & Morganti, R. 2007, in Astronomical Society of the Pacific Conference Series, Vol. 373, The Central Engine of Active Galactic Nuclei, ed. L. C. Ho & J. W. Wang, 347
- Hopkins et al. (2006) Hopkins, Philip F. and Hernquist, L., Cox, T. J., Di Matteo, T., Robertson, B., & Springel, V. 2006, ApJS, 163, 1, doi: 10.1086/499298
- Hopkins et al. (2013) Hopkins, P. F., Cox, T. J., Hernquist, L., et al. 2013, MNRAS, 430, 1901, doi: 10.1093/mnras/stt017
- Hopkins et al. (2008) Hopkins, P. F., Cox, T. J., Kereš, D., & Hernquist, L. 2008, ApJS, 175, 390, doi: 10.1086/524363
- Hopkins & Hernquist (2009) Hopkins, P. F., & Hernquist, L. 2009, ApJ, 694, 599, doi: 10.1088/0004-637X/694/1/599
- Hopkins et al. (2005) Hopkins, P. F., Hernquist, L., Cox, T. J., et al. 2005, ApJ, 630, 705, doi: 10.1086/432438
- Hopkins & Quataert (2010) Hopkins, P. F., & Quataert, E. 2010, MNRAS, 407, 1529, doi: 10.1111/j.1365-2966.2010.17064.x
- Hopkins et al. (2008) Hopkins, P. F., Hernquist, L., Cox, T. J., & Kereš, D. 2008, ApJS, 175, 356, doi: 10.1086/524362
- Hou et al. (2011) Hou, L. G., Han, J. L., Kong, M. Z., & Wu, X.-B. 2011, ApJ, 732, 72, doi: 10.1088/0004-637X/732/2/72
- Husemann et al. (2019) Husemann, B., Bennert, V. N., Jahnke, K., et al. 2019, ApJ, 879, 75, doi: 10.3847/1538-4357/ab24bc
- Ishibashi & Fabian (2014) Ishibashi, W., & Fabian, A. C. 2014, MNRAS, 441, 1474, doi: 10.1093/mnras/stu672
- Ishibashi et al. (2013) Ishibashi, W., Fabian, A. C., & Canning, R. E. A. 2013, MNRAS, 431, 2350, doi: 10.1093/mnras/stt333
- Kakkad et al. (2020) Kakkad, D., Mainieri, V., Vietri, G., et al. 2020, A&A, 642, A147, doi: 10.1051/0004-6361/202038551
- Kang & Woo (2018) Kang, D., & Woo, J.-H. 2018, ApJ, 864, 124, doi: 10.3847/1538-4357/aad561
- Karouzos et al. (2016) Karouzos, M., Woo, J.-H., & Bae, H.-J. 2016, ApJ, 833, 171, doi: 10.3847/1538-4357/833/2/171
- Kauffmann & Haehnelt (2000) Kauffmann, G., & Haehnelt, M. 2000, MNRAS, 311, 576, doi: 10.1046/j.1365-8711.2000.03077.x
- Kauffmann & Heckman (2009) Kauffmann, G., & Heckman, T. M. 2009, MNRAS, 397, 135, doi: 10.1111/j.1365-2966.2009.14960.x
- Kauffmann et al. (2003) Kauffmann, G., Heckman, T. M., White, S. D. M., et al. 2003, MNRAS, 341, 33, doi: 10.1046/j.1365-8711.2003.06291.x
- Kewley et al. (2001) Kewley, L. J., Dopita, M. A., Sutherland, R. S., Heisler, C. A., & Trevena, J. 2001, ApJ, 556, 121, doi: 10.1086/321545
- Kewley et al. (2006) Kewley, L. J., Groves, B., Kauffmann, G., & Heckman, T. 2006, MNRAS, 372, 961, doi: 10.1111/j.1365-2966.2006.10859.x
- Khalatyan et al. (2008) Khalatyan, A., Cattaneo, A., Schramm, M., et al. 2008, MNRAS, 387, 13, doi: 10.1111/j.1365-2966.2008.13093.x
- King (2005) King, A. 2005, ApJ, 635, L121, doi: 10.1086/499430
- King & Pounds (2003) King, A. R., & Pounds, K. A. 2003, MNRAS, 345, 657, doi: 10.1046/j.1365-8711.2003.06980.x
- King et al. (2011) King, A. R., Zubovas, K., & Power, C. 2011, MNRAS, 415, L6, doi: 10.1111/j.1745-3933.2011.01067.x
- Kirhakos et al. (1999) Kirhakos, S., Bahcall, J. N., Schneider, D. P., & Kristian, J. 1999, ApJ, 520, 67, doi: 10.1086/307430
- Komossa et al. (2008) Komossa, S., Xu, D., Zhou, H., Storchi-Bergmann, T., & Binette, L. 2008, ApJ, 680, 926, doi: 10.1086/587932
- Kong & Ho (2018) Kong, M., & Ho, L. C. 2018, ApJ, 859, 116, doi: 10.3847/1538-4357/aabe2a
- Kormendy & Ho (2013) Kormendy, J., & Ho, L. C. 2013, ARA&A, 51, 511, doi: 10.1146/annurev-astro-082708-101811
- Liao & Cooper (2023) Liao, L.-W., & Cooper, A. P. 2023, MNRAS, 518, 3999, doi: 10.1093/mnras/stac3327
- Liu et al. (2013) Liu, G., Zakamska, N. L., Greene, J. E., Nesvadba, N. P. H., & Liu, X. 2013, MNRAS, 436, 2576, doi: 10.1093/mnras/stt1755
- Liu et al. (2010) Liu, X., Shen, Y., Strauss, M. A., & Greene, J. E. 2010, ApJ, 708, 427, doi: 10.1088/0004-637X/708/1/427
- Liu et al. (2009) Liu, X., Zakamska, N. L., Greene, J. E., et al. 2009, ApJ, 702, 1098, doi: 10.1088/0004-637X/702/2/1098
- Luo et al. (2021) Luo, R., Woo, J.-H., Karouzos, M., et al. 2021, ApJ, 908, 221, doi: 10.3847/1538-4357/abd5ac
- Markwardt (2009) Markwardt, C. B. 2009, in Astronomical Society of the Pacific Conference Series, Vol. 411, Astronomical Data Analysis Software and Systems XVIII, ed. D. A. Bohlender, D. Durand, & P. Dowler, 251. https://arxiv.org/abs/0902.2850
- Martini & Weinberg (2001) Martini, P., & Weinberg, D. H. 2001, ApJ, 547, 12, doi: 10.1086/318331
- Marziani et al. (2003) Marziani, P., Zamanov, R. K., Sulentic, J. W., & Calvani, M. 2003, MNRAS, 345, 1133, doi: 10.1046/j.1365-2966.2003.07033.x
- Menci et al. (2008) Menci, N., Fiore, F., Puccetti, S., & Cavaliere, A. 2008, ApJ, 686, 219, doi: 10.1086/591438
- Molina et al. (2022) Molina, J., Ho, L. C., Wang, R., et al. 2022, ApJ, 935, 72, doi: 10.3847/1538-4357/ac7d4d
- Mullaney et al. (2013) Mullaney, J. R., Alexander, D. M., Fine, S., et al. 2013, MNRAS, 433, 622, doi: 10.1093/mnras/stt751
- Murray & Chiang (1995) Murray, N., & Chiang, J. 1995, ApJ, 454, L105, doi: 10.1086/309775
- Nelson et al. (2004) Nelson, C., Plasek, A., Thompson, A., Gelderman, R., & Monroe, T. 2004, in Astronomical Society of the Pacific Conference Series, Vol. 311, AGN Physics with the Sloan Digital Sky Survey, ed. G. T. Richards & P. B. Hall, 83
- Page et al. (2012) Page, M. J., Symeonidis, M., Vieira, J. D., et al. 2012, Nature, 485, 213, doi: 10.1038/nature11096
- Perna et al. (2020) Perna, M., Arribas, S., Catalán-Torrecilla, C., et al. 2020, A&A, 643, A139, doi: 10.1051/0004-6361/202038328
- Pounds et al. (2003) Pounds, K. A., King, A. R., Page, K. L., & O’Brien, P. T. 2003, MNRAS, 346, 1025, doi: 10.1111/j.1365-2966.2003.07164.x
- Proga et al. (2008) Proga, D., Ostriker, J. P., & Kurosawa, R. 2008, ApJ, 676, 101, doi: 10.1086/527535
- Proga et al. (2000) Proga, D., Stone, J. M., & Kallman, T. R. 2000, ApJ, 543, 686, doi: 10.1086/317154
- Reeves et al. (2009) Reeves, J. N., Sambruna, R. M., Braito, V., & Eracleous, M. 2009, ApJ, 702, L187, doi: 10.1088/0004-637X/702/2/L187
- Reyes et al. (2008) Reyes, R., Zakamska, N. L., Strauss, M. A., et al. 2008, AJ, 136, 2373, doi: 10.1088/0004-6256/136/6/2373
- Rojas et al. (2020) Rojas, A. F., Sani, E., Gavignaud, I., et al. 2020, MNRAS, 491, 5867, doi: 10.1093/mnras/stz3386
- Sánchez Almeida et al. (2017) Sánchez Almeida, J., Olmo-García, A., Elmegreen, B. G., et al. 2017, in Formation and Evolution of Galaxy Outskirts, ed. A. Gil de Paz, J. H. Knapen, & J. C. Lee, Vol. 321, 208–210, doi: 10.1017/S1743921316008863
- Sander & Friedl (1988) Sander, S. P., & Friedl, R. R. 1988, Geophys. Res. Lett., 15, 887, doi: 10.1029/GL015i008p00887
- Sanders et al. (1988) Sanders, D. B., Soifer, B. T., Elias, J. H., et al. 1988, ApJ, 325, 74, doi: 10.1086/165983
- Schlafly & Finkbeiner (2011) Schlafly, E. F., & Finkbeiner, D. P. 2011, ApJ, 737, 103, doi: 10.1088/0004-637X/737/2/103
- Scholtz et al. (2021) Scholtz, J., Harrison, C. M., Rosario, D. J., et al. 2021, MNRAS, 505, 5469, doi: 10.1093/mnras/stab1631
- Shankar et al. (2012) Shankar, F., Marulli, F., Mathur, S., Bernardi, M., & Bournaud, F. 2012, A&A, 540, A23, doi: 10.1051/0004-6361/201118387
- Shen & Ho (2014) Shen, Y., & Ho, L. C. 2014, Nature, 513, 210, doi: 10.1038/nature13712
- Shin et al. (2021) Shin, J., Woo, J.-H., Kim, M., & Wang, J. 2021, ApJ, 908, 81, doi: 10.3847/1538-4357/abd779
- Silk & Rees (1998) Silk, J., & Rees, M. J. 1998, A&A, 331, L1. https://arxiv.org/abs/astro-ph/9801013
- Smirnova-Pinchukova et al. (2022) Smirnova-Pinchukova, I., Husemann, B., Davis, T. A., et al. 2022, A&A, 659, A125, doi: 10.1051/0004-6361/202142011
- Somerville et al. (2008) Somerville, R. S., Hopkins, P. F., Cox, T. J., Robertson, B. E., & Hernquist, L. 2008, MNRAS, 391, 481, doi: 10.1111/j.1365-2966.2008.13805.x
- Spergel et al. (2003) Spergel, D. N., Verde, L., Peiris, H. V., et al. 2003, ApJS, 148, 175, doi: 10.1086/377226
- Springel et al. (2005) Springel, V., Di Matteo, T., & Hernquist, L. 2005, MNRAS, 361, 776, doi: 10.1111/j.1365-2966.2005.09238.x
- Stanley et al. (2017) Stanley, F., Alexander, D. M., Harrison, C. M., et al. 2017, MNRAS, 472, 2221, doi: 10.1093/mnras/stx2121
- Tadhunter et al. (2011) Tadhunter, C., Holt, J., González Delgado, R., et al. 2011, MNRAS, 412, 960, doi: 10.1111/j.1365-2966.2010.17958.x
- Tombesi et al. (2012) Tombesi, F., Cappi, M., Sambruna, R. M., et al. 2012, in Astronomical Society of the Pacific Conference Series, Vol. 460, AGN Winds in Charleston, ed. G. Chartas, F. Hamann, & K. M. Leighly, 8. https://arxiv.org/abs/1208.5031
- Tremaine et al. (2002) Tremaine, S., Gebhardt, K., Bender, R., et al. 2002, ApJ, 574, 740, doi: 10.1086/341002
- Valdes et al. (2004) Valdes, F., Gupta, R., Rose, J. A., Singh, H. P., & Bell, D. J. 2004, ApJS, 152, 251, doi: 10.1086/386343
- Veilleux & Rupke (2005) Veilleux, S., & Rupke, D. S. 2005, in Astronomical Society of the Pacific Conference Series, Vol. 331, Extra-Planar Gas, ed. R. Braun, 313
- Véron-Cetty et al. (2001) Véron-Cetty, M. P., Véron, P., & Gonçalves, A. C. 2001, A&A, 372, 730, doi: 10.1051/0004-6361:20010489
- Villar et al. (2016) Villar, V. A., Berger, E., Chornock, R., et al. 2016, ApJ, 830, 11, doi: 10.3847/0004-637X/830/1/11
- Villar-Martín et al. (2012) Villar-Martín, M., Cabrera Lavers, A., Bessiere, P., et al. 2012, MNRAS, 423, 80, doi: 10.1111/j.1365-2966.2012.20652.x
- Villar Martín et al. (2014) Villar Martín, M., Emonts, B., Humphrey, A., Cabrera Lavers, A., & Binette, L. 2014, MNRAS, 440, 3202, doi: 10.1093/mnras/stu448
- Villar-Martín et al. (2011) Villar-Martín, M., Humphrey, A., Delgado, R. G., Colina, L., & Arribas, S. 2011, MNRAS, 418, 2032, doi: 10.1111/j.1365-2966.2011.19622.x
- Wang (2015) Wang, J. 2015, New A, 37, 15, doi: 10.1016/j.newast.2014.11.004
- Wang et al. (2011) Wang, J., Mao, Y. F., & Wei, J. Y. 2011, ApJ, 741, 50, doi: 10.1088/0004-637X/741/1/50
- Wang et al. (2018) Wang, J., Xu, D. W., & Wei, J. Y. 2018, ApJ, 852, 26, doi: 10.3847/1538-4357/aa9d1b
- Wang et al. (2019) Wang, J., Xu, D. W., Wang, Y., et al. 2019, ApJ, 887, 15, doi: 10.3847/1538-4357/ab4d90
- Wang et al. (2016) Wang, J., Xu, D. W., & Wei, J. Y. 2016, AJ, 151, 81, doi: 10.3847/0004-6256/151/3/81
- Wills et al. (2008) Wills, K. A., Tadhunter, C., Holt, J., et al. 2008, MNRAS, 385, 136, doi: 10.1111/j.1365-2966.2008.12865.x
- Woo et al. (2016) Woo, J.-H., Bae, H.-J., Son, D., & Karouzos, M. 2016, ApJ, 817, 108, doi: 10.3847/0004-637X/817/2/108
- Woo et al. (2017) Woo, J.-H., Son, D., & Bae, H.-J. 2017, ApJ, 839, 120, doi: 10.3847/1538-4357/aa6894
- Woo et al. (2020) Woo, J.-H., Son, D., & Rakshit, S. 2020, ApJ, 901, 66, doi: 10.3847/1538-4357/abad97
- Worthey & Ottaviani (1997) Worthey, G., & Ottaviani, D. L. 1997, ApJS, 111, 377, doi: 10.1086/313021
- Xu & Komossa (2009) Xu, D., & Komossa, S. 2009, ApJ, 705, L20, doi: 10.1088/0004-637X/705/1/L20
- York et al. (2000) York, D. G., Adelman, J., Anderson, John E., J., et al. 2000, AJ, 120, 1579, doi: 10.1086/301513
- Yuan et al. (2016) Yuan, S., Strauss, M. A., & Zakamska, N. L. 2016, MNRAS, 462, 1603, doi: 10.1093/mnras/stw1747
- Zakamska & Greene (2014) Zakamska, N. L., & Greene, J. E. 2014, MNRAS, 442, 784, doi: 10.1093/mnras/stu842
- Zakamska et al. (2003) Zakamska, N. L., Strauss, M. A., Krolik, J. H., et al. 2003, AJ, 126, 2125, doi: 10.1086/378610
- Zamanov et al. (2002) Zamanov, R., Marziani, P., Sulentic, J. W., et al. 2002, ApJ, 576, L9, doi: 10.1086/342783
- Zhang et al. (2013) Zhang, K., Wang, T.-G., Yan, L., & Dong, X.-B. 2013, ApJ, 768, 22, doi: 10.1088/0004-637X/768/1/22
- Zhang (2021) Zhang, X. 2021, ApJ, 909, 16, doi: 10.3847/1538-4357/abdb35
- Zubovas & King (2012) Zubovas, K., & King, A. R. 2012, in Astronomical Society of the Pacific Conference Series, Vol. 460, AGN Winds in Charleston, ed. G. Chartas, F. Hamann, & K. M. Leighly, 235. https://arxiv.org/abs/1201.3540
- Zubovas et al. (2013) Zubovas, K., Nayakshin, S., King, A., & Wilkinson, M. 2013, MNRAS, 433, 3079, doi: 10.1093/mnras/stt952