The First Quiescent Galaxies in TNG300
Abstract
We identify the first quiescent galaxies in TNG300, the largest volume of the IllustrisTNG cosmological simulation suite, and explore their quenching processes and time evolution to . We find that the first quiescent galaxies with stellar masses and specific star formation rates sSFR emerge at in TNG300. Suppression of star formation in these galaxies begins with a thermal mode of AGN feedback at , and a kinetic feedback mode acts in each galaxy by to complete the quenching process, which occurs on a time-scale of Gyr. Surprisingly, we find that the majority of these galaxies are not the main progenitors of their descendants; instead, four of the five galaxies fall into more massive galaxies in subsequent mergers at a range of redshifts . By , these descendants are the centres of galaxy clusters with average stellar masses of . We make predictions for the first quenched galaxies to be located by the James Webb Space Telescope (JWST).
keywords:
galaxies: high-redshift – galaxies: evolution – galaxies: star formation1 Introduction
By the time the Universe was 3 billion years old, half of its massive galaxies had stopped forming new stars (Whitaker et al., 2021a; Muzzin et al., 2013), but the variations in the time-scales and structural factors involved in their quenching processes often evade explanation. These quiescent galaxies appear to be unable to form stars because they lack reservoirs of cold, star-forming gas (Bezanson et al., 2019; Williams et al., 2021; Whitaker et al., 2021a). When observed at high redshifts, they are exceedingly compact (van Dokkum et al., 2009; Cassata et al., 2013; Straatman et al., 2015; van der Wel et al., 2014), which in principle allows for more expedient gas accretion onto their supermassive black holes (SMBHs). If a galaxy’s central SMBH accretes rapidly enough, an active galactic nucleus (AGN) is formed, which serves as an incredibly luminous and persistent source of electromagnetic radiation (Irodotou et al., 2022; Harrison, 2017, 2019). By preventing further accumulation of cold gas and dust in the central regions of a galaxy (Choi et al., 2018; Fluetsch et al., 2019), AGN feedback is proposed to prohibit quiescent galaxies from rejuvenating and developing dense stellar cores later in time (but see also Woodrum et al. (2022) ). This feedback from early black holes has thus likely played a pivotal role in the quenching of early and massive galaxies (Beckmann et al., 2017; Donnari et al., 2021a; Nobels et al., 2022), but causal evidence linking AGN feedback to quenching has been nearly impossible to establish observationally. This empirical uncertainty necessitates the use of cosmological simulations in studies of AGN feedback.
In the IllustrisTNG (hereafter TNG) cosmological simulation suite (Nelson et al., 2018; Pillepich et al., 2018b) modeling galaxy formation, AGN feedback regulates black hole accretion and star formation with quasar-heating (thermal) and radio-jet (kinetic) wind modes, which work at different scales to expel cool star-forming gas from their host galaxies (Sijacki et al., 2007; Murthy et al., 2022). The thermal mode heats surrounding gas within a galaxy, while the kinetic mode serves as a velocity boost to eject the gas. Both feedback modes may work in tandem to create and maintain the quiescence of their host galaxy (Morganti, 2017; Cielo et al., 2018).
Although many studies have been conducted to determine the physical properties and quenching processes of ancient quiescent galaxies (e.g., van Dokkum et al., 2015; Park et al., 2021; Zhang et al., 2022; Lustig et al., 2022), TNG provides a means to address a cosmological enigma yet to be resolved in this field, namely the lives and quenching mechanisms of the very first quiescent galaxies in our Universe. The most massive galaxies in the Universe today host maximally old stars (e.g., Thomas et al., 2010; McDermid et al., 2015), suggesting that they are relics of very early star formation and the early truncation thereof. This empirical fact has naturally driven observational searches for the earliest progenitors of these systems, and examples of these massive, quiescent galaxies have been spectroscopically confirmed as early as (Glazebrook et al., 2017; Valentino et al., 2020; Forrest et al., 2020). However, the intrinsically red colours and high mass-to-light ratios of older stellar populations have rendered direct study of the earliest red-and-dead systems observationally out of reach prior to vastly improved sensitivity, wavelength coverage, and resolution of the JWST. Investigating the evolution and quenching processes of the first massive quiescent galaxies in the largest volume of the TNG suite provides some theoretical underpinnings for the groundbreaking examinations of quiescent galaxies that observational missions like JWST will produce.
In this letter, we shed light on the physical properties, star formation histories, quenching processes (AGN feedback modes), and evolution of the first quiescent galaxies in the TNG300 simulation. The letter is organised as follows. In Section 2, we give a brief overview of the IllustrisTNG project and simulation utilized in this study. We then describe criteria for selection of the first quiescent galaxies within TNG300. In Section 3, we set forth our results regarding the first quenched galaxies identified in TNG, as well as critical information about their physical properties and star formation histories (Section 3.1). We then discuss the sample’s evolution to (Section 3.2) and explore the quenching mechanisms acting on these galaxies (Section 3.3). Section 4 briefly relays the final conclusions drawn from this work, including its applications to the JWST mission.
2 Methodology
2.1 The TNG300 simulation
This study utilizes simulations from the IllustrisTNG project (Nelson et al., 2018; Springel et al., 2018; Pillepich et al., 2018b; Naiman et al., 2018; Marinacci et al., 2018; Pillepich et al., 2019; Nelson et al., 2019b). IllustrisTNG is a suite consisting of cosmological magnetohydrodynamical simulations run using the moving-mesh AREPO code (Springel, 2010). TNG is an updated version of the model employed in the original Illustris Project (Vogelsberger et al., 2013, 2014a, 2014b; Genel et al., 2014) and simulates galaxy formation physics with a hybrid multiphase model for quiescent star formation coupled with radiative heating and cooling, solving for the integrated evolution of cosmic gas, luminous stars, dark matter and SMBHs (Springel & Hernquist, 2003; Pillepich et al., 2018a). The simulations include SMBH growth with high-accretion state thermal mode (Di Matteo et al., 2005; Springel et al., 2005; Sijacki et al., 2007) and low-accretion state kinetic wind mode feedback (Sijacki et al., 2015; Weinberger et al., 2017). The instantaneous SMBH mass accretion rates calculated by TNG reflect the expected Bondi accretion rate of each respective SMBH given its mass and the properties of the surrounding gas.
The TNG suite consists of 3 simulation boxes with varying resolutions and volumes, which allows for both narrow and extensive cosmological studies. Because we would like to study rare galaxies, we utilize data selected from the TNG300 simulation (Nelson et al., 2019a), which has has a box size of 300 Mpc3, the largest volume of the TNG suite. The simulation assumes the Planck Collaboration et al. (2016) best fit cosmological parameters, namely a dark energy density , baryon density , matter density , Hubble constant , spectral index , and normalization . We employ TNG300-1, the highest resolution realization of TNG300, which includes resolution elements. TNG300 evolves dark matter particles with mass of and baryonic elements (stellar particles and gas cells) with mass resolution of .
TNG employs the SUBFIND algorithm (Springel et al., 2001; Dolag et al., 2009) to locate gravitationally bound structures within the simulation. These structures include subhaloes and dark matter haloes, with associated baryonic components that comprise galaxies within each subhalo. Subhaloes are tracked through snapshots in time using SUBLINK merger trees (Rodriguez-Gomez et al., 2015). A subhalo’s descendant is the subhalo with the highest weighted sum of individual particles (gas, stars, and dark matter) shared with the progenitor. These particles are ranked by gravitational binding energy and weighted by (rank)-1. A merger takes place when multiple subhaloes share a common descendant, and the main progenitor of this descendant is defined as whichever subhalo has the most massive history (De Lucia & Blaizot, 2007).
2.2 Selection
We select galaxies that are quiescent by requiring specific star formation rate (sSFR), defined as star formation rate normalized by galaxy mass within twice the stellar half-mass radius (INRAD quantities in the TNG catalogues), to fall below (Brinchmann & Ellis, 2000; Guzmán et al., 1997). We check that the descendant subhaloes of our selection maintain quiescence down to , in order to exclude temporary low-activity galaxies and ensure that we are locating those that are truly quenched. Finally, we limit galaxy stellar mass to . This restricts our search to subhaloes with stellar masses greater than 1000 times the baryonic mass resolution of TNG300-1, so that all galaxies are resolved with roughly star particles.
3 Results and Discussion: The first quiescent central galaxies in TNG300
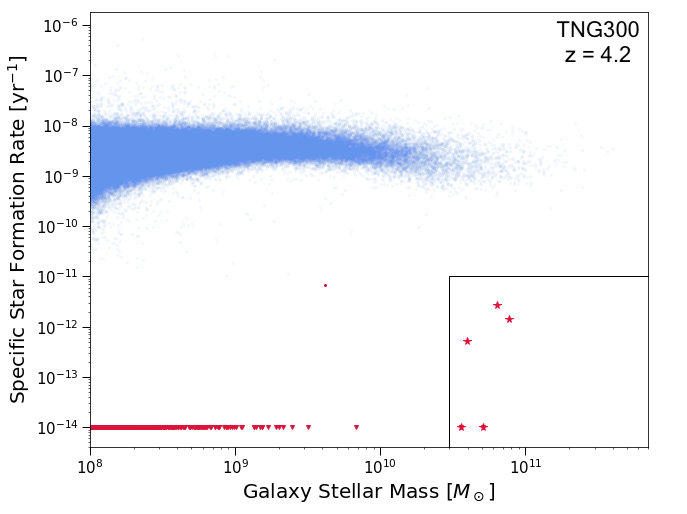
The first quiescent galaxies in TNG300 emerge at , roughly Gyr after the Big Bang. No snapshots in time prior to contain galaxies that fit our criteria. To ensure a robust selection, we experimented with a higher sSFR cut of , and our five selected galaxies were still the only quiescent candidates at (with no new galaxies fitting these criteria at higher redshifts). Lowering our mass cut to resulted in the emergence of a new quiescent galaxy at the prior snapshot of , which was found to be a galaxy from our sample that hadn’t yet reached its star formation peak. We also checked TNG50, the highest resolution simulation of the TNG suite, for galaxies meeting our original criteria, and found the first match to occur at (mostly due to a volume effect). With a larger volume, we may detect even rarer quiescent sources at higher redshifts. We note that the TNG300 simulation’s effective comoving area at is roughly 75% of that covered by the five HST CANDELS survey fields at the same redshift (Chartab et al., 2020). By redshift , TNG300’s effective comoving area only makes up % of that of the CANDELS survey, which may indicate compelling discrepancies between observed and simulated samples of high-redshift quiescent galaxies.
Fig. 1 plots sSFR versus galaxy stellar mass for all subhaloes with at , displaying the clear locus of galaxies at sSFR which make up the star-forming main sequence (SFMS) (Nelson et al., 2021). However, of galaxies fall dex below this main sequence. All five galaxies below an sSFR of and above a stellar mass of have already passed their star formation peaks.
We find the number density of our sample, defined as the number of galaxies that fit our selection criteria at divided by the effective volume of the TNG300 simulated box, to be . This closely resembles the observational number densities calculated by Carnall et al. (2022) reflecting massive quiescent galaxies located by JWST at , and by Schreiber et al. (2018) in their study of massive quiescent galaxies at identified in the ZFOURGE and 3DHST catalogues (Skelton et al., 2014; Straatman et al., 2016). The authors of Schreiber et al. (2018) report a number density of for a spectroscopic sample of quiescent galaxies at , and the number density of quiescent galaxies in Carnall et al. (2022)’s robust sub-sample at is found to be . Valentino et al. (2020) show that the number densities of these quiescent galaxies at are consistent between simulations and observations. Furthermore, the authors of Carnall et al. (2022) report a number density of for massive quiescent galaxies located by JWST at . However, these observed number densities of high-redshift quiescent galaxies are dependent upon measurement choices, such as definitions of quiescence and SFR time-scale, and sample selection functions, which impact their comparison to theoretical investigations (Donnari et al., 2021b). The number densities presented in early JWST studies also reflect preliminary observations. It can be difficult to distinguish dusty star-forming galaxies and quiescent galaxies from photometry alone, so further spectroscopic observations are needed to confirm high-redshift () quiescent galaxy candidates.
3.1 Physical Properties and Star Formation Histories
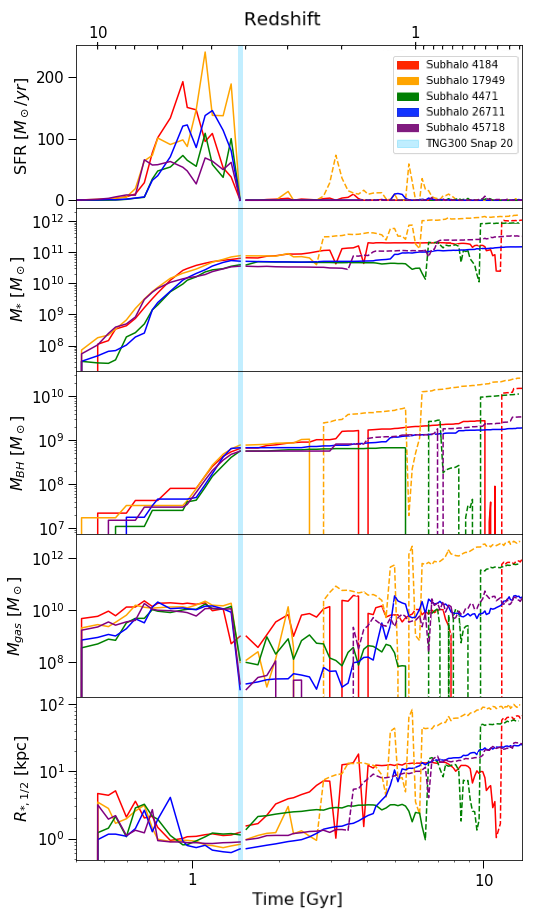
Fig. 2 plots the time evolution of the star formation rates of our selected galaxies, their stellar masses, black hole masses, gas masses, and stellar half-mass radii. These plots include all mergers experienced by our sample galaxies since , with a dashed line indicating that the galaxy merged into a more massive halo and is no longer its descendant’s main progenitor. All galaxies are first identified as quiescent at an age of 1.47 Gyr, marked in blue with a vertical line on each panel of the figure. This line illustrates that our galaxies of interest have indeed passed their epochs of peak star formation.
Our sample displays star formation rates that drop off and approach zero soon before an age of Gyr, with star formation history shapes defined by early peaks with compact widths. The average sSFR of this sample at is , which falls a few orders of magnitude below the sSFR associated with the SFMS at this redshift. We find that this sample experiences an expeditious quenching time-scale of Gyr. The duration of quenching is defined as the time period during which the sSFR drops continuously from its peak value to sSFR , where is the Hubble time at each redshift. This quenching is reflected as a decrease in the rate of stellar mass growth preceded by a rapid rise in black hole mass for each galaxy. The mass growth of these galaxies’ SMBHs thus seems to be an integral driving factor in their quenching.
We find the average stellar mass contained within twice our sample’s respective stellar half-mass radii at an age of to be . In comparison, the average gas mass within the same radius for each galaxy is . We calculate the mean gas fraction of this sample over the span of its quenching era, Gyr to Gyr ( to ), in order to gauge the rate at which gas depletion occurs within these galaxies. This fraction drops from at to at , and finally to at . This suggests that these quiescent galaxies very rapidly lose their gas while quenching, as expected for a sample with such low specific star formation rates (Bezanson et al., 2019; Williams et al., 2021; Whitaker et al., 2021b). These galaxies display an average gas-phase metallicity of .
The stellar half-mass radii of our sample range from 0.7 to 1.3 kpc when they are first identified as quiescent, which is standard for massive galaxies at in TNG300; the average stellar half-mass radius for galaxies with in the snapshot is a compact 1.29 kpc. Our five selected galaxies also display distinctly disk-like morphologies.
Utilizing stellar formation times from each star particle within each sample galaxy, we find that the oldest star within the first massive quiescent galaxies in TNG300 formed at a high redshift of . On average, however, the stars composing these galaxies were born at , which corresponds to a lookback time of Gyr. With an average stellar age of Gyr, this sample is consistent with observed post-starburst galaxies (Suess et al., 2022); the first quiescent galaxies in TNG300 quenched quickly.
To explore how these objects would be detected in real surveys, we provide magnitude estimates in H160 and F444W, typical detection bands for the Hubble Space Telescope and JWST, respectively. We find the average apparent AB magnitude of our sample to be 24.6 in the U rest frame band, which is comparable to H160, and 23.7 in the i rest frame band, which is similar to F444W observed for sources. These magnitudes indicate that we have located a strong sample of simulated candidates to obtain JWST NIRSpec spectra for in the real Universe. The magnitudes also corroborate those reported in Carnall et al. (2023). However, our galaxies do not fall within the standard UVJ cut for quiescent sources, which indicates ambiguity in their detectability in a potential observational survey. This limitation highlights the inherent difficulties of both locating the first quiescent galaxies in the Universe, and of thoroughly comparing astrophysical observations and theoretical predictions without a proper forward modeling approach of simulated data. The TNG300 simulation does not account for extinction from dust, which may also reduce the accuracy of magnitude approximations. Quiescent galaxies generally have limited reserves of dust, but we should still expect a potential disparity of up to half a mag between our above estimates of apparent visual magnitude and the brightnesses of similar galaxies located in our Universe.
3.2 Evolution to
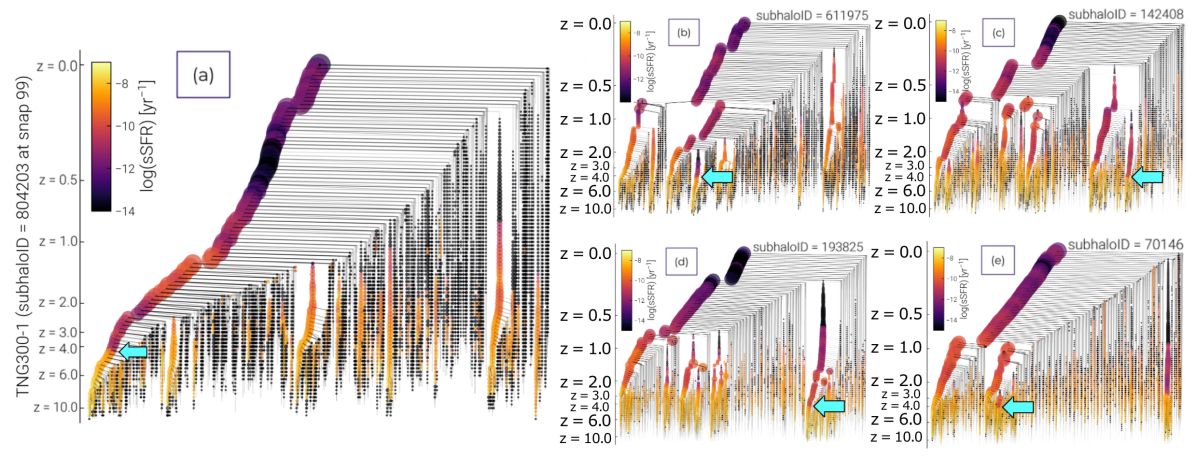
Contrary to initial expectations that the first quiescent galaxies in TNG would persist as the most central and massive galaxies of their respective haloes, we find that only one of our five selected galaxies lies on the main progenitor branch of its descendant. The remaining four merge into other, more massive galaxies. This can be seen in Fig. 3, which juxtaposes complete merger tree diagrams generated by TNG for the evolutions of: (a) the only galaxy in the sample to lie on the main progenitor branch of its descendant, and (b) through (e), the remaining galaxies in the sample which are far removed from their main progenitor branches.
The fact that our selected galaxies in the bottom four panels do not lie on this branch of the most massive galaxies leading up to their final subhaloes, is a surprise. Wellons et al. (2016), for example, found that a mere 15 per cent of their selected massive compact quiescent galaxies in Illustris were consumed in mergers with more massive galaxies on their evolutionary paths from to . The majority of galaxies in their sample instead either acquired ex situ envelopes to become the cores of more massive descendants, or survived undisturbed. Bezanson et al. (2009) further describe a model wherein compact high-redshift galaxies comprise the centres of normal nearby ellipticals and grow via minor mergers, which predicts that these galaxies serve as the progenitors of massive elliptical galaxies in the local universe.
In order to explore the large-scale structural transformation of our sample of galaxies, we calculate their physical properties at redshift and determine what they have become. At , the only galaxy in our sample to lie on the main progenitor branch of its descendant sports a stellar half-mass radius of kpc. The remaining galaxies in our sample have merged into larger galaxy clusters whose centrals have stellar half-mass radii ranging from to kpc. These radial measurements extend deep into the haloes of the clusters, and would thus make for poor comparisons to observational data.
After a galaxy in the sample merges into another more massive object, it is plotted with a dotted line in Fig. 2, which illustrates that a significant amount of this radial increase is due to major mergers into larger galaxy clusters. We find that the average stellar mass of our sample has increased to , and the associated average gas mass has increased to . Our results suggest that the first quiescent galaxies become brightest cluster galaxies (BCGs) in the local Universe at . Though the majority of our sample of galaxies are not the main progenitors of BCGs, they are likely the most massive galaxies contributing to the centres of these clusters.
3.3 Quenching Processes: SMBH accretion and AGN feedback
At , the SMBHs within our sample have just experienced rapid mass growth, as evidenced by the middle panel of Fig. 2. We quantify this accretion by calculating the average black hole growth rate between snapshots. From to , a span of Gyr, our sample’s central black holes grow by an average of . We find the average black hole growth rate from to , a span of Gyr, to have declined to stabilize at , a phenomenon which may be explained by the regulatory nature of AGN feedback in relation to black hole mass.
Our sample’s SMBHs exhibit thermal AGN feedback during the entire quenching era of these galaxies, Gyr to Gyr after the Big Bang. At , the kinetic energy injection feedback mode turns on in the simulation for the sole galaxy in our sample that is the main progenitor of its descendant, and at for the remaining galaxies in the sample.
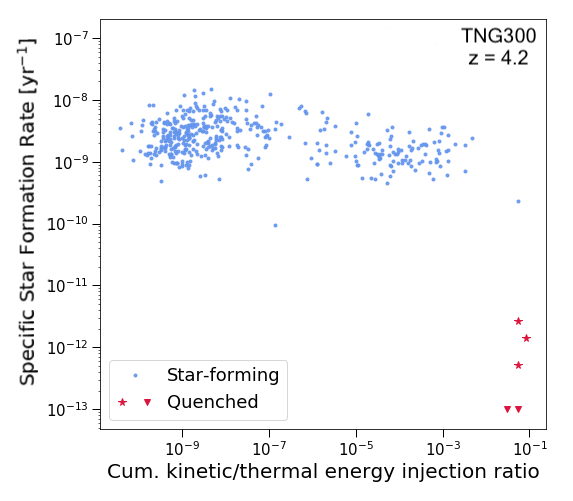
To account for the potential role of stellar feedback in the quenching processes of our sample, we utilise feedback energy equations provided by Weinberger et al. (2018). We find that though thermal AGN and stellar feedback dominate at higher redshifts, these rates of feedback energy experience minimal growth during our sample’s quenching epoch. Instead, it appears that quenching is largely driven by kinetic AGN feedback, which acts later to efficiently expel remaining reserves of star-forming gas. This corroborates Weinberger et al. (2018)’s finding that kinetic AGN feedback tends to take over at late times in massive haloes in order to keep the star formation rate low. Fig. 4 displays that the onset of quenching at in TNG300 takes place when kinetic mode energy exceeds 1 per cent of the thermal mode. The necessity of low-accretion state kinetic AGN feedback in the quenching processes of these galaxies is further substantiated by Weinberger et al. (2017); Nelson et al. (2018); Terrazas et al. (2020); Zinger et al. (2020); Nelson et al. (2021), who show that TNG galaxies quench only when the kinetic wind mode of feedback is turned on. This mode is more efficient in halting star formation in a host galaxy than the quasar-heating mode, as thermal energy produced by the latter is quickly radiated away.
We conclude that AGN feedback has substantially contributed to the quenching process of the galaxies in our sample. For each galaxy, rapid SMBH growth and activation of a kinetic feedback mode coincide with a steep decline in star formation rate, as evidenced by Fig. 2. Even so, the cause of stellar feedback’s reduced efficiency in this study remains ambiguous; this feedback mode may play a more pivotal role in the quenching of galaxies in the real Universe. Further observational comparisons of high-redshift quiescent sources are necessary in order to precisely determine the roles of AGN and stellar feedback mechanisms in quenching.
4 Final conclusions and applications to James Webb
We have studied the attributes and evolution of the first massive quiescent galaxies in the TNG300 simulation of the IllustrisTNG project. These galaxies’ physical characteristics corroborate those of early massive quiescent galaxies directly observed in our Universe, namely a compact stellar half-mass radius and substantial stellar-to-gas mass ratio. However, our sample emphasises a critical evolutionary caveat: observed high-redshift quenched populations are far from the final word in the time evolution of the earliest quiescent galaxies. The truncation of star formation that is driven by AGN feedback in IllustrisTNG is only a pause in these developmental paths, which include significant growth and star formation in other branches of their evolutionary trees. While expanding our stellar mass and sSFR cuts to and yr-1 did not yield additional TNG quiescent candidates, we intend to fully investigate quenching at lower mass regimes in future research.
With the results of this study, we predict that the first quiescent galaxies to be located by JWST will host massive black holes, and furthermore that the JWST mission will allow for spectroscopic confirmation of the presence of AGN at high redshifts (). Additional noteworthy JWST predictions facilitated by TNG include the works of Shen et al. (2020) and Costantin et al. (2022). Shen et al. (2020) provide predictions for the dust attenuation curves of high redshift galaxy populations () based on the IllustrisTNG simulation suite, and the authors conclude that attenuation curves are steeper in galaxies at higher redshifts, with bluer colours, or with lower stellar masses. Costantin et al. (2022) present a catalogue of mock images of massive high-redshift galaxies from the TNG50 cosmological simulation. The authors analyse the predictions of TNG50 for the size evolution of galaxies at and the expectations for CEERS to probe that progression, finding a difference between the mass and light distribution, which may indicate a transition in the galaxy morphology at . JWST findings shall further test these predictions.
Furthermore, JWST has facilitated the selection of a sample of massive quiescent galaxies at by Carnall et al. (2022). The number density reported by the authors for massive quiescent galaxies at , , is in agreement with the calculated number density of our sample, . This observational number density represents a conservative lower limit, indicating that JWST may reveal new insights into galaxy formation that will train the next generation of cosmological simulations. Our study serves as a strong test of the quenching mechanisms employed in such simulations; if larger samples of quiescent galaxies are observationally confirmed at higher redshifts than , as suggested by photometry (e.g., Merlin et al., 2019; Shahidi et al., 2020), it implies an interesting discrepancy to pursue with further research of high-redshift galaxies.
Acknowledgements
We are immensely appreciative of the IllustrisTNG team for making their simulation public (Nelson et al., 2018). This research used the Python packages Numpy (Harris et al., 2020) and Matplotlib (Hunter, 2007). A.I.H. gratefully acknowledges the financial support of a CU Boulder Undergraduate Research Opportunities Program Individual Grant.
Data Availability
The data utilized in this paper were accessed from the IllustrisTNG simulations, which are publicly available at www.tng-project.org/data. This includes the TNG300 simulation used in this study.
References
- Beckmann et al. (2017) Beckmann R. S., et al., 2017, MNRAS, 472, 949
- Bezanson et al. (2009) Bezanson R., van Dokkum P. G., Tal T., Marchesini D., Kriek M., Franx M., Coppi P., 2009, ApJ, 697, 1290
- Bezanson et al. (2019) Bezanson R., Spilker J., Williams C. C., Whitaker K. E., Narayanan D., Weiner B., Franx M., 2019, ApJ, 873, L19
- Brinchmann & Ellis (2000) Brinchmann J., Ellis R. S., 2000, ApJ, 536, L77
- Carnall et al. (2022) Carnall A. C., et al., 2022, arXiv e-prints, p. arXiv:2208.00986
- Carnall et al. (2023) Carnall A. C., et al., 2023, arXiv e-prints, p. arXiv:2301.11413
- Cassata et al. (2013) Cassata P., et al., 2013, ApJ, 775, 106
- Chartab et al. (2020) Chartab N., et al., 2020, ApJ, 890, 7
- Choi et al. (2018) Choi E., Somerville R. S., Ostriker J. P., Naab T., Hirschmann M., 2018, ApJ, 866, 91
- Cielo et al. (2018) Cielo S., Bieri R., Volonteri M., Wagner A. Y., Dubois Y., 2018, MNRAS, 477, 1336
- Costantin et al. (2022) Costantin L., et al., 2022, arXiv e-prints, p. arXiv:2208.00007
- De Lucia & Blaizot (2007) De Lucia G., Blaizot J., 2007, MNRAS, 375, 2
- Di Matteo et al. (2005) Di Matteo T., Springel V., Hernquist L., 2005, Nature, 433, 604
- Dolag et al. (2009) Dolag K., Borgani S., Murante G., Springel V., 2009, MNRAS, 399, 497
- Donnari et al. (2021a) Donnari M., et al., 2021a, MNRAS, 500, 4004
- Donnari et al. (2021b) Donnari M., Pillepich A., Nelson D., Marinacci F., Vogelsberger M., Hernquist L., 2021b, MNRAS, 506, 4760
- Fluetsch et al. (2019) Fluetsch A., et al., 2019, MNRAS, 483, 4586
- Forrest et al. (2020) Forrest B., et al., 2020, ApJ, 903, 47
- Genel et al. (2014) Genel S., et al., 2014, MNRAS, 445, 175
- Glazebrook et al. (2017) Glazebrook K., et al., 2017, Nature, 544, 71
- Guzmán et al. (1997) Guzmán R., Gallego J., Koo D. C., Phillips A. C., Lowenthal J. D., Faber S. M., Illingworth G. D., Vogt N. P., 1997, ApJ, 489, 559
- Harris et al. (2020) Harris C. R., et al., 2020, Nature, 585, 357
- Harrison (2017) Harrison C. M., 2017, Nature Astronomy, 1, 0165
- Harrison (2019) Harrison C., 2019, in Linking Galaxies from the Epoch of Initial Star Formation to Today. p. 74, doi:10.5281/zenodo.2635347
- Hunter (2007) Hunter J. D., 2007, Computing in Science and Engineering, 9, 90
- Irodotou et al. (2022) Irodotou D., et al., 2022, MNRAS, 513, 3768
- Lustig et al. (2022) Lustig P., et al., 2022, arXiv e-prints, p. arXiv:2201.09068
- Marinacci et al. (2018) Marinacci F., et al., 2018, MNRAS, 480, 5113
- McDermid et al. (2015) McDermid R. M., et al., 2015, MNRAS, 448, 3484
- Merlin et al. (2019) Merlin E., et al., 2019, MNRAS, 490, 3309
- Morganti (2017) Morganti R., 2017, Frontiers in Astronomy and Space Sciences, 4, 42
- Murthy et al. (2022) Murthy S., Morganti R., Wagner A. Y., Oosterloo T., Guillard P., Mukherjee D., Bicknell G., 2022, Nature Astronomy, 6, 488
- Muzzin et al. (2013) Muzzin A., et al., 2013, ApJ, 777, 18
- Naiman et al. (2018) Naiman J. P., et al., 2018, MNRAS, 477, 1206
- Nelson et al. (2018) Nelson D., et al., 2018, MNRAS, 475, 624
- Nelson et al. (2019a) Nelson D., et al., 2019a, Computational Astrophysics and Cosmology, 6, 2
- Nelson et al. (2019b) Nelson D., et al., 2019b, MNRAS, 490, 3234
- Nelson et al. (2021) Nelson E. J., et al., 2021, MNRAS, 508, 219
- Nobels et al. (2022) Nobels F. S. J., Schaye J., Schaller M., Bahé Y. M., Chaikin E., 2022, arXiv e-prints, p. arXiv:2204.02205
- Park et al. (2021) Park M., et al., 2021, arXiv e-prints, p. arXiv:2112.07679
- Pillepich et al. (2018a) Pillepich A., et al., 2018a, MNRAS, 473, 4077
- Pillepich et al. (2018b) Pillepich A., et al., 2018b, MNRAS, 475, 648
- Pillepich et al. (2019) Pillepich A., et al., 2019, MNRAS, 490, 3196
- Planck Collaboration et al. (2016) Planck Collaboration et al., 2016, A&A, 594, A13
- Rodriguez-Gomez et al. (2015) Rodriguez-Gomez V., et al., 2015, MNRAS, 449, 49
- Schreiber et al. (2018) Schreiber C., et al., 2018, A&A, 618, A85
- Shahidi et al. (2020) Shahidi A., et al., 2020, ApJ, 897, 44
- Shen et al. (2020) Shen X., et al., 2020, MNRAS, 495, 4747
- Sijacki et al. (2007) Sijacki D., Springel V., Di Matteo T., Hernquist L., 2007, MNRAS, 380, 877
- Sijacki et al. (2015) Sijacki D., Vogelsberger M., Genel S., Springel V., Torrey P., Snyder G. F., Nelson D., Hernquist L., 2015, MNRAS, 452, 575
- Skelton et al. (2014) Skelton R. E., et al., 2014, ApJS, 214, 24
- Springel (2010) Springel V., 2010, MNRAS, 401, 791
- Springel & Hernquist (2003) Springel V., Hernquist L., 2003, MNRAS, 339, 289
- Springel et al. (2001) Springel V., White S. D. M., Tormen G., Kauffmann G., 2001, MNRAS, 328, 726
- Springel et al. (2005) Springel V., Di Matteo T., Hernquist L., 2005, MNRAS, 361, 776
- Springel et al. (2018) Springel V., et al., 2018, MNRAS, 475, 676
- Straatman et al. (2015) Straatman C. M. S., et al., 2015, ApJ, 808, L29
- Straatman et al. (2016) Straatman C. M. S., et al., 2016, ApJ, 830, 51
- Suess et al. (2022) Suess K. A., et al., 2022, ApJ, 926, 89
- Terrazas et al. (2020) Terrazas B. A., et al., 2020, MNRAS, 493, 1888
- Thomas et al. (2010) Thomas D., Maraston C., Schawinski K., Sarzi M., Silk J., 2010, MNRAS, 404, 1775
- Valentino et al. (2020) Valentino F., et al., 2020, ApJ, 889, 93
- Vogelsberger et al. (2013) Vogelsberger M., Genel S., Sijacki D., Torrey P., Springel V., Hernquist L., 2013, MNRAS, 436, 3031
- Vogelsberger et al. (2014a) Vogelsberger M., et al., 2014a, MNRAS, 444, 1518
- Vogelsberger et al. (2014b) Vogelsberger M., et al., 2014b, Nature, 509, 177
- Weinberger et al. (2017) Weinberger R., et al., 2017, MNRAS, 465, 3291
- Weinberger et al. (2018) Weinberger R., et al., 2018, MNRAS, 479, 4056
- Wellons et al. (2016) Wellons S., et al., 2016, MNRAS, 456, 1030
- Whitaker et al. (2021a) Whitaker K. E., et al., 2021a, Nature, 597, 485
- Whitaker et al. (2021b) Whitaker K. E., et al., 2021b, ApJ, 922, L30
- Williams et al. (2021) Williams C. C., et al., 2021, ApJ, 908, 54
- Woodrum et al. (2022) Woodrum C., et al., 2022, ApJ, 940, 39
- Zhang et al. (2022) Zhang J., et al., 2022, MNRAS, 513, 4814
- Zinger et al. (2020) Zinger E., et al., 2020, MNRAS, 499, 768
- van Dokkum et al. (2009) van Dokkum P. G., Kriek M., Franx M., 2009, Nature, 460, 717
- van Dokkum et al. (2015) van Dokkum P. G., et al., 2015, ApJ, 813, 23
- van der Wel et al. (2014) van der Wel A., et al., 2014, ApJ, 788, 28