11email: chrystianpereira@on.br 22institutetext: Laboratório Interinstitucional de e-Astronomia - LIneA, Rio de Janeiro, RJ, Brazil 33institutetext: LESIA, Observatoire de Paris, Université PSL, Sorbonne Université, Université de Paris, CNRS, 92190 Meudon, France 44institutetext: Universidade Federal do Rio de Janeiro - Observatório do Valongo, Ladeira Pedro Antônio 43, CEP 20.080-090, Rio de Janeiro - RJ, Brazil 55institutetext: Federal University of Technology - Paraná (UTFPR-Curitiba), Rua Sete de Setembro, 3165, CEP 80230-901, Curitiba, PR, Brazil 66institutetext: Florida Space Institute, UCF, 12354 Research Parkway, Partnership 1 building, Room 211, Orlado, USA 77institutetext: Instituto de Astrofísica de Andalucía – Consejo Superior de Investigaciones Científicas, Glorieta de la Astronomía S/N, E-18008, Granada, Spain 88institutetext: Departments of Astronomy, and of Earth and Planetary Science, 501, Campbell Hall, University of California, Berkeley, CA 94720, USA 99institutetext: naXys, Department of Mathematics, University of Namur, Rue de Bruxelles 61, 5000 Namur, Belgium 1010institutetext: Université Côte d’Azur, Observatoire de la Côte d’Azur, CNRS, Laboratoire Lagrange, Bd de l’Observatoire, CS 34229, 06304 Nice Cedex 4, France 1111institutetext: Space Telescope Science Institute, Baltimore, Maryland, USA 1212institutetext: Aix Marseille Université, CNRS, CNES, LAM (Laboratoire d’Astrophysique de Marseille) UMR 7326, 13388, Marseille, France 1313institutetext: Canada-France-Hawaii Telescope, 65-1238 Mamalahoa Highway, Kamuela, HI 96743, USA 1414institutetext: Institut Polytechnique des Sciences Avancées IPSA, 63 boulevard de Brandebourg, 94200 Ivry-sur-Seine, France 1515institutetext: Institut de Mécanique Céleste et de Calcul des Éphémérides, IMCCE, Observatoire de Paris, PSL Research University, CNRS, Sorbonne Universités, UPMC Univ Paris 06, Univ. Lille, France 1616institutetext: Akdeniz University, Faculty of Sciences, Department of Space Sciences and Technologies, 07058 Antalya, Turkey 1717institutetext: TÜBİTAK National Observatory, Akdeniz University Campus, 07058 Antalya, Turkey 1818institutetext: Institute of Physics, Federal University of Uberlândia, Uberlândia-MG, Brazil 1919institutetext: UNESP - São Paulo State University, Grupo de Dinâmica Orbital e Planetologia, CEP 12516-410, Guaratinguetá, SP, Brazil 2020institutetext: Universidade Estadual de Ponta Grossa, O.A. - DEGEO, Ponta Grossa (PR), Brazil 2121institutetext: Internationale Amateursternwarte (IAS) e. V., Mittelstr. 6, 15749 Mittenwalde, Germany 2222institutetext: International Occultation Timing Association - European Section (IOTA/ES), Am Brombeerhag 13, 30459 Hannover, Germany 2323institutetext: Département de Physique and Observatoire du Mont-Mégantic, Université de Montréal, C.P. 6128, Succ. Centre-ville, Montréal, H3C 3J7, Québec, Canada 2424institutetext: Institut Trottier de Recherche sur les exoplanètes, Université de Montréal 2525institutetext: Harvard-Smithsonian Center for Astrophysics, 60 Garden Street, Cambridge, MA 02138, USA 2626institutetext: Gemini Observatory/NSF’s NOIRLab, Hilo, Hawaii, USA 2727institutetext: Cabrillo College Astronomy, USA 2828institutetext: Southwest Research Institute, 1050 Walnut Street, Suite 300, Boulder, CO 80302, USA 2929institutetext: International Occultation Timing Association (IOTA), USA 3030institutetext: California Institute of Technology, 1200 E California Blvd, Pasadena, CA 91125, USA 3131institutetext: Universidad Nacional Autónoma de México, Instituto de Astronomía, AP 106, Ensenada, 22800, BC, Mexico 3232institutetext: University of Oregon, Eugene, OR, USA 3333institutetext: CanCON - Canadian Collaborative Occultation Network, Canada 3434institutetext: NASA Ames Research Center, Moffett Field, California, USA & NASA Exoplanet Science Institute, Caltech/IPAC, Mail Code 100-22, Pasadena, CA, USA 3535institutetext: University of New Haven, Dept. of Mathematics and Physics, 300 Boston Post Road, West Haven, CT 06477 3636institutetext: Academia Sinica Institute of Astronomy and Astrophysics, 11F of AS/NTU Astronomy-Mathematics Building, No.1, Sec. 4, Roosevelt Road, Taipei 10617, Taiwan, R.O.C. 3737institutetext: University of Colorado, 2000 Colorado Avenue, Boulder, CO 80309, USA 3838institutetext: Planetary Plasma and Atmospheric Research Center, Graduate School of Science, Tohoku University, 6-3 Aramaki -aza-aoba, Aoba-ku, Sendai 980-8578, Japan 3939institutetext: Department of Physics and Astronomy, University of Victoria, Building, 3800 Finnerty Road, Victoria, BC V8P 5C2, Canada 4040institutetext: Unistellar, 5 allée Marcel Leclerc, bâtiment B, 13008 Marseille, France 4141institutetext: SETI Institute, Carl Sagan Center, Suite 200, 339 Bernardo Avenue, Mountain View, CA 94043, USA 4242institutetext: Astronomy Department and Van Vleck Observatory, Wesleyan University, Middletown, CT 06459, USA 4343institutetext: Research and Education Collaborative Occultation Network, USA 4444institutetext: Purdue University Northwest, Department of Chemistry and Physics, Hammond, IN, USA 4545institutetext: University of Virginia, Department of Astronomy, P.O. Box 400325, Charlottesville, VA 22904, USA 4646institutetext: Private Observatory, Pennsylvania, USA 4747institutetext: Instituto de Astrofísica de Canarias, University of La Laguna, Tenerife, Spain 4848institutetext: Dept. Earth and Planetary Science, The University of Tokyo, Tokyo, Japan 4949institutetext: School of Medicine Department of Basic Sciences University of Occupational and Environmental Health, Japan 1-1 Iseigaoka, Yahata, Kitakyusyu 807-8555, JAPAN 5050institutetext: Planetary Exploration Research Center, Chiba Institute of Technology 2-17-1 Tsudanuma,Narashino, Chiba 275-0016, Japan 5151institutetext: Naylor Observatory
The two rings of (50000) Quaoar
Abstract
Context. Quaoar is a classical trans-Neptunian object (TNO) with an area-equivalent diameter of 1100 km and an orbital semi-major axis of 43.3 astronomical units. Based on stellar occultations observed between 2018 and 2021, an inhomogeneous ring (Q1R, i.e., Quaoar’s first ring) has been detected around this body.
Aims. A new stellar occultation by Quaoar was observed on August 9, 2022, with the aim of improving Quaoar’s shape models and the physical parameters of Q1R, while searching for additional material around the body.
Methods. The occultation provided nine effective chords across Quaoar, pinning down its size, shape, and astrometric position. Large facilities, such as Gemini North and the Canada-France-Hawaii Telescope (CFHT), were used to obtain high acquisition rates and signal-to-noise ratios. The light curves were also used to characterize the Q1R ring (radial profiles and orbital elements).
Results. Quaoar’s elliptical fit to the occultation chords yields the limb with an apparent semi-major axis of km, apparent oblateness of , and area-equivalent radius of km. Quaoar’s limb orientation is consistent with Q1R and Weywot orbiting in Quaoar’s equatorial plane. The orbital radius of Q1R is refined to a value of km. The radial opacity profile of the more opaque ring profile follows a Lorentzian shape that extends over 60 km, with a full width at half maximum (FWHM) of 5 km and a peak normal optical depth of 0.4. Besides the secondary events related to the already reported rings, new secondary events detected during the August 2022 occultation in three different data sets are consistent with another ring around Quaoar with a radius of km, assuming the ring is circular and co-planar with Q1R. This new ring has a typical width of 10 km and a normal optical depth of 0.004. Just as Q1R, it also lies outside Quaoar’s classical Roche limit.
Key Words.:
methods: data analysis – methods: observational – techniques: photometric – Kuiper belt objects: individual: Quaoar – Planets and satellites: rings1 Introduction
In the last decade, three ring systems have been discovered around minor bodies in the outer Solar System: the Centaur Chariklo (Braga-Ribas et al. 2014), the dwarf planet Haumea (Ortiz et al. 2017), and the Trans-Neptunian Object (TNO) (50000) Quaoar (Morgado et al. 2023). Dense material has also been detected around the Centaur Chiron (Ruprecht et al. 2015; Ortiz et al. 2015; Sickafoose et al. 2020). However, the nature of this material, namely, whether it is a permanent or transient ring or a dust shell, is still a matter of debate.
Quaoar’s ring, referred to as Q1R hereafter, was detected during several stellar occultations observed between 2018 and 2021 (Morgado et al. 2023). Q1R has a radius of about 4,100 km with significant azimuthal variations in the optical depth, ranging between 0.004 and 0.1-0.7, and in width, ranging from 5 km to 300 km. Like Chariklo’s and Haumea’s rings, Quaoar’s Q1R ring orbits close to the 1/3 spin-orbit resonance (SOR) with the central body, suggesting a link between this resonance and the ring (Salo et al. 2021; Sicardy et al. 2021; Morgado et al. 2023). Meanwhile, a unique property of Q1R is its location, which is far outside Quaoar’s classical Roche limit. This limit is estimated to be at 1,780 km from the body center, assuming particles with a bulk density of . Outside the Roche limit, rings should accrete into satellites over timescales of less than 100 years (Kokubo et al. 2000; Takeda & Ida 2001). However, collisions more elastic than previously considered for Saturn’s ring may maintain a ring unaccreted at distances greater than the Roche limit (Morgado et al. 2023). The 6:1 mean-motion resonance (MMR) of Quaoar and its satellite, Weywot, may contribute to the confinement of the ring since the satellite’s eccentricity creates an equilibrium region capable of concentrating ring material in an arc over a longitude interval (Morgado et al. 2023). The confinement of the rings may also be due to the presence of putative ”shepherd” satellites.
This letter presents observations of a stellar occultation by Quaoar that occurred on August 9, 2022. This event was observed in Hawaii, the continental US, and Mexico. The high image acquisition rate and high signal-to-noise-ratios (S/Ns) obtained at Mauna Kea with the ‘Alopeke camera at the Gemini North 8.1-m telescope and Wide-field InfraRed Camera (WIRCam) at the Canada-France-Hawaii 3.6-m Telescope (CFHT) allowed the dense part of Q1R to be radially resolved and its optical depth to be probed in the r’, z’ and Ks bands. Furthermore, this event revealed a new ring around Quaoar, hereafter called the Q2R (Quaoar’s second ring).
2 Prediction and observation
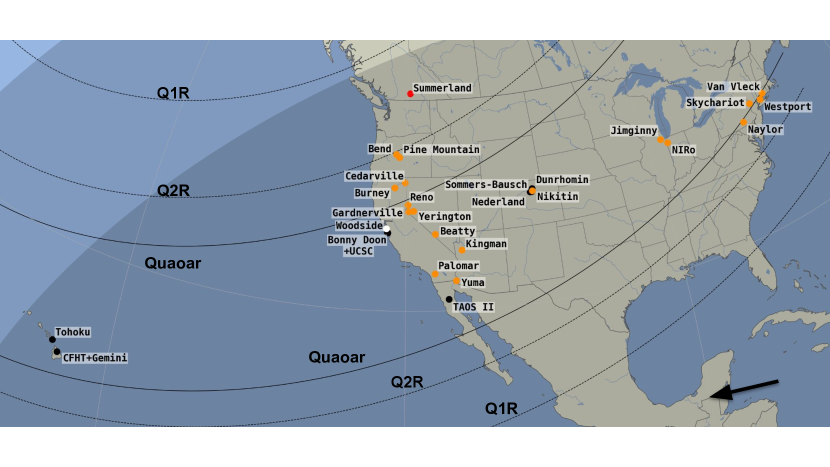
The occultation of August 9, 2022 was predicted within the framework of the European Research Council (ERC) Lucky Star project111https://lesia.obspm.fr/lucky-star. The campaign was managed by the Occultation Portal website222https://occultation.tug.tubitak.gov.tr described in Kilic et al. (2022). The occultation shadow crossed the continental United States, Mexico, and the Hawaiian archipelago with a geocentric shadow velocity of 17.6 km s-1. The shadow path and the sites involved in the observation campaign are shown in Appendix 6. More details on the occulted star and Quaoar are provided in Table 3.
| Occulted star | |
|---|---|
| Epoch | 2022-08-09 06:34:04 UTC |
| Source ID | Gaia DR3 4098214367441486592 |
| Star position | = 18h21m42s.86965 0.2404 mas |
| at epoch111111The star position was taken from the Gaia Data Release 3 (GDR3) star catalog (Gaia Collaboration et al. 2022) and is propagated to the event epoch using the formalism of Butkevich & Lindegren (2014) applied with SORA (Gomes-Júnior et al. 2022). | = -15∘12′45′′.9639 0.2191 mas |
| Magnitudes222222J, H, and K from the NOMAD catalog (Zacharias et al. 2004). | G = 15.3; RP = 14.1; BP = 16.8; |
| J = 12.0; H = 11.0; K = 10.7 | |
| Apparent diameter333333Limb-darkened angular diameter estimated using a fit of the spectral energy distribution of the star with (Castelli & Kurucz 2003) atmosphere models, with the reddening definition of (Fitzpatrick 1999). | 0.44 mas / 1.33 km |
| RUWE444444Renormalized unit weight error (Lindegren et al. 2021). | 0.959 |
| (50000) Quaoar | |
| Ephemeris version | NIMAv16555555Obtained from the Numerical Integration of the Motion of an Asteroid (NIMA, Desmars et al. 2015), based on astrometric positions derived from previous stellar occultations and the Minor Planet Center (MPC) database, available at https://lesia.obspm.fr/lucky-star/obj.php?p=958 |
| Geocentric Distance | 41.983157 au |
| Apparent Magnitude | V = 18.8 |
| Mass666666Obtained from the method of Vachier et al. (2012). | kg |
| Rotation period777777Assuming the double-peaked light curve from Ortiz et al. (2003). | h |
| Weywot’s orbital pole666666Obtained from the method of Vachier et al. (2012). | |
| RA | 17h44 40m |
| DEC | +50 6∘ |
Table 6 summarizes the observational circumstances. Among the stations, CFHT was equipped with the WIRCam (Puget et al. 2004) at 2.15 m (Ks-band) with an 8.8 Hz acquisition rate. The nearby Gemini North telescope used the Alopeke instrument (Scott et al. 2021) to simultaneously record the event with the z’ (947 nm) and r’ (620 nm) bands at a 10 Hz cadence. The images at the Tohoku University Haleakala Observatory (TUHO) in Hawaii and at the Transneptunian Automated Occultation Survey (TAOS II) in Baja California (Mexico) were taken with no filter to maximize the S/N. Q2R was not detected in these observations, likely due to insufficient S/N values. At the University of California, Santa Cruz (UCSC - California, US), the Dunrhomin Observatory (Colorado, US), Sommers-Bausch Observatory (Colorado, US), Nederland (Colorado, US), and a mobile station in Bonny Doon Eco Reserve (California, US), only the main body was recorded due to a low S/N.
3 Data analysis
The data sets were analyzed using the standard photometry procedures of the Platform for Reduction of Astronomical Images Automatically (PRAIA, Assafin et al. 2011). The flux of the occulted star was corrected by the flux of nearby reference stars to account for sky transparency variations and was normalized to the total starQuaoar flux outside the occultation.
The Stellar Occultation Reduction and Analysis package (SORA, Gomes-Júnior et al. 2022) was used to derive the ingress and egress instants of the occultation by the main body, assuming an opaque body without atmosphere. More details are presented in Appendix A. The extremities of the resulting chords were finally used to fit an elliptical model to Quaoar’s limb at the moment of the occultation.
In the case of rings, the events were fitted using the square box model described in Appendix E and pipelines based on the SORA package. This provides the radial width of the ring (assuming a circular ring), its normal opacity, , and normal optical depth, , from which the equivalent width, , and equivalent depth, , are derived.
In the case of the CFHT and Gemini data, the acquisition rate and S/N were high enough to provide resolved profiles of the dense part of Q1R. Then, and can be obtained directly from the numerical calculations of the integrals and (i.e., without using the square model described above), is the star velocity perpendicular to the ring, measured in the ring plane.
The dense part of Q1R has a radial profile reminiscent of the Saturnian F-ring core (Bosh et al. 2002). More precisely, it is consistent with a Lorentzian shape used here to provide the full width at half maximum (FWHM) of the profile and the event’s timing, from which its location relative to Quaoar is obtained.
4 Results
4.1 Main body
The event on August 9, 2022 provided ten chords across Quaoar’s main body. However, Gemini used a dual camera at two wavelengths, resulting in nine effective chords across the body, that is, =18 chord extremities with the timings listed in Table 5.
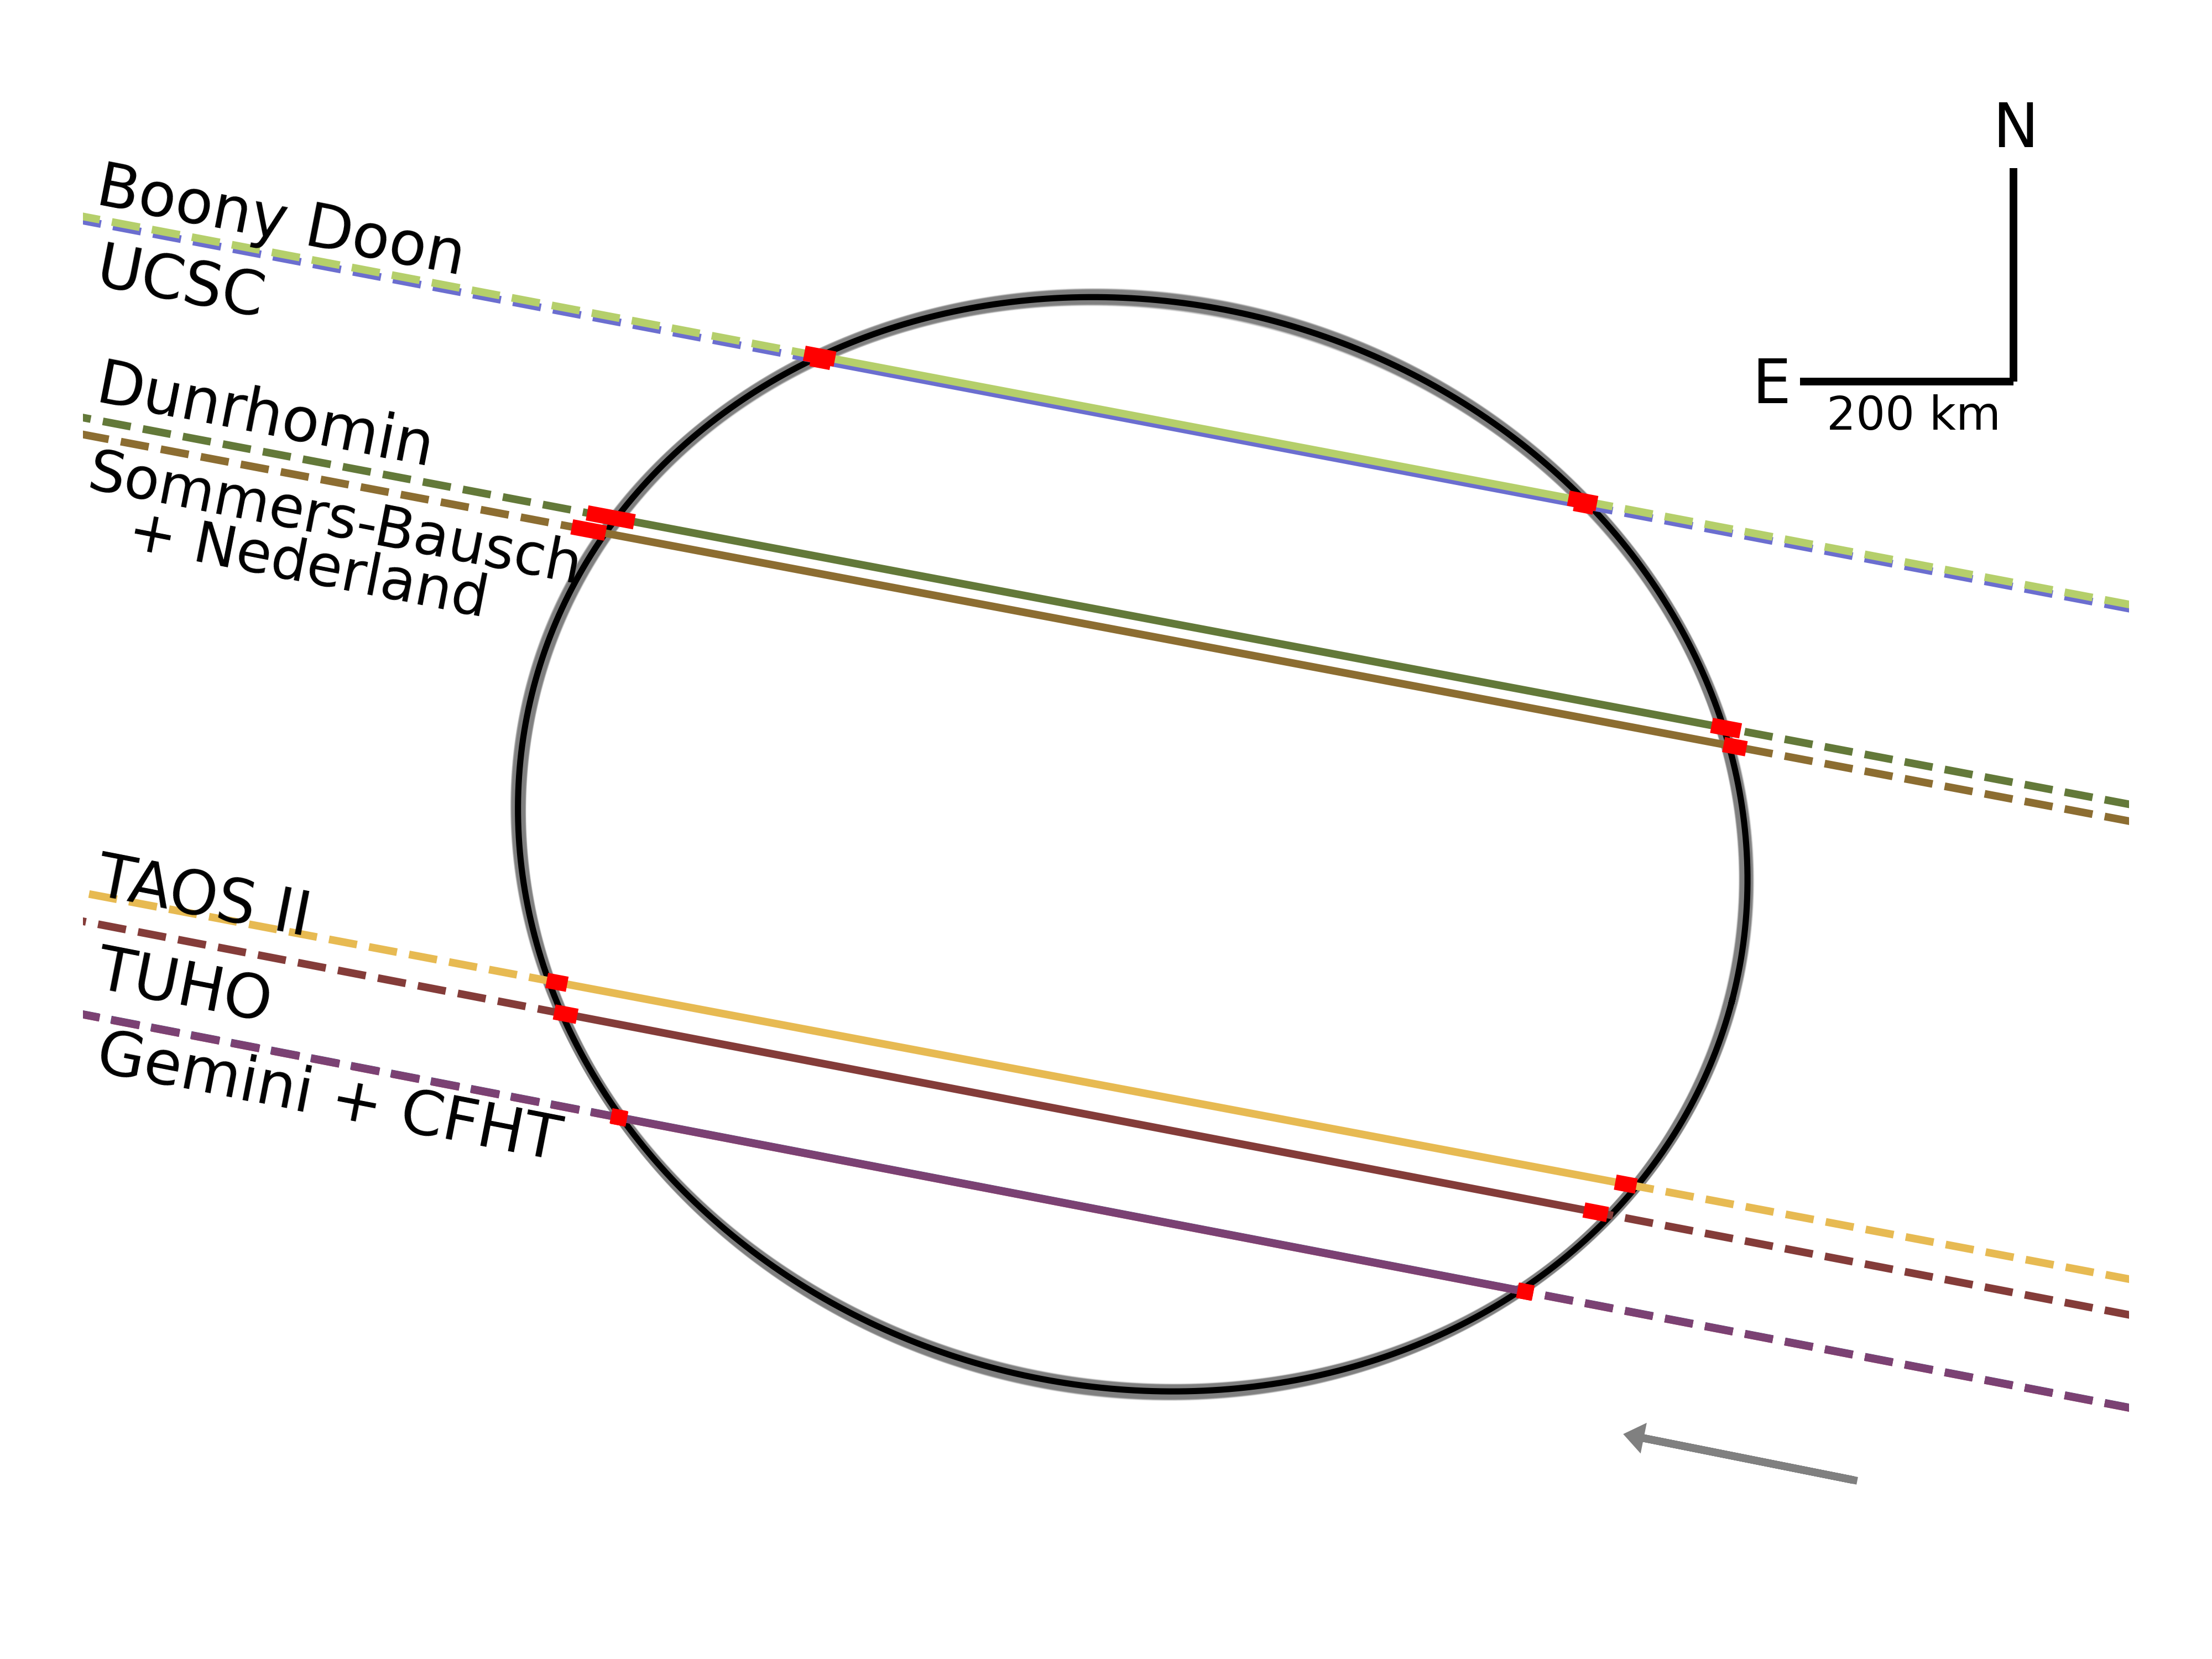
We used the SORA package to fit an ellipse to those extremities projected in the sky plane. This ellipse is defined by parameters and the fit has degrees of freedom. The fitted parameters are the ephemeris offsets and to apply to Quaoar’s center in right ascension and declination, respectively, the apparent semi-major axis of the limb, its apparent oblateness , where is the apparent semi-minor axis of the limb, and is the position angle of . The elliptical fit also considers a , which is the uncertainty of the ellipse associated with the existence of putative topographic features on the surface of Quaoar. From the methodology presented by (Johnson & McGetchin 1973), we estimated that Quaoar might support topographic features of about 5 km, given Quaoar’s density and strength , consistent with an ice-rich composition. The standard deviation of the observed radial residuals is 8 km, providing an upper limit for topographic features consistent with this prediction. Considering the equivalent radius in area as 542 km, this corresponds to 1.5%. The fit results are listed in Table 4. The chords and the best-fitting elliptical limb are plotted in Fig. 3, with more details given in Fig. 5.
| Quaoar’s limb fitting | |
|---|---|
| Apparent semi-major axis | km |
| Apparent oblateness | |
| Position angle | degrees |
| Ephemeris offset | km |
| km | |
| km | |
| per degree of freedom | 0.986 |
| Quaoar’s geocentric | = 18h21m42s.8677703 0.249 mas |
| position (ICRS) | = -15∘12′ 45′′.829691 0.230 mas |
| Q1R’s preferred pole | = 17h19m16s.8 55s.2 |
| position (ICRS)222222The preferred solution is co-planar with Quaoar’s equatorial plane and Weywot’s orbit within deg. The complementary position = 10h00 and = +79∘21, is not considered here as it provides a less satisfactory fit to the Q1R detections and yields an inclination of 45 degrees with respect to Weywot’s orbit, see Sec. 4.2 | = +53∘27’ 18’ |
| Q1R’s geometry | |
| Radius | km |
| Opening angle | degrees |
| Position angle | degrees |
| per degree of freedom | 1.633 |
| Q2R’s geometry333333Assuming a circular ring co-planar with Q1R. The error bar for the Q2R ring radius may be underestimated since we only have two effective detections, and several parameters were assumed. | |
| Radius | km |
4.2 Ring Q1R
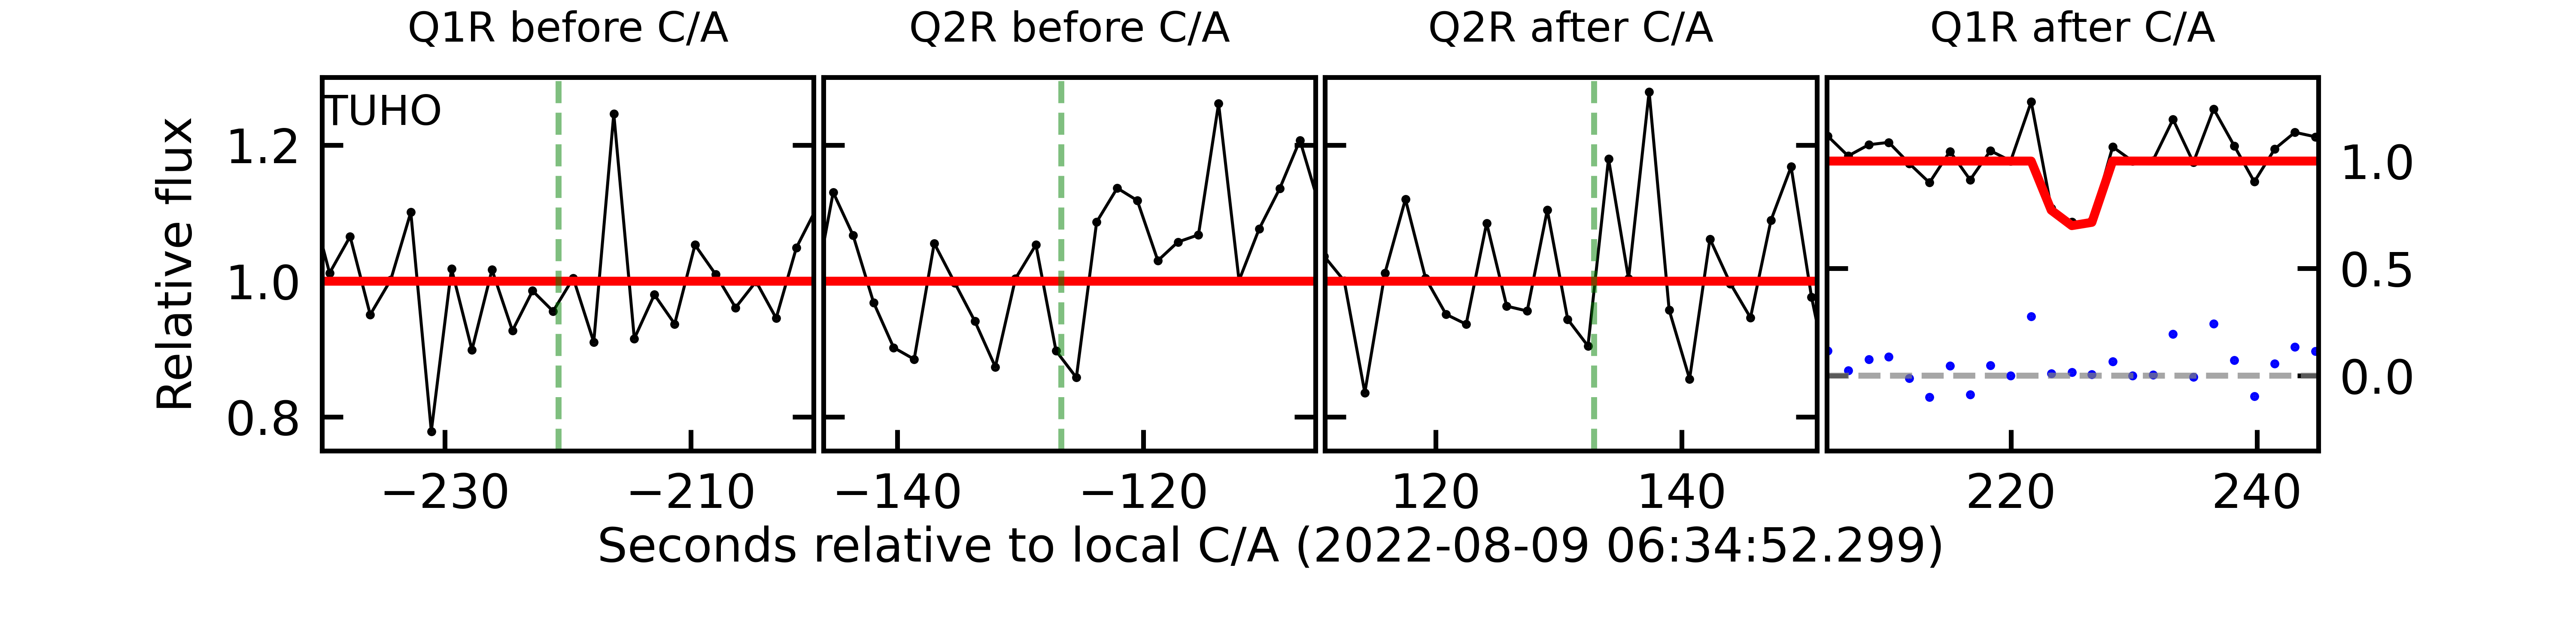
The Q1R ring was detected on both sides of the main body in the Gemini and CFHT light curves, and their physical properties were determined as described in Sect. 3. Although the detections of the dense part of the Q1R in the Gemini and CFHT light curves indicate the presence of diffuse material around the ring, the quality of the TAOS II and TUHO light curves only allows for the narrow and dense part of the ring to be detected. Therefore, the parameters and were determined by the square box model for these data.
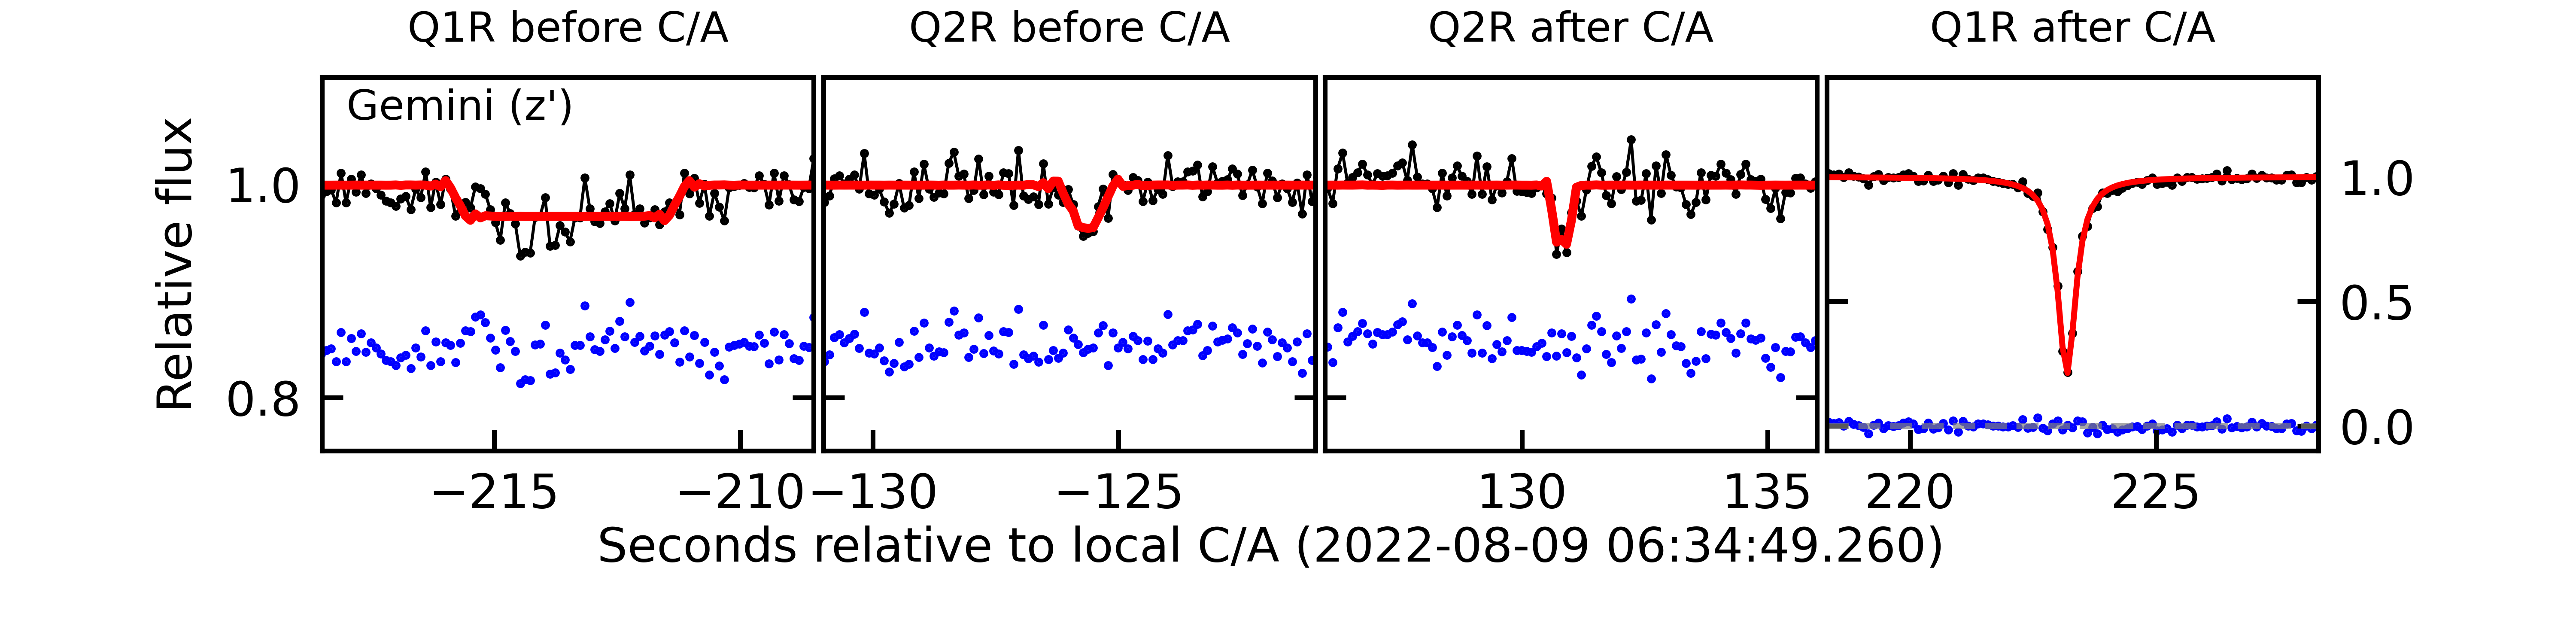
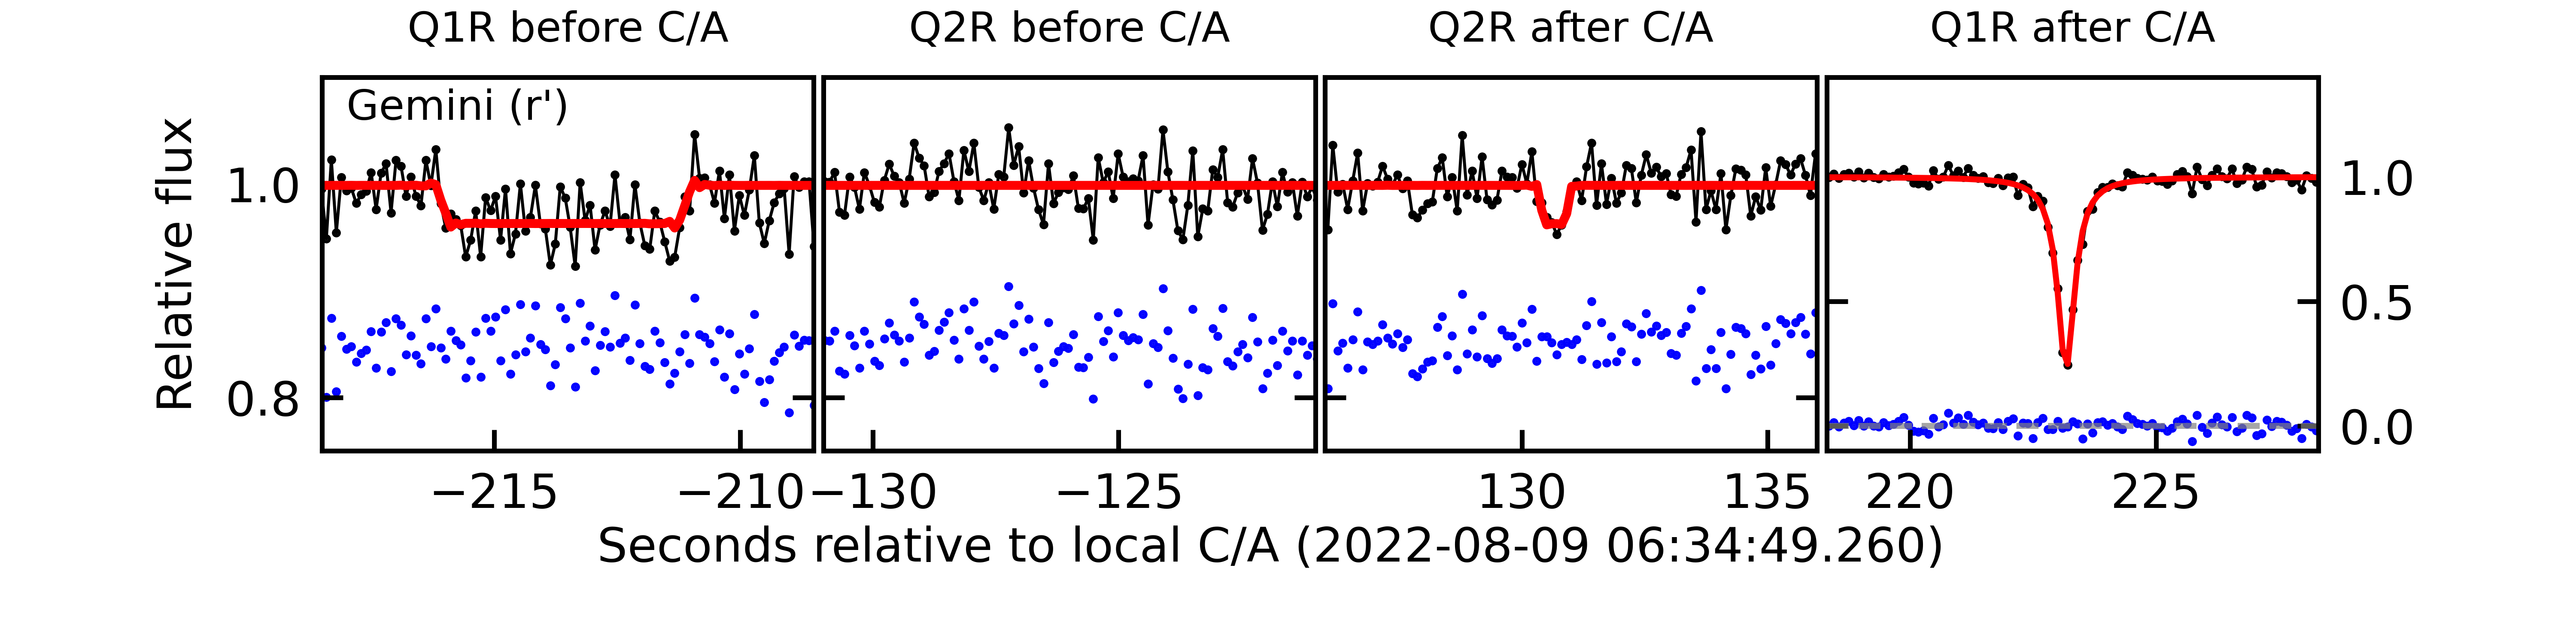
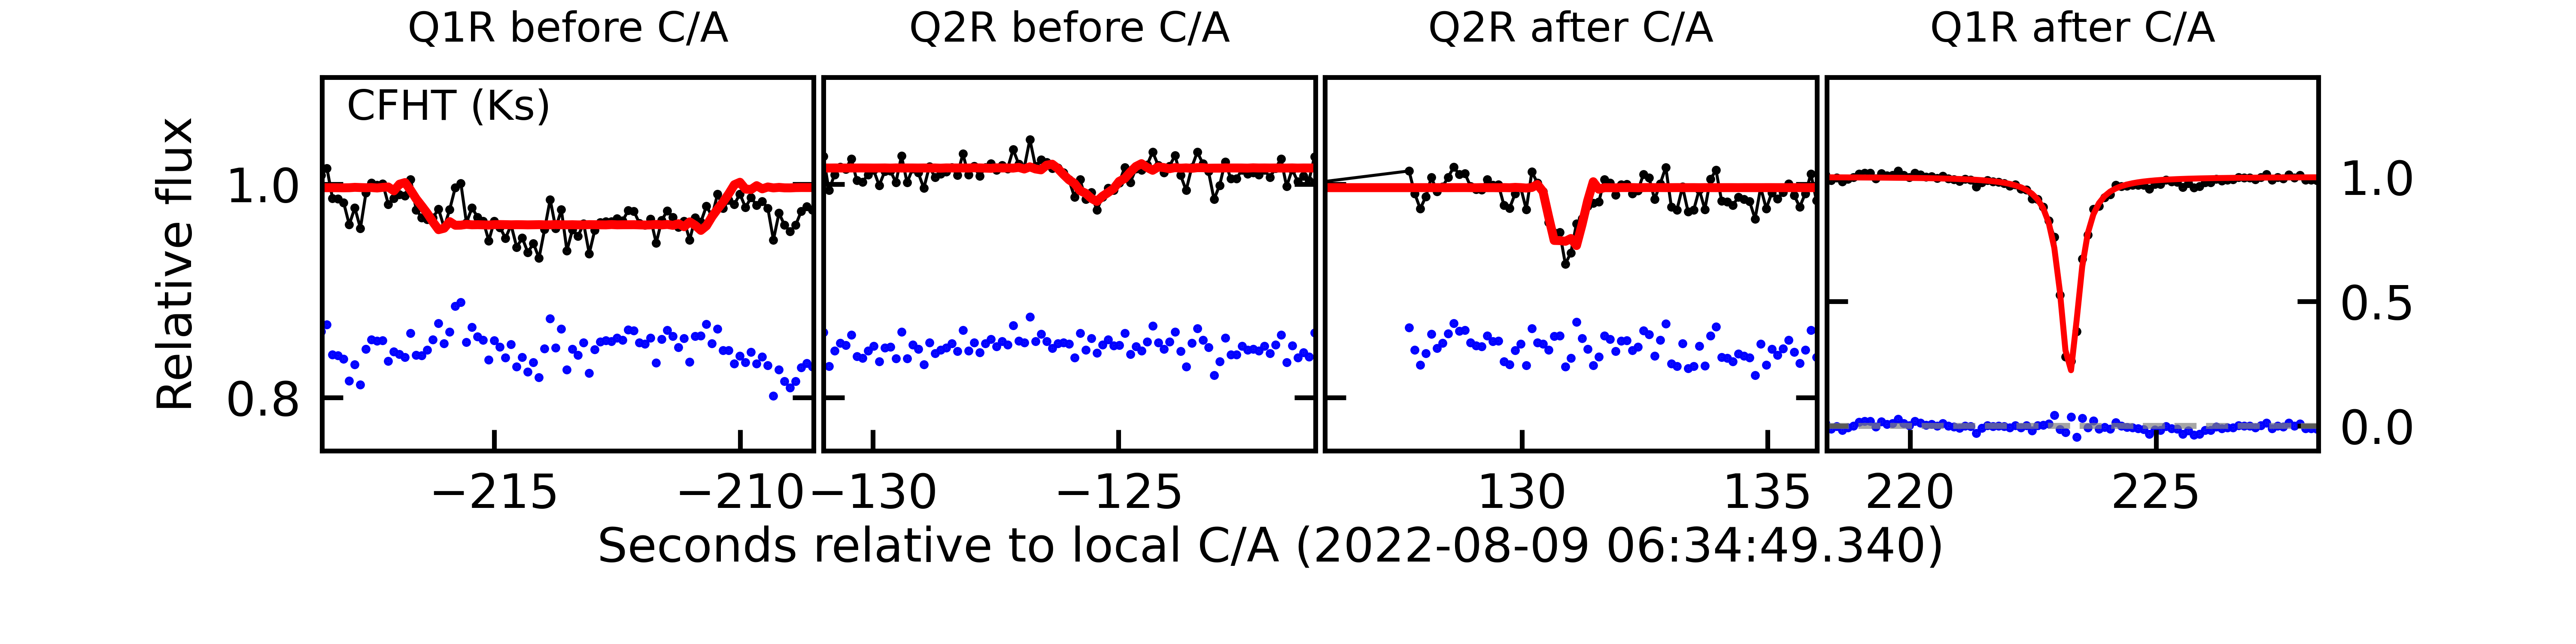
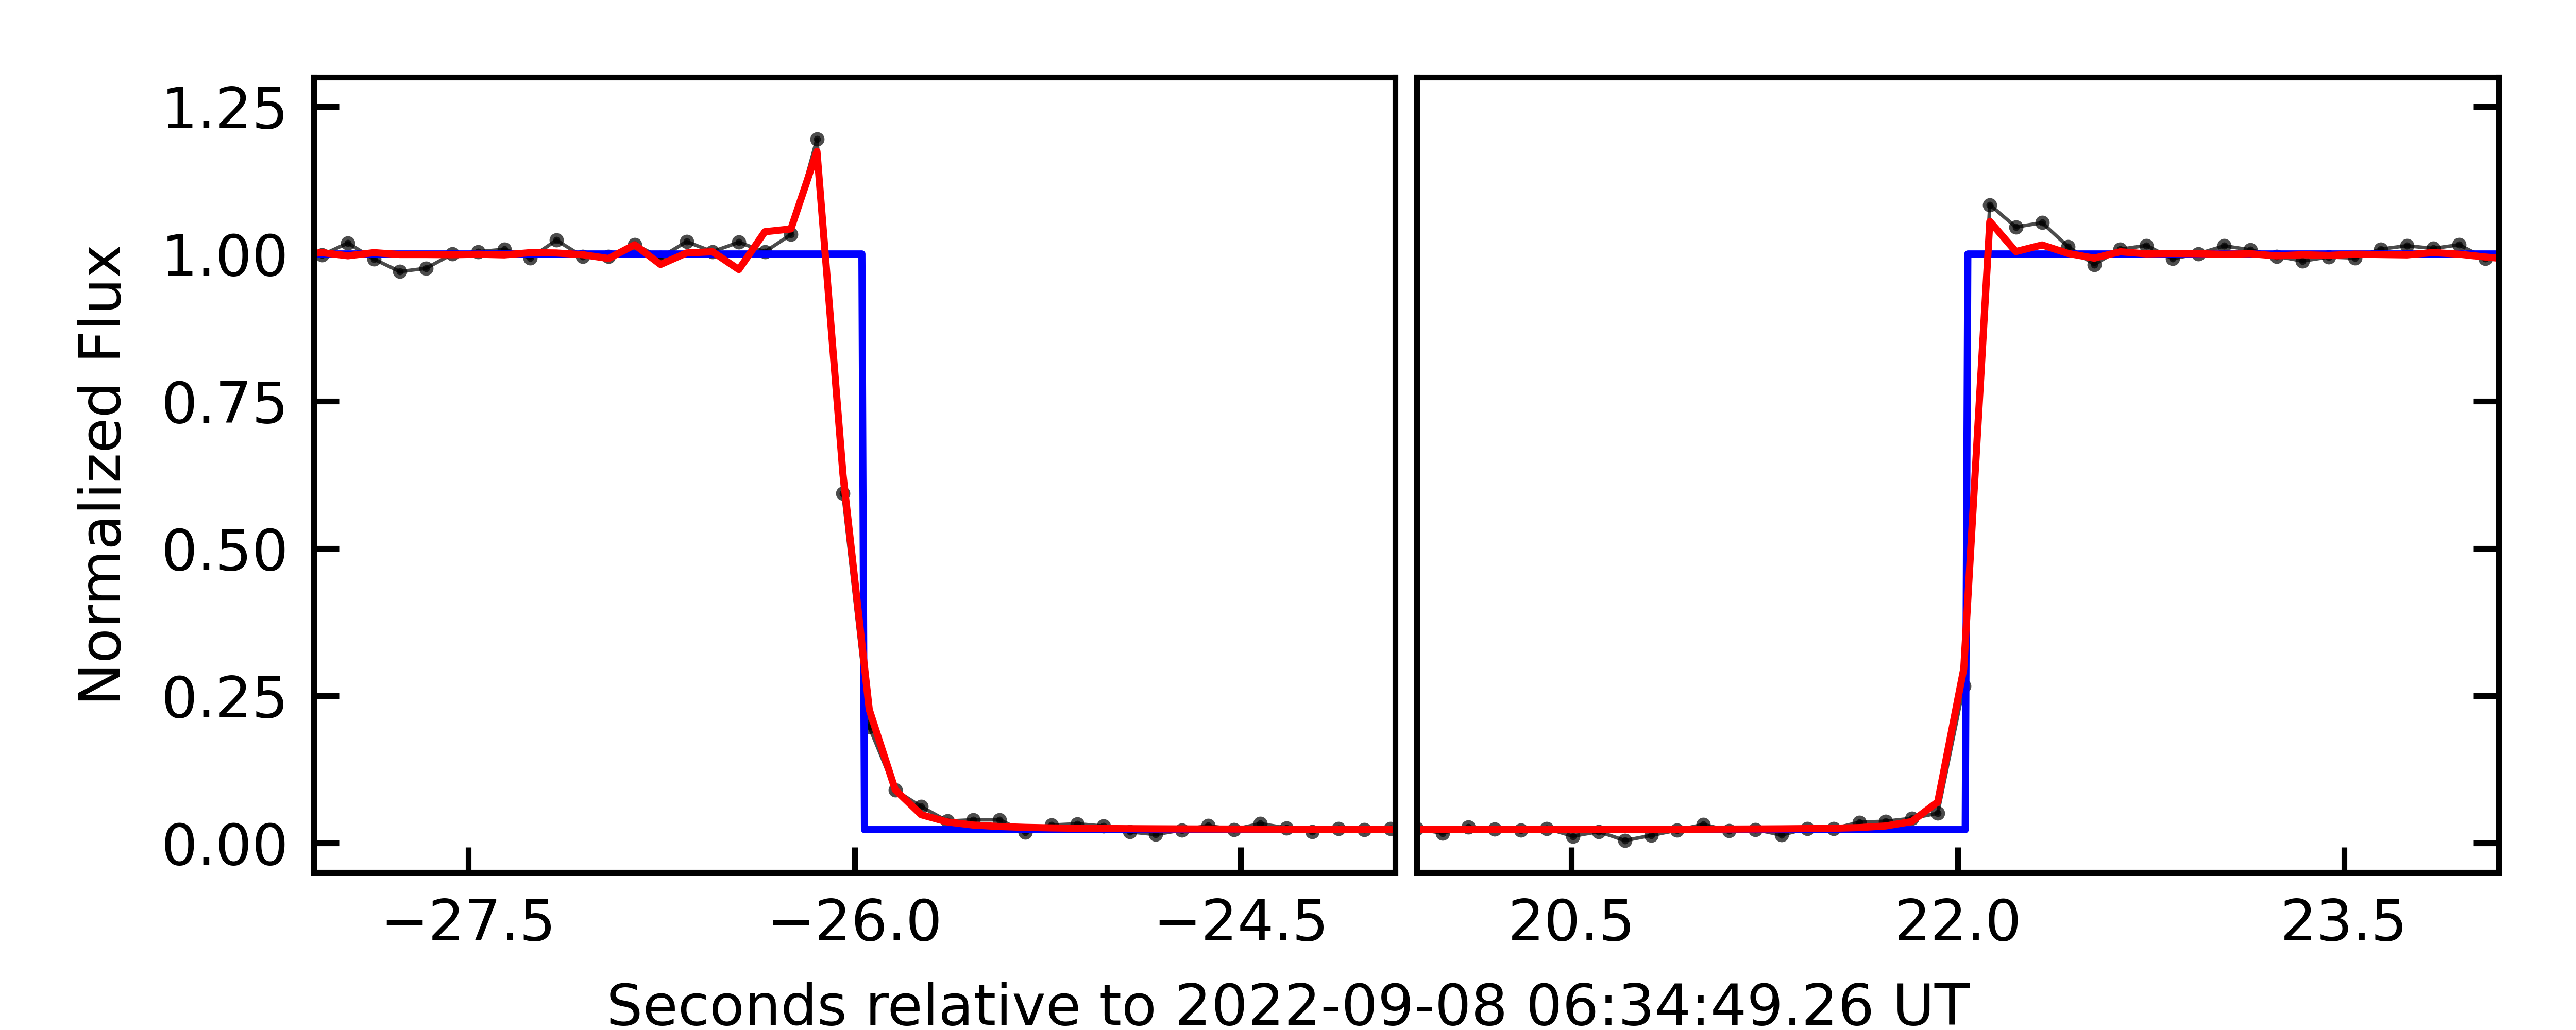
Due to the low optical depth of the Q1R segment intercepted before the closest approach, only the light curves obtained at Gemini and CFHT have sufficient S/N for detection (see an example in Fig. 1 and more details in Figs. 2, 7, 8, and 9). The Gemini detection in the r’ bandpass seems more sharply defined than its counterpart in z’, but this effect remains marginal considering the S/N. The CFHT light curve shows a drop simultaneously, but it may be affected by a seeing deterioration that compromises an accurate determination of the ring boundaries. Even so, the central times of the Gemini and CFHT detections are all consistent at the 1- level. The parameters of Q1R for all the detections are presented in Table 7.
We have combined the data from this work and the previous observations to improve the Q1R orbital parameters, assuming a fixed ring pole orientation between 2018 and 2022, as per Morgado et al. (2023). We tested a range of pole orientations and ring radii using a statistic, resulting in two complementary solutions presented in Table 4. The preferred solution has a per degree of freedom and shows a better agreement with observations than the mirror solution with . Moreover, the preferred solution is co-planar with Weywot’s orbit to within deg, as expected from a primordial disk surrounding Quaoar that evolved into a ring and formed its satellite, while the mirror solution is inclined by degrees with respect to Weywot’s orbit.
The position angles of Quaoar’s projected pole ( deg) and Q1R ( deg) are misaligned by 5 degrees (Table 4). Thus, our results are consistent with Q1R orbiting close to Quaoar’s equatorial plane, assuming that the body is an oblate spheroid. Part of this misalignment could stem from the fact that Quaoar is a triaxial ellipsoid (or a body with a more complex shape). Hence, the position angle of Quaoar’s limb does not necessarily coincide with the position angle of Quaoar’s pole.
4.3 The discovery of a new ring around Quaoar
The unique photometric quality of the Gemini and CFHT data allowed for the detection of additional material around Quaoar (Fig. 1). These data sets reveal additional secondary events symmetrically located with respect to Quaoar (Fig. 2). Two such events are simultaneously detected in the Gemini z’-band and CFHT Ks-band light curves before the closest approach, with detections reaching around 5.5 and 5.2, respectively. Conversely, the light curves display simultaneous events after the closest approach with significant detections, standing at 5.7, 3.7, and 4.7 for the Gemini z’, Gemini r’, and CFHT data sets, respectively. Assuming that the light curves have a normal distribution, the probability that individual points of equivalent width E km occur randomly in each light curve is , with p approaching zero for values larger than Ep. While the two light curves of the Gemini instrument may be correlated as they were taken at the same telescope, the Gemini and CFHT data are independent in terms of fast-seeing fluctuations. Using Poisson statistics, we estimate that the probability that the simultaneous events in the Gemini and CFHT data occur randomly due to the seeing fluctuations is very low, with .
Some dips in flux were observed in the vicinity of Q2R detection in the region after the closest approach (Fig. 2). These detections are at the detection limit of our data, so we cannot say whether these are due to seeing variations or additional structures. Furthermore, we do not observe counterparts of these dips in the region before the closest approach.
5 Discussion and conclusions
The stellar occultation of August 9, 2022 provided nine effective occultation chords obtained in Hawaii, Mexico, and the continental United States. They constrained Quaoar’s shape, providing an apparent semi-major axis of km, an apparent oblateness , and an area-equivalent radius of km. Using an absolute magnitude of (Fornasier et al. 2013), this yields a geometric albedo of . Our value of differs from that of Braga-Ribas et al. (2013), km, by about 12 km, that is, at the 4- level. This difference could be evidence that Quaoar is not an oblate spheroid, but rather a triaxial ellipsoid or a body with a more complex shape; alternatively, it may be caused by a change in the aspect-angle since 2011, as observed from Earth.
The continuous region and the dense part of Q1R were detected during this event. The dense part was radially resolved and showed a Lorentzian profile reminiscent of Saturn’s F ring (Bosh et al. 2002) or Neptune’s ring arcs (Nicholson et al. 1990; Sicardy et al. 1991). This contrasts with the sharp edges observed for Chariklo’s main ring C1R (Bérard et al. 2017; Morgado et al. 2021). The dense part of Q1R is detected over a radial width of 60 km with a peak optical depth of , an FWHM Lorentzian width of 5 km and an equivalent width of around 2 km (see Table 7). The values presented here are more precise than (but consistent with) those published by Morgado et al. (2023).
The detections of the dense part of Q1R in 2021 imply a minimum arc length of 365 km, corresponding to an azimuthal extension of about 5.1 degrees (Morgado et al. 2023). The detections from CFHT, Gemini, TUHO, and TAOS II in 2022 (Figs. 8, 9) suggest a minimum arc-length of 226 km or 3.2 degrees. Since 2011, we have obtained 19 cuts of the Q1R with a sufficient S/N to detect the densest region. The limited azimuthal extent of the two detections of the dense regions means that they could both be parts of the same arc-like structure. If this structure was detected two times among the 19 cuts, then its extent can be estimated using Poisson statistics. This analysis yields an arc length with a 70% chance of falling between 18 and 72 degrees. In this case, all of the detections in either 2021 or 2022 would each be correlated samples of one part of this arc.
The more tenuous component of Q1R is radially resolved and shows no marked structures, being consistent with a square model within our S/N limits. The best light curves (Gemini and CFHT) provide a typical width of 80-100 km and a typical normal optical depth of 0.003 (and, thus, an equivalent width of 0.3 km) for that component at the longitude where it was detected (Table 7).
Our detections, combined with those reported by Morgado et al. (2023), improved the orbital elements of Q1R. They are consistent with a circular ring of radius km (Table 4) corresponding to about 7.5 Quaoar’s area-equivalent radius . This value coincides with the 6/1 MMR with Weywot ( km) and within 3- of the 1/3 SOR with Quaoar ( km), considering the double-peaked rotation period of h (Ortiz et al. 2003).
Our preferred solution for Q1R’s orbital pole is consistent with this ring being co-planar with Weywot’s orbit. Moreover, the apparent semi-major axes of Quaoar’s limb and Q1R’s orbit are aligned at the 4- level, suggesting that Q1R lies in Quaoar’s equatorial plane, as expected from a colliding ring system (Kokubo et al. 2000).
Our data reveal a new ring (Q2R) around Quaoar. The detections are consistent with a circular ring of radius km co-planar with Q1R (Table 4, Figs. 2 and 3). It has a typical width of 10 km, an optical depth of about 0.004, and an equivalent depth of about 0.04 km (see accurate values in Table 7). Although closer to Quaoar than Q1R, Q2R is at 4.6 Quaoar’s radius, also outside Quaoar’s Roche limit, which is estimated to be around 1,780 km, assuming the ring particle density as (Morgado et al. 2023).
Using previously determined values for Quaoar’s mass and rotation period (Table 3), we derived a 5/7 SOR radius of km. This coincides with Q2R’s radius, km, to within the 1- error bars. Like the 1/3 SOR, the 5/7 SOR is a second-order resonance and, as such, may play an essential role in the confinement of Q2R. However, more solid determinations of Q2R’s orbit and Quaoar’s shape are required.
Table 7 shows that differences in the equivalent widths of Q1R and Q2R are observed between the z’, r’, and Ks filters. The significance and interpretation of these differences require more analysis and will be discussed in a forthcoming publication. Moreover, the high S/N obtained at Gemini and CFHT will be used to detect or put a stringent upper limit on a putative atmosphere. Finally, the comparison of past (and possibly future) results derived from multi-chord occultations by Quaoar’s main body will be used to constrain its shape better. This will be important for better understanding the dynamics of Quaoar’s ring system, particularly under the effect of spin-orbit resonances with the body.
Acknowledgements.
C.L.P is thankful for the support of the CAPES and FAPERJ/DSC-10 (E26/204.141/2022). This work was carried out within the “Lucky Star” umbrella that agglomerates the efforts of the Paris, Granada, and Rio teams, funded by the European Research Council under the European Community’s H2020 (ERC Grant Agreement No. 669416). This study was financed in part by the National Institute of Science and Technology of the e-Universe project (INCT do e-Universo, CNPq grant 465376/2014-2). This study was financed in part by CAPES - Finance Code 001. The following authors acknowledge the respective CNPq grants: B.E.M. 150612/2020-6; F.B.R. 314772/2020-0; R.V.M. 307368/2021-1; M.A. 427700/2018-3, 310683/2017-3, 473002/2013-2; J.I.B.C. 308150/2016-3, 305917/2019-6. R.C.B acknowledge the FAPERJ grant E26/202.125/2020. E.F.-V. acknowledges financial support from the Florida Space Institute and the Space Research Initiative. J.L.O., P.S-S., M.V-L, and M. K. acknowledge financial support from the grant CEX2021-001131-S funded by MCIN/AEI/ 10.13039/501100011033, they also acknowledge the financial support by the Spanish grants PID2020-112789GB-I00 from AEI and Proyecto de Excelencia de la Junta de Andalucía PY20-01309. Funding for RECON was provided by grants from USA: NSF AST-1413287, AST-1413072, AST-1848621, and AST-1212159. We thank RECON observers Doug Thompson, Ken Conway, Dorey Conway, Terry Miller, David Schulz, Michael von Schalscha, and Matt Christensen for their efforts in collecting data. Based on observations obtained with WIRCam, a joint project of CFHT, Taiwan, Korea, Canada, France, at the Canada-France-Hawaii Telescope (CFHT) which is operated from the summit of Maunakea by the National Research Council of Canada, the Institut National des Sciences de l’Univers of the Centre National de la Recherche Scientifique of France, and the University of Hawaii. The observations at the Canada-France-Hawaii Telescope were performed with care and respect from the summit of Maunakea which is a significant cultural and historic site. We thank Marc Baril and Tom Vermeulen for their time dedicated to the observation performed at Canada-France-Hawaii Telescope (CFHT). Based on observations obtained at the international Gemini Observatory, a program of NSF’s NOIRLab, which is managed by the Association of Universities for Research in Astronomy (AURA) under a cooperative agreement with the National Science Foundation on behalf of the Gemini Observatory partnership: the National Science Foundation (United States), National Research Council (Canada), Agencia Nacional de Investigación y Desarrollo (Chile), Ministerio de Ciencia, Tecnología e Innovación (Argentina), Ministério da Ciência, Tecnologia, Inovações e Comunicações (Brazil), and Korea Astronomy and Space Science Institute (Republic of Korea). This work made use of data from GN-2022B-DD-101 observing program and were obtained with the High-Resolution Imaging instrument(s) ‘Alopeke (and/or Zorro). ‘Alopeke (and/or Zorro) was funded by the NASA Exoplanet Exploration Program and built at the NASA Ames Research Center by Steve B. Howell, Nic Scott, Elliott P. Horch, and Emmett Quigley. ‘Alopeke (and/or Zorro) was mounted on the Gemini North (and/or South) telescope of the international Gemini Observatory, a program of NSF’s NOIRLab, which is managed by the Association of Universities for Research in Astronomy (AURA) under a cooperative agreement with the National Science Foundation. This work was enabled by observations made from the Gemini North telescope, located within the Maunakea Science Reserve and adjacent to the summit of Maunakea. We are grateful for the privilege of observing the Universe from a place that is unique in both its astronomical quality and its cultural significance. This research used sora, a python package for stellar occultations reduction and analysis, developed with the support of ERC Lucky Star and LIneA/Brazil, within the collaboration of Rio-Paris-Granada teams. This work profited from unpublished occultations by Quaoar made at SOAR (SO2019A-003) and the Pico dos Dias Observatory (OP2019A-004) to improve the accuracy of the ephemeris NIMAv16.References
- Assafin et al. (2011) Assafin, M., Vieira Martins, R., Camargo, J. I. B., et al. 2011, in Gaia Follow-up Network for Solar System Objects, 85
- Bérard et al. (2017) Bérard, D., Sicardy, B., Camargo, J. I. B., et al. 2017, AJ, 154, 144
- Bosh et al. (2002) Bosh, A. S., Olkin, C. B., French, R. G., & Nicholson, P. D. 2002, Icarus, 157, 57
- Braga-Ribas et al. (2013) Braga-Ribas, F., Sicardy, B., Ortiz, J. L., et al. 2013, ApJ, 773, 26
- Braga-Ribas et al. (2014) Braga-Ribas, F., Sicardy, B., Ortiz, J. L., et al. 2014, Nature, 508, 72
- Butkevich & Lindegren (2014) Butkevich, A. G. & Lindegren, L. 2014, A&A, 570, A62
- Castelli & Kurucz (2003) Castelli, F. & Kurucz, R. L. 2003, in Modelling of Stellar Atmospheres, ed. N. Piskunov, W. W. Weiss, & D. F. Gray, Vol. 210, A20
- Cuzzi (1985) Cuzzi, J. N. 1985, Icarus, 63, 312
- Desmars et al. (2015) Desmars, J., Camargo, J. I. B., Braga-Ribas, F., et al. 2015, A&A, 584, A96
- Elliot et al. (1984) Elliot, J. L., French, R. G., Meech, K. J., & Elias, J. H. 1984, AJ, 89, 1587
- Fitzpatrick (1999) Fitzpatrick, E. L. 1999, PASP, 111, 63
- Fornasier et al. (2013) Fornasier, S., Lellouch, E., Müller, T., et al. 2013, A&A, 555, A15
- Gaia Collaboration et al. (2022) Gaia Collaboration, Vallenari, A., Brown, A. G. A., et al. 2022, Gaia Data Release 3: Summary of the content and survey properties
- Gomes-Júnior et al. (2022) Gomes-Júnior, A. R., Morgado, B. E., Benedetti-Rossi, G., et al. 2022, MNRAS, 511, 1167
- Johnson & McGetchin (1973) Johnson, T. & McGetchin, T. 1973, Icarus, 18, 612
- Kilic et al. (2022) Kilic, Y., Braga-Ribas, F., Kaplan, M., et al. 2022, MNRAS, 515, 1346
- Kokubo et al. (2000) Kokubo, E., Ida, S., & Makino, J. 2000, Icarus, 148, 419
- Lindegren et al. (2021) Lindegren, L., Klioner, S. A., Hernández, J., et al. 2021, A&A, 649, A2
- Morgado et al. (2019) Morgado, B., Benedetti-Rossi, G., Gomes-Júnior, A. R., et al. 2019, A&A, 626, L4
- Morgado et al. (2021) Morgado, B. E., Sicardy, B., Braga-Ribas, F., et al. 2021, A&A, 652, A141
- Morgado et al. (2023) Morgado, B. E., Sicardy, B., Braga-Ribas, F., et al. 2023, Nature, 614, 239–243
- Nicholson et al. (1990) Nicholson, P. D., Cooke, M. L., Matthews, K., Elias, J. H., & Gilmore, G. 1990, Icarus, 87, 1
- Ortiz et al. (2015) Ortiz, J. L., Duffard, R., Pinilla-Alonso, N., et al. 2015, A&A, 576, A18
- Ortiz et al. (2003) Ortiz, J. L., Gutiérrez, P. J., Sota, A., Casanova, V., & Teixeira, V. R. 2003, A&A, 409, L13
- Ortiz et al. (2017) Ortiz, J. L., Santos-Sanz, P., Sicardy, B., et al. 2017, Nature, 550, 219
- Puget et al. (2004) Puget, P., Stadler, E., Doyon, R., et al. 2004, in Society of Photo-Optical Instrumentation Engineers (SPIE) Conference Series, Vol. 5492, Ground-based Instrumentation for Astronomy, ed. A. F. M. Moorwood & M. Iye, 978–987
- Roques et al. (1987) Roques, F., Moncuquet, M., & Sicardy, B. 1987, AJ, 93, 1549
- Ruprecht et al. (2015) Ruprecht, J. D., Bosh, A. S., Person, M. J., et al. 2015, Icarus, 252, 271
- Salo et al. (2021) Salo, H., Sicardy, B., Mondino-Llermanos, A., et al. 2021, in European Planetary Science Congress, EPSC2021–338
- Scott et al. (2021) Scott, N. J., Howell, S. B., Gnilka, C. L., et al. 2021, Frontiers in Astronomy and Space Sciences, 8, 138
- Sicardy et al. (1991) Sicardy, B., Roques, F., & Brahic, A. 1991, Icarus, 89, 220
- Sicardy et al. (2021) Sicardy, B., Salo, H., Souami, D., et al. 2021, in European Planetary Science Congress, EPSC2021–91
- Sickafoose et al. (2020) Sickafoose, A. A., Bosh, A. S., Emery, J. P., et al. 2020, MNRAS, 491, 3643
- Takeda & Ida (2001) Takeda, T. & Ida, S. 2001, ApJ, 560, 514
- Vachier et al. (2012) Vachier, F., Berthier, J., & Marchis, F. 2012, A&A, 543, A68
- Zacharias et al. (2004) Zacharias, N., Monet, D. G., Levine, S. E., et al. 2004, in American Astronomical Society Meeting Abstracts, Vol. 205, American Astronomical Society Meeting Abstracts, 48.15
Appendix A Main body occultation and elliptical fit
The light curves obtained with the Gemini and CFHT telescopes present prominent diffraction signatures in the main body occultation mainly due to the high acquisition rate, the large wavelength, and high S/N of the light curves. During the occultation, Quaoar was at a geocentric distance of 41.983157 au, implying a Fresnel scale, , from 1.5 to 2.6 km, for visible to near-infrared (CFHT Ks-band) wavelengths, respectively. Considering the apparent velocity of the event as 17.57 km s-1 and the acquisition rate of the Gemini and CFHT instruments, we obtained a spatial resolution of these light curves of 1.8 km. These high-S/N light curves have a Fresnel diffraction effect on the same order of magnitude as the instrumental response (e.g., the integration time).
| Site | Ingress | Egress |
|---|---|---|
| (hh:mm:ss.s) | (hh:mm:ss.s) | |
| CFHT | 06:34:23.34 (0.02) | 06:35:11.42 (0.01) |
| Gemini (z’) | 06:34:23.29 (0.01) | 06:35:11.29 (0.01) |
| Gemini (r’) | 06:34:23.27 (0.03) | 06:35:11.28 (0.02) |
| TUHO | 06:34:23.5 (0.2) | 06:35:18.1 (0.2) |
| TAOS II | 06:30:38.3 (0.2) | 06:31:35.1 (0.1) |
| Dunrhomin | 06:30:03.3 (0.4) | 06:31:02.8 (0.9) |
| Sommers-Bausch | 06:30:02.6 (0.2) | 06:31:03.8 (0.5) |
| UCSC | 06:31:20.3 (0.1) | 06:32:00.9 (0.1) |
| Nederland | 06:30:03.4 (0.5) | 06:31:04.4 (0.8) |
| Bonny Doon | 06:31:20.7 (0.4) | 06:32:01.3 (0.4) |
With the limb-darkened angular diameter of the star estimated and considering the observation band pass and its FWHM, we also fit the local normal velocity (). By minimizing the statistic, we found the velocity and the ingress (egress) time that best explained the observed light curve. This was applied to the Gemini z’-band data since this was our best light curve. The radial velocities obtained are = 10.2 km s-1 and = 16.6 km s-1 for ingress and egress instants, respectively. The separation between the chords obtained from the Gemini and CFHT when projected onto the sky plane was about 160 meters, a value smaller than the star’s apparent diameter. Therefore, the velocities were considered the same at both sites. This procedure resulted in an optimal fit for both diffraction spikes and the baseline occultation by the main body. Figure 4 presents an example of this fit with the Gemini z’ light curve plotted with the modeled curve.
Ingress and egress times for the main body occultation are presented in Table 5. The instant uncertainties of the Gemini and CFHT light curves are limited by occultation modeling, not data quality. The elliptical fit parameters to the chord extremities are presented in Fig. 5.
Appendix B Observational circumstances
The observational circumstances for this occultation campaign are presented in Table 6. We present in this work the analysis of ten data sets with positive detections for the main body, of which four are detections of the Q1R ring and three are detections of both the Q1R and Q2R rings. In addition, we have more eighteen sites that participated in the observation campaign, but reported cloudy skies. The target star was too faint for the setup in Woodside (CA, US) and Summerland BC, CA, even with 4 and 3 seconds of exposure, respectively; in addition, the Summerland data was acquired while clouds were drifting through the field.
| Longitude [∘ ’ ”] | Aperture (mm) | Exp. Time | Status | ||
|---|---|---|---|---|---|
| Site | Latitude [∘ ’ ”] | Observers | Detector | Cycle | Light curve |
| Altitude [m] | Filter | (s) | Dispersion | ||
| CFHT | -155 28 07.93 | H. Januszewski | 3,580 | 0.113 | Positive |
| MaunaKea | 19 49 31.01 | M. Baril, B. Epinat | WIRCam | 0.113 | 0.013 |
| HI, US | 4,206.1 | T. Vermeulen | Ks | ||
| Gemini-North | -155 28 08.6 | T. Seccull | 8,100 | 0.100 | Positive |
| MaunaKea | 19 49 26 | A. Stephens | ’Alopeke | 0.101 | z’: 0.012 |
| HI, US | 4,213 | r’ & z’ | r’: 0.022 | ||
| TUHO | -156 15 27 | E. Tatsumi | 600 | 1.500 | Positive |
| Haleakala | 20 42 25.14 | F. Yoshida | ASI178MM | 1.634 | 0.098 |
| HI, US | 3,051.8 | M. Kagitani | None | ||
| TAOS II | -115 27 47.88 | J. H. Castro-Chacón | 1,300 | 0.200 | Positive |
| San Pedro Martir | 31 02 36.26 | S. Sánchez-Sanjuán | Andor Ixon 888 | 0.205 | 0.274 |
| BC, MX | 2,824.8 | None | |||
| Dunrhomin Obs. | -105 09 46.57 | 280 | 2 | Positive | |
| Longmont | 40 15 08.46 | M. Buie | QHY174M-GPS | 2 | 0.229 |
| CO, US | 1,592.8 | None | |||
| Sommers-Bausch Obs. | -105 15 47.09 | J. Keller | 508 | 0.9 | Positive |
| Boulder | 40 00 13.32 | J. Johnston | QHY174M-GPS | 0.9 | 0.259 |
| CO, US | 1,645 | None | |||
| -105 26 44.05 | M. Skrutskie | 200 | 2 | Positive | |
| Nederland | 39 59 13.95 | A. Verbiscer | QHY174M-GPS | 2 | 0.313 |
| CO, US | 2,492.6 | 570 nm | |||
| Bonny Doon Eco Reserve | -122 08 18.62 | 203 | 0.260 | Positive | |
| Santa Cruz | 37 03 03.12 | K. Bender | Watec 910HX/RC | 0.260 | 0.538 |
| CA, US | 488.4 | None | |||
| UCSC | -122 04 46.20 | 203 | 0.500 | Positive | |
| Santa Cruz | 37 01 03.47 | R. Nolthenius | Watec 910HX/RC | 0.534 | 0.556 |
| CA, US | 344.0 | None | |||
| -119 40 12 | 457 | 3 | |||
| Summerland | 49 36 00 | D. Gamble | QHY174M-GPS | 3 | Negative |
| BC, CA | 485 | None | |||
| -122 15 30.0 | 114 | 4 | |||
| Woodside | 37 23 36.2 | F. Marchis | eVscope/IMX347 | 4 | Inconclusive |
| CA, US | 367 | None | |||
| Naylor Obs. | -76 53 43.48 | R. Kamin | 355.6 | 0.5 | |
| Harrisburg | 40 08 55.60 | R. Young | QHY174M-GPS | 0.5 | Overcast |
| PA, US | 181.6 | ||||
| Nikitin Home | -105 11 00.96 | 279.4 | 6 | ||
| Gunbarrel | 40 04 08.61 | V. Nikitin | QHY174-GPS | 6 | Overcast |
| CO, US | 1,594 | None | |||
| Van Vleck Obs. | -72 39 33.12 | K. McGregor | 610 | ||
| Middletown | 41 33 18.62 | S. Redfield | Apogee E2V | No data | Overcast |
| CT, US | 68.9 | Luminance | |||
| Skychariot | -74 58 49.28 | 406.4 | |||
| Shohola | 41 21 39.94 | M. Sproul | ASI1600MC | No data | Overcast |
| PA, US | 414.6 | None | |||
| NIRo - CAC | -87 22 31.08 | 508 | |||
| Lowell | 41 16 15.03 | A. W. Rengstorf | FLI PL09000 | No data | Overcast |
| IN, US | 195.7 | I |
| Longitude [∘ ’ ”] | Aperture (mm) | Exp. Time | Status | ||
|---|---|---|---|---|---|
| Site | Latitude [∘ ’ ”] | Observers | Detector | Cycle | Light curve |
| Altitude [m] | Filter | (s) | Dispersion | ||
| Jimginny Obs. | -88 07 0.00 | 356 | |||
| Naperville | 41 45 32.40 | R. Dunford | QHY174M-GPS | No data | Overcast |
| IL, US | 230 | None | |||
| Pine Mountain Obs. | -120 56 28.8 | S. Fisher | 610 | ||
| Bend | 43 47 30.3 | A. Luken | Andor Xyla | No data | Overcast |
| OR, US | 1,920 | None | |||
| Palomar Obs. | -116 51 53.5 | E. Fernandez-Valenzuela | 5,100 | ||
| San Diego | 33 21 21.5 | K.de Kleer | CHIMERA | No data | Overcast |
| CA, US | 1,712 | T. Marlin, M. Camarca | |||
| Westport Astronomical Obs. | -73 19 39.0 | 356 | |||
| Westport | 41 10 16.0 | K. D. Green | QHY174M-GPS | No data | Overcast |
| CT, US | 87 | None | |||
| -119 09 39 | 280 | ||||
| Yerington | 38 59 28 | M. Christensen | QHY174M-GPS | No data | Overcast |
| NV, US | 1,340 | None | |||
| -121 18 55 | 280 | ||||
| Bend | 44 03 29 | A-M. Eklund | QHY174M-GPS | No data | Overcast |
| OR, US | 1,105 | None | |||
| -114 37 40 | D. Thompson | 280 | |||
| Yuma | 32 41 34 | K. Conway | QHY174M-GPS | No data | Overcast |
| CA, US | 62 | D. Conway | None | ||
| -119 49 06 | 280 | ||||
| Reno | 39 32 42 | T. Stoffel | QHY174M-GPS | No data | Overcast |
| NV, US | 1,387 | None | |||
| -120 10 24 | T. Miller | 280 | |||
| Cedarville | 41 31 45 | D. Schulz | QHY174M-GPS | No data | Overcast |
| CA, US | 1,420 | None | |||
| -113 51 46 | C. Patrick | 305 | |||
| Kingman | 35 24 43 | K. Butterfield | QHY174M-GPS | No data | Overcast |
| AZ, US | 966 | 0.5 focal reducer | |||
| -116 45 29 | 280 | ||||
| Beatty | 36 54 04 | J. Heller | QHY174M-GPS | No data | Overcast |
| CA, US | 999 | None | |||
| -121 23 56 | 280 | ||||
| Burney | 41 02 45 | M. von Schalscha | QHY174M-GPS | No data | Overcast |
| CA, US | 1,012 | None | |||
| -119 44 59 | 304 | ||||
| Gardnerville | 38 56 29 | J. Bardecker | Watec 910-HX | No data | Overcast |
| NV, US | 1,449 | None |
Appendix C Occultation map
Figure 6 presents the stellar occultation map with all the sites involved in this campaign. The green dots mark the positive detections and orange dots are stations that reported cloudy weather. The white dot represents the Woodside observation with the eVscope where the event was not detected due to the low S/N of the data set. The continuous line represents the limit of the Quaoar’s shadow projected over the Earth. The dashed-lines represent the Q1R and Q2R projections, as annotated in the image.
Appendix D Light curves
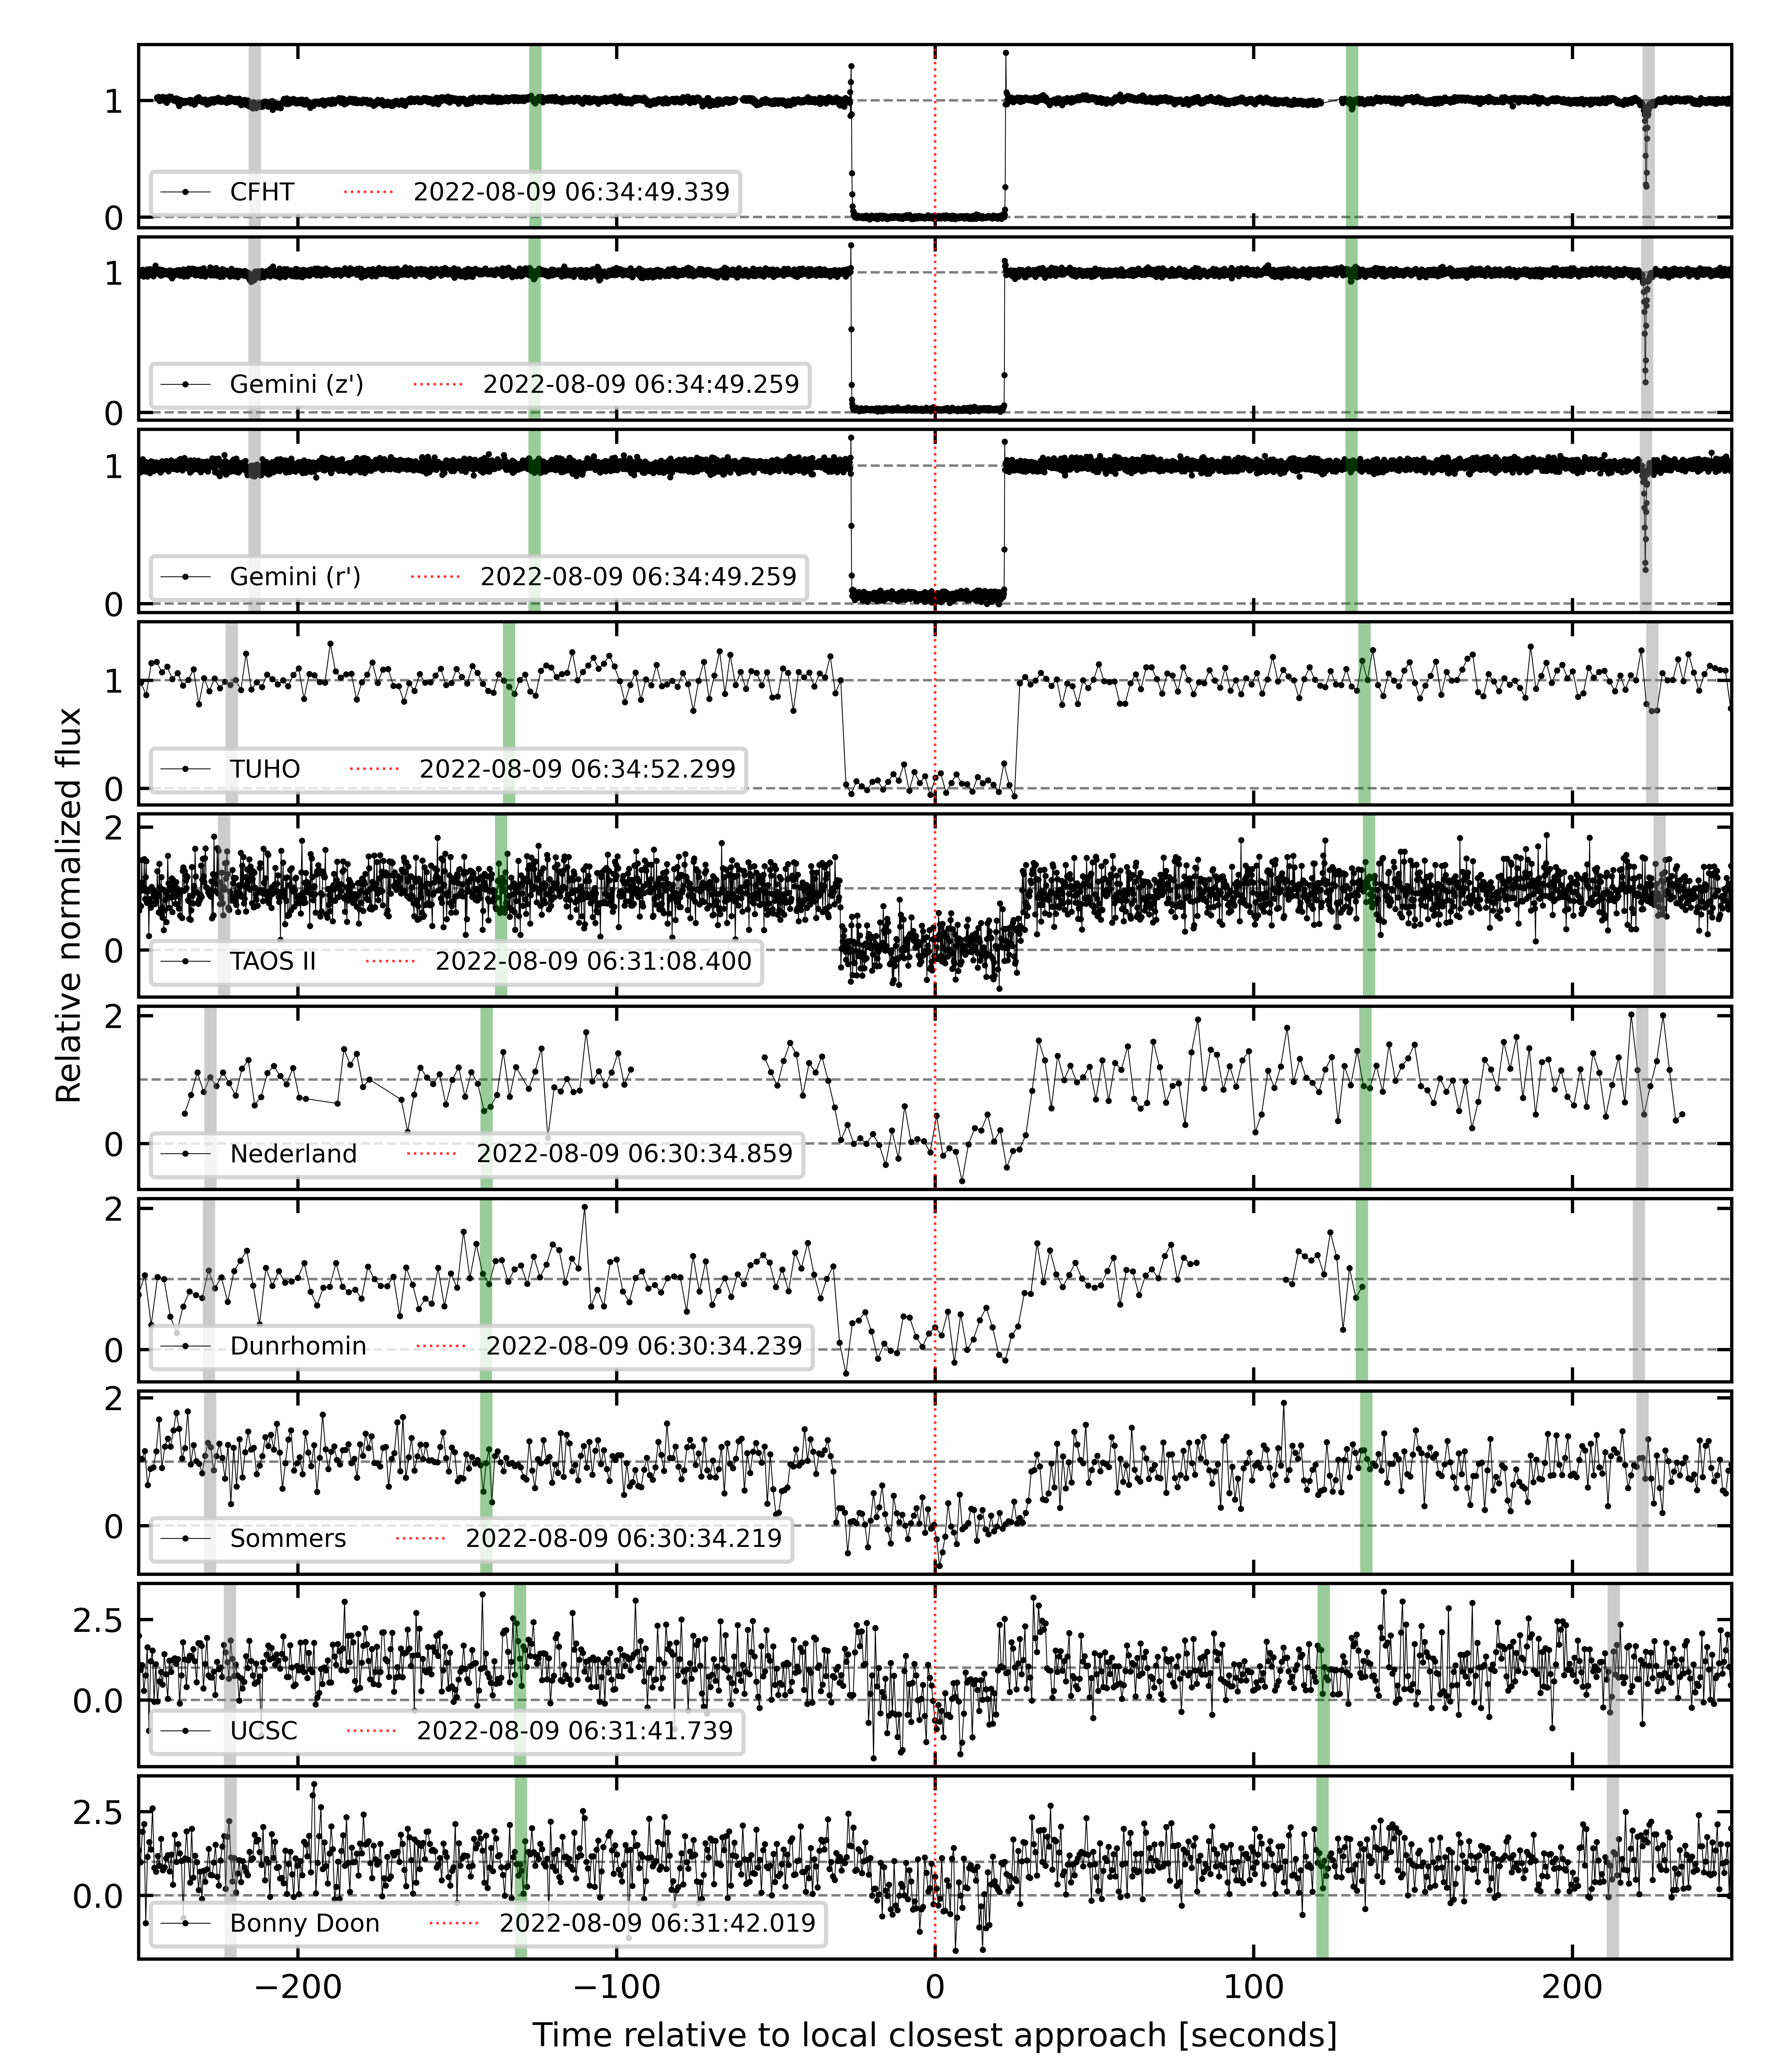
Figure 7 displays all the normalized light curves obtained during the stellar occultation by (50000) Quaoar of August 9, 2022. The stellar flux has been corrected for sky transparency fluctuations using reference stars. The time scale is relative to the closest approach time at each site. Besides the occultation by Quaoar and Q1R, the Gemini and CFHT light curves revealed the new Q2R ring. The Tohoku (TUHO) and TAOS II data allowed for the detection of the densest region of the Q1R ring. Due to the S/N limitations, the Nederland, Dunrhomin, Sommers-Bausch, UCSC, and Bonny Doon stations detected only the occultation by the main body. Some data sets presented dropped frames during the photometric process, such as the Durhomin and Nederland. This occurred due to the degradation of the sky quality shortly after the occultation of the main body, in addition to clouds crossing the field of view of the telescope.
We noticed that the Gemini and CFHT light curves were misaligned in time, probably caused by an offset in the Gemini data. As we have a reliable time source for the CFHT data, we aligned the centers of these chords by applying an offset of seconds on the Gemini chord, obtaining values of closer to 1. Although very close, this result is slightly better than applying an offset to the CFHT chord.
Appendix E Modeled ring detections
The ring events were fit using the models described in Elliot et al. (1984) and Bérard et al. (2017), that is, square boxes with uniform opacity and sharp edges. As with the main body occultation modeling, the modeled curve was convolved with observation bandpass, apparent star diameter, and instrumental response, but now fitting an opacity for the square box. The outputs of a given fit are the width, , of the event, its apparent opacity, (corresponding to the depth of the observed stellar flux drop), and its apparent optical depth, . The geometry of the ring (assumed here to be circular) is defined by its opening angle, , and the position angle, , of its apparent semi-minor axis, counted positively from local celestial north to the celestial east direction. This provides the radial width, , the normal opacity, , and the normal optical depth, , of the ring from each event. The factor of 2 in the formula for is due to the fact that Airy diffraction by individual ring particles results in a loss of light, resulting in an observed optical depth to be twice as large as would be measured at the ring level; see more details in Cuzzi (1985); Roques et al. (1987). We note that the formulae for and are valid only for mono-layer and poly-layer rings, respectively. The equivalent width (respectively, depth) (respectively, ) measures the amount of ring material that blocked the stellar rays in the mono-layer (resp. poly-layer) case.
A Lorentzian function is fitted to the dense part of the Q1R in the Gemini and CFHT light curves, converted from flux to normal optical depth as a function of radial distance in the ring plane. The area under the curve equals the equivalent width, Aτ, of the ring, and the full-width half minimum (FWHM) gives us the approximate width of the ring’s core. The position of the function’s valley gives us the average radial distance between the ring and Quaoar’s center. The Ep value was obtained from the integral of the ring profile in the curve of the normal opacity, , as a function of the radial distance in the sky plane. This modeling considers the stellar apparent diameter of 1.33 km, which has negligible influence on the ring profile.
Figs. 8 and 9 present all light curves in which the Q1R and Q2R rings were detected. The TAOS II light curve, used for detecting of the densest region of the Q1R ring, was obtained by applying aperture photometry to stacked images in order to increase the S/N. Stacking was performed using Python routines built from the astropy library as described in Morgado et al. (2019), where each new image is the average of six original images, resulting in a temporal resolution of 1.2 seconds for each stacked image.
| Ring | Detection | Mid-time | ||||||
|---|---|---|---|---|---|---|---|---|
| August 9th, 2022 | (km) | (km) | (km) | (km) | ||||
| Q1R- ing | CFHT | 06:31:15.8 (0.2) | 4,009.9 (1.8) | 105.5 (5.6) | 0.0030 (0.0003) | 0.0030 (0.0003) | 0.31 (0.02) | 0.31 (0.02) |
| Gemini (z’) | 06:31:15.72 (0.04) | 3,995.4 (0.3) | 76.4 (0.8) | 0.0026 (0.0001) | 0.0026 (0.0001) | 0.20 (0.01) | 0.20 (0.01) | |
| Gemini (r’) | 06:31:15.7 (0.1) | 3,995.9 (0.8) | 85.8 (1.1) | 0.0032 (0.003) | 0.0032 (0.0003) | 0.28 (0.02) | 0.28 (0.02) | |
| Q1R- egr | CFHTa | 06:38:32.581 (0.003) | 4,123.69 (0.05) | 6.1 (0.1) | 0.330 (0.007) | 0.395 (0.009) | 2.01 (0.03) | 2.41 (0.04) |
| Gemini (z’)a | 06:38:32.444 (0.003) | 4,123.11 (0.02) | 5.3 (0.1) | 0.353 (0.008) | 0.417 (0.007) | 1.87 (0.02) | 2.21 (0.02) | |
| Gemini (r’)a | 06:38:32.429 (0.005) | 4,122.85 (0.04) | 5.1 (0.1) | 0.341 (0.009) | 0.398 (0.008) | 1.74 (0.03) | 2.03 (0.03) | |
| TUHO | 06:38:37.4 (0.7) | 4,107.2 (7.6) | 71 (17) | 0.03 (0.01) | 0.03 (0.01) | 2.3 (0.9) | 2.4 (1.1)) | |
| TAOS II | 06:34:55.8 (0.5) | 4,125.7 (4.4) | 34 (16) | 0.05 (0.02) | 0.05 (0.03) | 1.6 (1.1) | 1.7 (1.3) | |
| Q2R- ing | CFHT | 06:32:43.9 (0.2) | 2,490.4 (1.6) | 16.5 (3.0) | 0.0022 (0.0004) | 0.0022 (0.0004) | 0.036 (0.006) | 0.036 (0.006) |
| Gemini (z’) | 06:32:43.61 (0.06) | 2,493.8 (0.6) | 11.3 (0.8) | 0.0034 (0.0005) | 0.0034 (0.0005) | 0.038 (0.006) | 0.039 (0.006) | |
| Gemini (r’) | n.d.b | n.d.b | n.d.b | n.d.b | n.d.b | n.d.b | n.d.b | |
| Q2R- egr | CFHT | 06:37:00.20 (0.01) | 2,540.7 (0.1) | 10.8 (0.2) | 0.0049 (0.0003) | 0.0049 (0.0003) | 0.052 (0.001) | 0.053 (0.001) |
| Gemini (z’) | 06:37:00.09 (0.02) | 2,540.45 (0.1) | 6.3 (0.3) | 0.0047 (0.0005) | 0.0048 (0.0006) | 0.030 (0.002) | 0.030 (0.002) | |
| Gemini (r’) | 06:36:59.93 (0.02) | 2,528.3 (1.1) | 9.1 (2.5) | 0.003 (0.001) | 0.003 (0.001) | 0.030 (0.008) | 0.030 (0.008) |