Evolution of matter and galaxy clustering in cosmological hydrodynamical simulations
Abstract
\textcolorblackWe quantify the evolution of matter and galaxy clustering in cosmological hydrodynamical simulations via correlation and bias functions of matter and galaxies. We use simulations TNG100 and TNG300 with epochs from to . We calculate spatial correlation functions (CF) of galaxies, , for simulated galaxies and dark matter (DM) particles to characterise the evolving cosmic web. We find that bias parameters decrease during the evolution, confirming earlier results. Bias parameters of the lowest luminosity galaxies, , estimated from CFs are lower relative to CFs of particle density-limited clustered samples of DM. At low and medium luminosities, bias parameters of galaxies are equal, suggesting that dwarf galaxies reside in the same filamentary web as brighter galaxies. We find that bias parameters , estimated from CFs of clustered DM, agree with the expected values from the fraction of particles in the clustered population, . The cosmic web contains filamentary structures of various densities, and fractions of matter in the clustered and the unclustered populations are both less than unity. Thus the CF amplitude of the clustered matter is always higher than for all matter, i.e. bias parameter must be . Differences between CFs of galaxies and clustered DM suggest that these functions describe different properties of the cosmic web.
keywords:
Cosmology: large-scale structure of the universe; Cosmology: dark matter; Cosmology: theory; Methods: numerical1 Introduction
The clustering of galaxies and matter and their evolution are central problems of cosmology. Differences in the distribution of galaxies and matter were noticed already in early studies by Jõeveer et al. (1978); Jõeveer & Einasto (1978), Gregory & Thompson (1978) and Tully & Fisher (1978), who showed that galaxies have filamentary distribution with large regions devoid of galaxies. Numerical simulations by Doroshkevich et al. (1980); Doroshkevich et al. (1982) predicted the filamentary character of particles but showed the presence of a rarefied population of particles in voids. This difference was explained by Zeldovich et al. (1982) as an indication of a threshold mechanism in galaxy formation: galaxies form in high-density filaments and knots but not in low-density regions – cosmic voids. A physical mechanism for the formation of galaxies in dark matter (DM) halos was suggested by White & Rees (1978). A more detailed study of the formation of galaxies in the cosmic web was presented by Dekel & Silk (1986); Dekel (1986); Dekel & Rees (1987) and Bond et al. (1996). Thus galaxies are biased tracers of matter density fields.
Traditionally the difference between the distributions of galaxies and matter is quantified by the bias parameter, which is defined by the ratio of correlation functions or power spectra of galaxies and matter, (Kaiser, 1984). Most recent bias studies are devoted to various aspects of the formation and evolution of galaxies; for a review, see Desjacques et al. (2018). This paper focuses on the evolution of matter and galaxy clustering.
Early studies showed that matter could be divided into two populations: the clustered population with galaxies and systems of galaxies, and the unclustered populations in low-density filaments and voids. \textcolorblackUnclustered in this context means much lower correlations than that of galaxies, but not necessarily zero correlations. Einasto & Saar (1987) and Einasto et al. (1994) identified the clustered matter with samples of DM particles with local densities above a certain threshold, , and the unclustered matter with local densities . Einasto et al. (1994); Einasto et al. (1999); Einasto et al. (2023) investigated the relation between clustered and total matter using simple analytic models. They found that the bias parameter is related to the fraction of matter in the clustered population, as follows: . \textcolorblackRepp & Szapudi (2020) used a statistical two-state Ising bias model, which agrees with this result in the zero temperature limit. However, it is unclear how accurately the high-density regions of DM represent real galaxies, particularly for low luminosities. The fraction of matter in the clustered and approximately unclustered populations can be found in the numerical simulation of the evolution of the cosmic web and determined independently of bias values from the correlation function. This factor yields an additional constraint on the bias parameter, besides the traditional correlation or power spectrum analyses.
The evolution of the biasing properties with cosmic epoch can be studied using numerical simulations of the cosmic web. One of the first studies of the evolution of the two-point correlation function (CF) of cold dark matter (CDM) universes was by Davis et al. (1985). The authors found that the amplitude of CF increases with time. Authors assumed that galaxies form in high-density peaks of the underlying matter density field and that the correlation length of simulated galaxies exceeds the correlation length of matter by a factor of 2.4 at expansion parameter . A similar biasing recipe was used by Einasto & Saar (1987) and Gramann (1987, 1988) in CDM and CDM universes. Using CDM simulations and the constraint Einasto et al. (1999) obtained for the bias parameter of galaxies . Cen & Ostriker (1992), Blanton et al. (1999) and Cen & Ostriker (2000) compared distributions of galaxies and matter using hydrodynamical simulations of the formation and evolution of galaxies. The authors found that there are no galaxies in regions of low spatial density of matter. The region of total density, including galaxies, starts at a mean density . Cen & Ostriker (2000) found for the bias parameter in the present epoch a value .
Using Millennium simulations by Springel et al. (2006). Springel et al. (2005) found for -galaxies bias values for , and for , i.e. at the present epoch -galaxies are antibiased. More recent hydrodynamical simulations of galaxy formation allowed us to include essential physical processes to simulate and follow galaxies’ formation and evolution in more detail. Examples of such simulations are Illustris (Vogelsberger et al., 2014a, b), EAGLE (Schaye et al., 2015), HorizonAGN (Dubois et al., 2016), and The Next Generation (TNG) series of hydrodynamical simulations by Springel et al. (2018) and Pillepich et al. (2018a, b). The first analysis of matter and galaxy clustering using TNG100 and TNG300 simulations was made by Springel et al. (2018). Springel et al. (2018) calculated bias parameter values for a range of evolution epochs from to , separately for galaxies of different stellar masses, star formation rate, and for halos of various masses. For the present epoch Springel et al. (2018) found a value . As noted by Springel et al. (2018), this low value of the bias parameter is consistent with analytic models by Mo & White (1996), Sheth & Tormen (1999) and Tinker et al. (2010), and with the observed CF and bias parameter of SDSS galaxies, as found by Li & White (2009).
This short overview of previous determinations of the bias parameter shows that bias values for type galaxies are concentrated around two values, and . The smaller value is obtained from galaxy clustering studies, either observational or using modern hydrodynamical simulation of the evolution of galaxies. The higher value is found in DM-only numerical simulations and early hydrodynamical simulations. The difference between these values is much more significant than possible random errors. However, biasing is not a phenomenon which can be characterised by CFs or power spectra alone. It is closely related to the division of matter into clustered and approximately unclustered populations of dark and baryonic matter. Thus, the bias parameter depends on the luminosity of galaxies and the fraction of matter in the clustered and approximately unclustered populations. The first factor is well-known from the first studies of the bias phenomenon by Kaiser (1984) and Bardeen et al. (1986). The second factor is related to the evolution of the cosmic web.
In this paper, our main goal is to characterise the differences in the bias evolution of galaxies and DM. To do this, we determine the bias parameters of galaxies and clustered DM particles as test objects in the correlation analysis. We use the Illustris TNG simulations of the evolution of the cosmic web, where data on simulated galaxies and DM particles are available. The TNG series uses three box sizes, , called TNG50, TNG100 and TNG300. The latter two are large enough to study the evolution of galaxies in the cosmic web. We shall use TNG100 and TNG300 simulations within cosmic epochs corresponding to redshifts from to the present epoch . These simulations have sufficient mass resolutions to track the evolution of galaxies substantially below . We analyse the clustering properties of simulated galaxies of various luminosities and DM particle samples with varying particle density limits. In addition to the correlation analysis, we study the evacuation of DM particles from voids, which yields independent information on the evolution of the bias parameter.
As an independent check, we also analyse the evolution of the bias parameter using Horizon Run 5 (HR5) simulations by Lee et al. (2021) and Park et al. (2022).
The paper is structured as follows. In Section 2 we give an overview of TNG and HR5 galaxy and DM samples and methods to calculate correlation functions and bias properties. In Section 3 we analyse the evolution of the physical properties of simulated galaxies. In Section 4 we describe the correlation and bias functions of simulated galaxies and DM density-limited samples. We analyse the evolution of clustering properties of simulated galaxies of various luminosity and DM density-limited samples. In Section 5 we discuss our results and compare them with earlier studies. Section 6 summarises the conclusions of our study.
2 Data and methods
In this Section, we describe TNG100, TNG300 and HR5 simulations used in our analysis, and methods to calculate correlation and bias functions of DM and simulated galaxy samples.
2.1 TNG simulations
Basic data on TNG100 and TNG300 simulations are given in Springel et al. (2018) and Pillepich et al. (2018a). High-resolution versions of these simulations, TNG100-1 and TNG300-1, have particle numbers and , respectively, both for DM and gas particles, and the same number of cells. Low resolutions versions, TNG100-3 and TNG300-3, have and cells and numbers of DM and gas particles, respective masses of DM and gas particles are given in Table LABEL:Tab1. TNG simulations are made for cosmology parameters , , , and Hubble constant km s-1Mpc-1 with . Initial conditions were generated for the epoch using a linear theory power spectrum with a normalisation and spectral index . For conformity with literature, we express lengths in units .
| Simulation | |||
|---|---|---|---|
| (1) | (2) | (3) | (4) |
| TNG100-1 | 75 | ||
| TNG100-3 | 75 | ||
| TNG300-1 | 205 | ||
| TNG300-3 | 205 |
Columns give: (1) name of simulation; (2) box size in ; (3) DM particle mass; (4) gas particle mass.
| Simulation | |||
|---|---|---|---|
| (1) | (2) | (3) | (4) |
| TNG100-1 | 0 | 337 261 | |
| TNG100-1 | 0.5 | 410 155 | |
| TNG100-1 | 1 | 492 655 | |
| TNG100-1 | 2 | 680 244 | |
| TNG100-1 | 3 | 836 537 | |
| TNG100-1 | 5 | 762 174 | |
| TNG100-1 | 10 | 112 084 | |
| TNG300-1 | 0 | 1 947 928 | |
| TNG300-1 | 0.5 | 2 324 925 | |
| TNG300-1 | 1 | 2 678 779 | |
| TNG300-1 | 2 | 3 183 544 | |
| TNG300-1 | 3 | 3 218 212 | |
| TNG300-1 | 5 | 2 043 334 | |
| TNG300-1 | 10 | 65 012 |
Columns give: (1) name of simulation; (2) simulation epoch ; (3) number of DM particles; and (4) number of galaxies.
We downloaded from the TNG site subhalo data for simulations TNG100-1, TNG300-1 and TNG300-3, and DM data for TNG100-3 and TNG300-3. Files for DM data for TNG100-1 and TNG300-1 are too large for downloading. Experience with Uchuu simulation shows that randomly selected DM particle samples yield correlation analysis results fully compatible with DM particle samples (Ishiyama et al., 2021).
For subhalos, we extracted -coordinates, subhalo total and stellar masses, and luminosities of simulated galaxies in and colours from the TNG website. Our primary analysis is done in the -band, but we also analysed colours and masses of subhalos. Galaxy absolute magnitudes in -band were used as labels to select simulated galaxy samples for further analysis. The derivation of galaxy magnitudes is described by Pillepich et al. (2018a). Numbers of DM particles and simulated galaxies for all redshifts used in our analysis are given in Table LABEL:Tab2. The number of subhalos for simulation TNG300-3 is much larger than the number of galaxies, i.e. there exists a large number of subhalos with no galaxy data. This simulation’s resolution is insufficient to find galaxy data for low-mass subhalos. For this reason, galaxies of the simulation TNG300-3 were not used in the final analysis. For simulations TNG100-1 and TNG300-1, almost all subhalos contain galaxies. Thus we give for these simulations in Table LABEL:Tab2 only numbers of simulated galaxies.
For simulations TNG100-3 and TNG300-3, we extracted DM particle -coordinates and local densities. The local total comoving mass density is estimated using the standard cubic-spline SPH kernel over all particles/cells within a comoving radius of the sphere centred on this particle enclosing the nearest DM particles (for details see Nelson et al., 2015; Springel et al., 2018). Densities are given in Solar masses per cubic comoving kpc, corresponding to low numerical values for the density. We used these densities as labels to select DM particles of the clustered population, , where the limiting density was selected to obtain clustered DM particle samples for various density thresholds. This method to select particles was applied earlier by Jensen & Szalay (1986), Einasto et al. (1991), Szapudi & Szalay (1993), and Little & Weinberg (1994). This model to select particles is similar to the Ising model, discussed by Repp & Szapudi (2019b, a). Also, this method allows for finding the fraction of DM particles in the clustered and unclustered population.
2.2 HR5 simulations
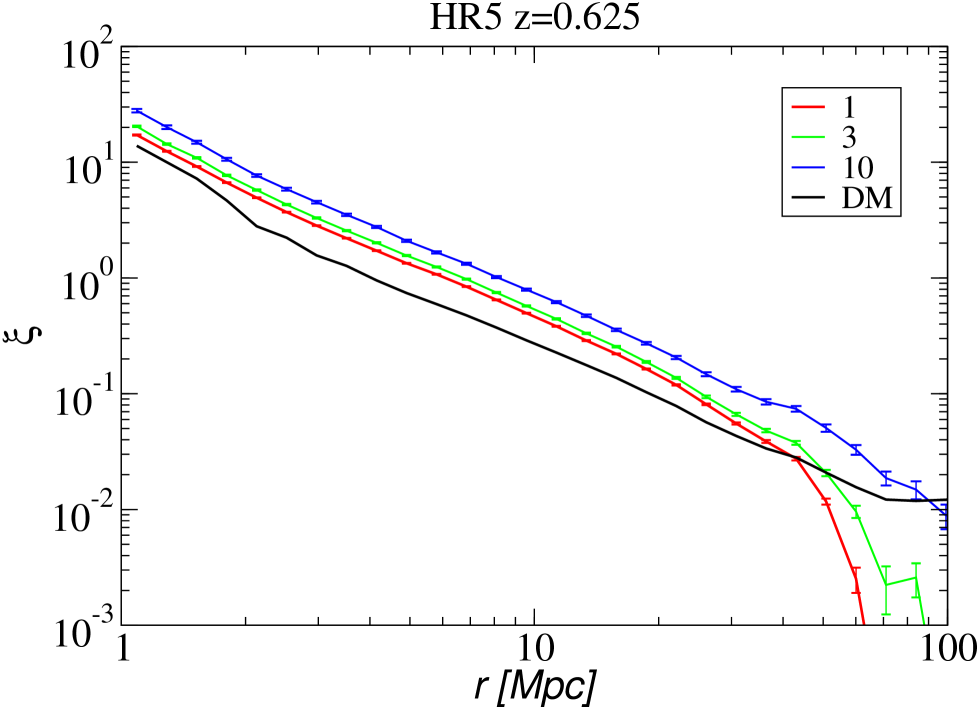
Hydrodynamical Horizon Run 5 (HR5) simulations are described by Lee et al. (2021) and Park et al. (2022). Simulations were run with cosmological parameters: , , , and Hubble constant ; in a cubic box of comoving physical length cMpc. Within this cube, a high-resolution cuboid with a volume cMpc3 was selected, which allowed resolving kiloparsec physical scales. Simulations started at redshift and finished at redshift . The whole box has, at redshift , DM particles and star particles. In the high-resolution region at epoch there are 290 086 galaxies of mass . The volume of the high-resolution cuboid is , almost equal to the volume of the TNG300-3 simulation cube. The simulation TNG300-1 has 290 061 galaxies with absolute magnitudes .
For the present study, one of the coauthors (JK) calculated galaxy and DM correlation functions for simulation epochs , and for galaxies of stellar masses . CFs were calculated with the Landy & Szalay (1993) estimator in 30 logarithmic bins up to separation cMpc.
2.3 Calculation of the correlation and bias functions
Simulated DM files contain a large number of particles. Thus we applied the Szapudi et al. (2005) grid-based method with for finding correlation and bias functions on sub-megaparsec scales. CFs for simulation TNG100-1 were found up to separations with 90 logarithmic bins, and for simulation TNG300-1 up to separations with 98 logarithmic bins. For consistency with the DM samples, we used this method also for simulated galaxies, applying the same bins as for DM samples. This allows easy computation of bias functions.
We calculated the CFs for all samples of TNG simulations for two sets of data. In the first set, we used as test objects simulated galaxies. CFs were calculated with a series of galaxy luminosity limits, . In the second set, we used as test objects DM particles with a series of particle density limits, . We always used galaxy/particle samples in cumulative form, i.e. all galaxies/particles equal to and above some limit are considered.
The ratio of CFs of the galaxy (particle) samples with luminosity limits (particle density limits ) to correlations functions of all DM, both at identical separations , defines the bias function :
| (1) |
and a similar formula for , where the limiting luminosity is replaced by the particle density limit . Bias depends on the luminosity of galaxies (particle density limit ), used in the calculation of CFs.
Bias functions have a plateau at , see Fig. 5 below. This feature is similar to the plateau around Mpc-1 of relative power spectra (Einasto et al., 2019b). Following Einasto et al. (2020, 2021b, 2023), we use this plateau to measure the relative amplitude of the CF, i.e. of the bias function, as the bias parameter,
| (2) |
and a similar formula, where is replaced by particle density limit , and is the value of the separation to measure the amplitude of the bias function. We calculated for all samples bias parameters for the comoving separation, , as functions of the galaxy absolute magnitude in colour, , or particle density limit for DM simulations. At smaller distances, bias functions are influenced by the distribution of particles and galaxies in halos, and at larger distances, the bias functions have wiggles, which makes difficult the comparison of samples with various galaxy luminosity limits.
3 Evolution of physical properties of simulated galaxies
In this Section, we describe the evolution of the physical properties of simulated galaxies and DM samples. We begin with a description of the evolution of power spectra and CFs of DM samples, thereafter we discuss the evolution of spatial distribution and luminosity functions of simulated galaxies.
3.1 Evolution of DM power spectra and CFs
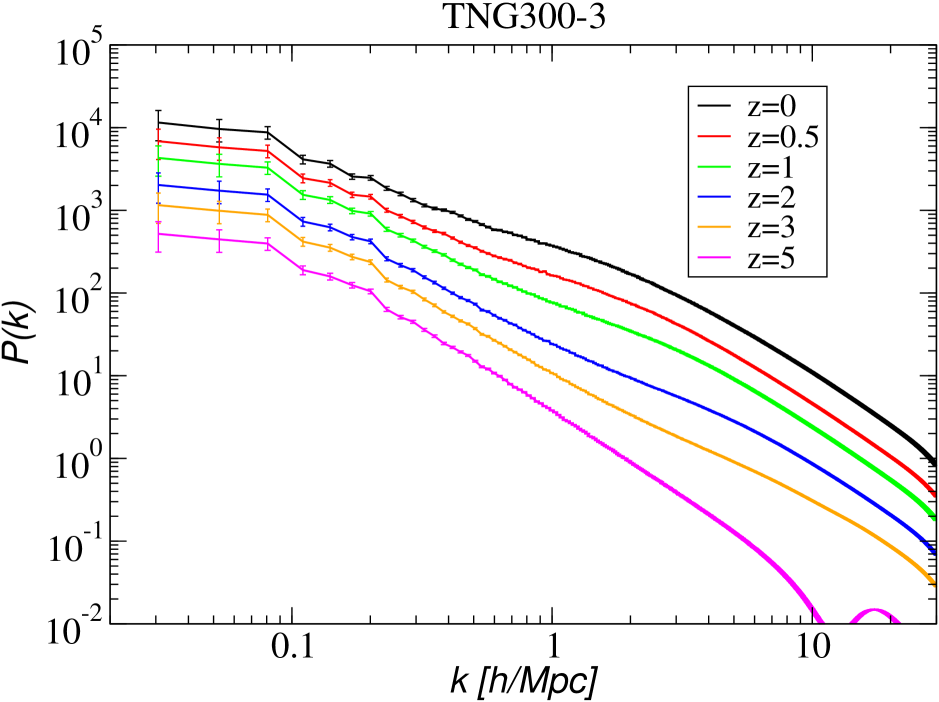
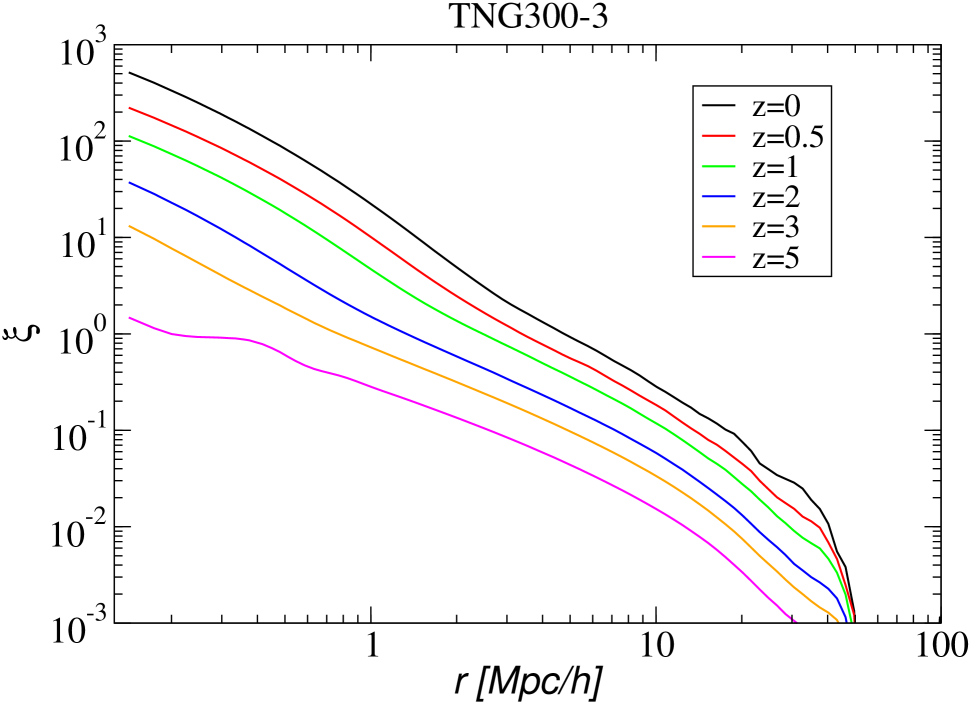
We calculated the power spectra and CFs of DM particle samples for the simulation TNG300-3. To find power spectra we applied standard procedure as discussed by Jing (2005). For CFs, we used the Szapudi et al. (2005) method as discussed above. The evolution of power spectra and correlation functions of DM is presented in Fig. 1. As expected, the amplitudes of both functions increase considerably with time. The growth of amplitudes of both functions describes the growth of amplitudes of density fluctuations with time.
Fig. 1 shows that CFs of DM deviate considerably from a simple power law. On large separations, CFs can be approximated by a power law with exponent . In this separation range, CFs describe fractal properties of the distribution of halos, as discussed by Einasto et al. (2020). On smaller separations, CFs describe the distribution of DM particles in halos, as discussed among others by Springel et al. (2018) and Einasto et al. (2020, 2023). The characteristic diameters of halos determine the transition between these regimes at a separation .
3.2 Evolution of the spatial distribution of galaxies
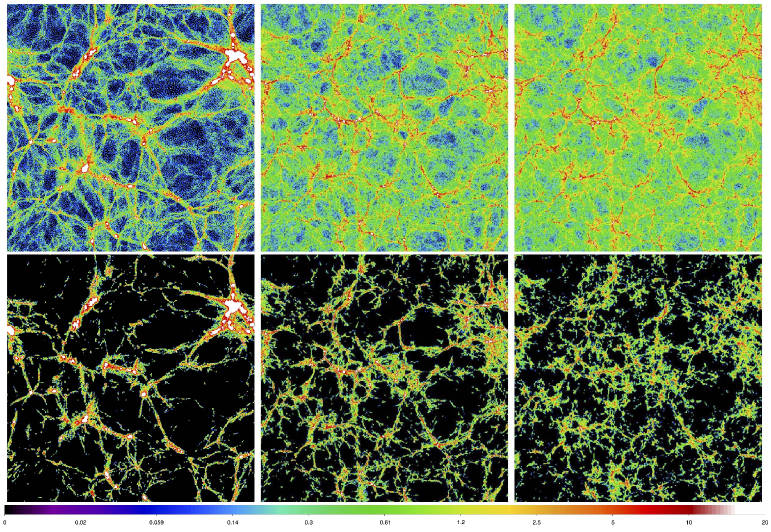
We calculated density fields for DM and galaxies. We calculate the nearest grid point (NGP) DM density field from a grid of size with the same resolution as the number of particles, . The NGP method was used to find DM density fields of the TNG100-3 simulation with and . Results are presented in Fig. 2 for the TNG100-3 simulation in coordinates in a sheet of a thickness of 11 simulation cells, , across a massive cluster. The top panels are for full DM samples, bottom panels for DM particles with densities , i.e. all particles of the clustered population. Colour codes are for grid cells of different spatial densities.
The Figure demonstrates the presence of the cosmic web from the early epoch to the present epoch . All principal elements of the cosmic web are present already at the epoch , see also Springel et al. (2006, 2018), Park et al. (2022) and Asgari et al. (2023). This result is consistent with Table LABEL:Tab2 showing that the number of subhalos/galaxies did not change considerably during this period. The number of resolved galaxies, including dwarf satellite galaxies, reaches a maximum at , and decreases slightly thereafter. The contraction of superclusters – low-mass systems flow towards central clusters of superclusters is also visible in these plots. A similar effect was noted by Einasto et al. (2019a, 2021a).
The top panels of Fig. 2 show the presence of faint DM filaments, absent in the bottom panels in the density fields of the clustered matter. Here only strong galaxy filaments exist, and most of the volume has zero density. A similar difference is seen in plots of DM and galaxy/halo distributions by Springel et al. (2006, 2018), Park et al. (2022) and Asgari et al. (2023). Already the visual inspection of the bottom panels shows the increase of the fraction of the volume of zero-density cells with time (decreasing ).
3.3 Evolution of luminosity functions of galaxies
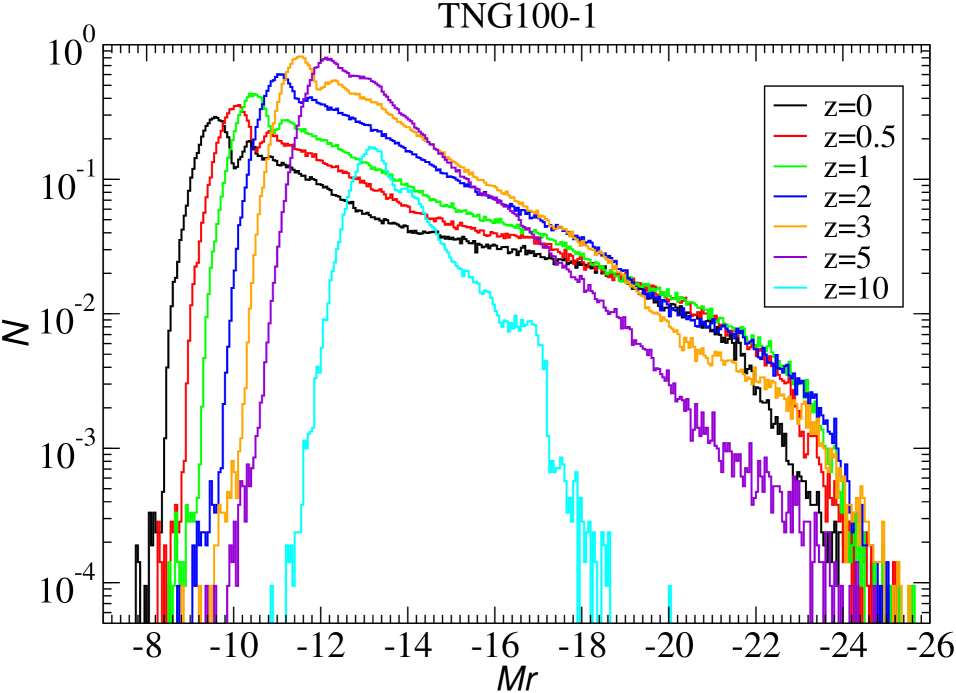
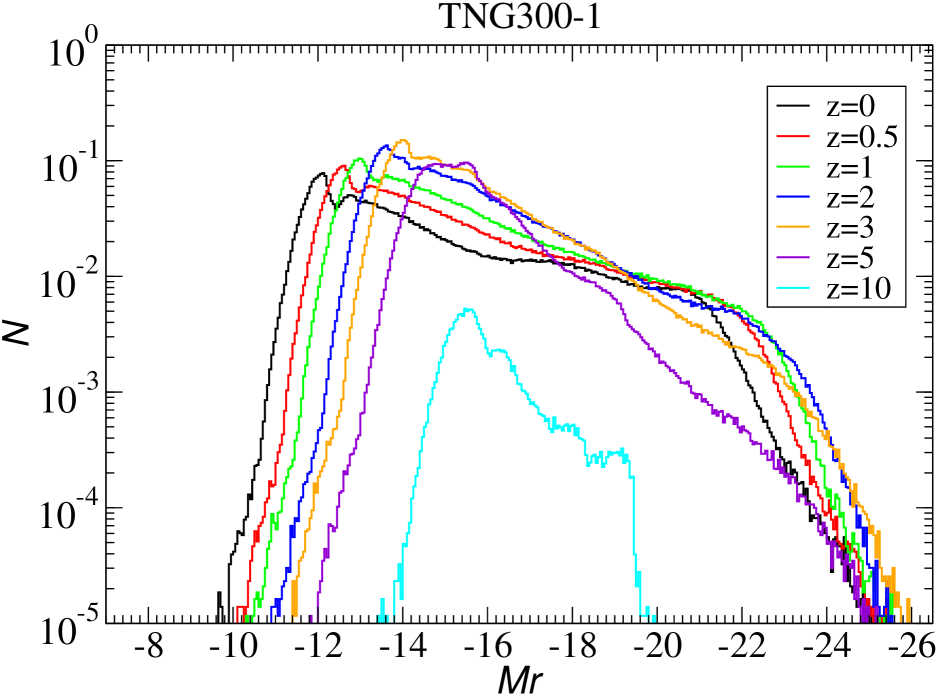
Differential luminosity functions of galaxies of TNG100-1 and TNG300-1 simulations are shown on the top panels of Fig. 3. This Figure demonstrates clearly the presence of differences in the number of galaxies in these simulations. As expected, the number of galaxies per unit magnitude interval and cubic megaparsec is the largest in the TNG100-1 simulation. The increase in the number of galaxies in the TNG100-1 simulation comes essentially from dwarf galaxies with luminosities , where the number of dwarf galaxies per cubic megaparsec is up to ten times larger than in the simulation TNG300-1. The faint end tail of luminosity distribution of the TNG100-1 simulation is two magnitudes fainter than that of the simulation TNG300-1.
Differences between simulations TNG100-1 and TNG300-1 are present also in the high-luminosity tail of the distribution at various epochs. At the early epoch, , the most luminous galaxies have luminosity for TNG100-1 and for TNG300-1. For both simulations, there is a rapid increase of the luminosity of the brightest galaxies between redshifts and . This increase is due to the merging of galaxies in the centres of massive halos. The difference between simulations TNG100-1 and TNG300-1 can probably be explained by the larger volume of simulation TNG300-1, which contains larger modes of density perturbations and allows more effective merging. Notice also that the luminosity of most luminous galaxies with increases between redshifts to , and thereafter decreases slightly. The luminosity function curve for redshift at the high end is lower than for redshifts and . The most essential difference between simulations at epochs and is in the number of simulated galaxies: at redshift it is much lower than in smaller redshifts, as seen from Table LABEL:Tab2 and Fig. 3. In further analyses, we shall use only simulated galaxies at redshifts .
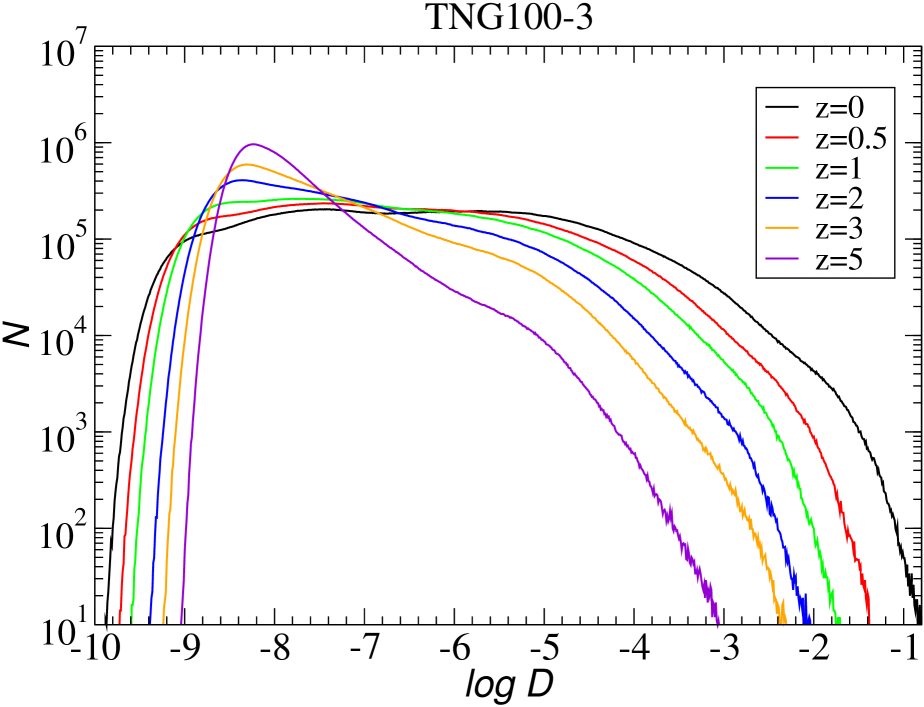
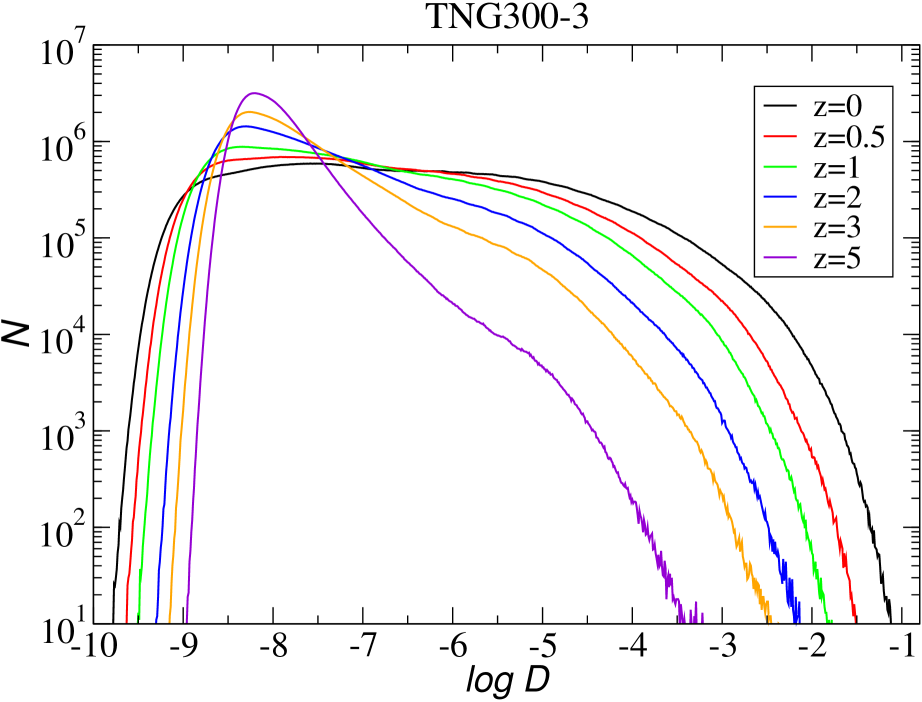
Bottom panels of Fig. 3 show the distribution of DM particle densities at various redshifts . We see that particle density distributions at the high density end differ about three magnitudes for redshifts to , much more than for most luminous galaxies at redshifts to .
4 Evolution of clustering properties of luminosity and particle density limited samples of TNG simulations
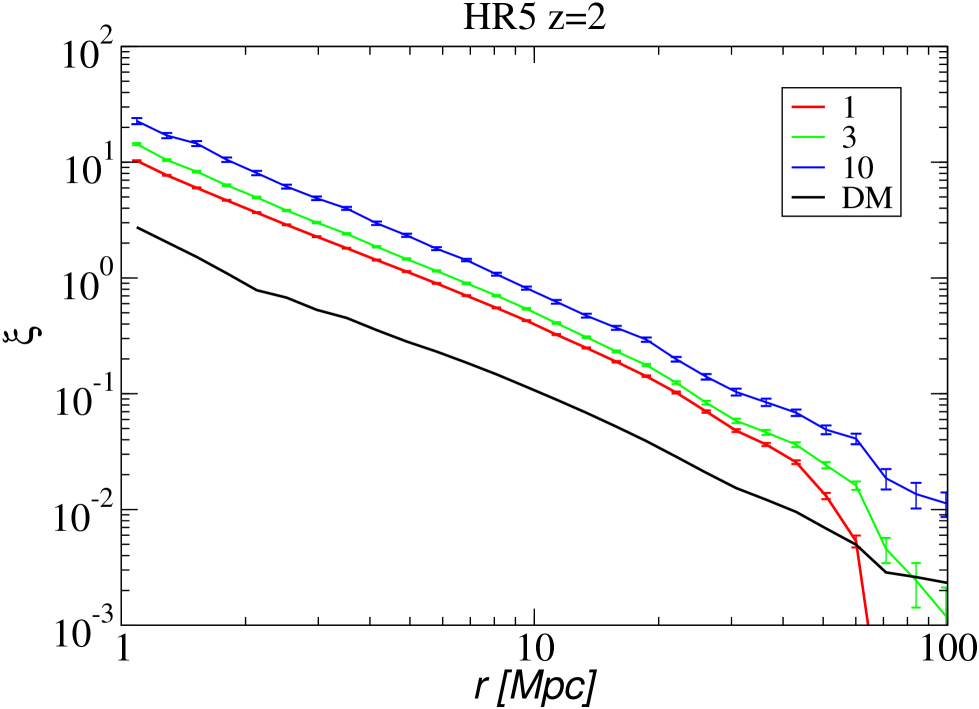
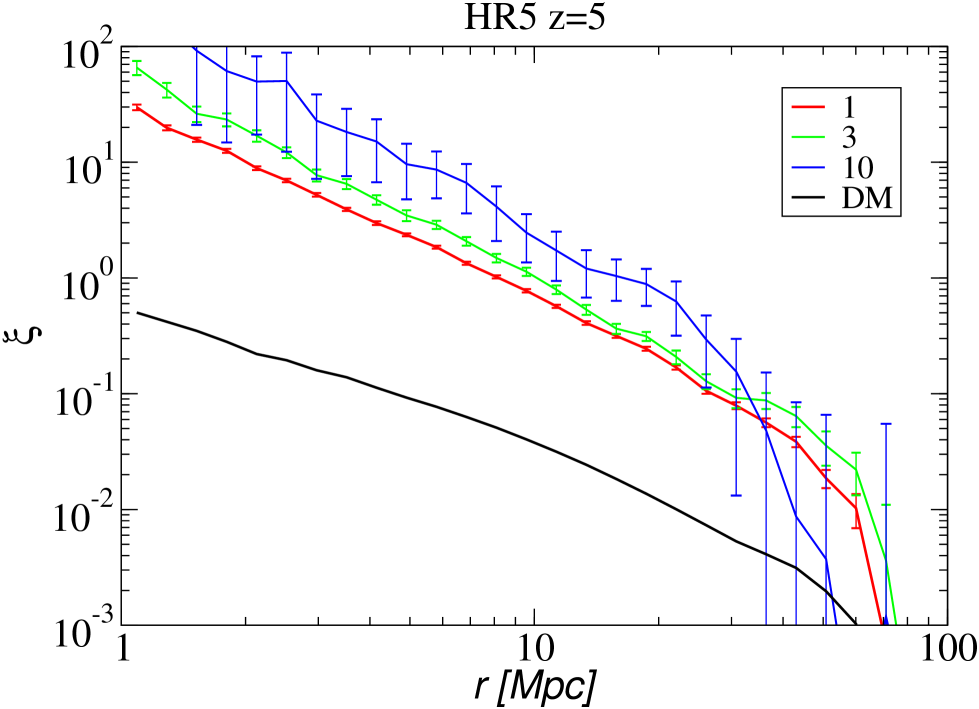
The Section begins with a description of the evolution of correlation and bias functions with time. We show also the evolution of correlation and bias functions of galaxies of HR5 simulations. Thereafter we describe the evolution of bias parameters with cosmic epoch, and its dependence on the luminosities of galaxies. Finally, we describe the determination of bias parameters of the faintest galaxies and the fraction of matter in the clustered population.
4.1 Evolution of CFs of TNG simulation galaxies and particle density limited DM samples, and CFs of galaxies of HR5 simulations
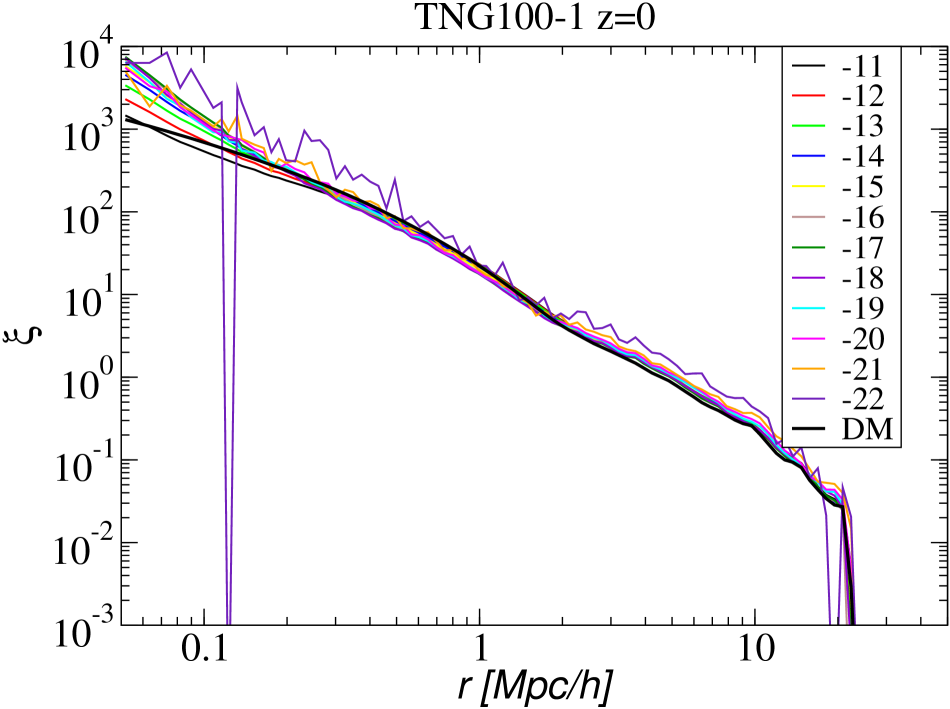
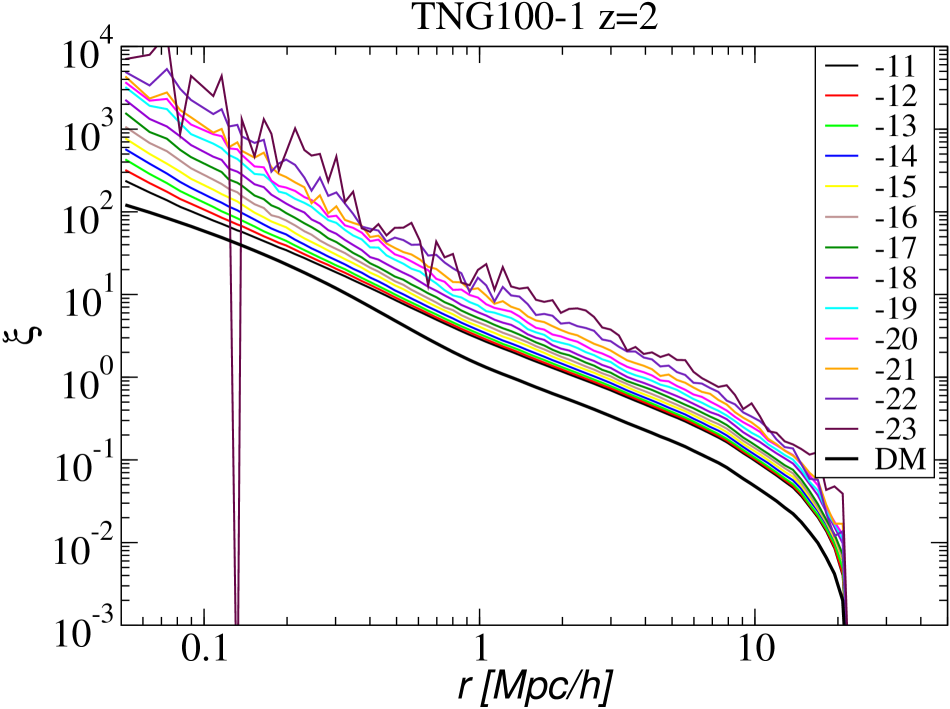
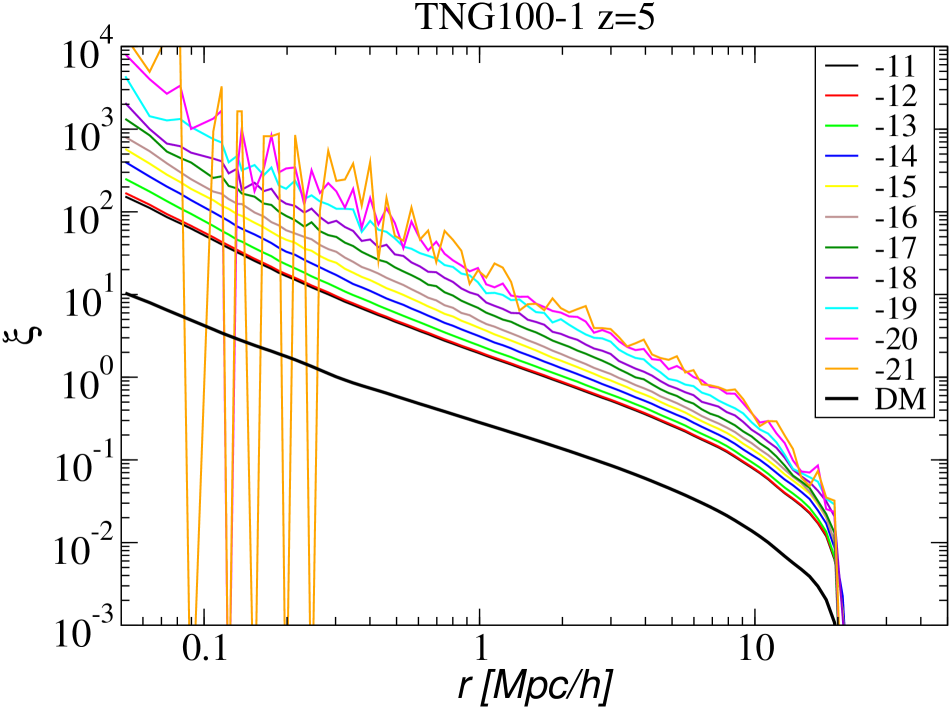
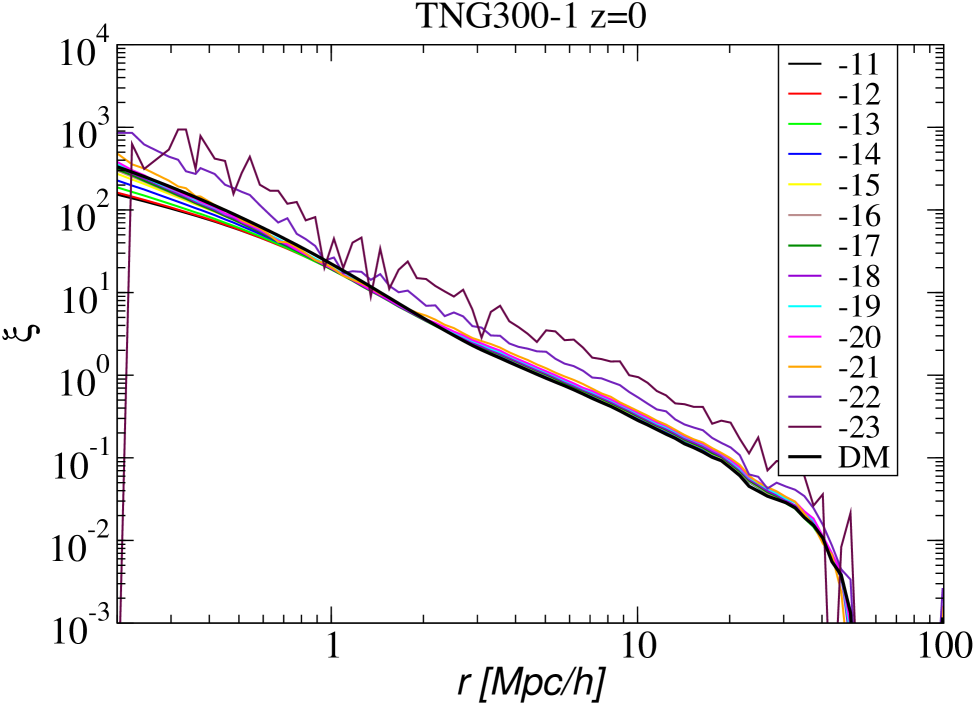
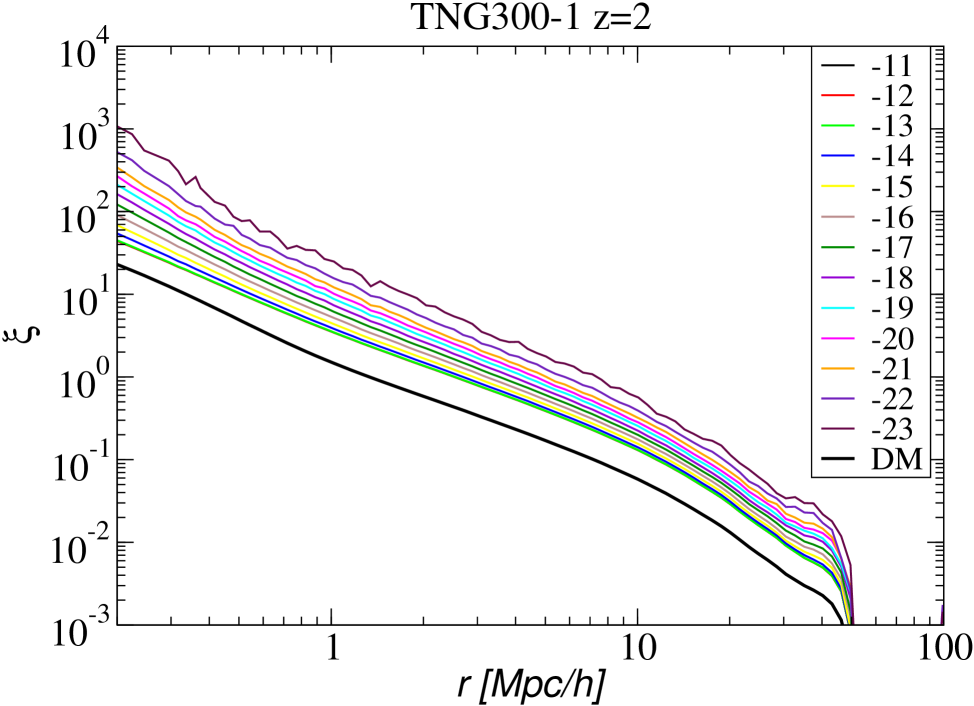
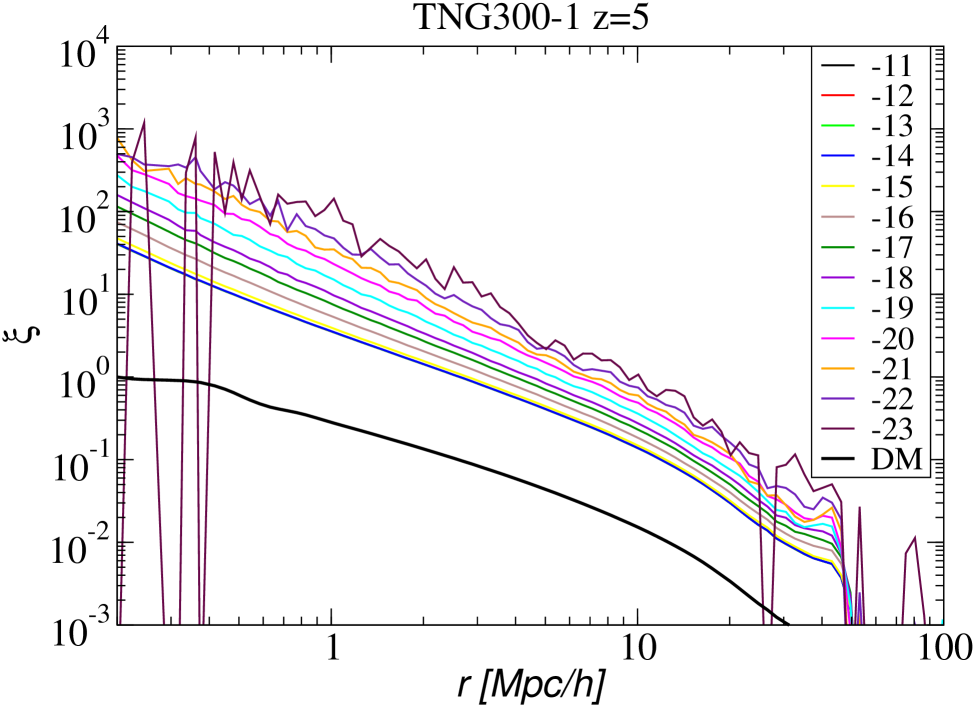
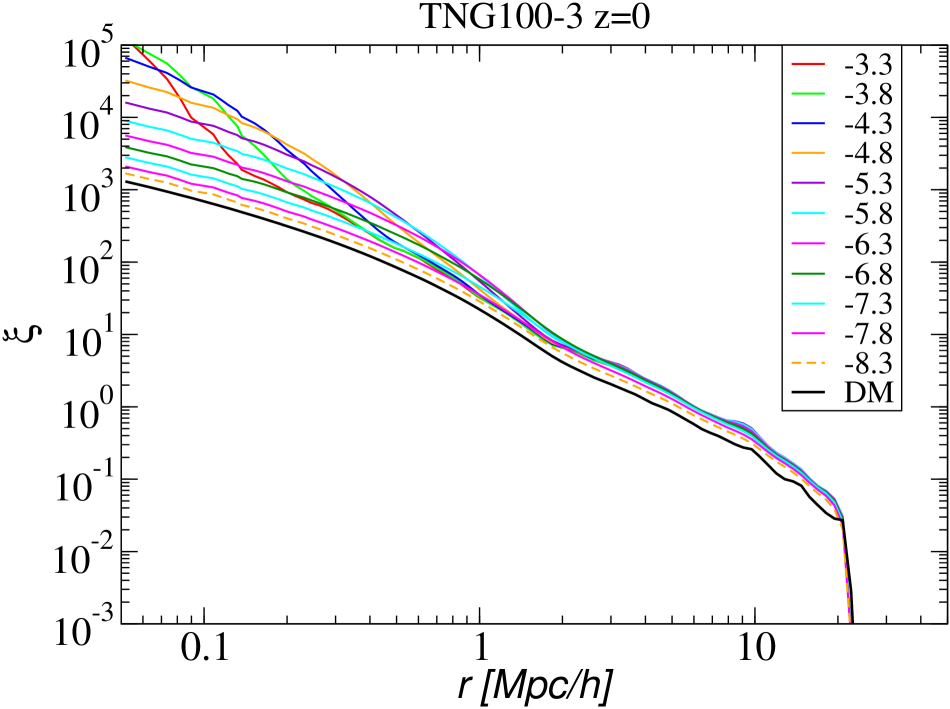
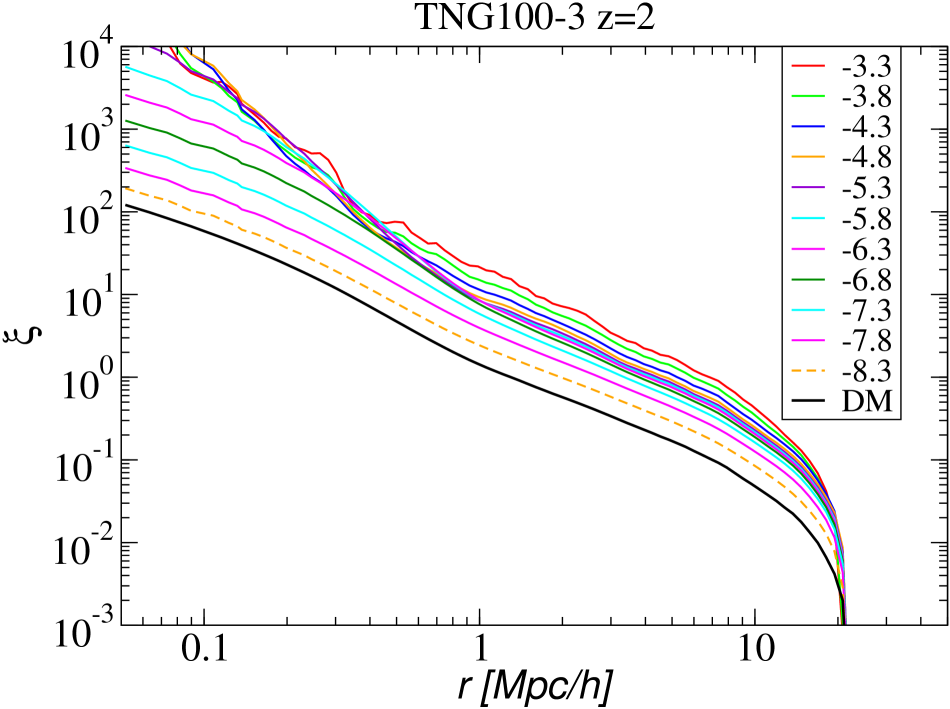
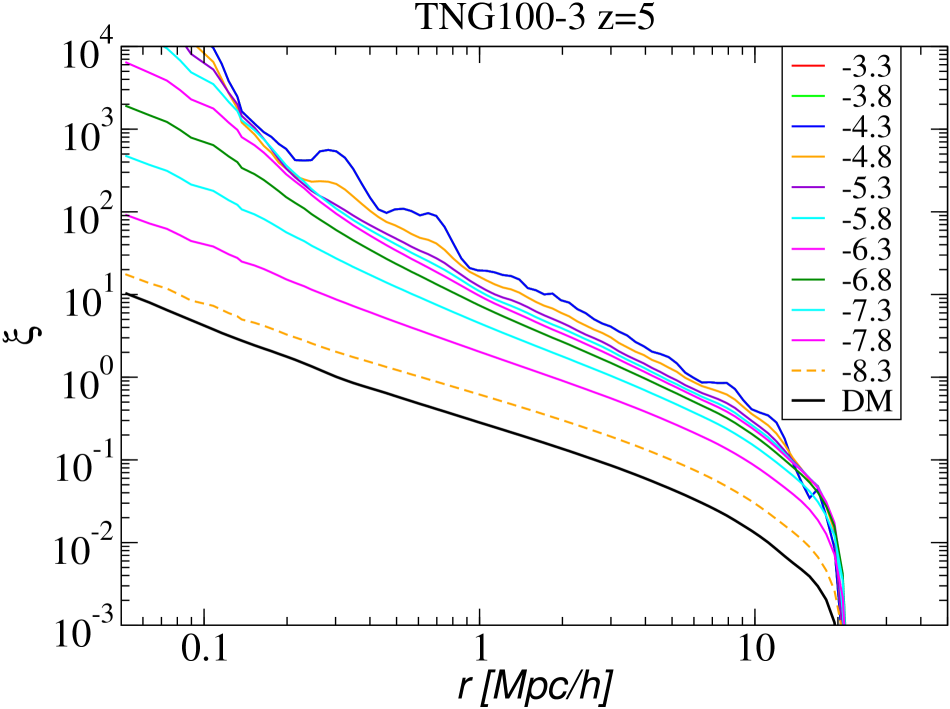
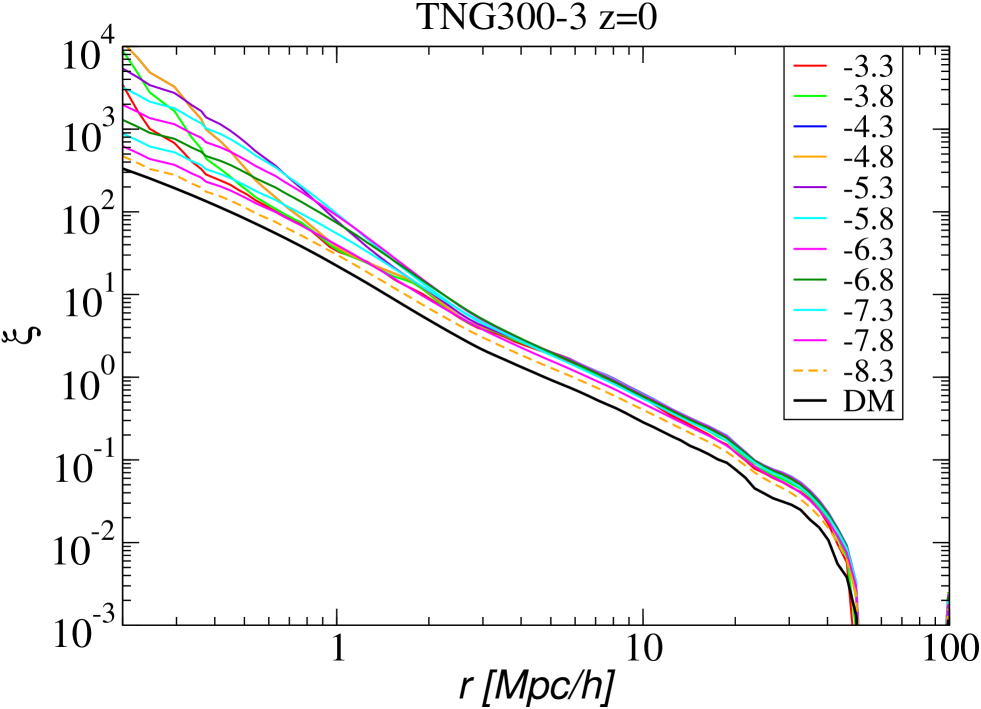
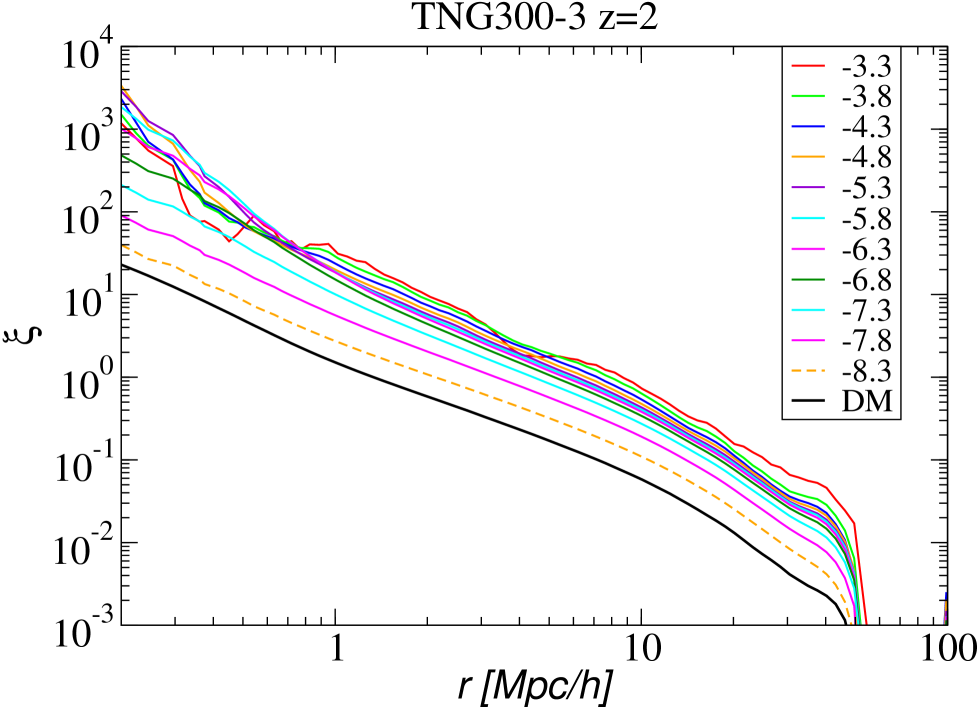
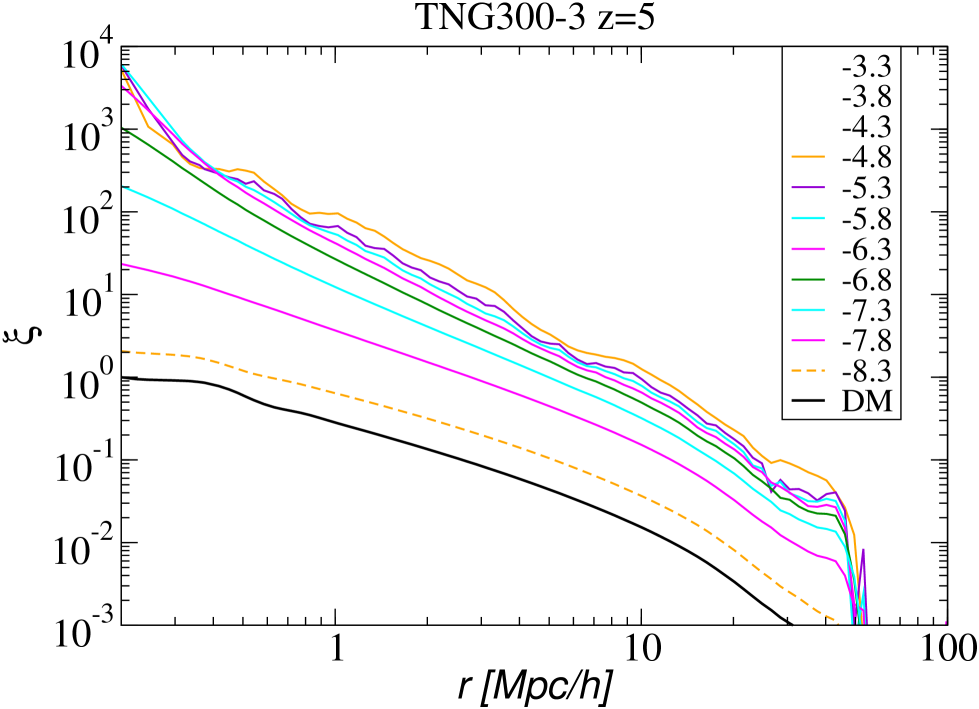
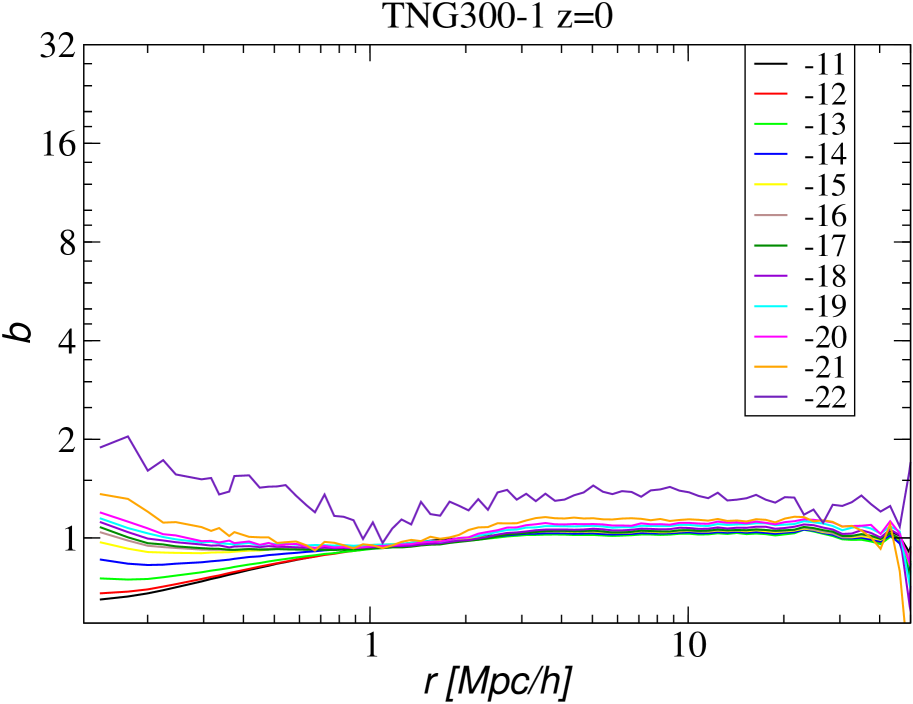
We calculated CFs of galaxies and DM particle density limited samples for all selected simulations. For all samples, we applied the Szapudi et al. (2005) method. As a reference sample, we used DM particles from simulations TNG100-3 and TNG300-3. In Fig. 4 we show CFs of galaxies for TNG100-1 and TNG300-1 simulations. For all samples a large range of limiting luminosities was applied from to . The top and second rows are for the simulations TNG100-1 and TNG300-1, left, middle and right panels are for evolutionary epochs , and , respectively. Bold black lines show DM CFs, and coloured lines present galaxy CFs for various limits, shown as labels.
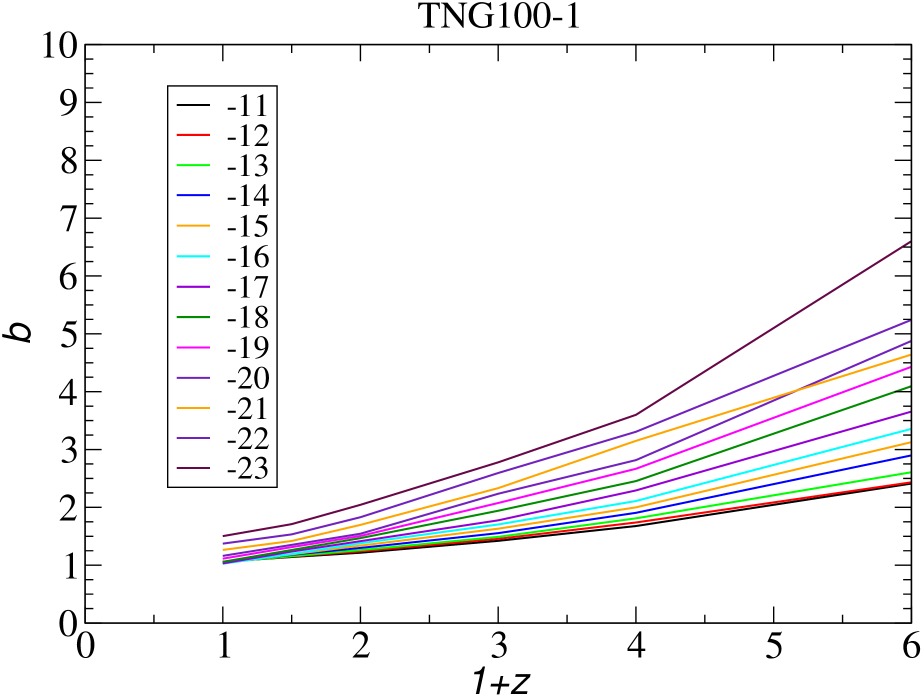
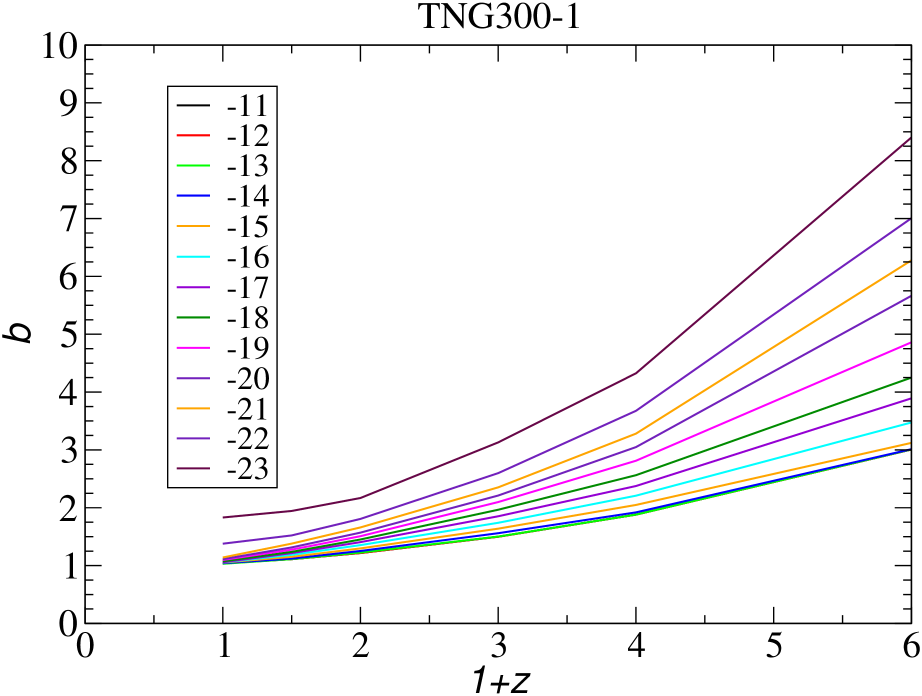
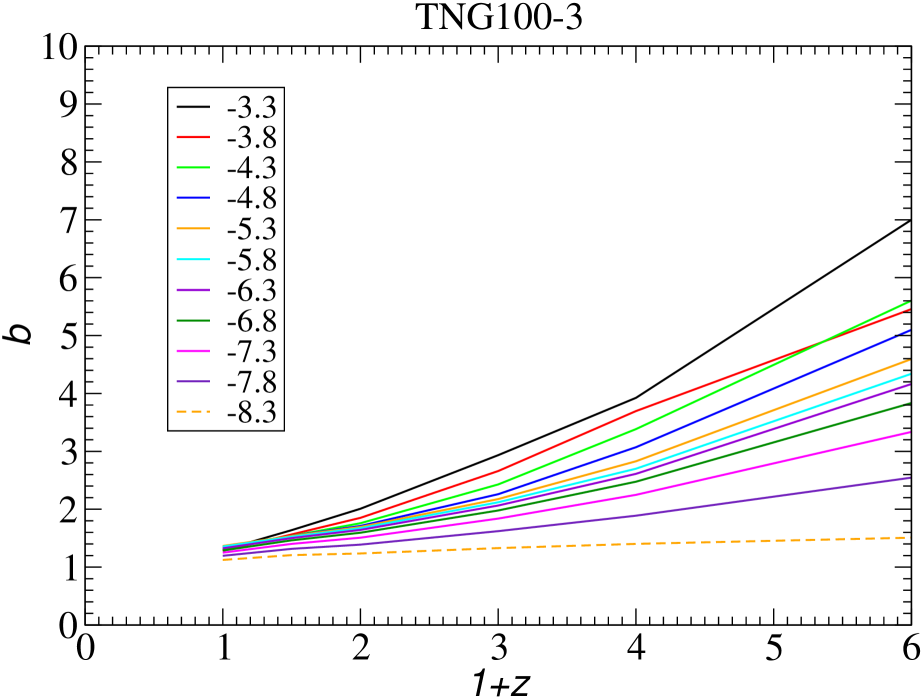
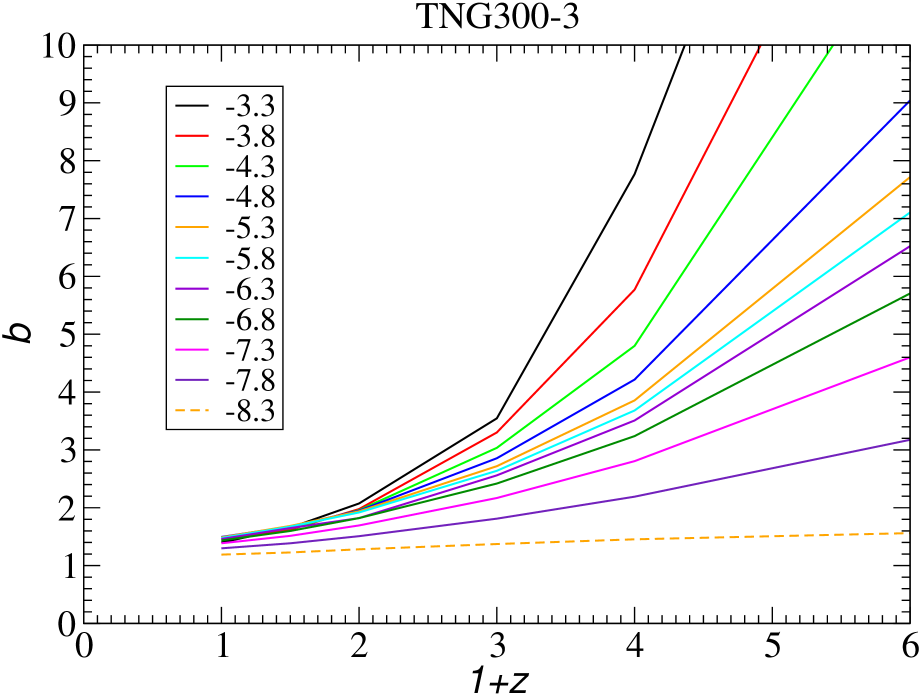
Fig. 4 shows that CFs of galaxies for limits form sequences of increasing amplitude with increasing luminosity limits. The number of galaxies in most samples is large, thus random errors of CFs are very small. Only for the brightest galaxies, errors are larger and CFs have visible scatter. The Figure shows also that for the present epoch CFs of the faintest galaxies almost coincide with CFs of DM. For earlier epochs, there exists a gap in the amplitudes of CFs of galaxies relative to DM, which increases with the simulation epoch . This is the biasing effect, discussed in detail in the next subsection.
In the third and fourth rows of Fig. 4, we present CFs of particle density limited DM samples of TNG100-3 and TNG300-3 simulations for epochs . Here we used particle density limits in units, starting from . The limit corresponds to DM particles, not associated with galaxies at the epoch ; the corresponding CFs are marked with dashed orange lines. DM samples, corresponding to the faintest simulated galaxies at , have the limit . DM samples corresponding to most luminous galaxies have at present epoch .
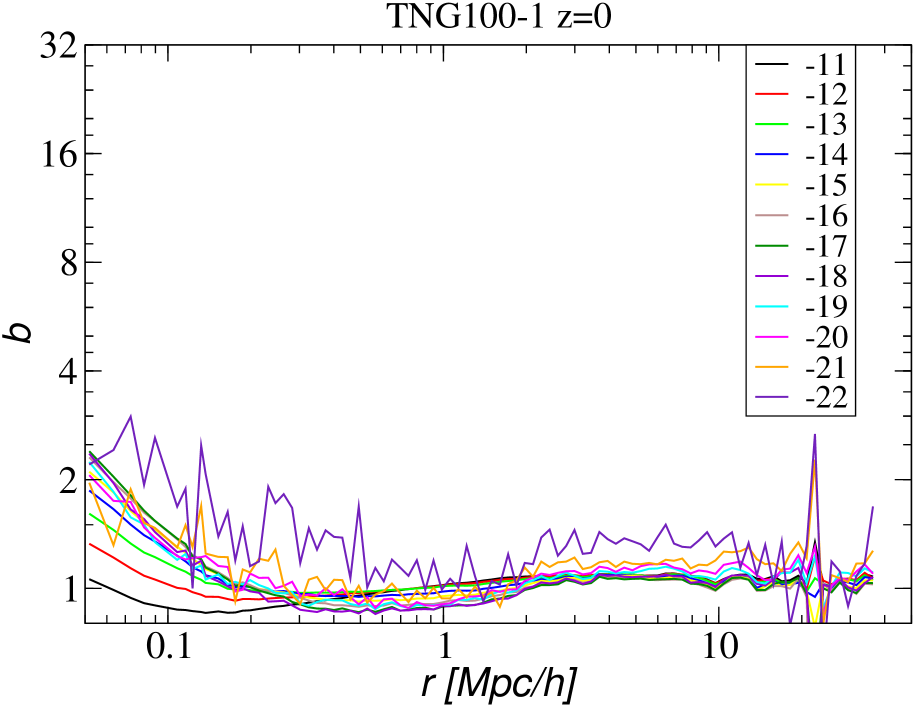
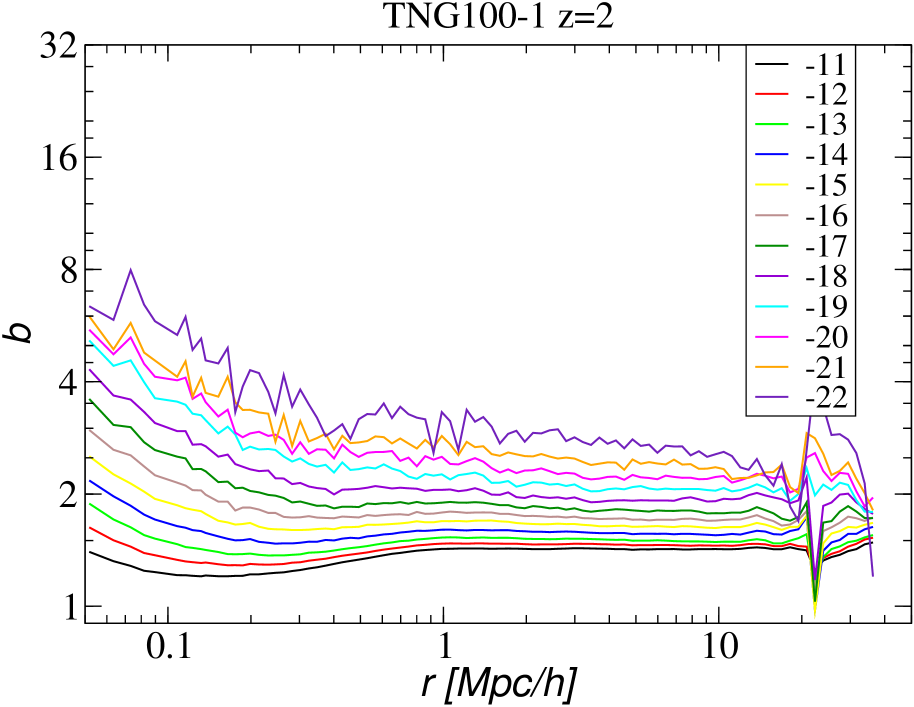
4.2 Evolution of bias functions of TNG and HR5 simulation galaxies
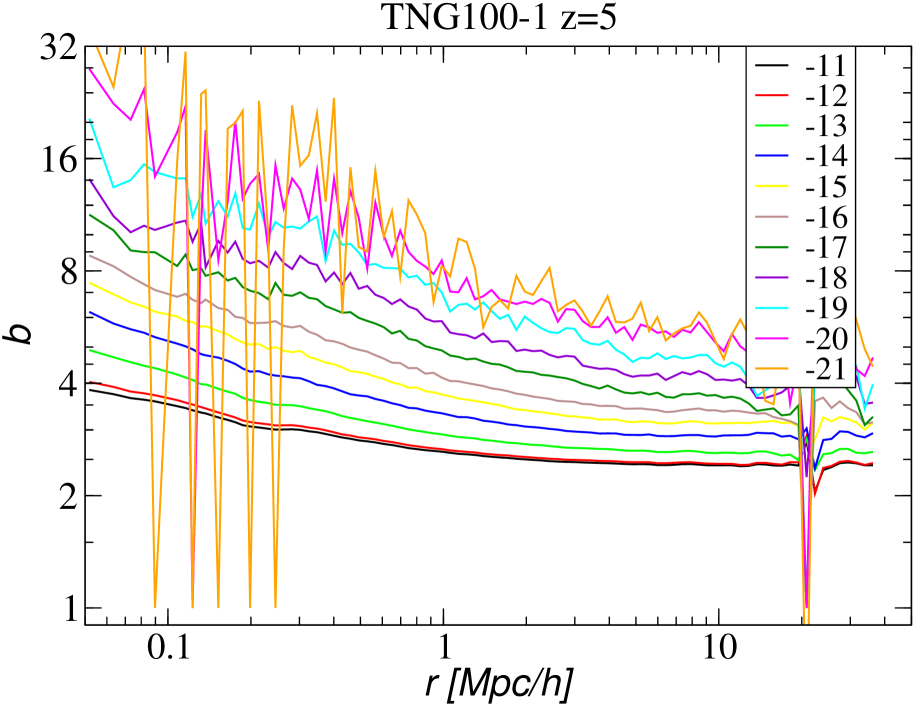
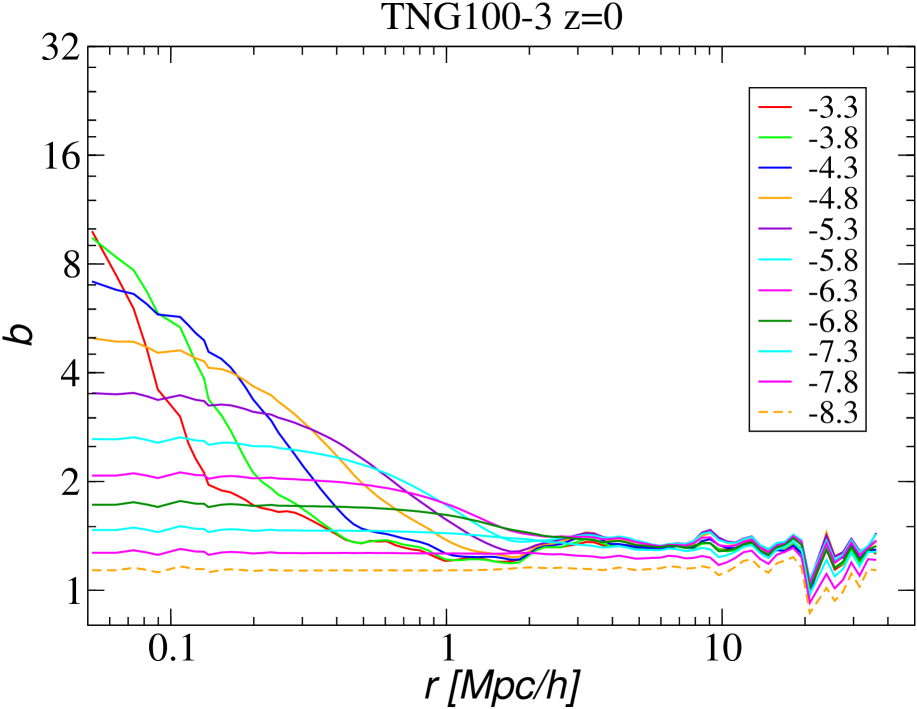
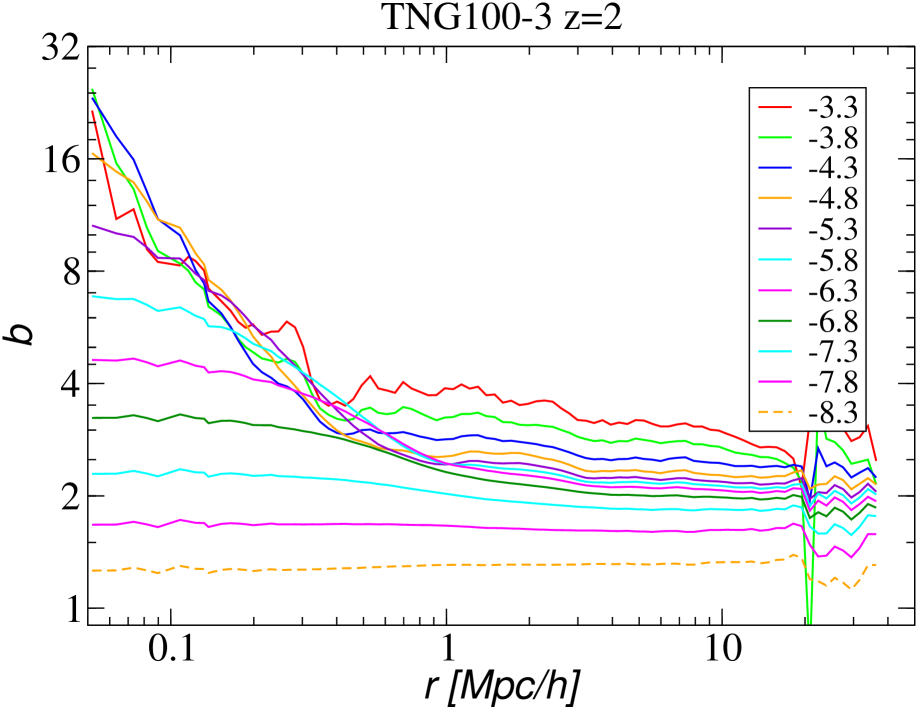
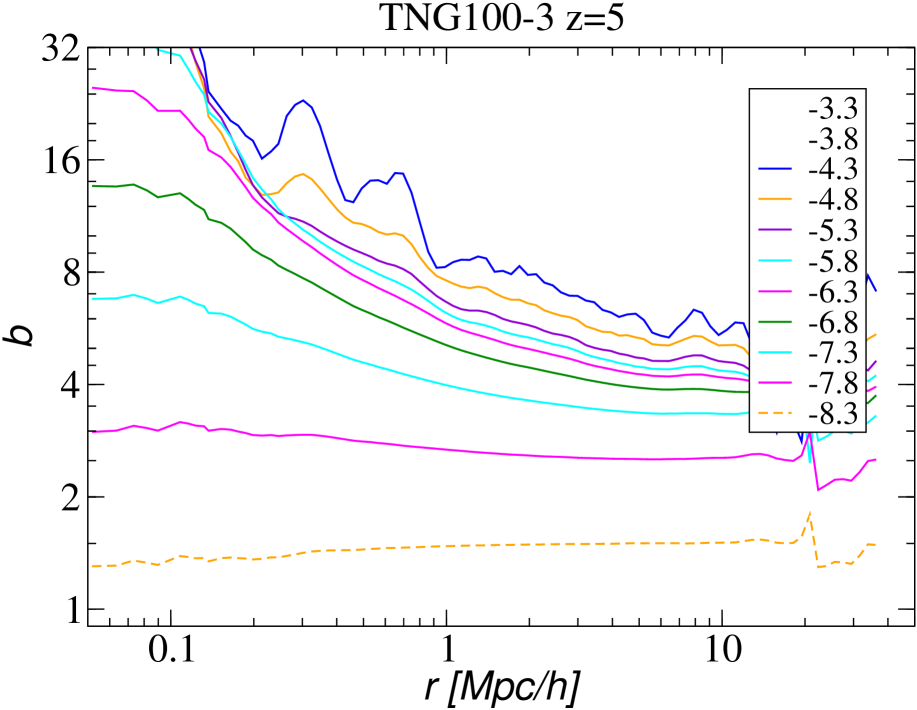
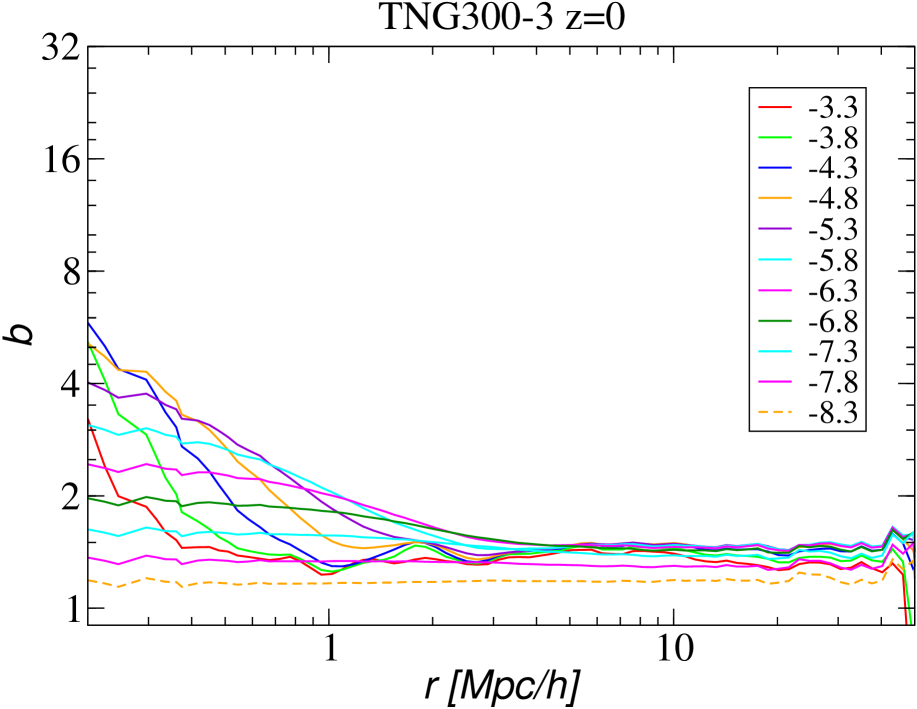
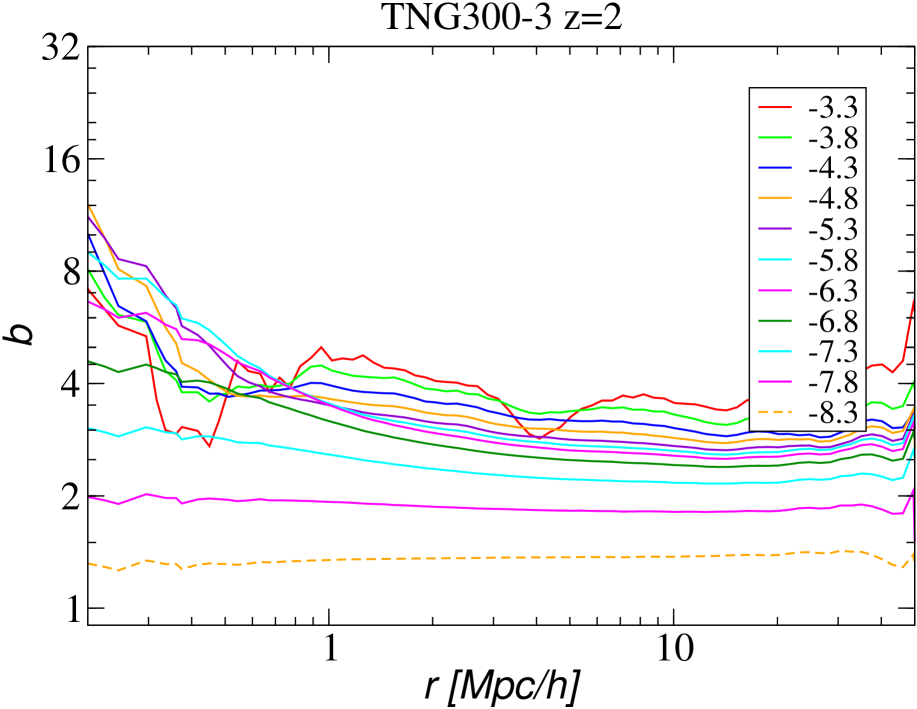
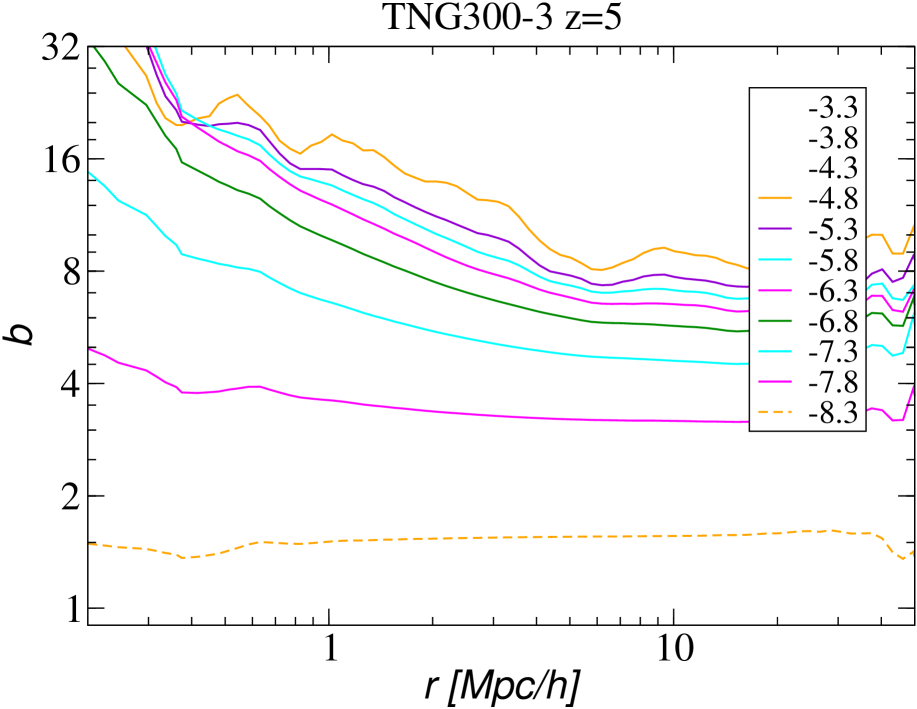
CFs of galaxies divided by CFs of DM define bias functions, see Eq. (1). They are shown in Fig. 5. The top panels are for simulations TNG100-1, and the left, central and right panels are for epochs , and . Various colours are for bias functions of galaxies of different luminosity limits. In the second and third rows of Fig. 5, we present bias functions of particle density limited DM samples of TNG100-3 and TNG300-3 simulations for epochs, . As for CFs we used particle density limits in units, starting from .
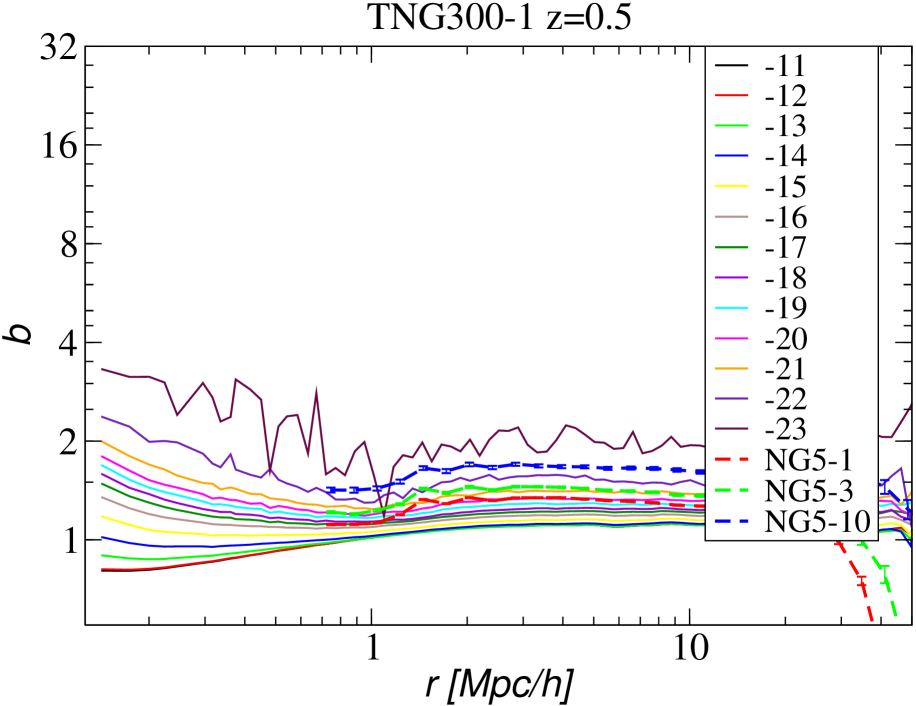
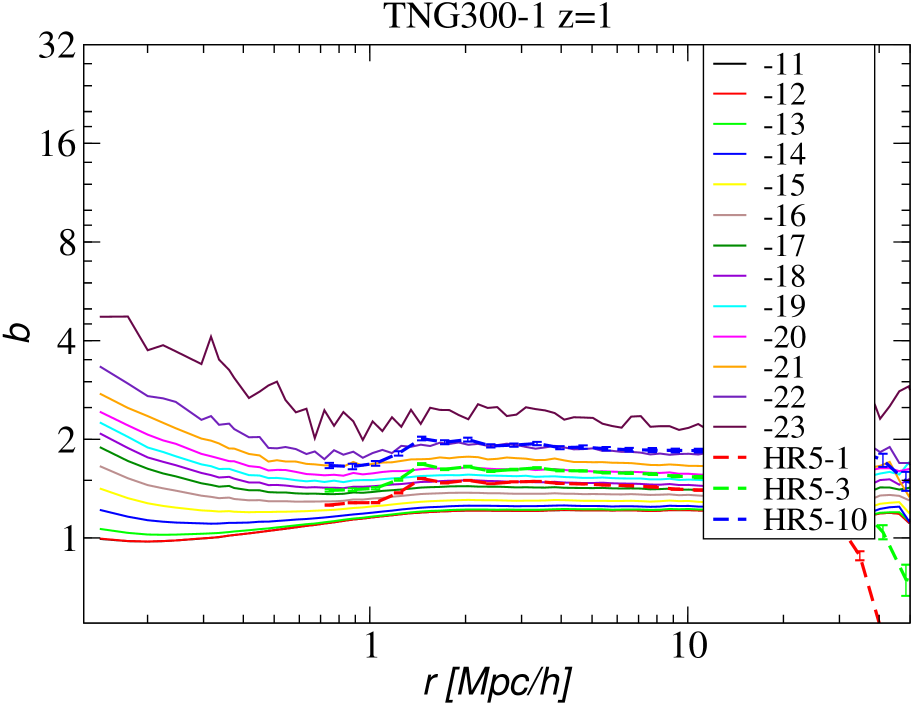
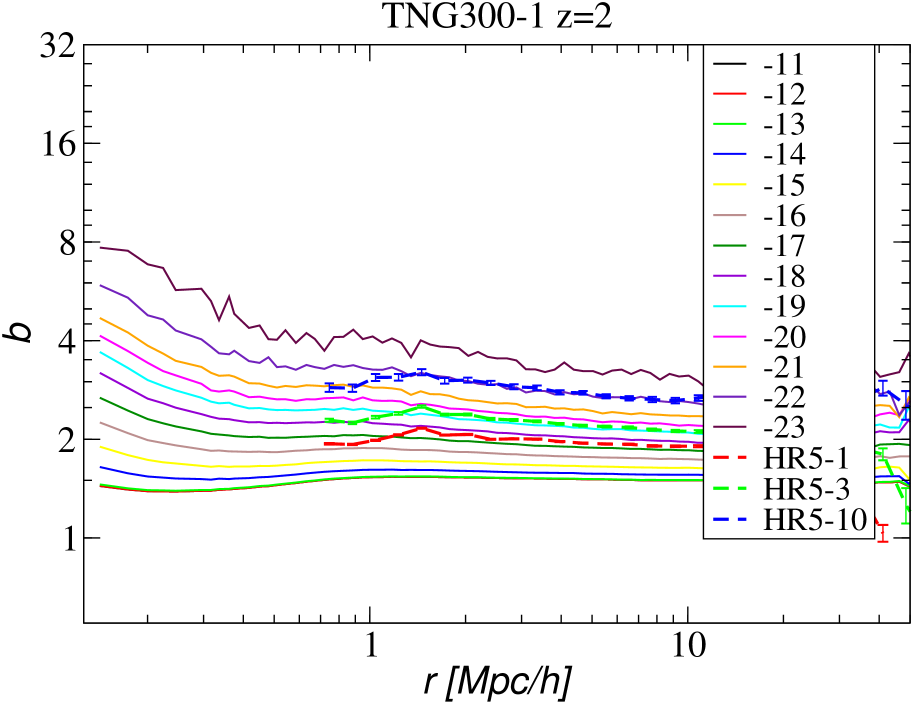
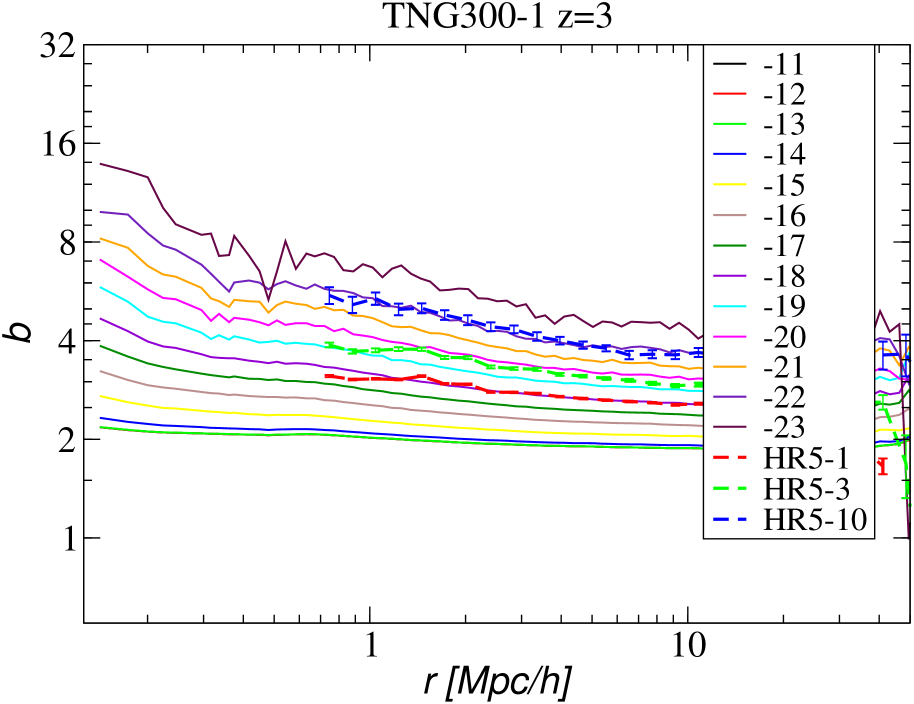
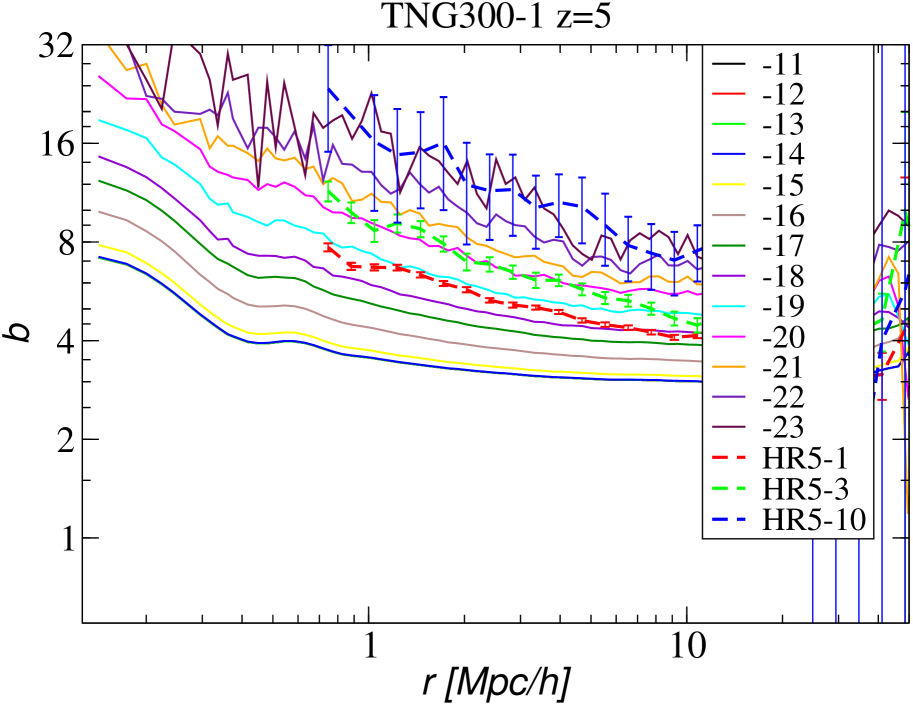
Two bottom rows of Fig. 5 are for bias functions of TNG300-1 simulations for epochs , superposed with bias functions of HR5 simulations for similar epochs, epoch is shown in panel for . Separations of HR5 simulations were reduced to units , using the adopted Hubble constant . Star masses of galaxies are in units .
Bias functions, presented in Fig. 5, have three important properties. The first property is: bias function curves for galaxies of low luminosity, , are almost identical. We discuss this effect in more detail below.
The second important feature is the shape of bias functions for separations, . In this separation range bias functions have larger values than on medium and larger separations. This is due to the effect of halos, which have characteristic diameters up to .
The third feature is the amplitude at very small separations, , for galaxy samples of the lowest luminosities. Here bias functions are lower than at higher separations. This effect is observed for epochs . For the present epoch this means anti-biasing, since . Bias functions of particle density limited DM samples of simulations TNG100-3 and TNG300-3 do not have this feature, in this separation interval and particle density limits their bias functions are almost parallel lines with amplitudes increasing with increasing limit .
4.3 Evolution of bias parameters of luminosity and particle density limited samples of TNG simulations
Following Einasto et al. (2023) we define bias parameters as values of the bias function at separation . Top panels of Fig. 6 present bias parameters for simulations TNG100-1 and TNG300-1 as functions of redshift . Different colours show bias parameters for galaxies of various luminosity. As we see, bias parameters of galaxies form smooth curves, , with amplitudes, increasing with luminosity . With decreasing luminosity bias parameters approach to asymptotic low limits . Low-luminosity limits of simulation TNG100-1 and TNG300-1 almost coincide.
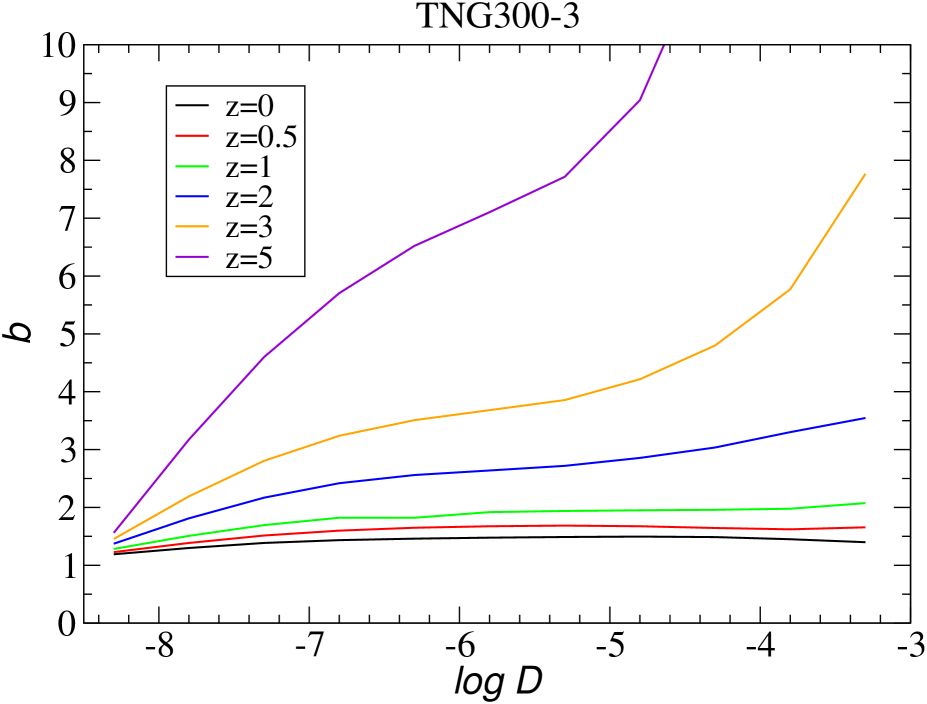
The bottom panels of Fig. 6 show the evolution of bias parameters of particle density limited DM samples of simulations TNG100-3 and TNG300-3 for various limits . Samples with DM particle density limit correspond to the faintest clustered population, similar to the faintest galaxies of simulations TNG100-1 and TNG300-1. The dashed orange line corresponds to DM samples with a limit , i.e. to DM particles below the density limit, needed to form stars and galaxies. The Figure shows that in simulation TNG300-3, the curves for the highest particle density limits are higher than in simulation TNG100-3. This difference is due to various shapes of density distributions, as seen in the bottom panels of Fig. 3.
4.4 Bias parameters as functions of luminosities of galaxies and particle density limits
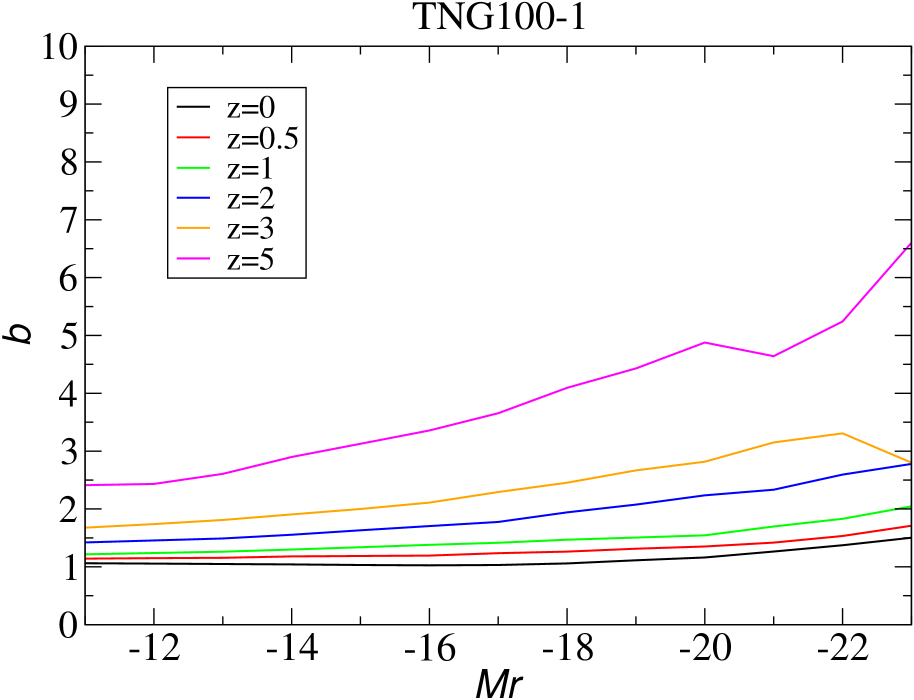
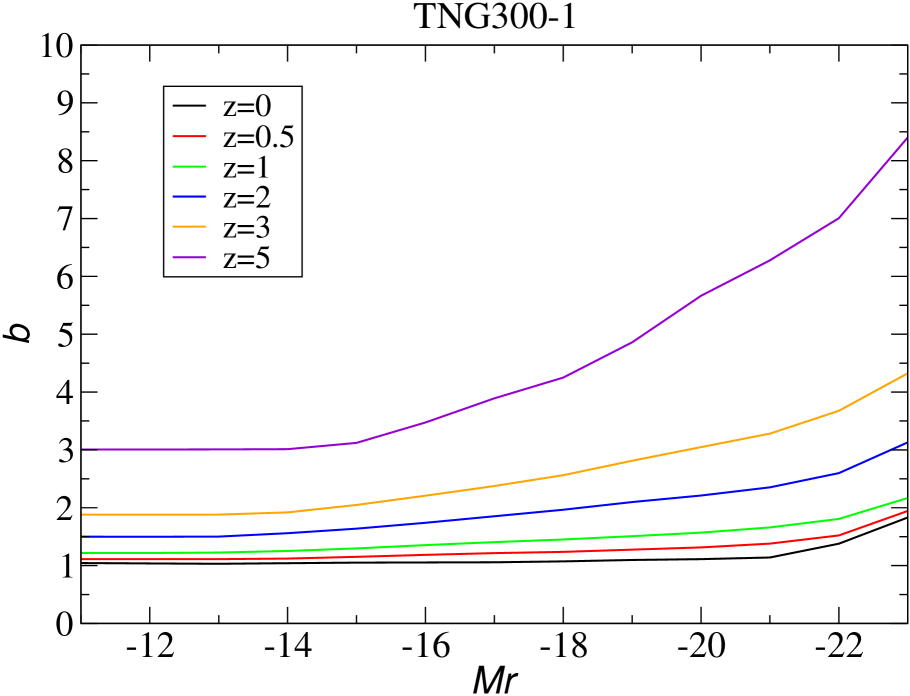
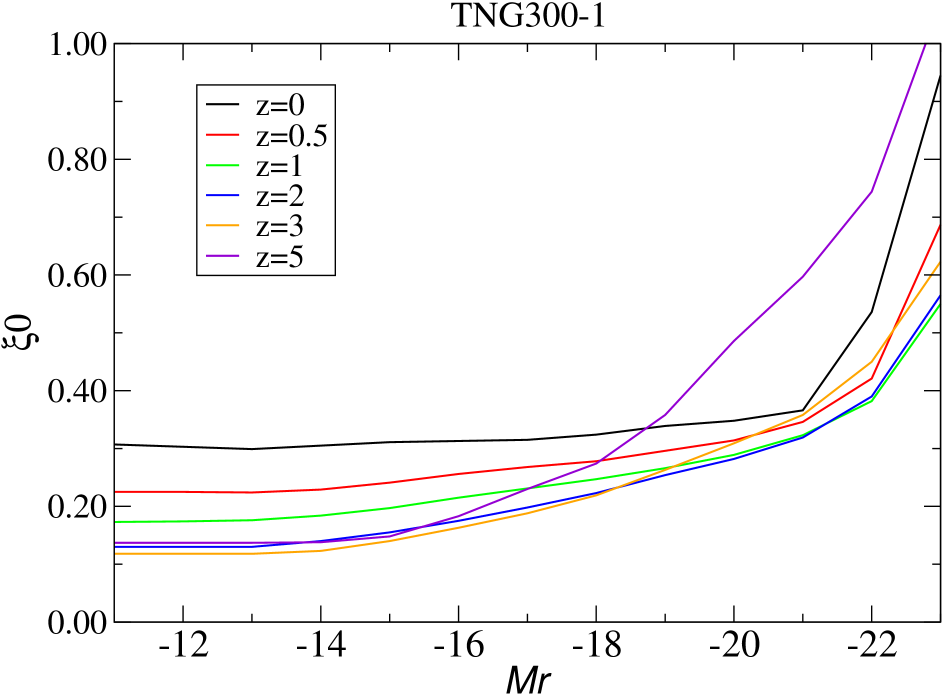
Top panels of Fig. 7 present bias parameters as functions of the luminosity for epochs to . As noticed in the previous subsection, an essential property of bias parameters is that at low and medium luminosities approaches asymptotically a low-luminosity limit, , and rises at luminosities from to , corresponding stellar masses are and ; details depend on simulation epoch .
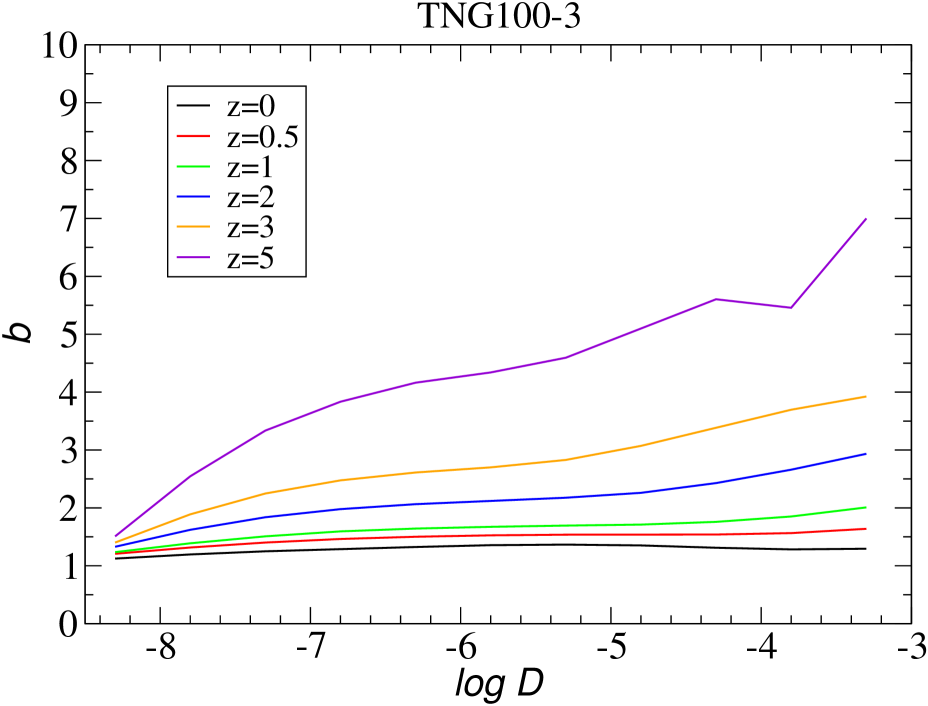
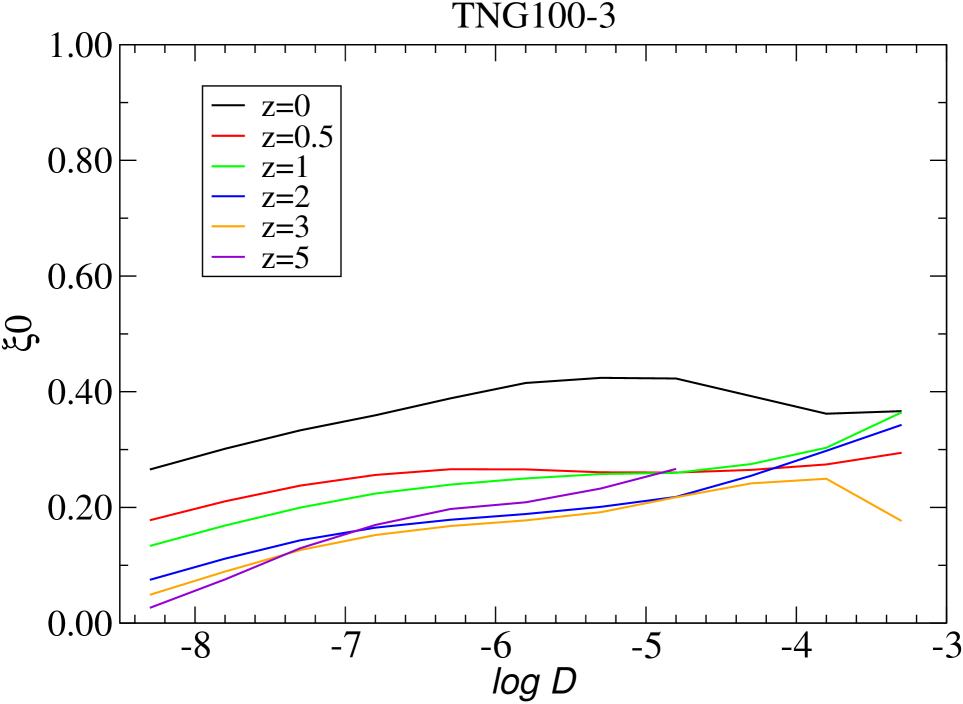
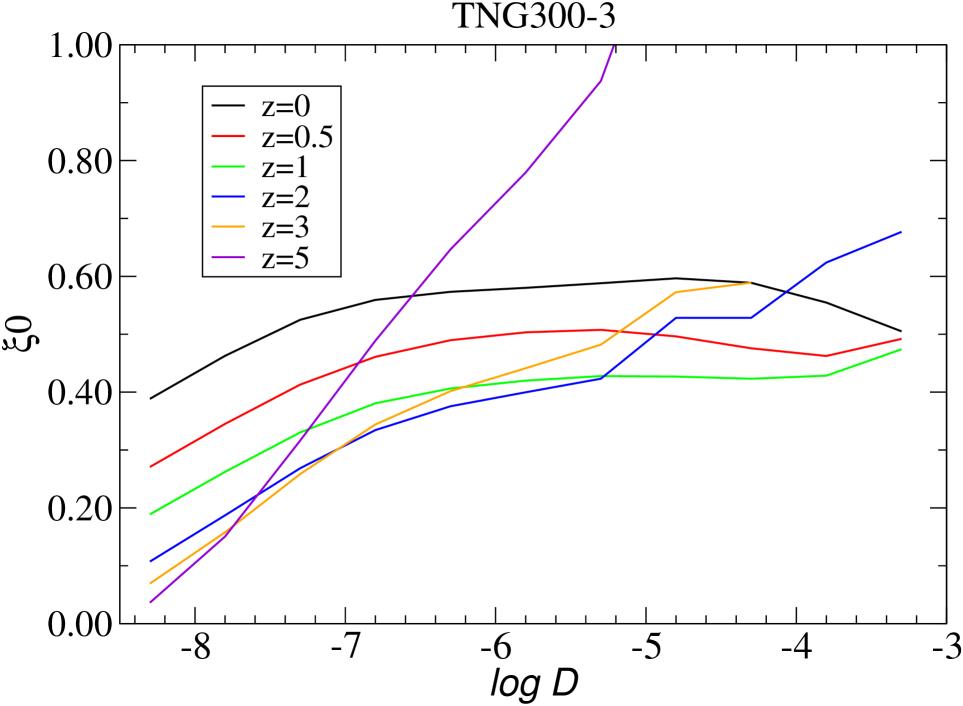
The bottom panels of Fig. 7 show the dependence of bias parameter on particle density limit of clustered DM samples of simulations TNG100-3 and TNG300-3. The dependence of the bias parameter of clustered DM samples of simulations TNG100-3 and TNG300-3 is different from the dependence of bias parameter on luminosities of simulations TNG100-1 and TNG300-1. In the clustered DM samples there is no flat region of the bias function at low particle density limits, . Rather, the amplitudes of curves rise continuously with increasing . Above a very low particle density limit essentially all particles are included, see Fig. 3. Thus the bias parameter should be by definition. The curves really converge to 1 at .
At a particle density limit , the bias parameter values of DM simulations TNG100-3 and TNG300-3 are almost equal to the bias values of the faintest galaxies of TNG100-1 and TNG300-1 simulations, c.f., in the top panels of Fig. 7. At higher particle density limits, the curves of the DM selected samples from TNG100-3 and TNG300-3 are rather similar to the curves of the TNG100-1 and TNG300-1 simulations. The basic difference lies in the bias values for earlier epochs – here curves lie higher than curves. This difference is due to the fact that at earlier epochs identical particle density limits correspond to more luminous galaxies, see Fig. 3.
4.5 Evolution of bias parameters of HR5 simulations
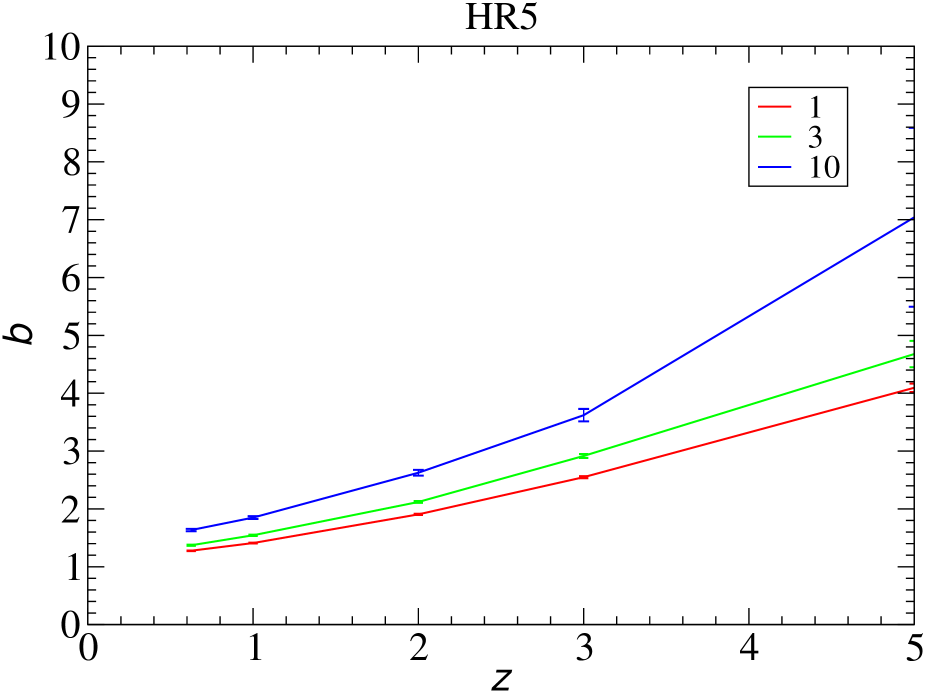
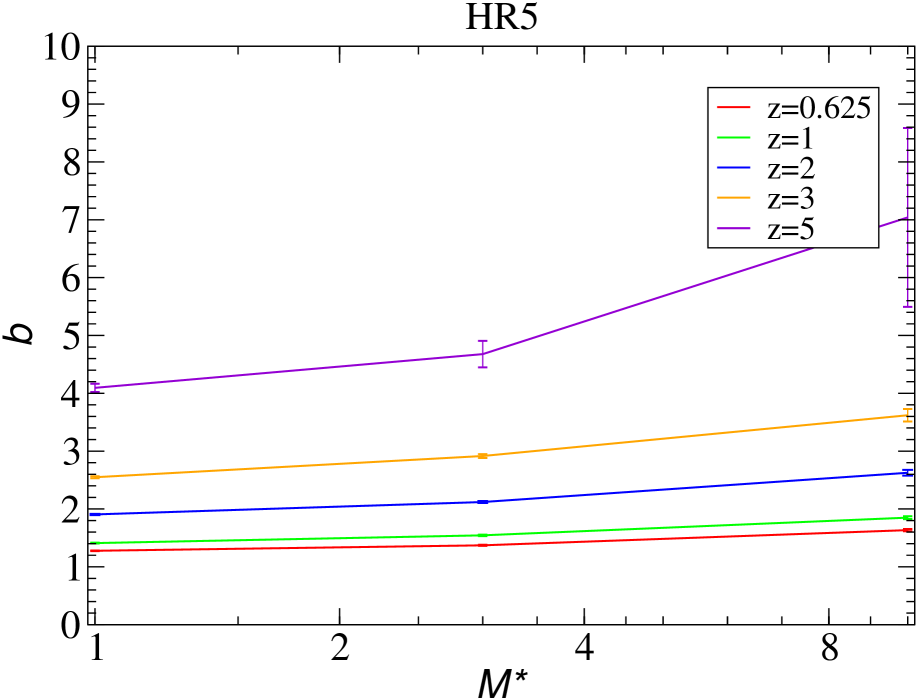
We show in Fig. 8 the evolution of the bias parameter of HR5 simulations. In the left panel, the bias parameter is presented as a function of the epoch , in the right panel, as a function of the mass of simulated galaxies in units . The evolution of the bias parameter of HR5 galaxies is close to that of the TNG300-1 simulations presented in previous Figures. The main difference is the absence of data for epoch and for very low-mass galaxies.
4.6 Amplitudes of CFs at fixed separations
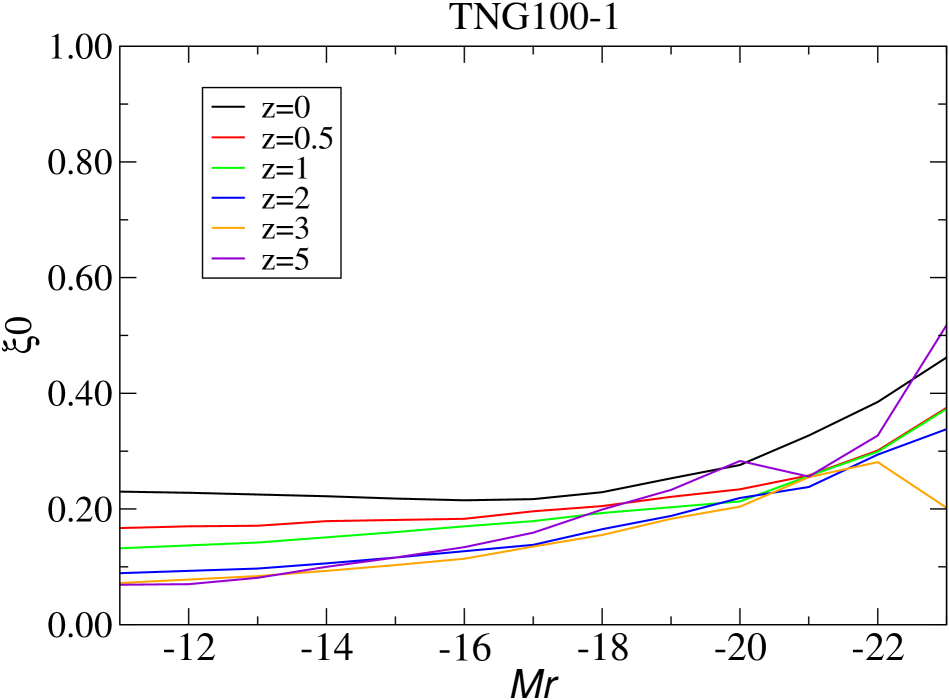
The stable behaviour of the bias parameter of faintest galaxies raises the question: how amplitudes of CFs at a fixed separation evolve with time. As discussed above, we use CF amplitudes at the separation to define bias parameters. We calculated CF amplitudes at separation for TNG100-1 and TNG300-1 simulations as functions of the limiting magnitude , and for TNG100-3 and TNG300-3 simulations as functions of limiting particle density . These dependencies are shown in the top panels of Fig. 9 for TNG100-1 and TNG300-1 galaxy simulations, and in bottom panels of Fig. 9 for TNG100-3 and TNG300-3 DM simulations.
Fig. 9 shows several important properties of amplitudes of CFs. First, the growth of amplitudes of CFs of galaxies with cosmic epoch is very modest, much smaller than the growth of amplitudes of CFs of DM, presented in Fig. 1. This property is well-known, see Springel et al. (2006, 2018). Second, we see a big difference between the shape of and functions of galaxy and DM simulations. In DM simulations TNG100-3 and TNG300-3, there exists no asymptotic flat region of curves on low particle density limit, present in low-luminosity regions of functions of TNG100-1 and TNG300-1 simulations. Second, upper limits of DM densities at high redshifts are much lower than at low redshifts, see Fig. 3, thus curves for high redshifts rise rapidly with increasing , since they correspond to particles with higher density limits. The third essential difference between amplitudes of CFs of galaxy and DM simulations is the level of at low-luminosity regions: in DM simulations TNG100-3 and TNG300-3, it is higher than in the galaxy simulations TNG100-1 and TNG300-1.
We also calculated the evolution of correlation lengths of TNG100-1 and TNG300-1 simulations, , for limited samples. Results are similar to functions , found by Springel et al. (2018), and are not presented here.
4.7 Bias parameter of faintest galaxies and the fraction of matter in the clustered population
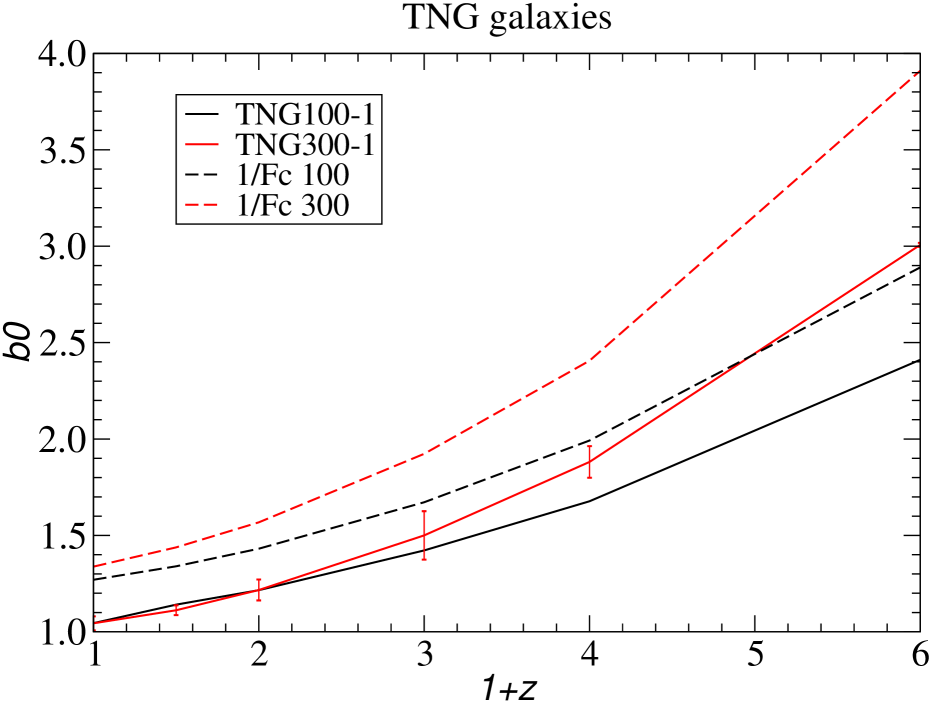
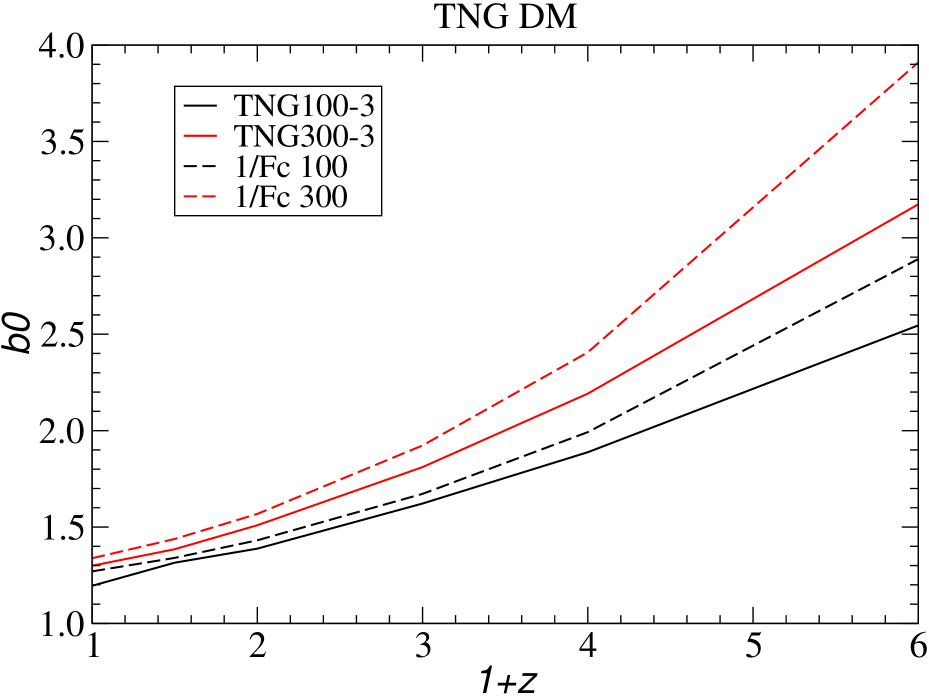
Our analysis shows that the bias parameter of faintest galaxies, , is a well-defined quantity, almost independent of the luminosity of galaxies but dependent on the evolutionary epoch . We determined the asymptotic bias parameter of faintest galaxies, , for TNG100-1 and TNG300-1 simulations. Bias parameter curves for luminosities of simulation TNG100-1 vary slightly. We accepted the asymptotic value . Fig. 10 shows the dependence of on cosmic epoch . Our data show that simulations TNG100-1 and TNG300-1 yield similar results for the asymptotic bias parameter of faintest galaxies similar results for the present epoch .
The right panel of Fig. 10 shows the evolution of the bias parameter of DM simulations TNG100-3 and TNG300-3. The particle density , extracted from the TNG website, includes all matter: DM plus baryonic gas and stellar matter. The value for stellar matter is not given on the TNG website. We used a two-step procedure to determine the lower limit for stellar matter. First, we found the distribution of the fraction of matter in the clustered population, , of the DM-only simulations TNG100-3 and TNG300-3, using the cumulative distribution of particle densities, see for reference in Fig. 3 differential distributions of particle densities, . In the next step, we compared cumulative distributions of particle densities with bias parameter distributions for various particle density limit , shown in Fig. 7. This comparison showed that for particle density limit functions and are very close, and also close to the value for galaxy simulations. We use this particle density limit as the limit for faintest stellar systems in TNG100-3 and TNG300-3 simulations. Dashed curves in Fig. 10 show the inverse of the fraction of the clustered population, for TNG100-3 and TNG300-3 simulations. The Figure shows that at the present epoch both DM simulations yield for very close values, almost identical to the expected value from the fraction of the clustered population, .
We use the same curves, found for the TNG100-3 and TNG300-3 DM particle simulations, also for TNG100-1 and TNG300-1 galaxy simulations, shown in the left panel of Fig. 10 by dashed curves. We see that curves of simulations TNG100-3 and TNG300-3 lie higher than the actual curves of TNG100-1 and TNG300-1 simulations.
Fig. 10 shows that the curves of simulations TNG300 for both data types lie higher than those of simulation TNG100; the difference increases with epoch . The difference is probably due to varying evolutionary histories of dwarf halos since in the higher resolution simulation TNG100, the number of dwarf galaxies is much higher than in TNG300, see Fig. 3.
5 Discussion
In this Section we discuss how bias functions and bias parameters represent properties of the cosmic web.
5.1 The shape of evolving correlation and bias functions
5.1.1 The shape of correlation and bias functions at large separations
Correlation and bias functions of simulated galaxies are presented in Figs. 4 to 8. These Figures show that the bias parameters decrease during the evolution. This result is not new; it confirms earlier studies by Tegmark & Peebles (1998), Springel et al. (2005, 2018), Park et al. (2022) and Einasto et al. (2023). The evolution of the correlation and bias functions of galaxies in simulations TNG300-1 and HR5 are very similar as demonstrated in two bottom panels of Fig. 5, where we show bias functions for the whole set of simulation epochs to . The bias functions of HR5 simulations lie very close to the bias functions of TNG300-1 simulations. Bias parameters of HR5 simulations are almost identical to bias parameters of TNG300-1 galaxies: HR5 mass limits (in units ) corresponds to magnitude limits of TNG300-1 simulation , for all simulation epochs with a small scatter of the order mag. Despite the different simulation programs and recipes of galaxy formation and evolution, this similarity is remarkable.
Another similarity is in the shape of correlation and bias functions for TNG100 and TNG300 simulations. At epoch , these functions for both simulations are very close; at higher redshifts, the values of the bias functions of the simulation TNG300 for luminous galaxies are higher; see Figs. 5 – 7. This difference is due to slightly various evolutionary stages of luminous galaxies in TNG100 and TNG300 simulations, also seen in the shape of the luminosity distributions in Fig. 3.
Bias functions of TNG300-3 DM simulations are presented in the third row of Fig. 5, and of CDM simulations in Fig. 5 of Einasto et al. (2023). This comparison shows that in the separation interval the shapes of bias functions of TNG300-3 DM simulations are very close to the shapes of bias functions of CDM simulation in box of size . Both simulations have approximately equal volumes. Also the evolution of the bias parameters with cosmic epoch are similar: compare bottom row of Fig 6 and left panels of Fig. 6 by Einasto et al. (2023). In both Figures at low particle density limits lines are almost independent on , and increase with for higher particle density limits .
5.1.2 The shape of correlation and bias functions on small separations
At around separation , the correlation and bias functions depend on the structure of the halos. Galaxies and DM particles are located in identical halos, and the density-limited–DM particle pair counts are higher, which raises the amplitude of CFs. This remarkable feature is well known from earlier studies, see among others Chiang et al. (2013), Springel et al. (2018) and Einasto et al. (2023); it corresponds to the one-halo term in Halo Models (Asgari et al., 2023). Halos are gravitationally stable systems detached from the expansion. In comoving units, halos were larger in the past.
On small separations , an important difference in bias functions between galaxy and DM simulations emerges on Fig. 5; compare top and bottom rows. The bias functions of simulations TNG100-1 and TNG300-1 are made for galaxy–galaxy pairs, simulations TNG100-3 and TNG300-3 for particle density-limited DM particle pairs. In galaxy–galaxy pairs, the bias functions in this separation interval have depressions, but bias functions of DM particle pairs are flat, forming almost parallel lines for particle density limits . This depression in galaxy–galaxy pairs is also seen in the analysis by Springel et al. (2018). These separations correspond to central regions of halos (clusters of galaxies). A possible explanation of this phenomenon is that near the centres of clusters, a large fraction of faint galaxies is “eaten” by more massive galaxies.
5.2 Amplitudes of correlation and bias functions
5.2.1 Bias parameters of low luminosity galaxies
The basic difference between TNG100-1 and TNG300-1 galaxy simulations on the one side and TNG100-3 and TNG300-3 DM particle simulations on the other side is in the shape of bias functions in low and intermediate luminosity and particle density ranges. As shown in Fig. 7, the bias parameter of galaxy simulations TNG100-1 and TNG300-1 is constant for a broad interval of luminosity, for present epoch , and for for early epoch . In contrast, the bias parameter of DM TNG100-3 and TNG300-3 simulations rises continuously with increasing particle density limit . The approximating of the function to a low asymptotic level was found by Norberg et al. (2001) from the 2dF Galaxy Redshift survey and by Zehavi et al. (2011) and Einasto et al. (2020) for SDSS galaxies. A similar phenomenon was found by Einasto et al. (2020) for Millennium simulation galaxies in magnitude interval , and for EAGLE simulations in magnitude interval .
These differences between galaxy and DM simulations mean that the transition of the DM filamentary web from higher to lower levels is a continuous process, but the transition of the filamentary web of galaxies to lower luminosities has a sharp limit. In other words, there is no population of dwarf galaxies in faint DM filaments – faint dwarf galaxies are located in the same filamentary web as brighter ones \textcolorblack and the properties of galaxies are largely shaped by their birthplace in the cosmic web (initial conditions for galaxy formation) (Repp & Szapudi, 2019b; Einasto et al., 2022). Differences between filamentary webs of galaxies and DM are clear in Fig. 2. The upper panel displays the faint DM web that is absent from the bottom panel of the galaxy-defined web; see also Springel et al. (2005, 2018).
The constant level of the bias function at low luminosities raises the question of the galaxy distribution in voids. When large voids were detected by Gregory & Thompson (1978), Jõeveer et al. (1978), and Kirshner et al. (1981), then Dekel & Silk (1986) and Dekel (1986) assumed that giant galaxies form in high-density regions, but dwarf galaxies can also form in voids. To check the presence of void galaxies Einasto (1988, 1990) compared distributions of faint and bright galaxies in and around the Virgo supercluster and found that both types of galaxies occupy identical regions. The study by Lindner et al. (1995); Lindner et al. (1996) showed that dwarf galaxies are located near void boundaries, and that they are not randomly distributed in voids. The void phenomenon was studied by Peebles (2001), Tinker & Conroy (2009), and Neyrinck et al. (2014). Using numerical simulations, Tinker & Conroy (2009) found that the boundary between filaments and voids in the galaxy distribution is nearly as sharp for dwarfs as for galaxies. Note that this observation does not exclude the presence of some isolated dwarf galaxies in the outer surrounding of brighter galaxies, similar to dwarf galaxies observed recently by Rizzi et al. (2017), Karachentsev et al. (2023) and Makarova et al. (2023).
For the present epoch , the galaxy simulations TNG100-1 and TNG300-1 yield samples with almost identical asymptotic values of the bias parameter of low-luminosity galaxies, and respectively. This suggests that the mean asymptotic bias parameter of the lowest luminosity galaxies in the present epoch has a mean value . For the epoch , the DM simulations TNG100-3 and TNG300-3 also yield particle density-limited samples with similar bias values, and , respectively, with a mean value . The error was estimated from the difference of values for simulations TNG100-3 and TNG300-3. This bias value is only 1.2 times higher than for galaxy samples. For earlier epochs curves for simulations TNG100 and TNG300 diverse, both for galaxy and particle-density-limited samples. As discussed by Einasto et al. (2023), in earlier epochs, fixed luminosity and particle density limits correspond to more advanced stages of evolution, see Fig. 3, which raises the amplitudes of the bias parameters.
5.2.2 Amplitudes of correlation and bias functions as cosmological parameters
One possibility to define the bias parameter is to use Halo Models (HM) of large-scale structure, for a recent review, see Asgari et al. (2023). In the HM model the bias is defined as a function of mass, , and it satisfies normalisation conditions: and , where is the halo mass function, and is the mean comoving cosmological matter density. In the HM prescription, low-mass halos are anti-biased () with a constant asymptotic value at low mass. In HM, the bias function is defined with respect to the characteristic mass , where the transition to biased objects occurs. HM is based on tacit or implicit assumptions that all matter is contained in halos, and the matter in low-density regions outside halos can be ignored. We drop the second assumption when we study the effect of particles in low-density regions on the bias phenomenon.
It is well-known that amplitudes of correlation and bias functions depend on cosmological factors: (i) cosmological parameters: matter-energy densities , (ii) the present rms matter fluctuation amplitude averaged over a sphere of radius , ; (iii) luminosities of galaxies (Kaiser, 1984); (iv) systematic motions of galaxies in clusters – the finger of God effect, (v) the flow of galaxies toward attractors (Kaiser, 1987) and (vi) the thickness of observational samples, if 3D CFs are determined by the inversion of 2D CFs (Einasto et al., 2021b). The present study is based on numerical simulations of the cosmic web, where the last three effects are not present. We use simulations with fixed density and parameters, thus the essential cosmological parameter is the luminosity of galaxies (and the particle density limit in DM simulations). However, our study shows that amplitudes of correlation and bias functions depend on one more factor – the fraction of matter in voids and in the clustered population, which is the topic of the next subsection.
5.2.3 Bias parameter and the fraction of matter in the clustered population
As noted in the Introduction, Einasto et al. (1994); Einasto et al. (1999); Einasto et al. (2019b, 2023) investigated the relation between clustered and total matter using DM only numerical simulations of the evolution of the cosmic web. Clustered matter was identified with samples of DM particles with local densities above a certain threshold, . The main result of these studies was the establishment of a relation between the bias parameter and the fraction of matter in the clustered population, : . Einasto et al. (2023) found that the relation is well fulfilled for low particle density limits .
Our analysis shows that correlation and bias functions depend on the nature of objects used in their determination. The expected relationship between the bias parameter and the fraction of matter in the clustered population is fulfilled in DM simulations TNG100-3 and TNG300-3. In these cases, the bias is defined using DM particles: CFs based on numbers of particles in high-density regions above the threshold level , are divided by CFs found from numbers of all particles of the full DM particle sample. In simulations TNG100-1 and TNG300-1 the bias parameter is defined using CFs of galaxies of luminosity , divided by CFs of DM particle samples. In this case, in Eq. (1), numerators and denominators are objects of different nature: galaxies do not have a simple relationship to a threshold in the corresponding DM field. Our analysis has shown that the relationship between the bias parameter, , and the respective fraction of the clustered matter, , is not fulfilled in this case. Measured functions for low-luminosity galaxies of simulations TNG100-1 and TNG300-1 lie considerably lower than expected functions , by a factor of , over the whole range of simulation epochs .
In the present study, we used the separation to measure the bias parameter . Using this separation, we found for the bias parameter of lowest luminosity galaxies, , both for TNG100-1 and TNG300-1. If a lower separation would be used, , then the bias parameter of lowest luminosity galaxies at the present epoch would be smaller, , see left panels of top and second rows of Fig. 5. Springel et al. (2005) has found that at the present epoch, galaxies are slightly antibiased with . This means there is no room for particles in the unclustered population, , if the relation is valid.
During evolution, matter flows from low-density regions to high-density ones. The outflow of matter from voids toward superclusters was investigated using velocity field data by Tully et al. (2008, 2014), Carlesi et al. (2016), Sorce et al. (2016), Rizzi et al. (2017), and Anand et al. (2019). However, gravity cannot evacuate voids completely, thus there is always some matter in voids. \textcolorblackNote that this matter has a low correlation compared to the highly clustered regions (Repp & Szapudi, 2022). Therefore we can neglect its correlations to zeroth order and refer to it as unclustered. Thus, the bias parameter of galaxies must be greater than unity, over the whole range of evolution epochs.
The principal result of this study is the establishment of the difference between properties of correlation and bias functions of galaxies and DM particle samples. In earlier studies, bias properties were investigated using either galaxy or DM data: the fraction of matter in the clustered population was not used. For the first time, we use both types of test particles, galaxies and samples of DM particles, in identical simulations. Thus we avoid potential misinterpretations resulting from using different test particles and data samples.
All previous studies have shown that the bias parameter depends on the luminosity of galaxies (particle density limit). However, only the bias function of DM particle samples satisfies the criterion. This means that correlation and bias functions of only DM particle samples \textcolorblackproperly measure the relationship between galaxies and DM. The general conclusion of this study is that correlation and bias functions of galaxies and DM particle samples measure different properties of the cosmic web. This result is no surprise. As shown recently by Ouellette et al. (2023), a topological analysis of TNG simulations reveals the presence of differences between simulated galaxies and DM halos.
6 Conclusions
We investigated properties of correlation and bias functions and bias parameters using two types of data: simulated galaxies and DM particles. For both data types, we applied several input sources, for galaxies TNG100-1, TNG300-1 and HR5 simulations, and for DM particle samples TNG100-3, TNG300-3 simulations and CDM simulations by Einasto et al. (2023). Our analysis showed that essential properties of correlation and bias functions of simulated galaxies using various data sources are consistent. The same consistency of correlation and bias functions is also observed using all particle density-limited simulations. In contrast, essential differences exist between correlation and bias functions of luminosity-limited samples of galaxies on the one side and particle density-limited samples on the other. The fundamental results of our study can be listed as follows.
-
1.
The bias parameter of low luminosity galaxies approaches an asymptotic level ; at the present epoch for galaxy samples in TNG100-1 and TNG300-1 and HR5 simulations. A flat region of the bias function at low luminosities suggests that faint dwarf galaxies are located in the same filamentary web as brighter galaxies.
-
2.
The bias parameters of particle density limited samples of DM particles of TNG100-3 and TNG300-3 simulations form a continuous sequence with decreasing , which suggests that the transition of the filamentary DM web from higher to lower particle density limit is continuous. For the present epoch, the DM simulations TNG100-3 and TNG300-3 yield for the bias parameter a value . This should correspond to the lowest luminosity galaxies.
-
3.
Cosmic web consists of filamentary structures of various densities. The fractions of matter in the clustered and the unclustered populations are less than unity. For this reason, the bias parameter of the clustered matter is for all cosmic epochs.
-
4.
Bias parameter from density-limited DM samples in TNG100-3 and TNG300-3 agrees with expectations from the fraction of particles in the clustered population: .
-
5.
Bias parameter of galaxy samples in TNG100-1 and TNG300-1 is in disagreement with the constraint. This means that correlation and bias functions, calculated for objects of different natures (galaxies vs. density-limited samples of DM particles) describe properties of the cosmic web differently.
We do not fully understand the differences in correlation and bias functions for galaxies and density-limited DM populations. In particular, the measurements conflict with predictions from the fraction of particles in voids. We note that opinions on the role of the unclustered matter in voids to general properties of the web are different. Einasto et al. (1994, 2023) used a simple analytic model to estimate the fraction of matter in voids. Their analysis suggests that the void fraction decreases with time. In contrast, the analytic model by Sheth & van de Weygaert (2004) indicates that the fraction of mass in voids is constant over time. The role unclustered matter in voids plays in the clustering of the cosmic web deserves further study.
Acknowledgements
We thank the TNG collaboration for publicly releasing their simulation data and example analysis scripts, Neta Bahcall, Jim Peebles, Dmitri Pogosyan and Brent Tully for stimulating discussions, and the anonymous referee for useful suggestions.
This work was supported by institutional research funding IUT40-2 of the Estonian Ministry of Education and Research, by the Estonian Research Council grant PRG803, and by Mobilitas Plus grant MOBTT5. We acknowledge the support by the Centre of Excellence “Dark side of the Universe” (TK133) financed by the European Union through the European Regional Development Fund. The study has been also supported by Kavli Institute for Theoretical Physics, University of California, Santa Barbara, through the program “The Cosmic Web: Connecting Galaxies to Cosmology at High and Low Redshifts”, and by ICRAnet through a professorship for Jaan Einasto.
Data availability
All data on TNG100 and TNG300 simulations used in this work are publicly available. Any other data will be shared upon reasonable request to the corresponding author.
References
- Anand et al. (2019) Anand G. S., Tully R. B., Rizzi L., Shaya E. J., Karachentsev I. D., 2019, ApJ, 880, 52
- Asgari et al. (2023) Asgari M., Mead A. J., Heymans C., 2023, arXiv e-prints, p. arXiv:2303.08752
- Bardeen et al. (1986) Bardeen J. M., Bond J. R., Kaiser N., Szalay A. S., 1986, ApJ, 304, 15
- Blanton et al. (1999) Blanton M., Cen R., Ostriker J. P., Strauss M. A., 1999, ApJ, 522, 590
- Bond et al. (1996) Bond J. R., Kofman L., Pogosyan D., 1996, Nature, 380, 603
- Carlesi et al. (2016) Carlesi E., et al., 2016, MNRAS, 458, 900
- Cen & Ostriker (1992) Cen R., Ostriker J. P., 1992, ApJL, 399, L113
- Cen & Ostriker (2000) Cen R., Ostriker J. P., 2000, ApJ, 538, 83
- Chiang et al. (2013) Chiang Y.-K., Overzier R., Gebhardt K., 2013, ApJ, 779, 127
- Davis et al. (1985) Davis M., Efstathiou G., Frenk C. S., White S. D. M., 1985, ApJ, 292, 371
- Dekel (1986) Dekel A., 1986, Comments on Astrophysics, 11, 235
- Dekel & Rees (1987) Dekel A., Rees M. J., 1987, Nature, 326, 455
- Dekel & Silk (1986) Dekel A., Silk J., 1986, ApJ, 303, 39
- Desjacques et al. (2018) Desjacques V., Jeong D., Schmidt F., 2018, Phys. Rep., 733, 1
- Doroshkevich et al. (1980) Doroshkevich A. G., Kotok E. V., Poliudov A. N., Shandarin S. F., Sigov I. S., Novikov I. D., 1980, MNRAS, 192, 321
- Doroshkevich et al. (1982) Doroshkevich A. G., Shandarin S. F., Zeldovich I. B., 1982, Comments on Astrophysics, 9, 265
- Dubois et al. (2016) Dubois Y., Peirani S., Pichon C., Devriendt J., Gavazzi R., Welker C., Volonteri M., 2016, MNRAS, 463, 3948
- Einasto (1988) Einasto M., 1988, MNRAS, 234, 37
- Einasto (1990) Einasto M., 1990, MNRAS, 242, 56
- Einasto & Saar (1987) Einasto J., Saar E., 1987, in Hewitt A., Burbidge G., Fang L. Z., eds, IAU Symposium Vol. 124, Observational Cosmology. pp 349–358
- Einasto et al. (1991) Einasto J., Einasto M., Gramann M., Saar E., 1991, MNRAS, 248, 593
- Einasto et al. (1994) Einasto J., Saar E., Einasto M., Freudling W., Gramann M., 1994, ApJ, 429, 465
- Einasto et al. (1999) Einasto J., Einasto M., Tago E., Müller V., Knebe A., Cen R., Starobinsky A. A., Atrio-Barandela F., 1999, ApJ, 519, 456
- Einasto et al. (2019a) Einasto J., Suhhonenko I., Liivamägi L. J., Einasto M., 2019a, A&A, 623, A97
- Einasto et al. (2019b) Einasto J., Liivamägi L. J., Suhhonenko I., Einasto M., 2019b, A&A, 630, A62
- Einasto et al. (2020) Einasto J., Hütsi G., Kuutma T., Einasto M., 2020, A&A, 640, A47
- Einasto et al. (2021a) Einasto J., Hütsi G., Suhhonenko I., Liivamägi L. J., Einasto M., 2021a, A&A, 647, A17
- Einasto et al. (2021b) Einasto J., Hütsi G., Einasto M., 2021b, A&A, 652, A152
- Einasto et al. (2022) Einasto M., Kipper R., Tenjes P., Einasto J., Tempel E., Liivamägi L. J., 2022, A&A, 668, A69
- Einasto et al. (2023) Einasto J., Liivamägi L. J., Einasto M., 2023, MNRAS, 518, 2164
- Gramann (1987) Gramann M., 1987, Tartu Astr. Obs. Publ., 52, 216
- Gramann (1988) Gramann M., 1988, MNRAS, 234, 569
- Gregory & Thompson (1978) Gregory S. A., Thompson L. A., 1978, ApJ, 222, 784
- Ishiyama et al. (2021) Ishiyama T., et al., 2021, MNRAS, 506, 4210
- Jõeveer & Einasto (1978) Jõeveer M., Einasto J., 1978, in Longair M. S., Einasto J., eds, IAU Symposium Vol. 79, Large Scale Structures in the Universe. pp 241–250
- Jõeveer et al. (1978) Jõeveer M., Einasto J., Tago E., 1978, MNRAS, 185, 357
- Jensen & Szalay (1986) Jensen L. G., Szalay A. S., 1986, ApJL, 305, L5
- Jing (2005) Jing Y. P., 2005, ApJ, 620, 559
- Kaiser (1984) Kaiser N., 1984, ApJL, 284, L9
- Kaiser (1987) Kaiser N., 1987, MNRAS, 227, 1
- Karachentsev et al. (2023) Karachentsev I. D., Makarova L. N., Koribalski B. S., Anand G. S., Tully R. B., Kniazev A. Y., 2023, MNRAS, 518, 5893
- Kirshner et al. (1981) Kirshner R. P., Oemler Jr. A., Schechter P. L., Shectman S. A., 1981, ApJL, 248, L57
- Landy & Szalay (1993) Landy S. D., Szalay A. S., 1993, ApJ, 412, 64
- Lee et al. (2021) Lee J., et al., 2021, ApJ, 908, 11
- Li & White (2009) Li C., White S. D. M., 2009, MNRAS, 398, 2177
- Lindner et al. (1995) Lindner U., Einasto J., Einasto M., Freudling W., Fricke K., Tago E., 1995, A&A, 301, 329
- Lindner et al. (1996) Lindner U., et al., 1996, A&A, 314, 1
- Little & Weinberg (1994) Little B., Weinberg D. H., 1994, MNRAS, 267, 605
- Makarova et al. (2023) Makarova L. N., Tully R. B., Anand G. S., Lambert T. S., Sharina M. E., Koribalski B. S., Kraan-Korteweg R. C., 2023, ApJ, 943, 139
- Mo & White (1996) Mo H. J., White S. D. M., 1996, MNRAS, 282, 347
- Nelson et al. (2015) Nelson D., et al., 2015, Astronomy and Computing, 13, 12
- Neyrinck et al. (2014) Neyrinck M. C., Aragón-Calvo M. A., Jeong D., Wang X., 2014, MNRAS, 441, 646
- Norberg et al. (2001) Norberg P., et al., 2001, MNRAS, 328, 64
- Ouellette et al. (2023) Ouellette A., Holder G., Kerman E., 2023, arXiv e-prints, p. arXiv:2302.01363
- Park et al. (2022) Park C., et al., 2022, ApJ, 937, 15
- Peebles (2001) Peebles P. J. E., 2001, ApJ, 557, 495
- Pillepich et al. (2018a) Pillepich A., et al., 2018a, MNRAS, 473, 4077
- Pillepich et al. (2018b) Pillepich A., et al., 2018b, MNRAS, 475, 648
- Repp & Szapudi (2019a) Repp A., Szapudi I., 2019a, arXiv e-prints, p. arXiv:1904.05048
- Repp & Szapudi (2019b) Repp A., Szapudi I., 2019b, arXiv e-prints, p. arXiv:1912.05557
- Repp & Szapudi (2020) Repp A., Szapudi I., 2020, MNRAS, 493, 3449
- Repp & Szapudi (2022) Repp A., Szapudi I., 2022, MNRAS, 509, 586
- Rizzi et al. (2017) Rizzi L., Tully R. B., Shaya E. J., Kourkchi E., Karachentsev I. D., 2017, ApJ, 835, 78
- Schaye et al. (2015) Schaye J., et al., 2015, MNRAS, 446, 521
- Sheth & Tormen (1999) Sheth R. K., Tormen G., 1999, MNRAS, 308, 119
- Sheth & van de Weygaert (2004) Sheth R. K., van de Weygaert R., 2004, MNRAS, 350, 517
- Sorce et al. (2016) Sorce J. G., et al., 2016, MNRAS, 455, 2078
- Springel et al. (2005) Springel V., et al., 2005, Nature, 435, 629
- Springel et al. (2006) Springel V., Frenk C. S., White S. D. M., 2006, Nature, 440, 1137
- Springel et al. (2018) Springel V., et al., 2018, MNRAS, 475, 676
- Szapudi & Szalay (1993) Szapudi I., Szalay A. S., 1993, ApJ, 414, 493
- Szapudi et al. (2005) Szapudi I., Pan J., Prunet S., Budavári T., 2005, ApJL, 631, L1
- Tegmark & Peebles (1998) Tegmark M., Peebles P. J. E., 1998, ApJL, 500, L79
- Tinker & Conroy (2009) Tinker J. L., Conroy C., 2009, ApJ, 691, 633
- Tinker et al. (2010) Tinker J. L., Robertson B. E., Kravtsov A. V., Klypin A., Warren M. S., Yepes G., Gottlöber S., 2010, ApJ, 724, 878
- Tully & Fisher (1978) Tully R. B., Fisher J. R., 1978, in Longair M. S., Einasto J., eds, IAU Symposium Vol. 79, Large Scale Structures in the Universe. p. 214
- Tully et al. (2008) Tully R. B., Shaya E. J., Karachentsev I. D., Courtois H. M., Kocevski D. D., Rizzi L., Peel A., 2008, ApJ, 676, 184
- Tully et al. (2014) Tully R. B., Courtois H., Hoffman Y., Pomarède D., 2014, Nature, 513, 71
- Vogelsberger et al. (2014a) Vogelsberger M., et al., 2014a, MNRAS, 444, 1518
- Vogelsberger et al. (2014b) Vogelsberger M., et al., 2014b, Nature, 509, 177
- White & Rees (1978) White S. D. M., Rees M. J., 1978, MNRAS, 183, 341
- Zehavi et al. (2011) Zehavi I., et al., 2011, ApJ, 736, 59
- Zeldovich et al. (1982) Zeldovich Y. B., Einasto J., Shandarin S. F., 1982, Nature, 300, 407