ʻ ‘
Towards a Benchmark for Fog Data Processing
Abstract
Fog data processing systems provide key abstractions to manage data and event processing in the geo-distributed and heterogeneous fog environment. The lack of standardized benchmarks for such systems, however, hinders their development and deployment, as different approaches cannot be compared quantitatively. Existing cloud data benchmarks are inadequate for fog computing, as their focus on workload specification ignores the tight integration of application and infrastructure inherent in fog computing.
In this paper, we outline an approach to a fog-native data processing benchmark that combines workload specifications with infrastructure specifications. This holistic approach allows researchers and engineers to quantify how a software approach performs for a given workload on given infrastructure. Further, by basing our benchmark in a realistic IoT sensor network scenario, we can combine paradigms such as low-latency event processing, machine learning inference, and offline data analytics, and analyze the performance impact of their interplay in a fog data processing system.
Index Terms:
fog computing, internet of things, performance benchmarkingI Introduction
With the advent of emerging application domains such as the Internet of Things (IoT), autonomous vehicles, and extended realities and metaverses, the fog computing paradigm has received increasing attention in research [1, 2]. Fog computing extends the infinite resources of the cloud towards the edge of the network, with geo-distributed compute nodes closer to clients and devices [1]. This can reduce network strain on the backhaul network, with local data processing and aggregation, reduce latency for edge services given the physical proximity of resources, and increase privacy as centralized cloud data pools are no longer necessary [1, 2, 3, 4, 5, 6].
Managing compute and storage resources throughout the fog is no trivial task, as, e.g., data replication and quality-of-service (QoS) guarantees must be managed [7, 8, 9]. Researchers have thus proposed abstractions such as platforms and middlewares for fog application development [9, 10, 4, 11, 12, 13, 14, 15, 16, 17].
Currently, there is no way to quantitatively evaluate how these approaches perform, especially across compute paradigms. We are lacking benchmarking approaches that (i) can reflect the geo-distributed, multi-paradigm nature of fog data processing applications, (ii) reflect the interdependence of infrastructure and applications in fog computing, and (iii) allow us to compare different operational approaches to application management and deployment in the fog.
In this paper, we outline a benchmark architecture for quantitatively evaluating the performance of fog data processing abstractions. We present an overview of existing work in geo-distributed data processing systems and their quantitative evaluation in Section II. We further analyze the design objectives for our benchmark in Section III. In Section IV, we then present a fog application scenario around which our benchmark is built. We describe benchmark workload, parameters, infrastructure, and metrics in Section V and present initial implementation artifacts in Section VI.
II Background & Related Work
Before describing details of the benchmark we propose in this paper, we give an overview of fog data processing (Section II-A) and related work on performance evaluation of geo-distributed data-intensive systems (Section II-B).
II-A Fog Data Processing
Fog computing is an abstraction around the combined compute and storage resources at the edge, in the core network, and in the cloud [1, 2]. Fog computing is a promising paradigm for emerging domains such as the IoT: By extending cloud resources close to the edge of the network, where data is generated, fog applications can benefit from low-latency, high-bandwidth, privacy-preserving data processing infrastructure [3]. For example, IoT sensor data can be processed by compute resources at a local radio gateway and sent to actuators at the edge without incurring a significant network delay [4]. Similarly, data from multiple sensors can be aggregated and filtered at the edge in order to limit the network strain of sending all data to the cloud. Personally identifiable data can be anonymized using on-device resources before it is further processed by a third party [18].
The downside of geo-distributed, heterogeneous fog infrastructure is the complexity of its management for applications, i.e., building approaches for distributing data, deploying services, and managing fault-tolerance [10]. Researchers have proposed abstractions in the form of fog data processing platforms that manage this complexity for applications. For example, NebulaStream [19, 20] is an end-to-end IoT data management system. A key novelty of NebulaStream is its ability to autonomously deploy different data processing approaches such as stream and complex event processing in a geo-distributed environment. SoFA [21] uses Apache Spark to combine all available fog resources for stream processing operator deployment. Lotus [22] combines a fog publish/subscribe system with event and message processing based on the Function-as-a-Service (FaaS) paradigm [4]. In previous work, we have introduced the FReD [9, 7, 8] fog data management system that distributes and stores geo-distributed data with application-controlled replica placement, integrating distributed compute services. All these approaches functionally deliver the same data processing logic yet approach it in entirely different ways, which are hard to compare using traditional benchmarks. The question of how they differ in QoS remains open.
II-B Related Work
Numerous benchmarks in the area of fog computing have been proposed. In their survey on edge performance benchmarking, Varghese et al. [23] find that these benchmarks focus mostly on infrastructure components for the edge, e.g., comparing different CPUs or single-board computers for their suitability for edge processing. For example, Morabito [24] evaluates the performance of IoT edge devices along metrics such as power consumptions and task execution time.
In contrast, software platforms are considered only to a limited extent. Confais et al. [25] deploy a fog-like multi-site cluster of machines with Cassandra, Rados, and IPFS database systems and run the cloud benchmark Yahoo! Cloud Serving Benchmark (YCSB) [26] against them. The results show that all database systems underperform, as neither the workload nor the systems are built for a fog environment.
Das et al. [27] propose EdgeBench, a benchmarking suite for serverless edge computing. The authors use EdgeBench to evaluate commercial edge computing platforms from AWS and Microsoft Azure. Similar to other benchmarking studies by Gorlatova et al. [28], Silva et al. [29], McChesney et al. [30], George et al. [31], and Verma et al. [32], EdgeBench focuses on a pipeline from edge device to cloud with only a single processing task moved between the fog layers. This simplified view leaves out broader performance implications of device heterogeneity at the edge, multiple layers of intermediate resources, and interplay between fog services.
A more complex benchmark requires realistic applications and datasets, execution models for distributed workload testing, virtualization and emulation approaches for distributed fog environments, and meaningful metrics. Toczé et al. [33, 34] propose a methodology for characterizing edge workloads and compile workload traces. Kolosov et al. [35] compose realistic edge datasets using workloads from other areas. Aslanpour et al. [36] review performance metrics for fog computing benchmarks. Raith et al. [37] introduce Galileo, an end-to-end experiment framework for distributed load testing in edge computing environments. With Galileo, researchers can define and execute experiments, operationalize them on cluster testbeds, and instrument and collect monitoring data. Muñoz et al. [38] propose CLEAVE, a framework for performing experiments on Networked Control Systems at the edge.
Hasenburg et al. present MockFog [39, 40], which provides an approach to build virtual testbeds of fog infrastructure in the cloud. MockFog emulates fog nodes as cloud virtual machine instances and emulates network connections between those instances, including network delay, bandwidth constraints, and packet loss. MockFog also provides a framework for experiment planning and control, simplifying testing and evaluation distributed fog applications. However, MockFog makes no assumptions about the kind of testing that is performed and does not provide a complete fog benchmark. Similarly, Celestial [41, 42] emulates infrastructure for experimenting with LEO edge applications but does not provide a benchmark.
III Design Objectives
The design of a systems benchmark must meet a number of requirements, namely relevance, repeatability and reproducibility, fairness, and portability [43, 44]. For the fog data management and processing systems we plan to target with our benchmark, relevance means that the workload and parameter sets for the systems are representative of “real” fog workloads. As we have yet to see fog infrastructure and software widely deployed in industry, we adopt the notions of these realistic fog workloads from research.
Notably, we observe three key aspects of fog workloads that must be mirrored in the benchmark design: First, fog applications and middlewares are inherently tied to the infrastructure they are deployed on, given the importance of geo-distributed and heterogeneous software deployment in the fog [45]. Second, fog applications are composed of interconnected services and functionalities that interact with data in various ways [3]. Third, how these different services are implemented depends heavily on the abstractions that fog middlewares provide, e.g., both stream processing engines and serverless platforms can be used to implement an online monitoring application [3, 46]. Based on these three aspects, we derive three design objectives that we aim to meet with our benchmark specification:
Objective 1 Geo-Distributed Multi-Paradigm Workloads
Fog applications comprise different services that interact with data in different ways, e.g., at the edge, IoT sensors make local decisions on the data they generate with a focus on low latency data processing of individual data items. In intermediate servers within the core network, data streams of multiple devices may be correlated in an online manner. In the cloud, large volumes of offline and historical data are analyzed with a focus on throughput and efficiency. Crucially, these services are interconnected, with edge on-device processing latency impacting aggregation delay in intermediary nodes, which in turn impacts data staleness and availability in the cloud. We thus need our benchmark to reflect this interdependency of different services, with different data processing paradigms. This also requires managing distributed clients and workloads of different kinds and combining and correlating their results.
Objective 2 Combine Workload and Infrastructure Specification
Cloud service benchmarks such as YCSB [26] treat the system under test (SUT) as an atomic entity, e.g., an API that is called. While the infrastructure for a benchmark is fixed, e.g., a type of cloud virtual machine instance, it is not part of the benchmark specification. A fog data processing benchmark, however, must define this infrastructure as part of the workload, in the sense that the SUT must be able to deal with this infrastructure, i.e., run on what is available. This creates two relevant specifications in our benchmark: the workload that is sent against the SUT (application perspective), and the infrastructure specification of the fog network, available compute resources, and network topologies (infrastructure perspective). Benchmark implementations must thus implement both the client workloads and the fog infrastructure, and quality metrics for both perspectives can be developed.
Objective 3 Cross-Paradigm Portability
Different paradigms for organizing data processing applications have been proposed to tackle the challenges of fog computing, e.g., container orchestration and Function-as-a-Service (FaaS) [10, 45, 3]. In an effort to maintain a fair comparison, application logic specified in the benchmark should be independent of processing paradigms. The implementation of these services for a specific benchmark implementation will also impact how the SUT performs, as compute resources occupied by the service will not be available to, e.g., data replication and management middlewares.
IV Scenario
We adapt our benchmark scenario from the volcano monitoring sensor network described by Werner-Allen et al. [47]. Organizations such as the U.S. Geological Survey (USGS) [48] monitor activity of active and dormant volcanoes. The USGS Hawaiian Volcano Observatory (USGS HVO) [49] focuses on volcanoes on the Hawaiian Islands, recording and analyzing geological activity, assessing risks, and issuing warnings.
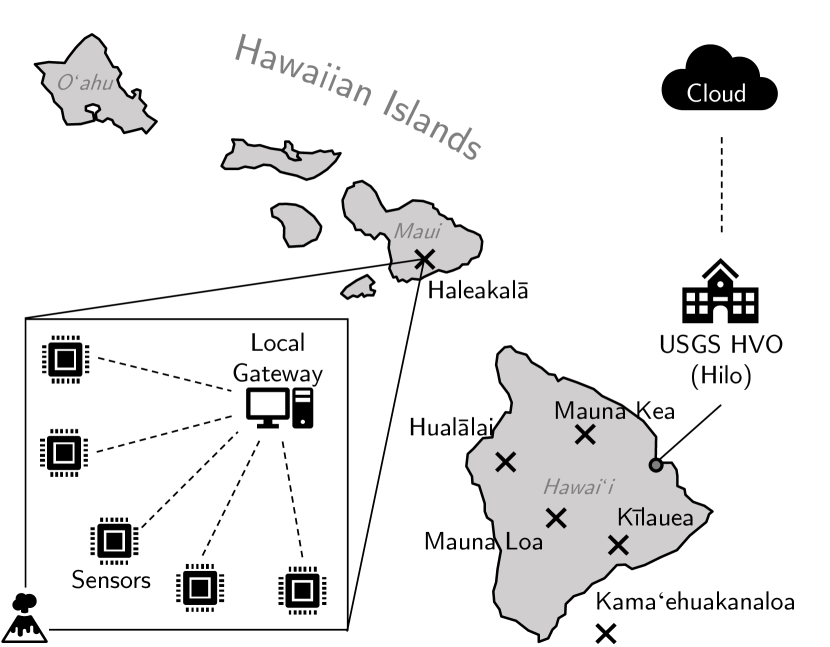
It is feasible that the USGS HVO would adopt a sensor network as shown in Fig. 1 to record activity of the six active volcanos in the region [50]. Similar to the sensor network presented in [47], several sensors with local processing capabilities are located at each site, connected to a local gateway over a radio access network, e.g., LoRaWAN [51, 52]. These sensors produce data at such high rates that complete transmission could exceed LoRaWAN bandwidth or energy availability, hence data will often be pre-processed for anomaly detection locally and only anomalous data is transferred to the local gateway. In line with the concepts of fog computing, this local gateway is also equipped with processing capabilities. Further, the local gateways are connected to the USGS HVO office in Hilo, Hawaii, where all sensor data may be aggregated and analyzed locally in a data center. This connection can be over fiber for volcanic sites close to inhabited areas, such as near Kīlauea, or a radio-based connection such as LTE-M [53] for remote sites such as Kamaʻehuakanaloa, which is 30km from shore. Finally, a cloud backend, e.g., provided by the USGS, is used to store historic data and serve reports.
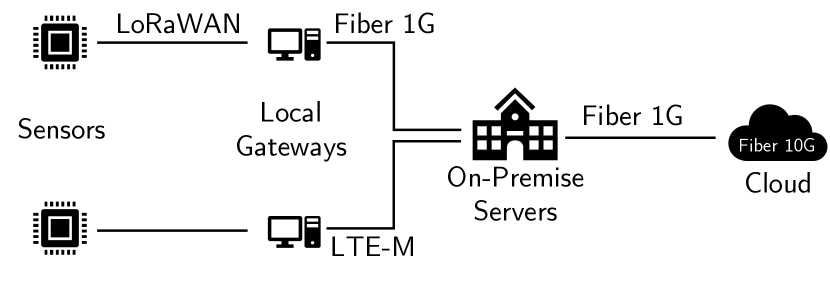
We show the resulting fog infrastructure in Fig. 2. While the scenario may be hypothetical, it combines all challenges and paradigms of data processing in fog computing: (i) There is a high volume of data ingress, with a large amount of sensors at the edge, (ii) local edge processing must be used to save radio bandwidth and device energy, (iii) there is a need for event loops at the edge, to react to events with low latency, (iv) data must be managed across a large geographical area, (v) live transactional workloads on the data are performed within the fog network, (vi) long-term data storage and analytical workloads are performed in the cloud [45, 3].
Interestingly, this scenario also shows how different services of a fog application also have differing dimensions of quality in regard to a fog data middleware. At the edge, with low-latency event processing loops, the goal is to achieve a processing service level objective (SLO) using as few resources as possible, reducing energy consumption and cost [54, 55, 56]. For the data analysis services, however, we see common cloud goals of reducing processing latency and serving data at scale.
V Benchmark Design
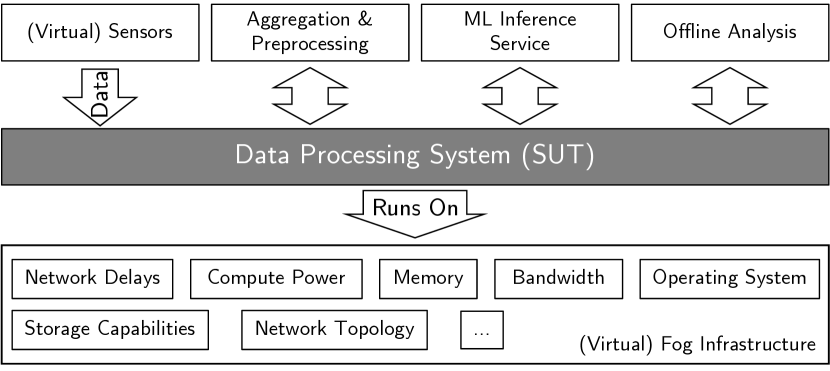
We show the overall architecture of the benchmark in Fig. 3. Around the central SUT, the data processing system, there are three main components of the benchmark specification that we describe in more detail in this section: The workload specification (Section V-A), the infrastructure specification (Section V-B), and the benchmark metrics that quantify the quality dimensions of the SUT (Section V-C).
| Parameter | Description | (Default) Value |
|---|---|---|
| number of sensors per volcano | ||
| size of local sensor buffer locally | ||
| number of samples combined in aggregate reports | ||
| ratio of sensors that report an event for gateway to forward event information | ||
| sensor sample resolution | ||
| sensor sampling rate | ||
| probability a sensor reading exceeds its threshold | ||
| LSTM input data size | ||
| ratio of most recent 1h interval reads | ||
| ratio of random 1h interval reads | ||
| ratio of scan/filter read requests | ||
| offline parallel clients | 100 | |
| offline client request rate | 1Hz | |
| offline data staleness threshold | ||
| number of cloud instances |
| Component () | |||
|---|---|---|---|
| Sensor () | 0.25 core | 256MB | 4GB |
| Local Gateway () | |||
| On-Premise () | |||
| Cloud () |
|
|
|
Bandwidth |
|
|
|
|
||||||||||||||
|---|---|---|---|---|---|---|---|---|---|---|---|---|---|---|---|---|---|---|---|---|---|
| LoRaWAN | |||||||||||||||||||||
| LTE-M | |||||||||||||||||||||
| Fiber 1G | |||||||||||||||||||||
| Fiber 10G |
V-A Workloads
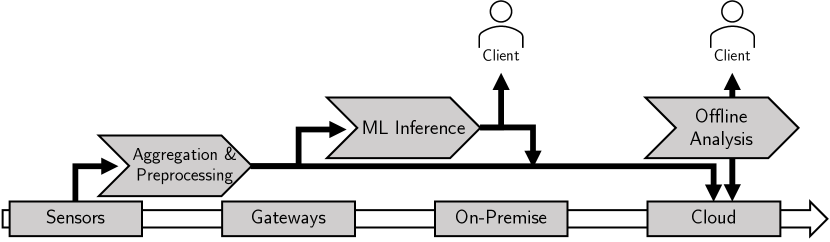
Our benchmark workload comprises three services at different stages of the edge-cloud continuum (Objective 1), as illustrated in Fig. 4. Note that our workloads merely specify functionality, not actual service implementations (Objective 3).
The online filtering operations and online monitoring services rely on a data ingress point at the edge. Here, based on the scenario we presented in Section IV, sensors produce frequent monitoring data. Sensors locally store a buffer of sensor readings. Further, two algorithms typical of edge data preprocessing are computed near the edge: First, every sensor readings, aggregate average sensor readings are generated. Only these aggregate readings are sent to the following services. Second, if a sensor reading exceeds a threshold, which happens with probability , an event is immediately sent to the edge service. If more than of sensors of one location report that their sensor reading threshold has been exceeded, the edge service collects buffered data from all local sensors and reports it upstream. Since the rate of sensor readings is fixed, this workload follows an open system model [57]. In addition to the mentioned parameters, the sampling rate , sensor resolution , and number of sensors all impact the workload on subsequent processing steps, including the offline analysis. We give a complete list of (variable) workload parameters in Table I.
Note that some system properties are derived directly from these parameters. For example, the theoretical (without data structure overhead) rate of data generated by a sensor is . With the parameter values given in Table I, a sensor generates 19.2kbit/s of data. The mean bandwidth used between a sensor and the edge service is:
, i.e., the rate of regular aggregated sensor readings and the rate of infrequent events by multiple sensors at a location. With the given values, the mean bandwidth between a sensor and the edge service is 149.5kbit/s. Consequently, each edge service processes a mean 44.84Mbit/s of data.
Both regularly aggregated and event-based data is forwarded to the intermediate ML inference service. The live data processing here comprises augmenting data from different source volcano locations with inference results from a ML model. Specifically, aggregated data records should be used for time-series forecasting using a LSTM model to annotate each record with a probability of a major seismic event at this location, taking into account the most recent of data for that location [58, 59] and generating warnings in Hilo. Annotated results are then forwarded to the offline analysis service.
The offline analysis workload comprises common time-series database operations. Insert operations are performed by means of incoming data from the fog side, i.e., aggregated sensor records with ML inference annotations. Read operations are performed by clients in three distinct operations: batch reads of the most recent one-hour interval (, ), batch reads of random one-hour intervals (, ), and scans with filter operations (, ). This workload follows an open model, i.e., clients send requests at a constant rate of rather than waiting for responses, with a high number of concurrent queries by multiple clients. Geographically, these clients can be considered as located at the cloud location. In order to precisely measure system performance, we aim for a high (e.g., 80%) utilization of system resources [44] and the parameter should be adapted to yield such utilization. In order to derive meaningful and representative metrics for this offline system, we also introduce a staleness threshold () for data, which is more meaningful for an offline system than, e.g., a precise measurement of end-to-end latency (Section V-C).
V-B Infrastructure
As outlined in Objective 2, functionality and performance of a fog application not only depend on the workload used but also on the underlying infrastructure and network topology. We thus also provide an infrastructure specification in our benchmark, based on the topology shown in Fig. 2. The complete list of infrastructure parameters is shown in Tables II and III for compute and network infrastructure, respectively.
For every type of component , e.g., the sensor board, CPU type (), memory size (), disk size (), and operating system may be changed. Further, in the cloud backend, multiple () identical machines are combined into a cluster. The network parameters include a propagation delay, standard deviation of propagation, delay, link bandwidth, packet loss rate, packet corruption rate, packet reordering rate, and packet duplication rate for different link types based on MockFog (see the implementation description in Section VI).
V-C Metrics
As we combine workloads from different paradigms, the metrics we use to evaluate an SUT reflect the different desirable dimensions in fog data processing. We hence propose distinct metrics for each of the three workloads.
The edge sensor data aggregation and preprocessing workload is SLO-driven, i.e., data must be processed at the rate with which it is generated in order to prevent queuing. A meaningful metric is thus the amount of edge compute resources (and, by extension, theoretical cost and energy consumption) with which an SUT can achieve this SLO [54, 55, 56]. This requires varying the , , and parameters while observing that processing queuing remains constant.
For online intermediate data processing, the relevant metric is the added latency of shipping data to and from the ML inference service and processing it. An adequate metric is the end-to-end latency between creating an (aggregated) data point on the sensor and its insertion into the cloud offline data store. To support a more accurate relative comparison of results of different SUT, we propose to subtract the network delay imposed by the infrastructure between sensors and cloud, which is a constant offset.
As discussed, edge-to-cloud latency is a misleading metric for offline data analysis as differences in latency are often not noticeable for clients [60]. A more meaningful perspective is that of data staleness violations: Of all read requests that semantically ask for the most recent data, what ratio does not meet the staleness threshold , i.e., how often is data processing and replication too slow? The second cloud metric is the latency of requests sent by cloud-based clients.
VI Implementation
While most of the benchmark implementation is highly specific to an SUT, e.g., certain platforms have limitations on programming languages and deployment models that can be used to implement and deploy a service, we provide a number of artifacts to support this implementation. We make these artifacts available as open-source software.111https://github.com/OpenFogStack/fog-data-benchmark-specification Our infrastructure specification is implemented in terms of a MockFog [39, 40] specification, allowing researchers to replicate an emulated infrastructure that meets the specifications outlined in Section V. Further, we provide a data generator implementation, that accepts the generator parameters outlined in our workload specification, and a re-usable TensorFlow implementation of the LSTM model used in the ML inference service.
VII Conclusion
In this paper, we have outlined a benchmark for fog data processing based on an IoT sensor network scenario. Reflecting the reality of fog applications, our benchmark combines geo-distributed workloads of multiple paradigms. Further, we couple workload and infrastructure specification in our benchmark, as fog application performance depends on fog infrastructure characteristics. Our benchmark specification is portable across organizational paradigms, allowing researchers to quantitatively compare different approaches to managing and building applications in the fog. In future work, we plan to use our benchmark to compare such existing approaches from fog computing research, analyze their limits and constraints, and derive gaps in existing research.
Acknowledgements
Funded by the Deutsche Forschungsgemeinschaft (DFG, German Research Foundation) – 415899119.
References
- [1] F. Bonomi, R. Milito, J. Zhu, and S. Addepalli, “Fog computing and its role in the internet of things,” in Proceedings of the first edition of the MCC workshop on Mobile cloud computing (MCC ’12), Aug. 2012, pp. 13–16.
- [2] D. Bermbach, F. Pallas, D. García Pérez, P. Plebani, M. Anderson, R. Kat, and S. Tai, “A research perspective on fog computing,” in Proceedings of the 2nd Workshop on IoT Systems Provisioning & Management for Context-Aware Smart Cities (ISYCC 2017), Nov. 2017, pp. 198–210.
- [3] T. Pfandzelter and D. Bermbach, “IoT data processing in the fog: Functions, streams, or batch processing?” in Proceedings of the 1st Workshop on Efficient Data Movement in Fog Computing (DaMove 2019), Jun. 2019, pp. 201–206.
- [4] ——, “tinyFaaS: A lightweight faas platform for edge environments,” in Proceedings of the Second IEEE International Conference on Fog Computing (ICFC 2020), Apr. 2020, pp. 17–24.
- [5] D. Bermbach, S. Maghsudi, J. Hasenburg, and T. Pfandzelter, “Towards auction-based function placement in serverless fog platforms,” in Proceedings of the Second IEEE International Conference on Fog Computing (ICFC 2020), Apr. 2020, pp. 25–31.
- [6] D. Bermbach, J. Bader, J. Hasenburg, T. Pfandzelter, and L. Thamsen, “Auctionwhisk: Using an auction-inspired approach for function placement in serverless fog platforms,” Software: Practice and Experience, vol. 52, no. 2, pp. 1143–1169, 2021.
- [7] J. Hasenburg, M. Grambow, and D. Bermbach, “Towards a replication service for data-intensive fog applications,” in Proceedings of the 35th ACM Symposium on Applied Computing, Posters Track (SAC ’20), Mar. 2020, pp. 267–270.
- [8] ——, “Fbase: A replication service for data-intensive fog applications,” TU Berlin & ECDF, Mobile Cloud Computing Research Group, Tech. Rep., 2019.
- [9] T. Pfandzelter, N. Japke, T. Schirmer, J. Hasenburg, and D. Bermbach, “Managing data replication and distribution in the fog with fred,” Software: Practice and Experience, 2023.
- [10] T. Pfandzelter, J. Hasenburg, and D. Bermbach, “Towards a computing platform for the leo edge,” in Proceedings of the 4th International Workshop on Edge Systems, Analytics and Networking (EdgeSys ’21), Apr. 2021, pp. 43–48.
- [11] O. Skarlat, V. Karagiannis, T. Rausch, K. Bachmann, and S. Schulte, “A framework for optimization, service placement, and runtime operation in the fog,” in Proceedings of the IEEE/ACM 11th International Conference on Utility and Cloud Computing (UCC ’18), Dec. 2018, pp. 164–173.
- [12] T. Rausch, W. Hummer, V. Muthusamy, A. Rashed, and S. Dustdar, “Towards a serverless platform for edge ai,” in Proceedings of the 2nd USENIX Workshop on Hot Topics in Edge Computing (HotEdge ’19), Jul. 2019.
- [13] T. Rausch, P. Raith, P. Pillai, and S. Dustdar, “A system for operating energy-aware cloudlets,” in Proceedings of the 4th ACM/IEEE Symposium on Edge Computing (SEC ’19), 2019, pp. 307–309.
- [14] J. Hasenburg and D. Bermbach, “GeoBroker: Leveraging geo-context for IoT data distribution,” Elsevier Computer Communications, vol. 151, pp. 473–484, 2020.
- [15] ——, “GeoBroker: A pub/sub broker considering geo-context information,” Software Impacts, vol. 6, p. 100029, 2020.
- [16] ——, “DisGB: Using geo-context information for efficient routing in geo-distributed pub/sub systems,” in Proceedings of the 13th IEEE/ACM International Conference on Utility and Cloud Computing (UCC 2020), Dec. 2020, pp. 67–78.
- [17] T. Pfandzelter, T. Schirmer, and D. Bermbach, “Towards distributed coordination for fog platforms,” in Proceedings of the 22nd IEEE/ACM international Symposium on Cluster, Cloud and Internet Computing, Posters (CCGrid 2021), May 2022, pp. 760–762.
- [18] F. Pallas, P. Raschke, and D. Bermbach, “Fog computing as privacy enabler,” IEEE Internet Computing, vol. 24, no. 4, pp. 15–21, 2020.
- [19] S. Zeuch, A. Chaudhary, B. Monte, H. Gavriilidis, D. Giouroukis, P. Grulich, S. Breß, J. Traub, and V. Markl, “The nebulastream platform: Data and application management for the internet of things,” in Proceedings of the Conference on Innovative Data Systems Research (CIDR), Jan. 2020.
- [20] S. Zeuch, E. T. Zacharatou, S. Zhang, X. Chatziliadis, A. Chaudhary, B. Del Monte, D. Giouroukis, P. M. Grulich, A. Ziehn, and V. Mark, “Nebulastream: Complex analytics beyond the cloud,” Open Journal of Internet Of Things (OJIOT), vol. 6, no. 1, pp. 66–81, 2020.
- [21] N. Maleki, M. Loni, M. Daneshtalab, M. Conti, and H. Fotouhi, “Sofa: A spark-oriented fog architecture,” in Proceedings of the 45th Annual Conference of the IEEE Industrial Electronics Society (IECON 2019), Oct. 2019, pp. 2792–2799.
- [22] M. Wang, T. Schirmer, T. Pfandzelter, and D. Bermbach, “Lotus: Serverless in-transit data processing for edge-based pub/sub,” in Proceedings of the 6th International Workshop on Edge Systems, Analytics and Networking (EdgeSys ’23), May 2023.
- [23] B. Varghese, N. Wang, D. Bermbach, C.-H. Hong, E. D. Lara, W. Shi, and C. Stewart, “A survey on edge performance benchmarking,” ACM Computing Surveys (CSUR), vol. 54, no. 3, pp. 1–33, 2021.
- [24] R. Morabito, “Virtualization on internet of things edge devices with container technologies: A performance evaluation,” IEEE Access, vol. 5, pp. 8835–8850, 2017.
- [25] B. Confais, A. Lebre, and B. Parrein, “Performance analysis of object store systems in a fog/edge computing infrastructures,” in Proceedings of the 2016 IEEE International Conference on Cloud Computing Technology and Science (CloudCom), Dec. 2016, pp. 294–301.
- [26] B. F. Cooper, A. Silberstein, E. Tam, R. Ramakrishnan, and R. Sears, “Benchmarking cloud serving systems with ycsb,” in Proceedings of the 1st ACM Symposium on Cloud Computing (SoCC ’10), Jun. 2010, pp. 143–154.
- [27] A. Das, S. Patterson, and M. Wittie, “Edgebench: Benchmarking edge computing platforms,” in Proceedings of the 2018 IEEE/ACM International Conference on Utility and Cloud Computing Companion (UCC Companion), Dec. 2018, pp. 175–180.
- [28] M. Gorlatova, H. Inaltekin, and M. Chiang, “Characterizing task completion latencies in fog computing,” arXiv preprint arXiv:1811.02638 [cs.DC], 2018.
- [29] P. Silva, A. Costan, and G. Antoniu, “Towards a methodology for benchmarking edge processing frameworks,” in Proceedings of the 2019 IEEE International Parallel and Distributed Processing Symposium Workshops (IPDPSW), May 2019, pp. 904–907.
- [30] J. McChesney, N. Wang, A. Tanwer, E. De Lara, and B. Varghese, “Defog: fog computing benchmarks,” in Proceedings of the 4th ACM/IEEE Symposium on Edge Computing (SEC ’19), Nov. 2019, pp. 47–58.
- [31] S. George, T. Eiszler, R. Iyengar, H. Turki, Z. Feng, J. Wang, P. Pillai, and M. Satyanarayanan, “Openrtist: end-to-end benchmarking for edge computing,” IEEE Pervasive Computing, vol. 19, no. 4, pp. 10–18, 2020.
- [32] A. Verma, A. Goyal, S. Kumara, and T. Kurfess, “Edge-cloud computing performance benchmarking for iot based machinery vibration monitoring,” Manufacturing Letters, vol. 27, pp. 39–41, 2021.
- [33] K. Toczé, N. Schmitt, I. Brandic, A. Aral, and S. Nadjm-Tehrani, “Towards edge benchmarking: A methodology for characterizing edge workloads,” in Proceedings of the 2019 IEEE 4th International Workshops on Foundations and Applications of Self* Systems (FAS* W), Jun. 2019, pp. 70–71.
- [34] K. Toczé, N. Schmitt, U. Kargén, A. Aral, and I. Brandić, “Edge workload trace gathering and analysis for benchmarking,” in Proceedings of the 6th IEEE International Conference on Fog and Edge Computing (ICFEC 2022), Mar. 2022, pp. 34–41.
- [35] O. Kolosov, G. Yadgar, S. Maheshwari, and E. Soljanin, “Benchmarking in the dark: On the absence of comprehensive edge datasets,” in Proceedings of the 3rd USENIX Workshop on Hot Topics in Edge Computing (HotEdge ’20), Jun. 2020.
- [36] M. S. Aslanpour, S. S. Gill, and A. N. Toosi, “Performance evaluation metrics for cloud, fog and edge computing: A review, taxonomy, benchmarks and standards for future research,” Internet of Things, vol. 12, p. 100273, 2020.
- [37] P. Raith, T. Rausch, P. Prüller, A. Furutanpey, and S. Dustdar, “An end-to-end framework for benchmarking edge-cloud cluster management techniques,” in Proceedings of the 2022 IEEE International Conference on Cloud Engineering (IC2E 2022), Sep. 2022, pp. 22–28.
- [38] M. O. Muñoz, N. Roy, and J. Gross, “Cleave: scalable and edge-native benchmarking of networked control systems,” in Proceedings of the 5th International Workshop on Edge Systems, Analytics and Networking (EdgeSys ’22), Apr. 2022, pp. 37–42.
- [39] J. Hasenburg, M. Grambow, E. Grünewald, S. Huk, and D. Bermbach, “MockFog: Emulating fog computing infrastructure in the cloud,” in Proceedings of the First IEEE International Conference on Fog Computing (ICFC 2019), Jun. 2019, pp. 144–152.
- [40] J. Hasenburg, M. Grambow, and D. Bermbach, “MockFog 2.0: Automated execution of fog application experiments in the cloud,” IEEE Transactions on Cloud Computing, vol. 11, no. 1, pp. 58–70, 2021.
- [41] T. Pfandzelter and D. Bermbach, “Celestial: Virtual software system testbeds for the leo edge,” in Proceedings of the 23rd ACM/IFIP International Middleware Conference (Middleware ’22), Nov. 2022, pp. 69–81.
- [42] ——, “Celestial: Virtual software system testbeds for the leo edge,” TU Berlin & ECDF, Mobile Cloud Computing Research Group, Tech. Rep., Apr. 2022.
- [43] K. Huppler, “The art of building a good benchmark,” in Proceedings of the Performance Evaluation and Benchmarking: First TPC Technology Conference (TPCTC 2009), Aug. 2009, pp. 18–30.
- [44] D. Bermbach, E. Wittern, and S. Tai, Cloud Service Benchmarking: Measuring Quality of Cloud Services from a Client Perspective. Springer, 2017.
- [45] T. Pfandzelter, J. Hasenburg, and D. Bermbach, “From zero to fog: Efficient engineering of fog-based internet of things applications,” Software: Practice and Experience, vol. 51, no. 8, pp. 1798–1821, 2021.
- [46] T. Pfandzelter, S. Henning, T. Schirmer, W. Hasselbring, and D. Bermbach, “Streaming vs. functions: A cost perspective on cloud event processing,” in Proceedings of the 10th IEEE International Conference on Cloud Engineering (IC2E 2022), Sep. 2022, pp. 67–78.
- [47] G. Werner-Allen, K. Lorincz, J. Johnson, J. Lees, and M. Welsh, “Fidelity and yield in a volcano monitoring sensor network,” in Proceedings of the 7th Symposium on Operating Systems Design and Implementation (OSDI ’06), Nov. 2006, pp. 381–396.
- [48] “USGS.gov — science for a changing world,” https://www.usgs.gov/, 2023, accessed: March 16, 2023.
- [49] “Hawaiian volcano observatory — U.S. geological survey,” https://www.usgs.gov/observatories/hvo, 2023, accessed: March 16, 2023.
- [50] K. Saini, S. Kalra, and S. K. Sood, “Iot-fog-cloud centric earthquake monitoring and prediction,” ACM Transactions on Embedded Computing Systems, vol. 20, no. 6, pp. 1–26, 2021.
- [51] LoRa Alliance Technical Committee, “Lorawan™ 1.1 specification,” Oct. 2017.
- [52] J. de Carvalho Silva, J. J. P. C. Rodrigues, A. M. Alberti, P. Solic, and A. L. L. Aquino, “Lorawan — a low power wan protocol for internet of things: A review and opportunities,” in Proceedings of the 2017 2nd International Multidisciplinary Conference on Computer and Energy Science (SpliTech), Jul. 2017, pp. 1–6.
- [53] M. Lauridsen, I. Z. Kovács, P. Mogensen, M. Sorensen, and S. Holst, “Coverage and capacity analysis of lte-m and nb-iot in a rural area,” in Proceedings of the 2016 IEEE 84th Vehicular Technology Conference (VTC-Fall), Sep. 2016, pp. 1–5.
- [54] S. Henning and W. Hasselbring, “How to measure scalability of distributed stream processing engines?” in Proceedings of the Companion of the ACM/SPEC International Conference on Performance Engineering Companion (ICPE ’21), Apr. 2021, pp. 85–88.
- [55] ——, “Theodolite: Scalability benchmarking of distributed stream processing engines in microservice architectures,” Big Data Research, vol. 25, p. 100209, 2021.
- [56] D. Cao, J. Yoo, Z. Xu, E. Saurez, H. Gupta, T. Krishna, and U. Ramachandran, “Microedge: a multi-tenant edge cluster system architecture for scalable camera processing,” in Proceedings of the 23rd ACM/IFIP International Middleware Conference (Middleware ’22), Nov. 2022, pp. 322–334.
- [57] B. Schroeder, A. Wierman, and M. Harchol-Balter, “Open versus closed: A cautionary tale,” in Proceedings of the 3rd Symposium on Networked Systems Design and Implementation (NSDI ’06), May 2006.
- [58] S. M. Mousavi, W. L. Ellsworth, W. Zhu, L. Y. Chuang, and G. C. Beroza, “Earthquake transformer—an attentive deep-learning model for simultaneous earthquake detection and phase picking,” Nature communications, vol. 11, no. 1, p. 3952, 2020.
- [59] A. Berhich, F.-Z. Belouadha, and M. I. Kabbaj, “Lstm-based models for earthquake prediction,” in Proceedings of the 3rd International Conference on Networking, Information Systems & Security (NISS2020), Mar. 2020, pp. 1–7.
- [60] N. Mohan, L. Corneo, A. Zavodovski, S. Bayhan, W. Wong, and J. Kangasharju, “Pruning edge research with latency shears,” in Proceedings of the 19th ACM Workshop on Hot Topics in Networks (HotNets ’20), Nov. 2020, pp. 182–189.