These authors contributed equally to this work. \equalcontThese authors contributed equally to this work. \equalcontThese authors contributed equally to this work.
Making Thermal Imaging More Equitable and Accurate: Resolving Solar Loading Biases
Abstract
Thermal cameras and thermal point detectors are used to measure the temperature of human skin. These are important devices that are used everyday in clinical and mass screening settings, particularly in an epidemic. Unfortunately, despite the wide use of thermal sensors, the temperature estimates from thermal sensors do not work well in uncontrolled scene conditions. Previous work has studied the effect of wind and other environment factors on skin temperature, but has not considered the heating effect from sunlight, which is termed solar loading. Existing device manufacturers recommend that a subject who has been outdoors in sun re-acclimate to an indoor environment after a waiting period. The waiting period, up to 30 minutes, is insufficient for a rapid screening tool. Moreover, the error bias from solar loading is greater for darker skin tones since melanin absorbs solar radiation. This paper explores two approaches to address this problem. The first approach uses transient behavior of cooling to more quickly extrapolate the steady state temperature. A second approach explores the spatial modulation of solar loading, to propose single-shot correction with a wide-field thermal camera. A real-world dataset comprising of thermal point, thermal image, subjective, and objective measurements of melanin is collected with statistical significance for the effect size observed. The single-shot correction scheme is shown to eliminate solar loading bias in the time of a typical frame exposure (33ms).
1 Introduction

Infrared thermometers (IRTs) offer the potential to measure human body temperature in a fast, non-invasive manner. These devices can be based on single point (hereafter, non-contact infrared thermometer (NCIT)) or image based measurements (hereafter, thermographic imaging). IRTs have been used for rapid screening of temperature to help maintain public health during the SARS, H1N1, Ebola and now, COVID-19 outbreaks. A common use case is shown in Fig. 1, where a woman enters an office building on her walk to work. The lobby kiosk uses a thermal camera to screen the woman for elevated temperature, to assess if she is safe to proceed a crowded office. If she has elevated temperature, she is advised to stay home. Such screening schemes are placed at airports, hotels, and stadiums and have proven useful for minimizing spread of infectious disease.
Given the importance of measuring temperature it is critical that thermal cameras measure temperature accurately and equitably. Recent findings about thermal camera bias have not shown a clear link between skin tone and thermal bias. However, this is only true in controlled indoor scenarios. When a subject is exposed to the sun, their skin absorbs solar radiation and heats up—we term this phenomenon “solar loading". While the thermal sensor correctly measures increased skin temperature, the thermometer does not correct for the sun-induced temperature elevation.
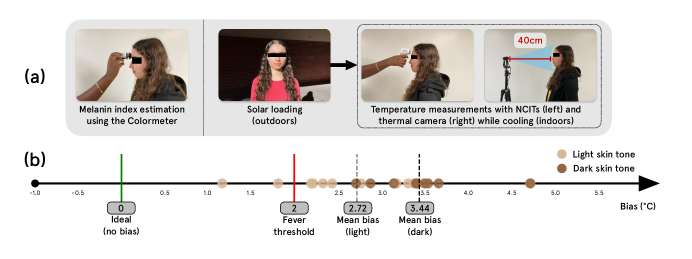
Addressing solar loading is an important problem because the effect is significant. In fact, the solar loading bias is often more than the threshold for fever. Observe the human subjects data shown in Fig. 2(b). The number line at bottom plots the deviation in temperature per subject with respect to a ground truth device based on contact thermography. All subjects were healthy, but most of them are falsely identified as having a fever. Moreover, there is also an issue with equity. Absorption of solar radiation in skin depends on the constituent chromophores, such as melanin. This suggests that the magnitude of solar loading scales with skin pigmentation, resulting in poorer IRT performance for select demographics. Thus, in our work we aim to not only correct solar loading, but to also study and remedy skin tone bias due to the solar loading effect.
While our focus is on solar loading, our broader vision aligns with a surge of recent scholarship in generalizing IRT operation to outdoor and less controlled environments. Ogawa et al. [2], Dzien et al. [3], Spindel et al. [4] evaluated IRTs in cold weather and found that IRT measurements were correlated with the cold. Tay et al. [5], Ravi et al. [6] tested IRTs in hot weather and found a similar correlation. It is generally accepted in the scientific community that IRTs are accurate in limited settings: a patient must be acclimated to an indoor measurement location, held at room temperature () for 10-30 minutes [1, 7] and this is typically the recommendation of NCIT manufacturers as can be seen in Table 1. In contrast to previous work, we focus our attention on the less characterized, but no less important, issue of solar loading biases. Our contributions follow.
Contributions:
In this paper, we offer two solutions to solar loading. Solution I exploits temporal modulation of solar loading to moderately reduce the waiting period. This is useful for NCITs. However, if spatial information is available with a camera, then we propose Solution II which offers single shot correction. Our approach is in the family of computational light transport techniques that use optical and computational principles to reveal and interpret the flow of light in our everyday world [9]. The insights from light transport are practical: they inform learning-based inductive biases to correct for solar loading. A real dataset of subjects is collected and ground-truthed with contact-based thermometers, to be released upon acceptance. Metadata is stored with objective measures of melanin concentration, enabling an analysis of equity. The end result from this study is that solar loading is corrected. Since solar loading affects both light skinned and dark skinned people, solving for solar loading is a win-win where equity is improved as well as accuracy for everyone.
2 Related Work
Broadly, there are two types of infrared thermometers: those that use point measurements and those that capture spatial temperature fields. The former, which this paper refers to as non-contact infrared thermometers (NCITs), measure the forehead or temple to estimate core temperature. The latter captures larger field-of-views (FoVs) using thermal cameras and will be referred to as infrared thermography. A temporal artery thermometer (TAT) falls between these two groups: the device is manually scanned across the face to obtain multiple temperature measurements. While a TAT is highly accurate, we do not consider it in this work because (1) proper operation of the device requires training and (2) they are contact-based infrared thermometers. In this section, we discuss the accuracy and bias in NCITs and thermographic methods.
| Manufacturer | Model | IR Sensor | Waiting Period |
|---|---|---|---|
| Welch Allyn | 105801 | NCIT | 30 min [10] |
| ADC | Adtemp 429 | NCIT | 30 min [11] |
| Joytech Sejoy | DET-306 | NCIT | 10 min [12] |
| Solution I (Ours) | Generic | NCIT | 3-5 min |
| Solution II (Ours) | Generic | Thermal Camera | 0 min |
Non-contact infrared thermometers (NCITs):
While NCITs are accurate in standard cases, in general, their performance depends on climate, measurement location and metabolic activity. Erenberk et al. [13] monitored forehead NCIT measurements in children exposed to cold weather (). NCIT measurements underestimate core temperature, but increase and stabilize after 10 minutes indoors. Spindel et al. [4] compared NCIT performance in different measurement locations based on proximity to outdoors conditions. They found that accuracy improved as measurement locations moved further indoors. The influence of sunlight is considered but not explored. Kistemaker et al. [14] assessed the reliability of NCITs after exercise, which is expected to raise the metabolic rate. After 15 minutes of exercise, NCITs overestimated by . Shajkofci [15] corrects environmental perturbations on NCIT measurements by regressing a linear relationship between skin, outdoors and ambient temperature. Additionally, they correct for diurnal variations by recording the time of day. This work, as noted by the authors, is limited in the ethnic distribution of the dataset.
Infrared Thermography:
In some ways, infrared thermography is preferred over NCITs. NCITs require the device to be held cm from the skin, while thermographic methods do not suffer from this limitation due to the larger FoV. Infrared cameras are however more expensive than NCITs as the hardware is more complex. In infrared thermography, an image of the subject is taken, usually of the face or neck. A region-of-interest (ROI) is selected and the aggregate skin temperature is mapped to core temperature. The inner canthus and forehead are suggested ROIs due to high perfusion from the carotid and orbital arteries respectively [7]. It is worth noting that the ROIs comprise barely of the entire thermal image, meaning of captured data is discarded.
Machine Learning for Infrared Thermometers:
Machine learning has often been used with infrared thermometers in two ways: to improve the accuracy of infrared thermography, or to predict infections and illnesses using NCITs and other physiological measurements. Dagdanpurev et al. [18] used a combination of facial infrared thermography images, axillary temperature measurements and ambient temperature values to obtain optimum temperature estimates using linear regression analysis. This optimized temperature was further used for infection screening using the kNN algorithm. A skin heat transfer model for converting facial infrared thermography images into blood-perfusion maps was proposed by Wu et al. [19] to improve facial recognition model performance. The approach helped alleviate the effect of environmental conditions on infrared images. NCITs and thermographic cameras were used to detect temperatures which helped classify COVID-19 cases using recurrent neural networks (RNN) with long short term memory (LSTM) model [20]. Random forests were utilized in Li et al. [21] for the prediction of thermal comfort of healthy subjects in indoor HVAC settings using facial infrared thermography.
Bias in Infrared Thermometers:
Recent works have evaluated bias in medical devices and proposed general solutions to eliminating bias, such as collection of diverse datasets [22, 23]. Other works, specifically in heart rate estimation, have demonstrated strides towards equitable technology both through hardware and software [24, 25, 26]. Recently, understanding the limitations of infrared thermometers has become important, but studies on potential biases reveal conflicting findings. Adams et al. [27] found that age and gender impacted IR thermography measurements. Regarding skin tone bias, Khan et al. [28] evaluated NCITs in subjects grouped by researcher labelled skin tone: "light" and "medium and dark". No skin tone bias was found, although the dataset was heavily skewed towards lighter skin. Strasse et al. [29] compared the performance of NCITs across body locations as well as ethnic groups (Black, White and mixed race). Again, no bias was found. Most recently, Bhavani et al. [30] compared TATs against oral thermometers. From self-reported race, performance on Black and White patients were compared, revealing that TAT measurements underestimated temperature in Black patients (). Charlton et al. [31] found that emissivity of skin does not depend on skin pigmentation. These conflicting studies show that race, ethnicity and skin tone groupings preclude an understanding of bias in IRTs. The mechanism behind recorded biases is unclear.
3 Thermal Light Transport Preliminaries

We overview the image signal processor (ISP) chain that thermal imagers use to estimate temperature of the human body depicted in Fig. 3. Let us begin by linking an object’s temperature to its emission of light. In particular, every object hotter than absolute zero () emits radiation proportional to its temperature—this radiation is called thermal radiation. The relationship between thermal radiation and temperature is wavelength dependent. We observe this in everyday life: an iron bar heated to a very high temperature will initially glow red and then as its temperature rises it will glow orange, then yellow, and so on, until it is perceived as glowing violet. This relationship is described more precisely by Planck’s law. For a given wavelength , an object with emissivity and temperature has spectral radiant exitance :
| (1) |
where (Planck’s constant), (Boltzmann constant) and . Planck’s law in Eq. 1 can be simplified. Assume that we have a sensor that can capture readings over the support of wavelengths considered. Then we can integrate Eq. 1 to obtain the total radiant flux emitted by a surface as:
| (2) | ||||
| (3) |
This equation is known as the Stefan-Boltzmann law which is convenient as it relates thermal radiation to only three terms. The thermal radiation received is proportional to the product of the fourth power of temperature multipled by emissivity and a fixed constant, , known as the Stefan-Boltzmann constant. Estimation of temperature can proceed by taking the fourth root of Eq. 3 as.
| (4) |
We can measure , using for instance, a thermal camera and is the fixed Stefan-Boltzmann constant, leaving us with only the emissivity to plug in. Emissivity determines how efficient a surface is at emitting thermal energy and varies across objects: describes a perfect emitter of thermal radiation (blackbody) and describes an object that does not emit thermal radiation (e.g. polished metals). The emissivity value of human skin is known in literature as .111In the context of equitable sensing, one must be careful about using a single material constant for all humans. However, bias has not been observed in thermal cameras [32], and so this value is considered safe to use. To obtain the temperature of the human, we can take the fourth root of received radiation vis a vis Eq. 4 by setting to obtain temperature of the human skin surface. This assumes that the human is the only object in the scene.
| Notation | Meaning |
|---|---|
| Baseline skin temperature | |
| Estimate baseline skin temperature | |
| Time varying skin temperature | |
| Estimated time varying skin temperature | |
| Solar loading bias | |
| Maximum solar loading bias | |
| Core temperature | |
| NCIT estimated core temperature | |
| Oral estimated core temperature (ground truth) |
3.1 Multipath Temperature Estimation
Real world measurement of human body temperature must account for multiple thermal emitters in a scene. In any practical setting, the human body is in a multipath environment. A sensor measures thermal radiation from all the objects in a scene. Consider a person sitting in a room. Their skin emits thermal radiation proportional to Eq. 3 and reflects radiation from the wall to the camera. This is a form of global illumination reminiscent of the Cornell Room in computer graphics, except that this setting is at thermal wavelengths. Thermal radiation arriving at the camera is compounded with radiation from the atmosphere. The object, background and atmosphere contribute to the thermal multipath.
To address this multipath problem, thermal sensor ISPs used in clinical medicine have a radiometric chain that abstracts multipath into a model with three steady state terms. A radiometric chain relates radiation intensity at a single scene point as:
Here, is the intensity of thermal emission from the human body, and more precisely, the skin surface. The radiation from objects in the scene that reaches the measured spot is referred to as and is the multipath of objects in the background environment. The ambient term is difficult to write out explicitly as multipath reflections depend on the ambient surroundings, which are generally unknown. Finally describes the intensity from atmospheric air particles.
The goal of the radiometric chain in commercial devices is to rewrite Eq. 5 into a form that extracts . Consider the illustration of the three radiation components in Fig. 4. In literature, the human body is assumed to be opaque to thermal radiation, such that thermal radiation does not pass through the body. The emissivity of the human body can then be described by Kirchhoff’s law: , where is absorptivity or the fraction of incident radiation that is absorbed by the object. In analogy to visible light optics, conservation of energy on absorbed, reflected, and transmitted radiation is expressed as:
| (6) | ||||
| (7) |

where are the fraction of reflected and transmitted radiation respectively. For opaque, human skin, and consequently . When measuring a human body target in the setting of Fig. 4, multiple radiative phenomena are recorded by a thermal sensor. Due to opacity, the human only emits radiation (Eq. 3) and reflects a portion of background radiation. The emitted and reflected components then pass through an atmospheric volume. The atmosphere both attenuates the incoming radiation by , the transmission factor, and emits its own radiation. Putting this together, we can use the emissivity of the human skin as well as human temperature (), ambient temperature () and atmospheric temperature () to write Eq. 5 as
| (8) |
Note the explicit use of a bar on top of the temperature symbols. This emphasizes that the temperature is at steady state and not fluctuating in time. A summary of notation is shown in Table 2. Eq. 8 can be algebraically rearranged to solve for the human skin temperature as
| (9) |
Estimation of skin temperature from Eq. 9 requires values for all parameters on the right hand side of the equation. This is problematic because is not known. It is possible to hard-code a value as some existing thermal monitors do, by estimating the working distance and priors on air concentration. However, since our derivations in this paper will not depend on the specific value of , we will without loss of generality set . At a close range of less than 3 meters , and this value is also a good approximation when the camera is sufficiently close to the human subject. Eq. 9 now simplifies to
| (10) |
Here all terms on the right hand side are measured or estimated in commercial devices for healthcare. As discussed, is the intensity measured by the instrument and for the human body. Clinical devices include an additional calibration step to measure , the ambient temperature. While temperature of human skin can now be estimated in multipath conditions, there is another problem: skin temperature is not the same as clinically useful core temperature.
3.2 Core Temperature Estimation
We now discuss how existing devices estimate core temperature from skin temperature. The core temperature, denoted as , is the temperature of our internal organs and differs from peripheral skin temperature by a few degrees Celcius. Clinicians seek the core temperature, not the skin temperature. Existing instruments estimate from by finding a map:
| (11) |
where the form of varies across manufacturers, and use configurations. Existing devices use a mapping that assumes the subject is thermoneutral, i.e., the skin temperature is at a steady state temperature with no transient effects. Such mappings are often linear, of the form:
| (12) |
where and are scalar coefficients used by a manufacturer. Unfortunately, the assumption of a steady state model is invalid. In the specific case of this paper, if sun is shining on a person’s skin, there is a transient effect to but that same transient effect will not propagate to .
The core mapping, , is opaque to users because it is built from proprietary data collected by a manufacturer. As such, instead of directly solving for core temperature, we aim to estimate the solar loading bias in skin temperature. With a bias value, we can estimate the thermoneutral skin temperature and use existing device mappings to obtain the core temperature.
3.3 Gap in Prior Models: Solar Loading
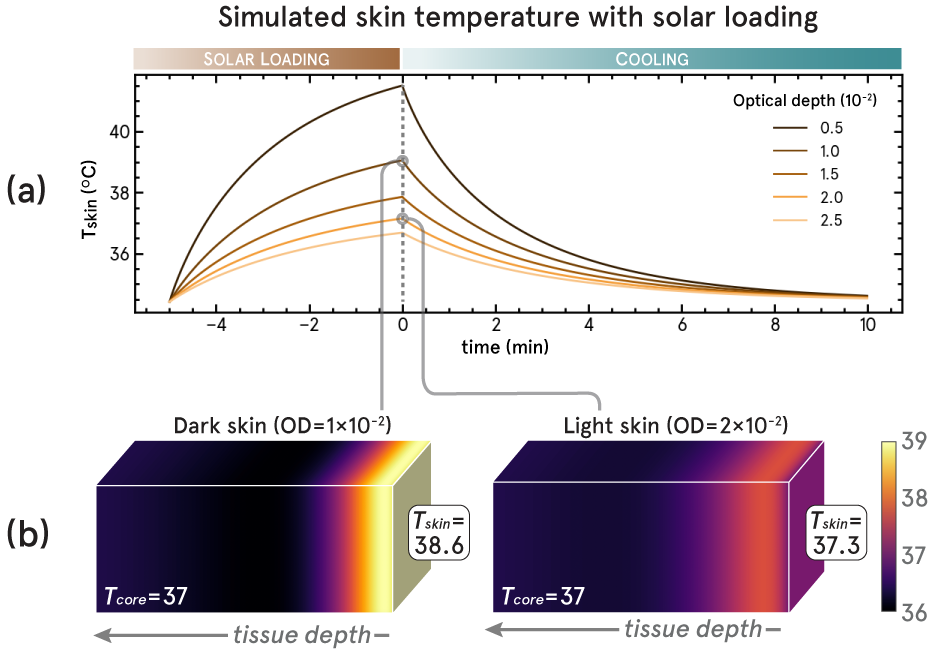
The gap in the current radiometric chain in Eq. 5 is that heating from the sun is not modeled. As discussed from the introduction of the paper, the problem that we seek to address is solar loading, where the skin heats up outdoors due to sunlight. A valid indoor measurement can then only be taken many minutes later. The focus of this paper is to correct for solar loading while minimizing the waiting period. It should also be noted that while solar loading is a source of error for all human subjects, it particularly disadvantages darker skin subjects who heat up more due to melanin absorption. We model tissue in the next section with varying melanin to underscore this disparity.
3.4 Equity of Solar Loading
The magnitude of the solar loading effect depends on absorption of solar radiation by the skin. Melanin absorbs solar radiation in the visible range of the EM spectrum and conservation of energy dictates that absorbed the energy must exit the skin. It does so in the form of long wave radiation, also known as thermal radiation. Eq. 7 dictates that absorptivity is equal to emissivity (), which is constant for human skin. This appears to contradict the claim that absorption of solar radiation is melanin dependent. However, in Eq. 7 is defined for thermal wavelengths, while absorption of solar radiation mainly occurs for visible wavelengths.
Heat transfer literature provide models of skin temperature that must be numerically solved. Using the model posited by Wang et al. [33], we simulate skin temperature during and after solar loading while varying melanin concentration. We show the results in Fig. 5(a) and observe that the theory confirms that darker skin is more impacted by solar loading. Additionally, we simulate tissue temperature over depth in Fig. 5(b), showing that is indeed invariant to solar loading.
4 Transient Model and Correction
(Solution I)
Here, we present Solution I for solar loading that uses only the transient temperature profile at a single spatial point to correct for solar loading. The advantage of Solution I (compared to Solution II) is the requirement of only one spatial location. This is useful because temperature scanners are often single pixel as they are much cheaper than a thermal camera. The downside of Solution I (compared to Solution II) is that transient information alone only reduces but does not eliminate a waiting period. For readers who seek full elimination of the waiting period, skip to camera-based Solution II in Section 5.
4.1 Transient Model of Solar Loading
Solar loading involves transience. The existing three component model from Eq. 5 needs to be generalized to include time as a parameter. Let us do so using for time and writing
In contrast to the previous steady state model, depends on both steady state and time-varying components of the skin temperature. Solar loading skin temperature can be written as:
| (14) |
where is the maximum solar loaded bias at steady state in units of degrees. Note that the maximum solar loading is a steady state quantity, but transience arises vis a vis multiplication by time-varying function with range from 0 to 1 representing the fraction of maximum solar loading. For example, a person who has been outdoors for a while might have a maximum temperature increase of . When the person returns indoors they will start cooling down as starts to decay from a maximum value of 1 (fully loaded) to 0 (no solar loading bias). It is useful to also think of a transient parametrization of solar loading bias, . This can be written by rearranging Eq. 14 as
| (15) |
Heat transfer literature studies how human body tissue heats up with radiation and offers differential equations for bio-heat. One such model, from Wang et al. [33], can be approximated such that skin temperatures approximate an exponential model during solar loading and cooling. This is visualized in Fig. 6. Using this principle, an estimate of temperature can be obtained by replacing in Eq. 14 with an exponential. This returns two equations, one for heating/loading and another for cooling:
| (16) |
where , are the rate of heating and cooling respectively and have non-negative values. The rates depend on factors such as skin tone, blood flow and environmental temperature.
4.2 Solar Loading Correction via Transient Measurements
Here, our goal is to estimate the steady state temperature , which is at a single scene point. From Eq. 16 we see that skin temperature is parameterized by three values: the maximum solar loading, the level of solar loading and the steady state skin temperature. With a time series of skin temperature measurements, we can extrapolate by fitting to the exponential model.
Based on Eq. 16, only three temperature measurements are needed to fully determine ; that is, we only need to find , and . Our estimated steady state skin temperature can be passed through a standard IRT core estimation block to retrieve a solar loading invariant core temperature:
| (17) |
where is the time the first temperature sample was captured and is the time the last sample was captured. The total time window observed is then .
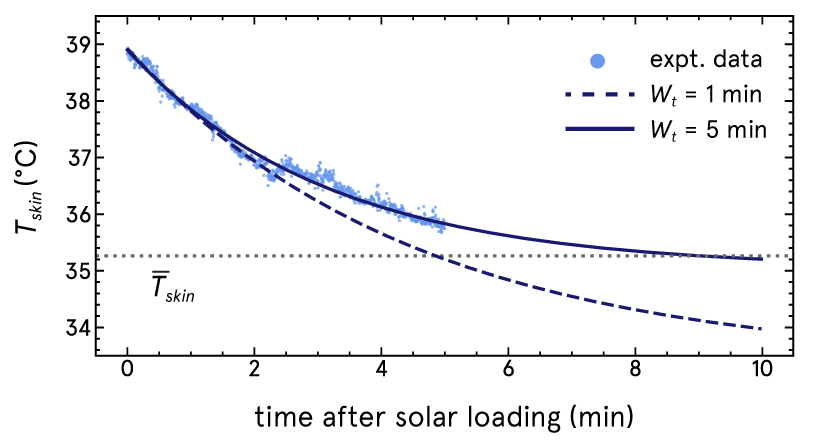
Unfortunately, thermal sensors exhibit drift and introduce a non-Gaussian temporally distributed noise that is difficult to correct, resulting in a low signal-to-noise ratio (SNR). The distribution of noise is also non-stationary. Environmental fluctuations such as wind and other factors must also be accounted for. For this reason using transient data in the real world is difficult. Solution I requires many more than three measurements and a suitably long time window of observation for the steady state extrapolation to work well. This is illustrated on real data in Fig. 6, where one observes that multiple minutes, between 3-5 minutes of transient data are needed to extrapolate the exponential. Nonetheless, Solution I is still an advance over previous methods which do zero solar loading correction. In particular, the waiting period is on average reduced as compared to existing solutions. However, we still seek a single shot solution, enabling mass screening without a waiting period. In Solution II, we leverage the spatial temperature field of a face to demonstrate single shot correction.

5 Spatial Modulation and Correction
(Solution II, Single Shot)
Although solar loading seems like a solely transient effect, there is a spatial dependence as well. Solar loading is a variational quantity with respect to the spatial fields of geometry and material that characterize a human face.
5.1 Spatial Modulation in the Radiometric Chain
The three path radiometric chain in Eq. 5 describes neither temporal nor spatial modulation. It can be generalized to include space as a parameter. Let us do so, using for space to write:
A few direct simplifications have been made:
-
•
The ambient multipath and atmospheric intensity is assumed to not be spatially dependent.
-
•
Temporal information is not involved because we are restricting scope to single shot correction.
The first question we must answer is, how does solar loading relate to spatial modulation? We follow an analogous path to Equations 13 to 16 from Solution I by defining solar loading bias as a spatial functional:
| (19) |
By itself, Eq. 19 does not rigorously show is spatially dependent. For example, the RHS of Eq. 19 could be a constant. Therefore, we offer the following claim:
Proposition 1: Solar loading has variation across the spatial dimension of a human face.
Justification:We need to show that and are both functions of space, and that they are different functions of space (so they do not cancel to a constant). In particular, the two quantities and are defined by a partial differential equation known as Penne’s Bio-heat equation whose mechanics are illustrated in Fig. 7. This equation is derived from the standard heat equation, where heat storage is balanced with diffusion (), internal heat generation and external heating sources. In our simplified setting, heat generation is from in vivo physiology which we abstract as (), external heating is from the sun (), and the tissue properties are defined by the constants: tissue density () and specific heat of tissue (). For brevity, we do not include the boundary conditions and full definition of all terms. For further details, we direct the reader to Wang et al. [33]. We then have:
| (20) |
| (21) |
The primary difference between the two is that we define as:
| (22) |
where is the proportion of incident solar energy absorbed given the melanin concentration, , in the skin, is the incident solar radiation power, is the direction of solar radiation, and is the surface normal vector at the location .
Note that and are both modulated by spatial heterogeneity in biology of the skin (spatial variation of blood perfusion, melanin concentration, etc.). However, when sunlight is incident on the face, , and thereby are spatially dependent on the interaction of the solar rays with the geometry of the face: .
Unfortunately, Proposition 1 suggests that the bias term is jointly dependent on time and space. In the following, we show that there exists a space-time equivalence in the bias term that allows us to write it strictly as a function of space if certain conditions are met, thus enabling one-shot methods. We show a representative example that can be generalized to more complex scenes.
Proposition 2: There exists a Space-Time Equivalence in Solar Loading Bias if is constrained to be spatially homogeneous and already under steady state conditions.
Justification: The spatially varying solar loading bias can be solved for with linear equations if is spatially homogeneous and in steady state such that it is written as . Then, the solar loading bias can be solved for given at least two regions whose temperatures and surface normals are known and different from each other. The temperature of their regions can then be modeled from Eq. 14 at a particular time instant :
| (23) |
Given the temperatures of the regions, as well as the solar vector and surface normals, it is possible to solve for . Then, the solar bias can be determined at any location whose surface normal and solar vector is known at one point in time.
5.2 Correcting for Solar Loading in Space-Time
The spatial-modulation model in Eq. 21 describes the governing equations for solar loaded skin temperature, parameterized by and melanin. Theoretically, the equations can be inverted to solve for given a series of observations. Unfortunately Eq. 21 is difficult to solve analytically due to the non-standard spatial domain of the face. We know that skin temperature varies spatially, but the lack of an analytical solution precludes our understanding of the specific temperature patterns and gradients induced by solar loading. There is, however, no dearth of facial thermal imagery. By taking a data-driven approach, we can correct solar loading by learning a canonical pattern of heat distribution from real faces that allows us to relax the spatially homogeneous constraint in Eq. 23. While spatial temperature and normal vector distributions [34] of the face can be learned through a data-driven approach, a potential drawback of the method is if the relative orientation of the surface normals and light vector vary at a high frequency during solar loading due to motion. If this occurs, than Eq. 23 is invalid due to the light vector being a function of time, .
6 Experimental Method and Protocols
We show through simulation and in situ experiments that the solar loading bias affects IRT measurements and is skin tone-dependent. To do so, we acquire a unique dataset of temperature and skin color information. Our imaging prototype consists of an IR camera (FLIR Lepton 3.5 LWIR camera) mounted next to a RGB webcam (ArduCam). The RGB camera is only used for better facial landmark detection when processing the dataset. In lieu of a block-body reference, the wall in the background of the images is used as a pseudo-reference to help correct for camera flat-field correction effects. Environmental conditions are recorded using a solar power meter (Tenmars Solar Meter TM-206) and a handheld anemometer (BTMeter Anemometer 866A). Throughout the experiment, the study subject is measured using multiple NCITs, an oral thermometer (Boncare Digital Thermometer MT-601A) and our RGB-IR camera setup. Subject’s skin tone information is recorded during the study; as there is no universal non-invasive skin color measurement, we discuss some existing methods of skin color measurement.
6.1 Skin Color Measurement
The standard for measuring skin tone in previous works has been subjective classification of skin darkness and using ethnicity as a proxy for skin tone. Classification of skin tones is done using Fitzpatrick skin tone (FST) scale, which groups skin tones into 6 categories of variable skin darkness. We record FST using the ratings of 2 or more study coordinators. The FST scale has known limitations [35] so we collect objective skin tone measurements to separate optical biases from race-related physiological biases. The FST and melanin demographics are shown in Fig. 9. We use the DSM III Colormeter (Cortex Technology) to measure melanin index (). This device has been widely used in various clinical studies for skin tone and scar color measurements [36, 37]. The colormeter measures red light reflected by the skin (), to obtain:
| (24) |
In subsequent analysis, we group subjects into dark and light skin tone groups based on the . We select as the threshold between dark and light skin tones because it is the median value of our dataset.
6.2 Solar Loading Correction
The hardware required for our data acquisition is off-the-shelf and relatively inexpensive. The novelty of our method is in our computational imaging algorithms, which we discuss next.
6.2.1 Transient Solution
Solving for using Eq. 16 can be done in many ways. Due to the unknown steady state term, the function is not linearizable but can be solved numerically using a non-linear least squares algorithm or using a grid search as in [38, 39]. Knowledge of typical skin parameters allows use to bound the variables; in our case, we constrain skin temperature to be between and the solar loading bias to safely be between . We find that fitting an exponential to the data is extremely sensitive to the camera calibration, so we additionally weight the data according to the calibration status, determined by finding temperature spikes in the background image.
6.2.2 Single-Shot Solution
To demonstrate the utility of spatial information, we train a lightweight convolutional neural network (CNN) to learn solar loading bias from single-shot data. The network is exceedingly simple and still performs well, consisting only of two convolutional layers and three fully connected layers. We train using the ADAM optimizer for 20 epochs on cropped () facial thermal images. While we do our best to collect a diverse data from training, there will always be gaps in the acquired dataset. To combat this, we augment the dataset in multiple ways. First, we apply random horizontal flips to training data, since the level of solar loading bias in the image does not change due to flips. We simulate fever images by adding a constant offset () to the face images [40]. The linear effect of core temperature on skin temperature is shown in Wang et al. [33]. The simulated fever images help ensure that the model is not overfitting to temperature intensity, rather than spatial patterns, when correcting for solar loading. We use a statistical power analysis to determine that 14 is the minimum number of subjects needed, and we collect data from 21 subjects. The network is trained using leave-one-out cross validation; each subject is used as a test subject, 4 subjects are used for validation and remaining subjects are used for training.
6.3 Performance and Bias Measures
The American Society for Testing and Materials (ASTM) states that an acceptable accuracy for clinical infrared thermometers should be an error at or less than C in the range of C for research devices and at or less than C for commercial devices. [41]. In this work, we assess our methods on mean absolute error (MAE), root mean square error (RMSE) and mean absolute percentage error (MAPE).
7 Results
7.1 Experimental and Implementation Details
We collect data from subjects under multiple conditions: thermoneutral, solar loading, and cooling. We record the subject’s temperature, skin color and the experimental conditions. The setup is shown in Fig. 2(a). Prior to the experiment, the subject rests indoors to acclimatize to the experiment location. After resting, the subject’s oral temperature, NCIT temperatures and skin color are recorded. A thermal video of their face provides steady state skin temperature. Next, the subject stands in sunlight for five minutes, after which they are immediately measured using NCITs. Back indoors, the subject cools down for five minutes and their skin temperature is recorded continuously by our thermal camera setup. Finally, NCIT temperatures are measured after five minutes of cooling.
Solar loading bias depends not only on skin tone, but also on environmental conditions, such as wind, solar azimuth, and cloudiness. To control for these covariates, we only collect data under the following conditions:
-
•
Solar zenith close to 0 (12:00-2:00PM)
-
•
Minimal to no clouds ()
-
•
Minimal to no wind ()
Collecting data in a limited time of day also controls for diurnal variations. 21 subjects with melanin index () values over the range were selected to ensure a skin tone diverse dataset and the dataset demographics are summarized in Fig. 9.
In the following, we assess our solar loading correction methods against the thermal camera measurement of steady state skin temperature, . We do not directly compare the camera method to the NCITs since the mapping function from to is unknown as mentioned in Section 3.2. We compare our temporal and spatial solutions against the uncorrected thermal measurement after solar loading and cooling.
| Method | MAE (°C) | RMSE (°C) | MAPE (°C) | |
|---|---|---|---|---|
| Steady State | 0 | 0 | 0 | |
| Sol. I | 1.63 | 2.16 | 4.75 | |
| Sol. II | 0.39 | 0.52 | 1.13 | |
| Solar Loaded | 2.86 | 2.97 | 8.40 | |
| Sol. I | 2.48 | 2.79 | 7.23 | |
| Sol. II | 0.72 | 0.95 | 2.12 |
7.2 Transient Solution (Solution I)
Since most point sensors measure the forehead temperature, we choose this location for our transient experiments. The forehead is also the most accessible and tends to have a steady temperature, making it easy to continuously measure this location. An example forehead temperature curve during cooling is shown in Fig. 6, along with exponential curves fit with variable window lengths. In both cases, the exponential fitting is successful in minimizing the residual, but an accurate does not always accompany this. In Table 3, the performance of this method is shown as Sol. I. Assuming an exponential model causes the model to suffer on easy cases, such as the steady and cooled states, where temporal noise may present as a skin transient. However, for the solar loaded case, this model corrects a minimal amount of solar loading (MAE= compared to MAE= for the uncorrected skin temperature).
7.3 Spatial Solution (Solution II)
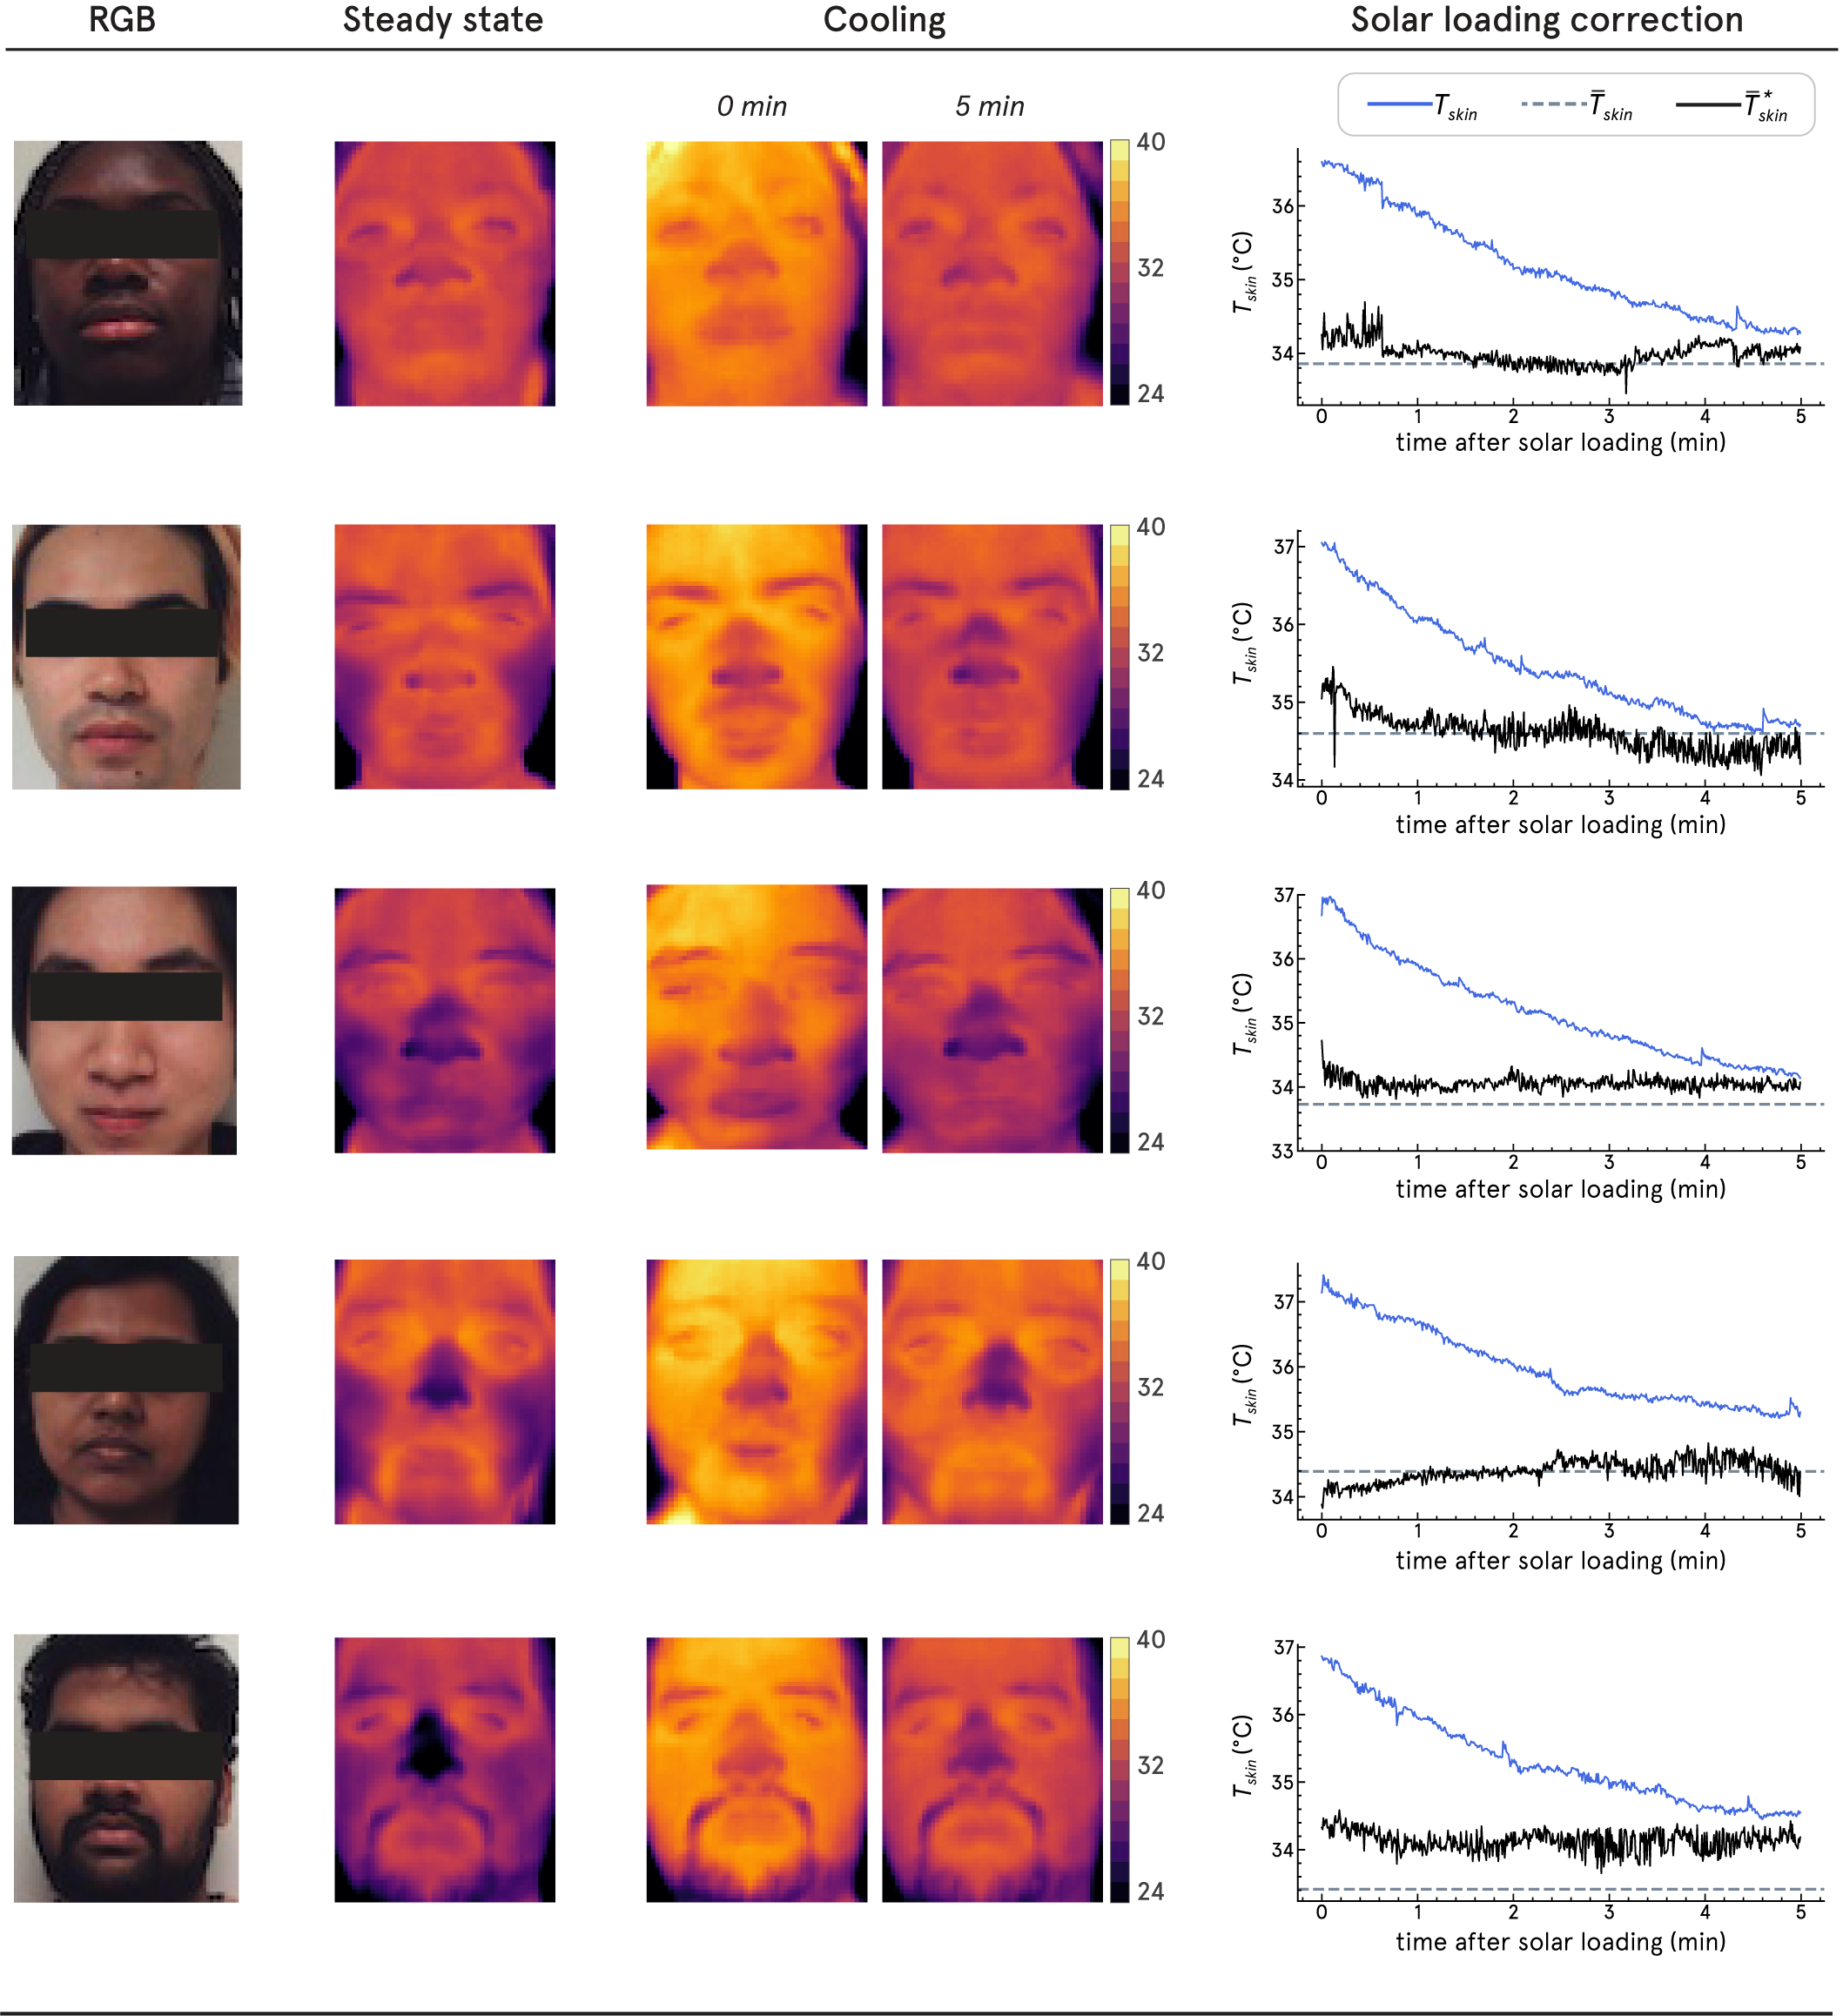
Our learned spatial solution is a data-hungry model. Since the problem of solar loading is unexplored, we collect our own dataset to test our spatial correction method. For each subject, we acquire their steady state facial temperatures as well as a continuous capture of cooling after solar loading. The steady state is used to generate for solar loaded frames for the model to regress on. Fig. 8 shows facial temperatures and results from our trained CNN on multiple subjects. We observe that the model tends to perform worse when correcting the first minute of cooling. The solar loading effect is the strongest in the early minutes of cooling and the magnitude of solar loading may be difficult to correct. Additionally, recall that skin temperature cools exponentially, so there are far less frames of strong solar loading compared to moderate solar loading. Overall, the accuracy does not suffer too much due to this effect. One failure case is shown in Fig. 8. The model attempts to correct solar loading but achieves a constant error in correction over time. Despite this, the model still recognizes that solar loading is present and corrects of solar loading. Quantitative results from the CNN are given in Table 3 as Sol. II. Sol. II significantly outperforms other methods in the case of solar loading, estimating level of solar loading with an MAE=0.97.
Note too, that Solution II is not returning false positive corrections, i.e., making a correction to temperature when solar loading does not exist. As illustrated in the curves in Fig. 8 the temperature prediction from Solution II is relatively uncorrelated with the amount of solar loading.
8 Equity Analysis
In Section 3.4, we proposed melanin bias in solar loading using theory and now we further validate this finding with experimental data. The lower-level skin bias is seen in Fig. 2(b). Dark skin samples have, on average, a higher solar loading bias than light samples by . After our spatial solar loading correction, the absolute difference between dark and light solar loading bias is (MAE for dark samples is , MAE for light samples is ).
While our experimental conditions control for non-subject covariates, we can further improve our analysis by collecting data from subject pairs. Two subjects, one with dark skin and one with light skin, complete the experiment at the same time, hence undergoing the same environmental conditions. We are interested in how the NCIT error, , varies between skin tones. Paired measurements were compared using paired t-tests (). The subsequent analysis shows only the results for device NCIT 1; we do not report specific values for the other tested NCITs since they exhibit the same behavior.
Prior to solar loading, there is no statistical difference in NCIT error between dark and light samples. However, after five minutes of solar loading, NCIT temperatures are higher for dark subjects with a mean bias of CI . After five minutes of cooling, there is again no statistical difference in NCIT error between skin tones. We conclude that—under solar loading—NCITs overestimate temperatures more severely for dark skin compared to light skin subjects. NCIT performance is summarized in LABEL:tab:ncit_maes.
| MAE (°C) | ||||
|---|---|---|---|---|
| Method | Steady state | Solar loaded | Cooled (5’) | Claimed Acc. |
| NCIT 1 | 0.39 | 7.10 | 0.65 | 0.1 |
| NCIT 2 | 0.60 | 6.10 | 0.72 | 0.3 |
| NCIT 3 | 0.51 | 7.98 | 0.78 | 0.2 |

While there is no bias after 5 minutes of cooling, the NCITs are still inaccurate: NCIT values are uncorrelated with oral temperatures (). This is compared to moderate correlation for before solar loading () and poor correlation after 5 minutes of solar loading (). Daanen et al. [1] suggest subjects should rest for up to 30 minutes after heat exposure to ensure accurate NCIT readings. The poor accuracy of the NCIT after five minutes of cooling agrees with the time frame set forth by Daanen et al. [1].
9 Discussion
In summary, this paper presents two methods of correction of solar loading. Solution I of using transient correction was a natural method to implement and relates to NCIT devices. Unfortunately, temporal errors in the measurement from today’s devices means that transient correction (as we implemented it) requires a large window of sampling observation. We therefore consider our implementation of Solution II of using spatial correction to be desirable. This enables single shot elimination of solar loading with a thermal camera.
Limitations:
This study characterizes light transport principles and demonstrates the ability to correct for solar loading in a single shot, but it is not a large-scale clinical study of solar loading. The scale of this study was chosen to match calculations of a power size sample statistic. Based on the large effect size of solar loading, only 14 samples were needed to draw significance. A larger scale study, conducted in the clinic, could directly assess the impact of solar loading, not only on temperature measurement, but also clinical decision making.
Future Work:
In the future it would be interesting to explore how this method relates to other types of thermal transients. For example, fluctuations with respect to cold weather. Fusing the temporal and spatial solutions may yield better results and can be explored in the future. Another area of future work would lie in the estimation of other physiological signals. Finally, we would like to mention that there are other modalities of sensing that have issues with equity, including but not limited to pulse oximeters [22], light-based blood sensors [42, 43, 24] or electrodes for neural sensing [44, 45]. It is possible that some of the metrics and study design we have proposed to achieve more equity for thermal hardware can be translated to equity in other forms of health sensing.
Conclusion:
This study has discussed solar loading and offered single shot correction (33ms) using spatial information. Before spatial correction, the solar loading bias is and post-correction the error is . Before spatial correction the difference in solar loading effects between dark and light skin groups is statistically significant with test statistic of (one-tail Kolmogorov-Smirnov test, ) and after correction the difference is not statistically significant (). We hope this lays a foundation for large scale efforts to improve the ability of thermal cameras to accurately and equitably sense the human body.
10 Ethical Considerations
The equity numbers from this paper were based on the sampling dataset used by the authors. The study was collected on a University campus and does not match the inclusion criteria of a societal study. Although this paper analyzes skin tone, this is only one particular axis on which one seeks equitable operation. There exist several other axes of variation across humans. The study size in this paper was sufficiently large to demonstrate that solar loading is corrected (based on power analysis measures), but a large-scale clinical study that builds on the ideas in this paper could explore a broader range of inclusion criteria, axes of demographic variation, and improvements in the performance of solar loading correction.
11 Acnowledgements
We thank members of the Visual Machines Group (VMG) at UCLA for feedback and support. We thank Bahram Jalali for helpful discussions and feedback on the physics of thermal imaging. This material is based upon work supported by the National Science Foundation Graduate Research Fellowship under Grant No. (DGE-2034835). E.Z. was supported by the NSF GRFP. P.C. was supported by a Cisco PhD Fellowship. A.K. was supported by an NSF CAREER award IIS-2046737, Army Young Investigator Program (YIP) Award, and DARPA Young Faculty Award (YFA).
References
- \bibcommenthead
- Daanen et al. [2020] Daanen, H., Bose-O’Reilly, S., Brearley, M., Flouris, D.A., Gerrett, N.M., Huynen, M., Jones, H.M., Lee, J.K.W., Morris, N., Norton, I., Nybo, L., Oppermann, E., Shumake-Guillemot, J., Hazel, P.V.: COVID-19 and thermoregulation-related problems: Practical recommendations. Temperature 8(1), 1–11 (2020) https://doi.org/10.1080/23328940.2020.1790971
- Ogawa et al. [2022] Ogawa, T., Tsukuda, Y., Suzuki, Y., Hiratsuka, S., Inoue, R., Iwasaki, N.: Utility of thermal image scanning in screening for febrile patients in cold climates. Journal of Orthopaedic Science 27(6), 1333–1337 (2022) https://doi.org/10.1016/j.jos.2021.08.002
- Dzien et al. [2020] Dzien, C., Halder, W., Winner, H., Lechleitner, M.: Covid-19 screening: are forehead temperature measurements during cold outdoor temperatures really helpful? Wiener klinische Wochenschrift 133(7-8), 331–335 (2020) https://doi.org/10.1007/s00508-020-01754-2
- Spindel et al. [2021] Spindel, J.F., Pokrywa, S., Elder, N., Smith, C.: The environment has effects on infrared temperature screening for COVID-19 infection. American Journal of Infection Control 49(11), 1445–1447 (2021) https://doi.org/10.1016/j.ajic.2021.08.002
- Tay et al. [2015] Tay, M.R., Low, Y.L., Zhao, X., Cook, A.R., Lee, V.J.: Comparison of infrared thermal detection systems for mass fever screening in a tropical healthcare setting. Public Health 129(11), 1471–1478 (2015) https://doi.org/10.1016/j.puhe.2015.07.023
- Ravi et al. [2022] Ravi, N., Vithyananthan, M., Saidu, A.: Are all thermometers equal? a study of three infrared thermometers to detect fever in an african outpatient clinic. PeerJ 10, 13283 (2022) https://doi.org/10.7717/peerj.13283
- Foster et al. [2021] Foster, J., Lloyd, A.B., Havenith, G.: Non-contact infrared assessment of human body temperature: The journal temperature toolbox. Temperature 8(4), 306–319 (2021) https://doi.org/10.1080/23328940.2021.1899546
- El-Radhi [2018] El-Radhi, A.S.: Fever in common infectious diseases. In: Clinical Manual of Fever in Children, pp. 85–140. Springer, Cham, Switzerland (2018). https://doi.org/10.1007/978-3-319-92336-9_5 . https://doi.org/10.1007/978-3-319-92336-9_5
- Kutulakos [2016] Kutulakos, K.: Technical perspective: The dawn of computational light transport. Communications of the ACM 59(9), 78–78 (2016) https://doi.org/%****␣sample-base.bbl␣Line␣200␣****10.1145/2975163
- Welch [2015] Welch: Care Temp Touch-Free Thermometer - Directions for use (2015). https://www.welchallyn.com/content/welchallyn/emeai/me/products/categories/thermometry/forehead-thermometers/caretemp-touch-free-thermometer.html
- ADC [2017] ADC: Adtemp non-contact thermometer, Model 429 user manual (2017). https://www.adctoday.com/products/429
- Sejoy [2010] Sejoy, J.: Sejoy Digital Infrared Forehead Thermometer DET-206/306 (2010). https://www.sejoygroup.com/wholesale-baby-medical-digital-infrared-forehead-thermometer.html
- Erenberk et al. [2013] Erenberk, U., Torun, E., Ozkaya, E., Uzuner, S., Demir, A.D., Dundaroz, R.: Skin temperature measurement using an infrared thermometer on patients who have been exposed to cold. Pediatrics International 55(6), 767–770 (2013) https://doi.org/10.1111/ped.12188
- Kistemaker et al. [2006] Kistemaker, J.A., Hartog, E.A.D., Daanen, H.A.M.: Reliability of an infrared forehead skin thermometer for core temperature measurements. Journal of Medical Engineering & Technology 30(4), 252–261 (2006) https://doi.org/10.1080/03091900600711381
- Shajkofci [2022] Shajkofci, A.: Correction of human forehead temperature variations measured by non-contact infrared thermometer. IEEE Sensors Journal 22(17), 16750–16755 (2022) https://doi.org/10.1109/JSEN.2021.3058958
- Švantner et al. [2021] Švantner, M., Lang, V., Kohlschutter, T., Skála, J., Honner, M., Muzika, L., Kosová, E.: Study on human temperature measurement by infrared thermography. In: The 16th International Workshop on Advanced Infrared Technology & Applications, p. 1. MDPI, Basel Switzerland (2021). https://doi.org/%****␣sample-base.bbl␣Line␣300␣****10.3390/engproc2021008004 . https://doi.org/10.3390/engproc2021008004
- Wang et al. [2021] Wang, Q., Zhou, Y., Ghassemi, P., McBride, D., Casamento, J.P., Pfefer, T.J.: Infrared thermography for measuring elevated body temperature: Clinical accuracy, calibration, and evaluation. Sensors 22(1), 215 (2021) https://doi.org/10.3390/s22010215
- Dagdanpurev et al. [2018] Dagdanpurev, S., Sun, G., Choimaa, L., Abe, S., Matsui, T.: Clinical application of multiple vital signs-based infection screening system in a mongolian hospital: Optimization of facial temperature measurement by thermography at various ambient temperature conditions using linear regression analysis. In: 2018 40th Annual International Conference of the IEEE Engineering in Medicine and Biology Society (EMBC), pp. 5313–5316. IEEE, Honolulu, HI (2018). https://doi.org/10.1109/embc.2018.8513513 . https://doi.org/10.1109/embc.2018.8513513
- Wu et al. [2008] Wu, S., Lin, W., Xie, S.: Skin heat transfer model of facial thermograms and its application in face recognition. Pattern Recognition 41(8), 2718–2729 (2008) https://doi.org/10.1016/j.patcog.2008.01.003
- S. et al. [2020] S., M., V.R., N., P.S., R., S., R.R., L., N.: Pervasive computing in the context of COVID-19 prediction with AI-based algorithms. International Journal of Pervasive Computing and Communications 16(5), 477–487 (2020) https://doi.org/10.1108/ijpcc-07-2020-0082
- Li et al. [2018] Li, D., Menassa, C.C., Kamat, V.R.: Non-intrusive interpretation of human thermal comfort through analysis of facial infrared thermography. Energy and Buildings 176, 246–261 (2018) https://doi.org/10.1016/j.enbuild.2018.07.025
- Kadambi [2021] Kadambi, A.: Achieving fairness in medical devices. Science 372(6537), 30–31 (2021) https://doi.org/10.1126/science.abe9195
- Zou and Schiebinger [2021] Zou, J., Schiebinger, L.: Ensuring that biomedical AI benefits diverse populations. EBioMedicine 67, 103358 (2021) https://doi.org/10.1016/j.ebiom.2021.103358
- Vilesov et al. [2022] Vilesov, A., Chari, P., Armouti, A., Harish, A.B., Kulkarni, K., Deoghare, A., Jalilian, L., Kadambi, A.: Blending camera and 77 ghz radar sensing for equitable, robust plethysmography. ACM Trans. Graph.(SIGGRAPH) 41(4), 1–14 (2022)
- Ba et al. [2022] Ba, Y., Wang, Z., Karinca, K.D., Bozkurt, O.D., Kadambi, A.: Style transfer with bio-realistic appearance manipulation for skin-tone inclusive rPPG. In: 2022 IEEE International Conference on Computational Photography (ICCP). IEEE, ??? (2022). https://doi.org/10.1109/iccp54855.2022.9887649 . https://doi.org/10.1109/iccp54855.2022.9887649
- Chari et al. [2020] Chari, P., Kabra, K., Karinca, D., Lahiri, S., Srivastava, D., Kulkarni, K., Chen, T., Cannesson, M., Jalilian, L., Kadambi, A.: Diverse r-ppg: Camera-based heart rate estimation for diverse subject skin-tones and scenes. (2020)
- Adams et al. [2021] Adams, S., Bucknall, T., Kouzani, A.: An initial study on the agreement of body temperatures measured by infrared cameras and oral thermometry. Scientific Reports 11(1), 11901 (2021) https://doi.org/10.1038/s41598-021-91361-6
- Khan et al. [2021] Khan, S., Saultry, B., Adams, S., Kouzani, A.Z., Decker, K., Digby, R., Bucknall, T.: Comparative accuracy testing of non-contact infrared thermometers and temporal artery thermometers in an adult hospital setting. American Journal of Infection Control 49(5), 597–602 (2021) https://doi.org/10.1016/j.ajic.2020.09.012
- Strasse et al. [2022] Strasse, W., Campos, D.P., Mendonça, C.J.A., Soni, J.F., Mendes, J., Nohama, P.: Forehead, temple and wrist temperature assessment of ethnic groups using infrared technology. Medical Engineering & Physics 102, 103777 (2022) https://doi.org/10.1016/j.medengphy.2022.103777
- Bhavani et al. [2022] Bhavani, S.V., Wiley, Z., Verhoef, P.A., Coopersmith, C.M., Ofotokun, I.: Racial differences in detection of fever using temporal vs oral temperature measurements in hospitalized patients. JAMA 328(9), 885 (2022) https://doi.org/10.1001/jama.2022.12290
- Charlton et al. [2020] Charlton, M., Stanley, S.A., Whitman, Z., Wenn, V., Coats, T.J., Sims, M., Thompson, J.P.: The effect of constitutive pigmentation on the measured emissivity of human skin. PLOS ONE 15(11), 0241843 (2020) https://doi.org/10.1371/journal.pone.0241843
- Ring and Ammer [2012] Ring, E.F.J., Ammer, K.: Infrared thermal imaging in medicine. Physiological Measurement 33(3), 33–46 (2012) https://doi.org/10.1088/0967-3334/33/3/r33
- Wang et al. [2020] Wang, H., Burgei, W.A., Zhou, H.: Analytical solution of one-dimensional pennes’ bioheat equation. Open Physics 18(1), 1084–1092 (2020) https://doi.org/%****␣sample-base.bbl␣Line␣600␣****10.1515/phys-2020-0197
- Trigeorgis et al. [2017] Trigeorgis, G., Snape, P., Kokkinos, I., Zafeiriou, S.: Face normals" in-the-wild" using fully convolutional networks. In: Proceedings of the IEEE Conference on Computer Vision and Pattern Recognition, pp. 38–47 (2017)
- Ware et al. [2020] Ware, O.R., Dawson, J.E., Shinohara, M.M., Taylor, S.C.: Racial limitations of fitzpatrick skin type. Cutis 105(2), 77–80 (2020)
- Jaspers et al. [2017] Jaspers, M., Stekelenburg, C., Simons, J., Brouwer, K., Vlig, M., Kerckhove, E., Middelkoop, E., Zuijlen, P.: Assessing blood flow, microvasculature, erythema and redness in hypertrophic scars: a cross sectional study showing different features that require precise definitions. Burns 43(5), 1044–1050 (2017)
- van der Wal et al. [2013] Wal, M., Bloemen, M., Verhaegen, P., Tuinebreijer, W., Vet, H., Zuijlen, P., Middelkoop, E.: Objective color measurements: clinimetric performance of three devices on normal skin and scar tissue. Journal of Burn Care & Research 34(3), 187–194 (2013)
- Tanaka et al. [2018] Tanaka, K., Kubo, H., Ikeya, N., Funatomi, T., Takatani, T., Mukaigawa, Y.: Time-resolved light transport decomposition for thermal photometric stereo. In: 2018 IEEE/CVF Conference on Computer Vision and Pattern Recognition, pp. 4804–4814. IEEE, New York, NY, USA (2018)
- Tanaka et al. [2019] Tanaka, K., Ikeya, N., Takatani, T., Kubo, H., Funatomi, T., Ravi, V., Kadambi, A., Mukaigawa, Y.: Time-resolved far infrared light transport decomposition for thermal photometric stereo. IEEE Transactions on Pattern Analysis and Machine Intelligence 43(6), 2075–2085 (2019)
- Yan et al. [2023] Yan, M., Qian, J., Wang, R., Gao, S., Yang, J.: Dynamic group difference coding based on thermal infrared face image for fever screening. IEEE Transactions on Instrumentation and Measurement 72, 1–13 (2023) https://doi.org/10.1109/tim.2023.3235442
- ASTM-E1965-98 [2016] ASTM-E1965-98: Specification for infrared thermometers for intermittent determination of patient temperature. Technical report, ASTM International, West Conshohocken, PA (2016)
- Nowara et al. [2017] Nowara, E.M., Sabharwal, A., Veeraraghavan, A.: Ppgsecure: Biometric presentation attack detection using photopletysmograms. In: 2017 12th IEEE International Conference on Automatic Face & Gesture Recognition (FG 2017), pp. 56–62 (2017). IEEE
- Nowara et al. [2020] Nowara, E.M., McDuff, D., Veeraraghavan, A.: A meta-analysis of the impact of skin tone and gender on non-contact photoplethysmography measurements. In: Proceedings of the IEEE/CVF Conference on Computer Vision and Pattern Recognition Workshops, pp. 284–285 (2020)
- Bradford et al. [2022] Bradford, D.E., DeFalco, A., Perkins, E.R., Carbajal, I., Kwasa, J., Goodman, F.R., Jackson, F., Richardson, L.N., Woodley, N., Neuberger, L., et al.: Whose signals are being amplified? toward a more equitable clinical psychophysiology. Clinical Psychological Science, 21677026221112117 (2022)
- Ricard et al. [2023] Ricard, J., Parker, T., Dhamala, E., Kwasa, J., Allsop, A., Holmes, A.: Confronting racially exclusionary practices in the acquisition and analyses of neuroimaging data. Nature Neuroscience 26(1), 4–11 (2023)