11email: ducci@astro.uni-tuebingen.de 22institutetext: ISDC Data Center for Astrophysics, Université de Genève, 16 chemin d’Écogia, 1290 Versoix, Switzerland 33institutetext: International Space Science Institute (ISSI), Hallerstrasse 6, 3012 Bern, Switzerland 44institutetext: INAF – Osservatorio Astronomico di Brera, via Bianchi 46, 23807 Merate (LC), Italy 55institutetext: European Southern Observatory (ESO), Alonso de Córdova 3107, Casilla 19, Santiago 19001, Chile
X-ray flashes from the low-mass X-ray binary IGR J174072808
IGR J174072808 is an enigmatic and poorly studied X-ray binary that was recently observed quasi-simultaneously with NuSTAR and XMM-Newton. In this paper we report the results of this observational campaign. During the first 60 ks of observation, the source was caught in a relatively low emission state, characterised by a modest variability and an average flux of erg cm-2 s-1 (460 keV). Afterwards, IGR J174072808 entered a significantly more active emission state that persisted for the remaining 40 ks of the NuSTAR observation. During this state, IGR J174072808 displayed several fast X-ray flares, featuring durations of s and profiles with either single or multiple peaks. The source flux in the flaring state reached values as high as erg cm-2 s-1 (460 keV), leading to a measured dynamic range during the NuSTAR and XMM-Newton campaign of . We also analysed available archival photometric near-infrared data of IGR J174072808 to improve the constraints available so far on the the nature of the donor star hosted in this system. Our analysis shows that the donor star can be either a rare K or M-type sub-subgiant or an K type main sequence star, or sub-giant star. Our findings support the classification of IGR J174072808 as a low-mass X-ray binary. We discuss the source X-ray behaviour as recorded by NuSTAR and XMM-Newton in view of this revised classification.
Key Words.:
accretion – stars: neutron – X-rays: binaries – X-rays: individuals: IGR J174072808| Satellite | observation ID | Start time | End time | Net exposure | ||
|---|---|---|---|---|---|---|
| (UTC) | (MJD) | (UTC) | (MJD) | (ks) | ||
| NuSTAR | 30801013002 | 2022-09-13 15:06:09 | 59835.629 | 2022-09-14 23:21:09 | 59836.973 | FPMA: 55.93; FPMB: 55.45 |
| XMM-Newton | 0913200201 | 2022-09-13 14:29:08 | 59835.603 | 2022-09-14 03:18:08 | 59836.137 | pn: 25.66; MOS1: 38.20; MOS2: 37.93 |
1 Introduction
IGR J174072808 (hereafter: J17407) is an X-ray binary discovered by the International Gamma-Ray Astronomy Laboratory (INTEGRAL) in 2004 during an enhanced emission activity that ended with a bright and fast flare achieving a peak flux of erg cm-2 s-1 (2060 keV) and featuring a duration of about one minute (Kretschmar et al., 2004; Götz et al., 2004; Sguera et al., 2006). J17407 has been observed so far by several past and currently operating X-ray facilities, including ROSAT, INTEGRAL, Chandra, Swift, and XMM-Newton (Sidoli et al., 2001; Kretschmar et al., 2004; Ducci et al., 2010; Mereminskiy et al., 2020; Tomsick et al., 2008; Heinke et al., 2009; Romano et al., 2011, 2016). J17407 is frequently observed in a low emission state, characterised by a 210 keV flux that varies from erg cm-2 s-1 to erg cm-2 s-1. In almost all pointed X-ray observations performed during the low emission state (endowed with typical exposure times of 1020 ks), at least one short (50-400 s) and weak ([2-10 keV] erg cm-2 s-1) flare has been detected. Brighter flares are rare, but in some cases peak fluxes as high as [20-60 keV] erg cm-2 s-1 have been measured. The “activity duty cycle” (fraction of time spent by the source above erg cm-2 s-1 in 2040 keV) is thus estimated at % (Ducci et al., 2010; Romano et al., 2014). In the soft X-ray domain (0.310 keV), the X-ray spectrum of J17407 is usually well fit with a simple absorbed power law model. A hint for a curvature in the hard part of the source spectrum was reported by Romano et al. (2016), using simultaneous Swift/X-ray Telescope (XRT) and Burst Alert Telescope (BAT) data ( keV) collected during a bright flaring event (the measured unabsorbed flux was of [0.5-100 keV] erg cm-2 s-1). The curvature was modelled by using an exponential cutoff with parameters keV, keV (90% c.l.). The X-ray observations of J17407 showed that absorption column density () in its direction displays a large variability, ranging from cm-2 to cm-2, and uncorrelated with the flux.
Shortly after the discovery of J17407, Sguera et al. (2006) proposed that this source was one of the so-called supergiant fast X-ray transient (SFXT) based mainly on the spectral properties of the hard X-ray emission and the high flux variability. SFXTs are a sub-class of high-mass X-ray binaries (HMXBs) hosting a compact object (likely a neutron star) that is accreting from the stellar wind of a massive OB supergiant. These objects show typical dynamic ranges of (up to , Romano et al. 2015) and sporadic flares with durations of s. The recorded peak X-ray luminosities during these events are usually of erg s-1 (Romano, 2015; Sidoli, 2017; Romano et al., 2023). Several accretion mechanisms have been proposed to explain the fast and strong variability of SFXTs. They involve gating mechanisms, settling accretion regimes, and accretion of inhomogeneous winds from the donor star (e.g., in’t Zand, 2005; Grebenev & Sunyaev, 2007; Bozzo et al., 2008; Ducci et al., 2010; Shakura et al., 2014).
The identification of CXOU J174042.0280724 as the Chandra counterpart to J17407 (Romano et al., 2011; Heinke et al., 2009) enabled the association of the X-ray source with an infrared object (Greiss et al., 2011; Kaur et al., 2011). This was studied in detail by Greiss et al. (2011) using the 4-m Visible and Infrared Survey Telescope for Astronomy (VISTA) at Paranal Observatory. The J2000 coordinate of the optical counterpart are RA=17:40:42.0168, Dec=28:07:25.050, with an astrometric fit RMS of 0.1 arcsec. The International Astronomical Union (IAU) identifier of this object is VVV J174042.01280725.05. Assuming extinction values based on the properties of red clump giants and the VISTA Variables in the Via Lactea (VVV) survey data (Gonzalez et al., 2011), Greiss et al. (2011) classified this star as a late type-F dwarf at 3.8 kpc. By exploiting archival data collected by the instrument Son OF ISAAC (SOFI) mounted on the ESO-New Technology Telescope (NTT), Kaur et al. (2011) was able to prove that VVV J174042.01280725.05 underwent a high luminosity event (of about one magnitude brighter than in the normal luminosity state) about four days after the detection of X-ray flares caught by Swift. This was interpreted as irradiation of the optical star by the X-rays from the compact object (Romano et al., 2016). The optical data were clearly pointing to J17407 being a low-mass X-ray binary (LMXB) rather than an HMXBs, thus excluding the previously proposed association of the source with the SFXT class.
LMXBs are binary systems in which a neutron star (NS) or a black hole accretes matter from a low-mass donor star with a typical mass of 1. The accretion process occurs more commonly via an accretion disc but there is a number of objects where the accretion onto the compact object takes place directly from a stellar wind (see, e.g., Done et al., 2007; Bahramian & Degenaar, 2022, and references therein). LMXBs typically have X-ray luminosities in the range erg s-1, with some sources exhibiting outbursts that can last weeks or months and bursts on top of these, that can increase the luminosity by up to two orders of magnitude for short periods of time ( s). Most LMXBs also show a dramatic X-ray spectral variability, often associated with changes in the mass accretion rate (see, e.g., van der Klis, 2006; van Paradijs, 1998). Romano et al. (2016) ruled out the possibility that J17407 belongs to the subclass of LMXBs called burst-only sources111Burst-only sources show type I bursts during X-ray luminosity states that do not exceed erg s-1. This is at variance with the typical behaviour of other LMXBs, were bursts show up during persistent emission or outbursts brighter than erg s-1 (see, e.g., Cornelisse et al., 2004; Campana, 2009). Type-I bursts are rapid increases in X-ray luminosity caused by thermonuclear explosions that occur on the surface of an accreting NSs in LMXBs. Regarding J17407, the classification as burst-only source was previously proposed by Sguera et al. (2006) as an alternative to the SFXT hypothesis. because the properties of the flares observed from J17407 substantially differ from the so-called type-I bursts typical of the members of this subclass. Based on the X-ray spectral and variability properties of J17407, Romano et al. (2016) also excluded that this object could be a very faint X-ray transient (VFXT), a subclass of LMXBs whose members show faint outbursts with peak X-ray luminosities two-three orders of magnitude lower than those of other LMXBs (in the range erg s-1). About 30% of VFXTs are also known to display type-I bursts (Shaw et al., 2017; King & Wijnands, 2006; Del Santo et al., 2010).
In an attempt to clarify the nature of this object, in this work we report on the remarkable flaring activity detected for the first time from J17407 by NuSTAR during an observation performed in 2022. We also analyse the first source broadband spectrum (0.2-60 keV) obtained by combining the NuSTAR data with a quasi-simultaneous observation carried out with XMM-Newton during the persistent low luminosity state of the source. We discuss the results obtained from the X-ray data in light of the revised classification of J17407 and complement this discussion with a comprehensive investigation of the different spectral type possibilities for the donor star hosted in this system, exploiting archival photometric data.
2 Data analysis
2.1 NuSTAR
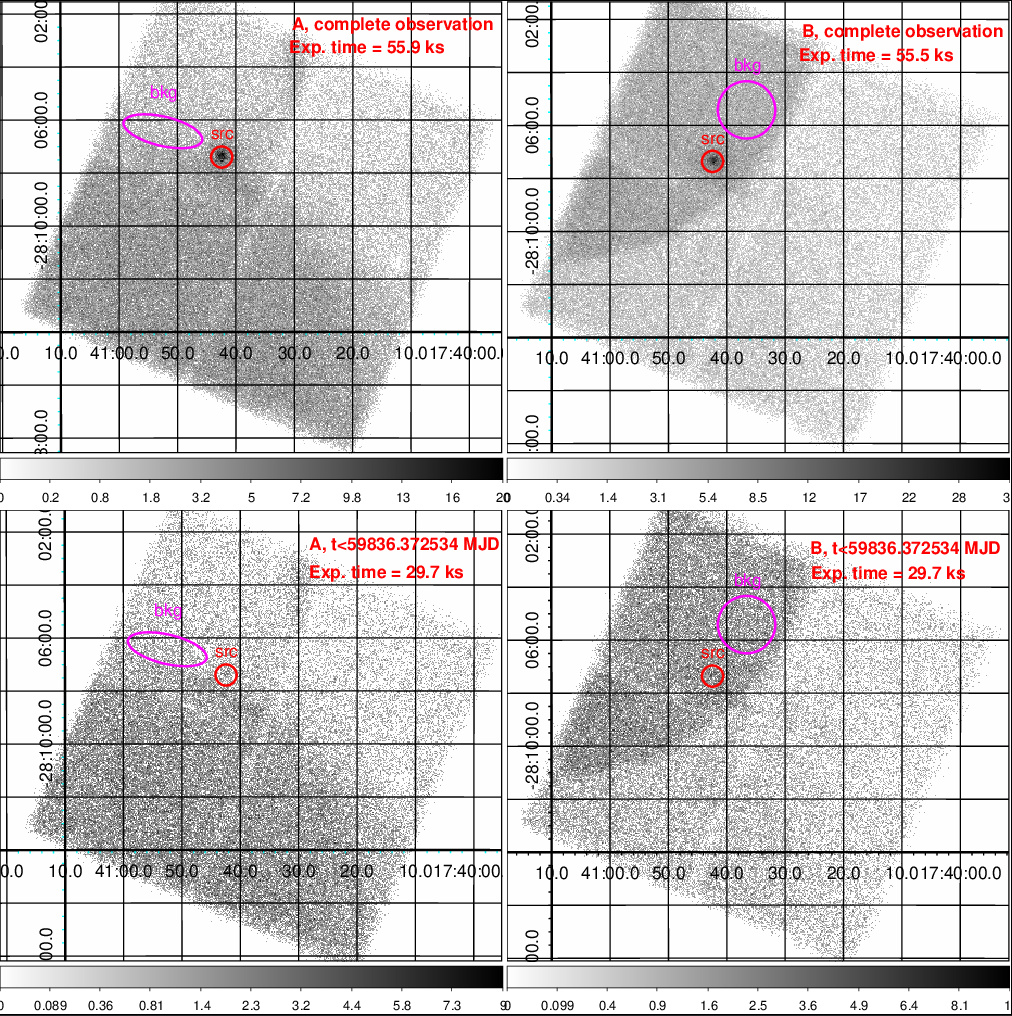
The Nuclear Spectroscopic Telescope Array (NuSTAR) satellite, launched on June 13, 2012, hosts two identical co-aligned telescopes equipped with the focal plane modules FPMA and FPMB, and operates in the 379 keV energy band (Harrison et al., 2013). NuSTAR observed J17407 on 13 and 14 September 2022, for a net exposure time of about 55 ks (see Table 1). We reduced the data using NUSTARDAS v2.1.2 included in HEASOFT v6.30.1 and the calibration files distributed with the CALDB v20221019 (Madsen et al., 2022). For the source, we extracted events from a circular region centered on the source, with a radius of 24′′ for both the FPMA and FPMB. We tested the effect on the final spectral results of different extraction regions for the background. The final prescription adopted to maximize the signal-to-noise ratio (S/N) of the data involved regions located on the same detector of the source (Det-0) but in a zone of the focal plane free from the emission of J17407. As the observation was affected by stray light contaminations, we visually verified that all considered regions for the background extraction were characterised by a level of stray light contamination similar to that affecting the source. In particular, we selected for the FPMA an elliptical extraction region centered on RA: 17:40:52.49, Dec: 28:06:25.6 (J2000), with a major (minor) axis of () and a rotation angle of relative to the RA axis. For the FPMB we instead adopted a circular extraction region centered on RA: 17:40:36.61, Dec: 28:05:25.0, and characterised by a radius of (see Fig. 1).
2.2 XMM-Newton
The X-ray Multi-Mirror Mission (XMM-Newton) was launched on December 10, 1999 (Jansen et al., 2001). It hosts the European Photon Imaging Camera (EPIC) that comprises the pn, Metal Oxide Semi-conductor 1 and 2 (MOS1 and MOS2) CCDs, operating in the 0.212 keV energy band (Strüder et al., 2001; Turner et al., 2001). XMM-Newton observed J17407 on 13 and 14 September 2022 (see Table 1). We reduced the data using the XMM-Newton Science Analysis System (SAS v20.0.0), with the latest calibration files available in the XMM-Newton calibration database (CCF). Calibrated event lists for the pn, MOS1, and MOS2 were obtained from the raw data files exploiting the SAS tasks epproc and emproc. For the pn, we used single- and double-pixel events, while for the MOS data we used single- to quadruple-pixel events. We excluded time intervals were the background was too high to perform a meaningful spectral analysis using standard procedures and criteria222https://www.cosmos.esa.int/web/xmm-newton/sas-thread-epic-filterbackground. The net exposure time obtained for the XMM-Newton observation is reported in Table 1. For each of the pn, MOS1, and MOS2 cameras we extracted the source events using circular regions centered on the best known position of J17407. The radii of these extraction regions were , , and , respectively. These were derived by the SAS task eregionanalyse to maximise the S/N. Background events were accumulated for each of the three cameras using extraction regions not contaminated by the emission from J17407. The extraction regions were a circle for pn (centered on RA:17:40:36.5703, Dec:28:07:32.127 and with a radius of ) and an annulus for both the MOS1 and MOS2 (the annuli were characterised by , for the MOS1 and , for the MOS2). For a better alignment with the NuSTAR spectra, we applied corrections to the effective area of pn, MOS1, and MOS2 spectra in accordance with the CCF Release Note XMM-CCF-REL-388333https://xmmweb.esac.esa.int/docs/documents/CAL-SRN-0388-1-4.pdf.
3 Results
3.1 Variability and timing analysis
Figure 2 shows the background-subtracted NuSTAR light curve in the energy range 360 keV. In the first part of the light curve ( MJD), J17407 is barely detected in FPMB, due to stray light contamination (see Fig. 1). To increase the S/N, for the first part of the light curve we considered only data from FPMA, less affected by the stray light. To bring out the high dynamic range on a short scale experienced by J17407, to reduce as much as possible the bins with upper-limits, and to avoid to smear out the variability of the fast flares, the light curve is binned using the optimal segmentation technique based on the Bayesian block representation described in Scargle et al. (2013). The algorithm proposed by Scargle et al. (2013) splits a list of of photon arrival times into an optimal maximum number of blocks such that within each block the arrival times of the photons can be described by a Poisson distribution from a constant rate, and adjacent blocks are statistically different. We adopted a relatively large false positive rate probability (the probability of erroneously reporting the presence of a change point in the data; it is used to compute the prior on the number of blocks) of , to be sensitive to the fast rate fluctuations displayed by the flares. Once the optimal segmentation of the data was obtained, we calculated, for each bin, the rate and its error using the standard tool for the analysis of NuSTAR data nuproducts. The flux conversion to obtain the right y-axis of Fig. 2 was obtained adopting the spectral model of the low flux state (see Sect. 3.2). Figure 2 shows numerous flares, clustered in a time interval of ks, with a dynamic range up to . The durations of the flares are s, and they can show single or multi-peak structures. The absorbed X-ray luminosity (360 keV) during the first part of the observation, where flares were absent (black points in Fig. 3) is erg s-1 ( is the distance in units of 4 kpc). During the second part (blue points in Fig. 3), the average inter-flare luminosity slightly increases to erg s-1. The maximum luminosity reached by J17407 during the flaring activity (red points in Fig. 3) is erg s-1.
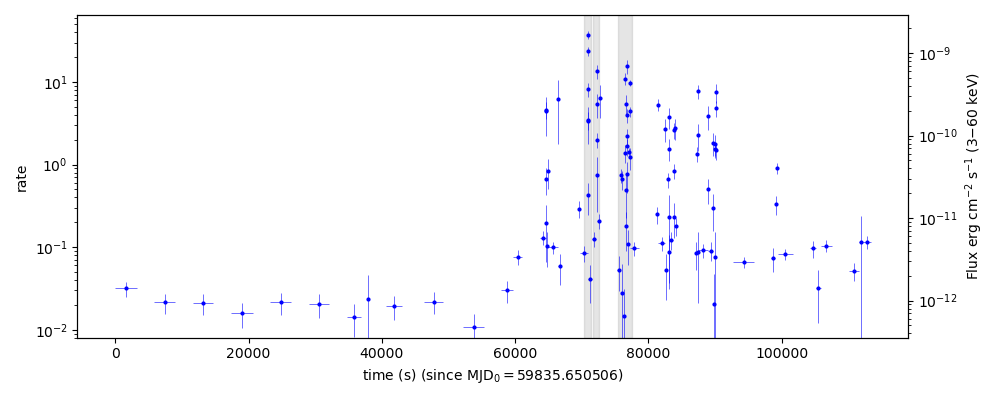
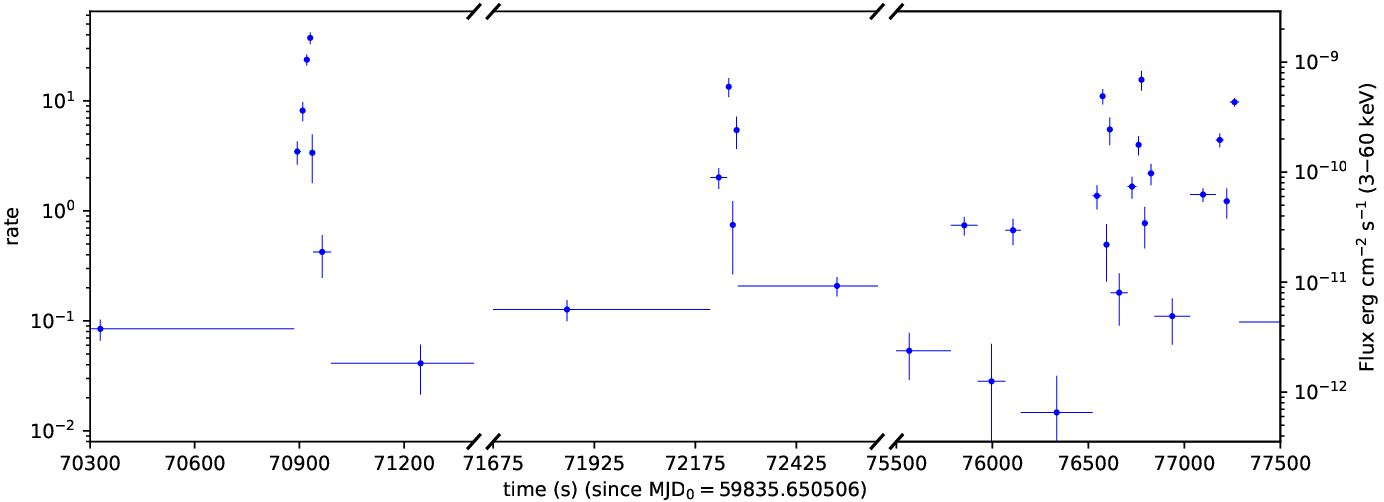
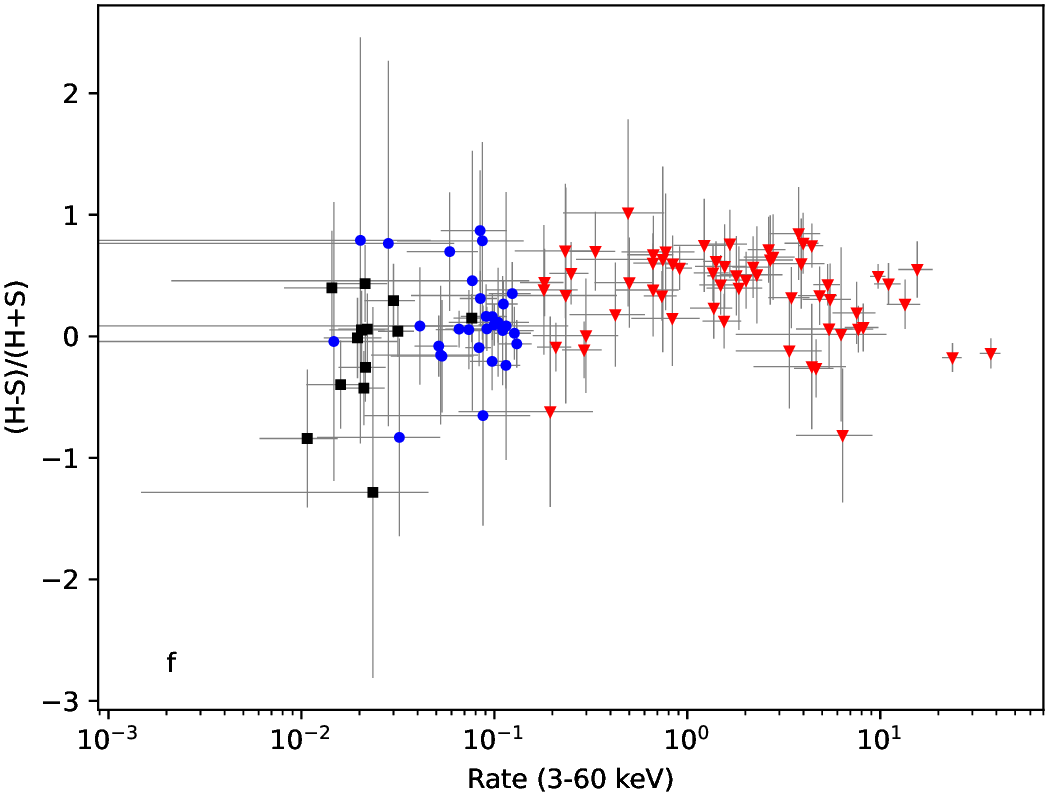
Figure 3 shows the NuSTAR hardness ratios (HRs) as function of time and flux (panel “e”). The hardness ratios are calculated as , where is the rate in the soft energy band keV, is the rate in the hard energy band keV. The boundary at 9 keV is chosen to ensure a similar number of average counts in and . In general, Fig. 3 does not show a dramatic HR variability, although a first visual inspection suggests a possible small variability in panel “f” (i.e., HRs vs flux). A more thorough exploration of the spectral variability is presented in Sect. 3.2.
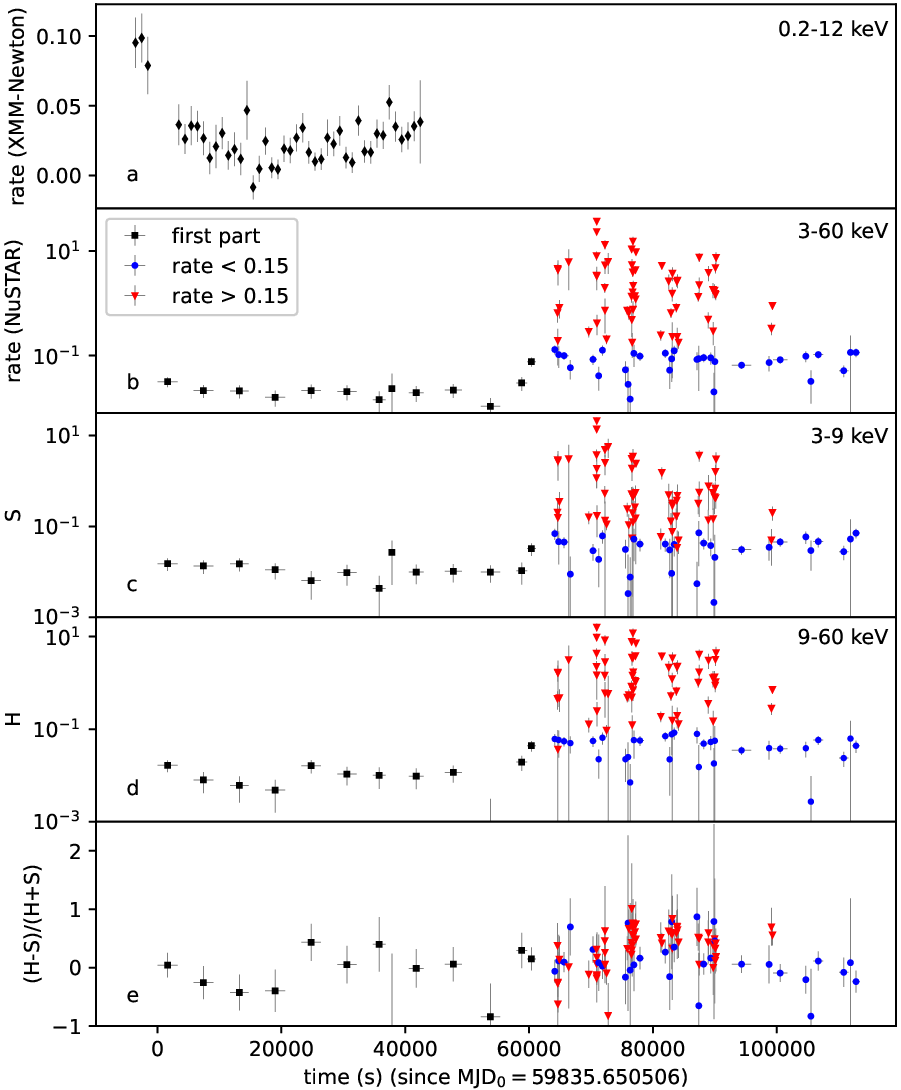
Panel “a” of Fig. 3 shows the background-subtracted XMM-Newton/pn light curve in the energy range 0.212 keV, with a binsize of 1 ks. The HRs based on the XMM-Newton data, in the energy bands 0.2-3 keV and 3-12 keV, do not show significant variability in hardness.
We searched for periodic signals in the 0.312 keV pn events corrected to the solar system barycenter with the barycen SAS task and in the 360 keV NuSTAR events corrected to the solar system barycenter with the barycorr task from ftools, using a Rayleigh test (see, e.g., Buccheri et al. 1983) from 1 to 3 harmonics. No statistically significant pulsations were detected in the frequency range Hz for XMM-Newton/pn and Hz for NuSTAR. We used the approach described in Brazier (1994) to calculate the 3 upper limit on the pulsed fraction of a sinusoidal signal. We found, for XMM-Newton/pn, %, and for NuSTAR, %.
3.2 Spectral analysis
We divided the data in three subsets to search for weak spectral variability not detectable with the hardness ratios. We divided the data using the same scheme shown in Fig. 3:
-
•
1) first part ( MJD), where the flux is low and flares are absent; These data were fitted simultaneously with the XMM-Newton data. (black points in Fig. 3);
-
•
2) low: inter-flares emission (rate¡0.15) observed by NuSTAR after MJD (blue points in Fig. 3);
-
•
3) high: flares (rate¿0.15) observed by NuSTAR after MJD (red points in Fig. 3).
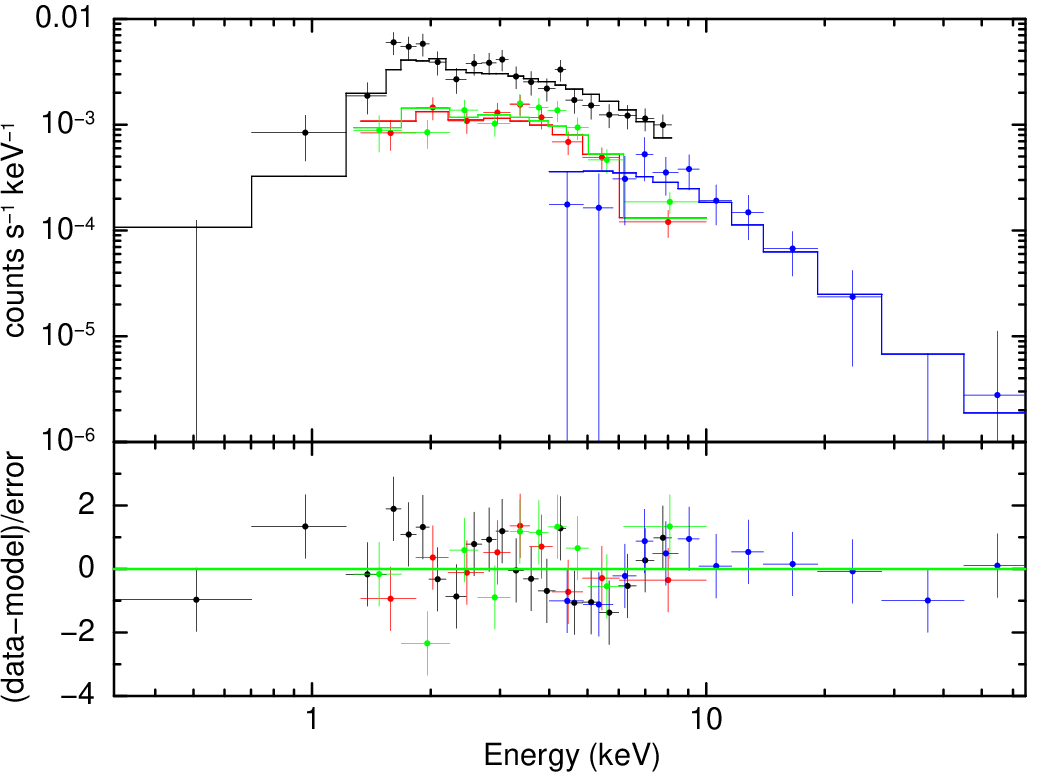
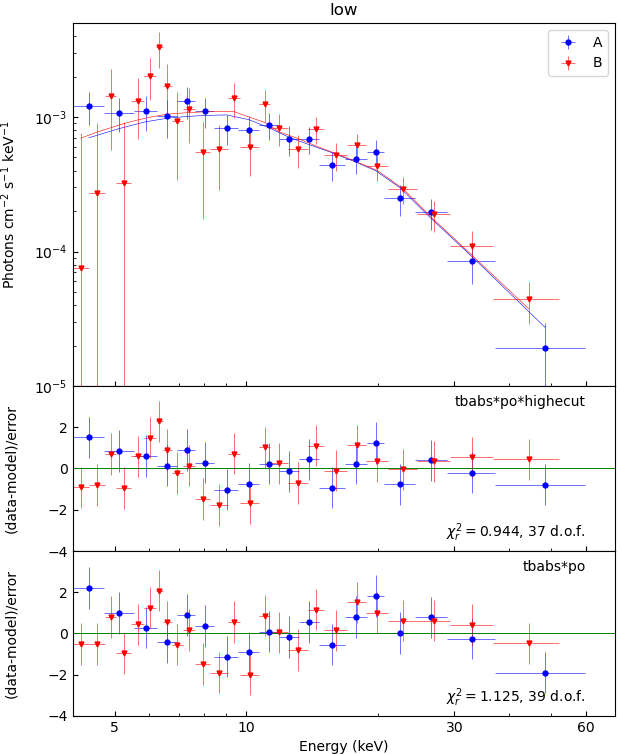
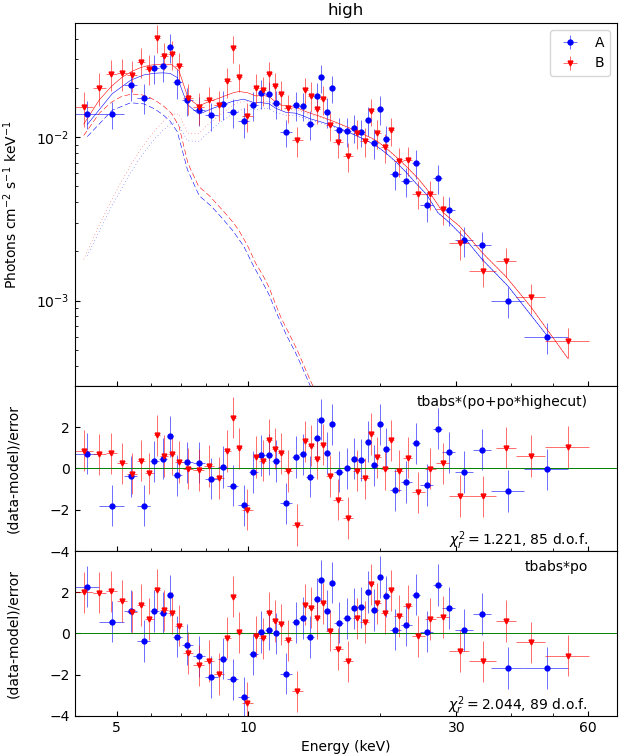
NuSTAR and XMM-Newton spectra were rebinned so as to have at least 25 counts per bin to enable the use of statistic as a fit statistic. Renormalization constant factors were included in the spectral fitting to account for intercalibration uncertainties between instruments. We used the tbabs model and the interstellar medium abundances wilm in XSPEC444XSPEC version 12.12.1c; (Arnaud, 1996). to model the photoelectric absorption (Wilms et al., 2000). Errors on spectral fit parameters indicate 1 confidence level throughout the paper. We fitted the spectra with different models. In the following, we concentrate on the simplest phenomenological models that provide a reasonably good fit. The best-fit models and parameters are reported in Table 2. The corresponding spectra and residuals are shown in Figures 4, 5, and 6. For the first part, we obtained a good fit with an absorbed power law (, 46 d.o.f.). For the low state, the same model gives an acceptable fit (, 39 d.o.f.), although we obtained a slightly better fit with an absorbed power law with high-energy cutoff (, 37 d.o.f.). For the high state, to model residuals at keV (see bottom panel of Fig. 6), it is necessary to employ a more complex model. We obtained the best fits with an absorbed power law with a Gaussian in absorption keV (, 86 d.o.f.), or a power law with high energy cutoff plus a steep power law, both components absorbed (, 85 d.o.f.). For the high state, we evaluated the chance probability of improvement of the fit by adding the high energy cutoff, simulating data sets with the simftest routine of XSPEC. We find that the probability that data are consistent with a model without the high energy cutoff component is 0.30%. The best fit model obtained for the high state data applied to the low state555All spectral parameters frozen, except for the normalization of the first power law, and the ratio of the normalization of the second power law with respect to the first one. gives , 41 d.o.f. Therefore, the relatively low statistic of the low state spectrum does not allow to determine if there is a spectral variability between these two flux states. A similar fit applied to the first part of the data gives an unacceptable fit, even if the column density is free (, 48 d.o.f.). Vice versa, the best fit model obtained for the first part of the data applied to the low state666All spectral parameters frozen, except for the normalization of the power law. gives an acceptable fit only if the column density is free (, 40 d.o.f.). However, the absorption column density we obtain, cm-2, seems too high, compared to the typical values in this source and other typical X-ray binaries. A similar fit applied to the high state gives an unacceptable , 90 d.o.f., and a very high cm-2. Therefore, it seems that there is a significant spectral variability, especially driven by the increase of the column density, between the first and second (low and high) part.
The low state spectrum from module B shows an emission feature at keV, which could be an iron line (Fig. 5). To understand if it is necessary to add a Gaussian component to model it, we rebinned the spectra of module A and B to have a minimum of 1 count per bin and we used the W statistic (Wachter et al., 1979; Cash, 1979) to find the best fit. Then, we evaluated the chance probability of improvement of the fit by adding this component simulating data sets with the simftest routine of XSPEC. We find that the probability that the data are consistent with a model without the Gaussian component is 0.13 %. Therefore, the hypothesis of the absence of an iron line cannot be rejected at a 4 confidence level.
| First part | |||
| Parameters | Model Aa | ||
| ( cm-2) | |||
| normpow | |||
| constant (MOS1 wrt pn) | |||
| constant (MOS2 wrt pn) | |||
| constant (NuSTAR-A wrt pn) | |||
| (d.o.f.) | 44.31 (46) | ||
| Null hypothesis prob. | 0.543 | ||
| (erg cm-2 s-1) | |||
| (erg cm-2 s-1) | |||
| low | |||
| Parameters | Model Aa | Model Bb | |
| ( cm-2) | (3) | ||
| normpow | |||
| (keV) | |||
| (keV) | |||
| constant (B wrt A) | |||
| (d.o.f.) | 43.87 (39) | 34.92 (37) | |
| Null hypothesis prob. | 0.273 | 0.567 | |
| (erg cm-2 s-1) | |||
| high | |||
| Parameters | Model Cc | Model Dd | Model Ee |
| ( cm-2) | |||
| normpow1 | |||
| (keV) | |||
| (keV) | |||
| (keV) | |||
| (keV) | |||
| Strengthgabs | |||
| normpow2 | |||
| constant (B wrt A) | |||
| (d.o.f.) | 106.62 (86) | 116.91 (87) | 103.79 (85) |
| Null hypothesis prob. | 0.0653 | 0.0180 | 0.0812 |
| (erg cm-2 s-1) | |||
Notes. Errors are at 1 confidence level. Fluxes are absorbed. a: const*tbabs*po; b: const*tbabs*po*highecut; c: const*tbabs*po*gabs; d: const*tbabs*(po + po); e: const*tbabs*(po*highecut +po).
4 Optical counterpart
We assessed the nature of the donor star in J17407 by using photometric measurements of VVV J174042.01280725.05, based on the Panoramic Survey Telescope and Rapid Response System (Pan-STARRS) catalogue (Chambers et al., 2016) and on the VVV Survey. The survey consists of images in five bands obtained by the VISTA InfraRed CAMera (VIRCAM) that equips the VISTA, a 4 m telescope specialized in wide field surveys. The photometric information used to build the Spectral Energy Distribution (SED) of VVV J174042.01280725.05 is reported in Table 3. The star is very faint and no Gaia DR3 counterpart is catalogued within the VISTA error region (Greiss et al., 2011; Vallenari et al., 2022). Given the small number of points available in the SED, we fitted it with a simple absorbed blackbody model, which is in first approximation a reasonable model to describe the optical/near-infrared spectrum from a star:
| (1) |
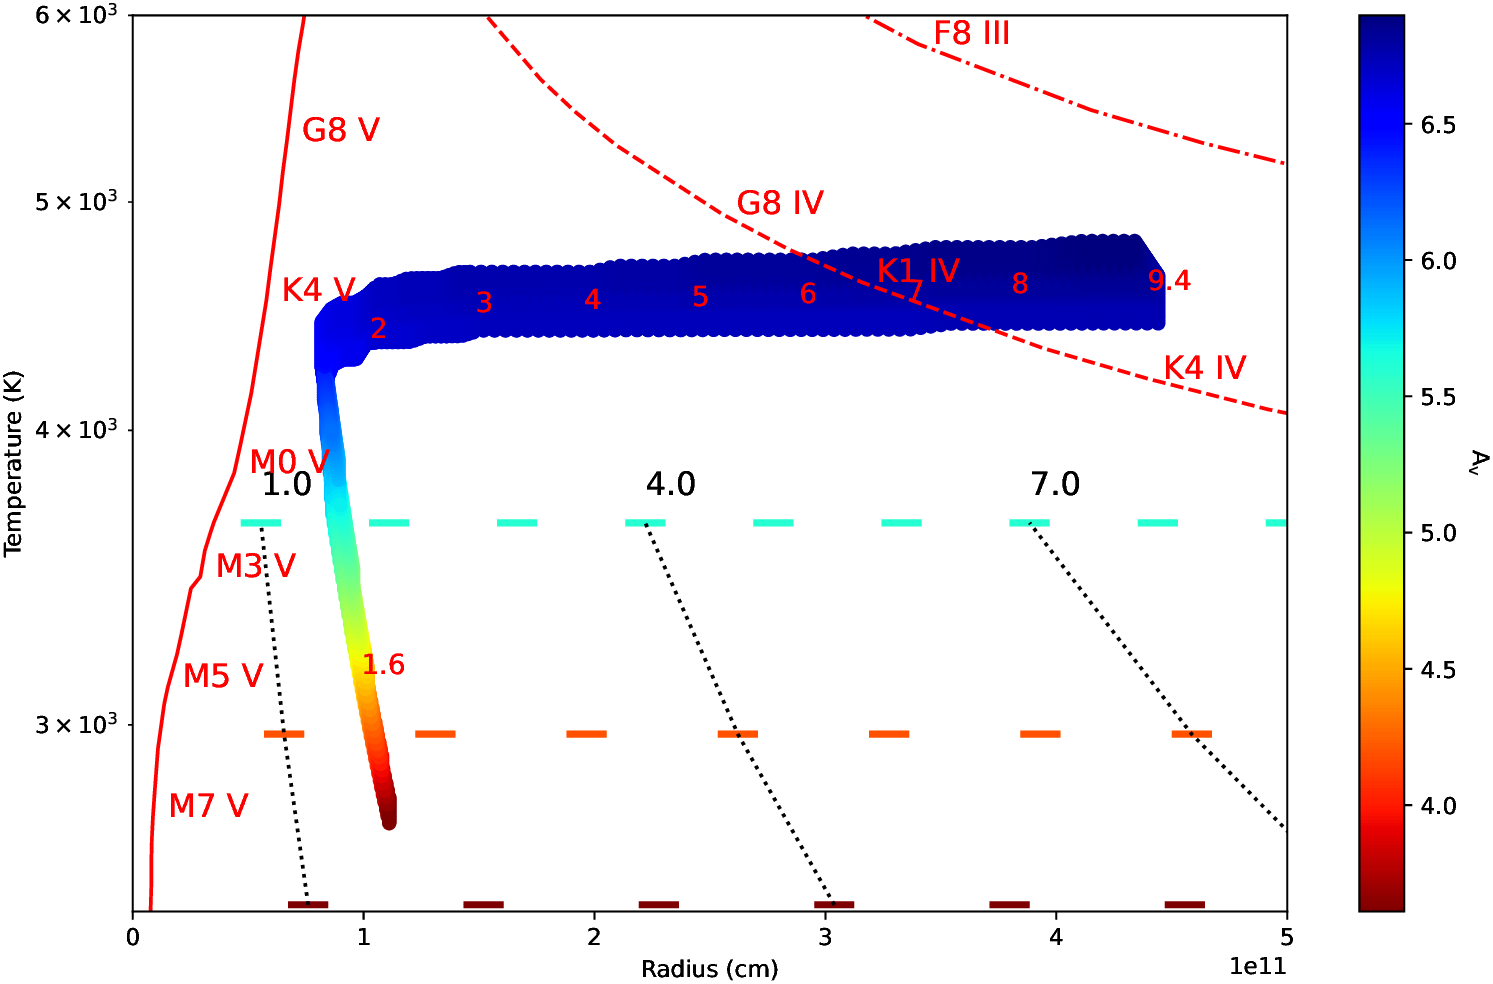
is the effective temperature of the star, its radius, is the distance from the Sun, and is the absorption for the wavelength . We calculated for each reported777taken from the VizieR Photometry viewer: http://vizier.cds.unistra.fr/vizier/sed/ in Table 3 by using the analytical expression of Cardelli et al. (1989) and O’Donnell (1994), and assuming . A close look at Eq. 1 shows a degeneracy between parameters and . In addition, due to the limited number of points of our SED, there is also some degeneracy between and . Therefore, only two parameters out of four can be constrained simultaneously. To overcome these limitations, we have taken two approaches. First, we fitted the SED with Eq. 1 for assumed distances in the range 1-30 kpc, with steps of 1 kpc, and we also fixed the extinction assuming the lowest absorption column density value. That was measured in a XMM-Newton observation carried out on 6 March 2016 (obsid: 0764191301). The value of reported in (Romano et al., 2016) ( cm-2, 90% c.l. unertainties) was based on the use of phabs absorption model in XSPEC, with the abundance of elements by Anders & Grevesse (1989). In environments with high column density, these choices for the absorption model and abundances could give significantly different results compared to using the tbabs model with wilm abundances. Therefore, we re-analysed these data, using SAS 20.0, and tbabs with wilm abundances, coherently with our analysis method described in Sections 2.2 and 3.2. We obtain cm-2 (1 c.l.). We converted to using the relation given in Foight et al. (2016). The best fit parameters and are displayed in Fig. 7: they consist of three horizontal lines, for the mean, upper, and lower limits of (given the uncertainties on ). A grid of distances in black colours is overplotted. The colours of these horizontal lines follow the scheme of the colour bar. The best-fit values of and obtained with this method have ranging from 1.19 to 2.18, with (8 d.o.f.) for the solutions corresponding to ( cm-2; horizontal line with orange colour in Fig. 7). This method does not take into account that increases with and, consequently, solutions for many of the assumed distances are obviously wrong. Therefore, we adopted a second approach, in which is a function of . We used the directional 3D maps of interstellar dust reddening and extinction bayestar2019, based on Gaia, Pan-STARRS 1, and Two Micron All Sky Survey (2MASS) (Green et al., 2019). Reddening were converted to using the appropriate conversion described in Green et al. (2019)888see also: http://argonaut.skymaps.info/usage, and adopting the 5-95% percentile boundaries. The range of reliable distances of these maps in the direction of our target is kpc999Obtained using dustmaps, (Green, 2018).. The best fit parameters and for different values of and are shown in Fig. 7 (“” shape). The distances are overplotted in red colours. Figure 7 also shows the most relevant spectral classes for our analysis, taken from de Jager & Nieuwenhuijzen (1987) and Pecaut & Mamajek (2013). All the best fit parameters obtained with the second method and shown in Fig. 7 are from fits that give . We obtain the best fits (), for a star at a distance kpc, with temperature K and radius cm. These values of and and those obtained assuming (based on the lowest cm-2 from X-ray observations) correspond to a quite peculiar K7-M7 sub-subgiant type star. The coloured area in Fig. 7 shows that other classifications are possible, indicating that the spectral type of the donor star of J17407 is poorly constrained. It is important to point out that the spectral classification study presented here is to be taken with due caution. We recall that the near-infrared variability observed by Kaur et al. (2011) could indicate that at least in some occasions (when the source is brighter) there is a significant contribution to the observed near-infrared emission produced by the reprocessing of the X-ray emission from the compact object on an accretion disc (whose presence is not certain) or on the surface of the companion star (Romano et al., 2016). If this is the case, considering the magnitude values when the system is faint should have minimised the impact of reprocessing on the optical near-infrared emission. Nevertheless, should this still be present, it would mean that the donor star of J17407 is even weaker than has been measured, further supporting the LMXB scenario with a particularly light and small donor star. Due to the lack of measurements of the fundamental parameters of the system, above all its distance from the Sun and the orbital separation, it is not possible to unambiguously quantify the contribution of reprocessing to the observed emission, and therefore it is not possible to determine whether this significantly affects the result reported in this paper.
| wavelength | flux | eflux | filter | catalogue | Referencea |
|---|---|---|---|---|---|
| (Jy) | (Jy) | ||||
| 0.748 | 14.2 | 0.7b | i | Pan-STARRS | 1 |
| 0.876 | 55.9 | 10.2 | Z | VISTA | 2 |
| 1.02 | 113 | 21 | Y | VISTA | 2 |
| 1.25 | 273 | 38 | J | VISTA | 2 |
| 1.25 | 283 | 37 | J | VVV | 3 |
| 1.63 | 429 | 71 | H | VISTA | 2 |
| 1.63 | 436 | 67 | H | VVV | 3 |
| 2.13 | 442 | 76 | Ks | VISTA | 2 |
| 2.19 | 413 | 13 | K | VIRAC | 4 |
| 2.19 | 429 | 68 | K | VVV | 3 |
c90ptb38pt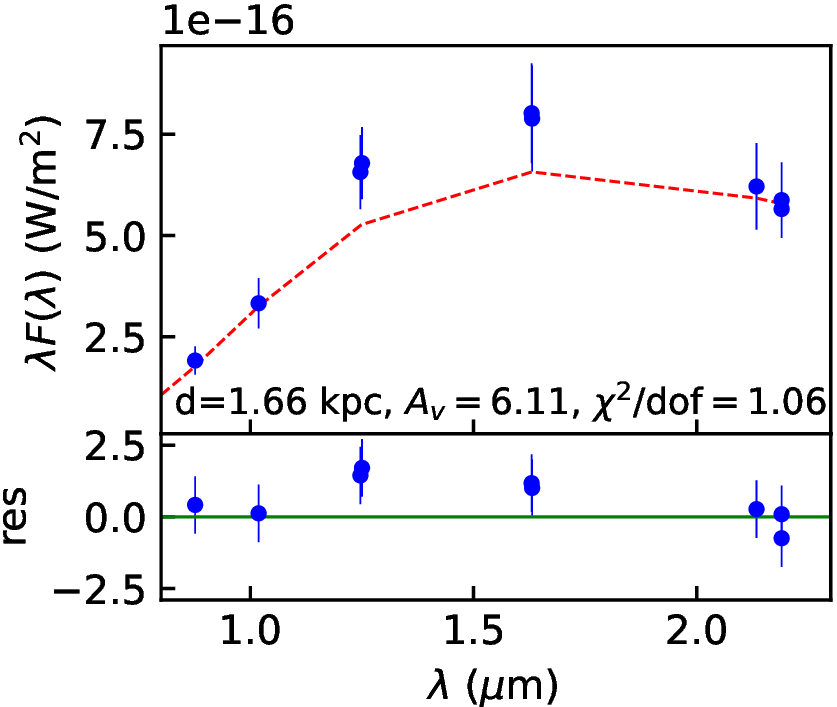
5 Discussion
NuSTAR detected J17407 in a flaring state characterised by a variability as large as three orders of magnitude on time scales of a few tens of seconds. If we consider the lowest and highest fluxes measured for this source since its discovery, they span more than four orders of magnitude.
In Sect. 3 we showed that one of the possible spectral models adopted to describe the source emission during the flaring period is a power law subjected to a large extinction at the lower energies (3 keV) due to a high column density and featuring a Gaussian absorption feature centered at keV. Similar absorption features are often detected in the X-ray spectra of accreting NSs and widely interpreted as cyclotron resonant scattering features (CRSFs; also collectively termed “cyclotron lines”). CRSFs provide a direct measurement of the NS magnetic field strength close to the surface of the compact object through the simple relation keV (see, e.g., Staubert et al., 2019, for a recent review). We would thus obtain for the case of J17407 a magnetic field of G. If confirmed by future observations, this would imply that J17407 hosts a NS with a relatively strong magnetic field, uncommon in LMXBs (but see, e.g., the cases of GRO J1744-28 and 4U 1822-371 for examples of strongly magnetized NSs in LMXBs, as well as the cases of IGR J17329-2731 and 4U 1700+24 for strongly magnetized NSs in SyXBs; D’Aì et al., 2015; Anitra et al., 2021; Jonker et al., 2003; Bozzo et al., 2018, 2022b). Note that, as discussed in Sect. 3.2, the available NuSTAR data on J17407 can also be successfully fit with alternative models that do not comprise a CRSF. Therefore, the presence of this absorption component and the derivation of a putative NS magnetic field estimate have to be taken with caution (and possibly confirmed by future observations). The spectral analysis shows also a weak hardening and increase of between the first part of the observation, where the flaring activity is absent, and the second part. The increase in the absorption might reflect an increase of the gravitationally captured mass by the compact object. The hardening could be ascribed to a more efficient Inverse Compton scattering of the soft X-ray photons emitted in the vicinity of the compact object by the increasing number of accreting electrons.
Our current limited knowledge on fundamental characteristics of the stellar components hosted in J17407, such as the orbital period, distance between the two stars, eventual spin period and magnetic field strength of the compact object, prevents us from adopting a quantitative approach to determine the real nature of this source and the accretion mechanisms triggering its X-ray variability. From the X-ray spectral point of view, the NuSTAR and XMM-Newton data would be qualitatively compatible with what is expected from accreting pulsars with high magnetic field ( G; e.g. Kretschmar et al. 2019). In the following, we thus discuss the similarities and differences between the properties of the X-ray variability shown by J17407 with those from the other binary systems, specifically those hosting strongly magnetized NSs. Nevertheless, we are not excluding a priori that the compact object could be a black hole.
With the available photometric data, the spectral type of the optical counterpart is poorly constrained. We showed in Sect. 4 that, among the other possibilities, J17407 could belong to the class of symbiotic stars, with the donor star being a peculiar M-type sub-subgiant star. Although symbiotic stars show X-ray flares, these are longer than in J17407 (for example, for GX 14 days, and for 3A 1954319101010whose donor star is an M supergiant, (Bozzo et al., 2022a, and references therein). s), and the dynamic range is smaller (; Corbet et al. 2008; Bozzo et al. 2022a).
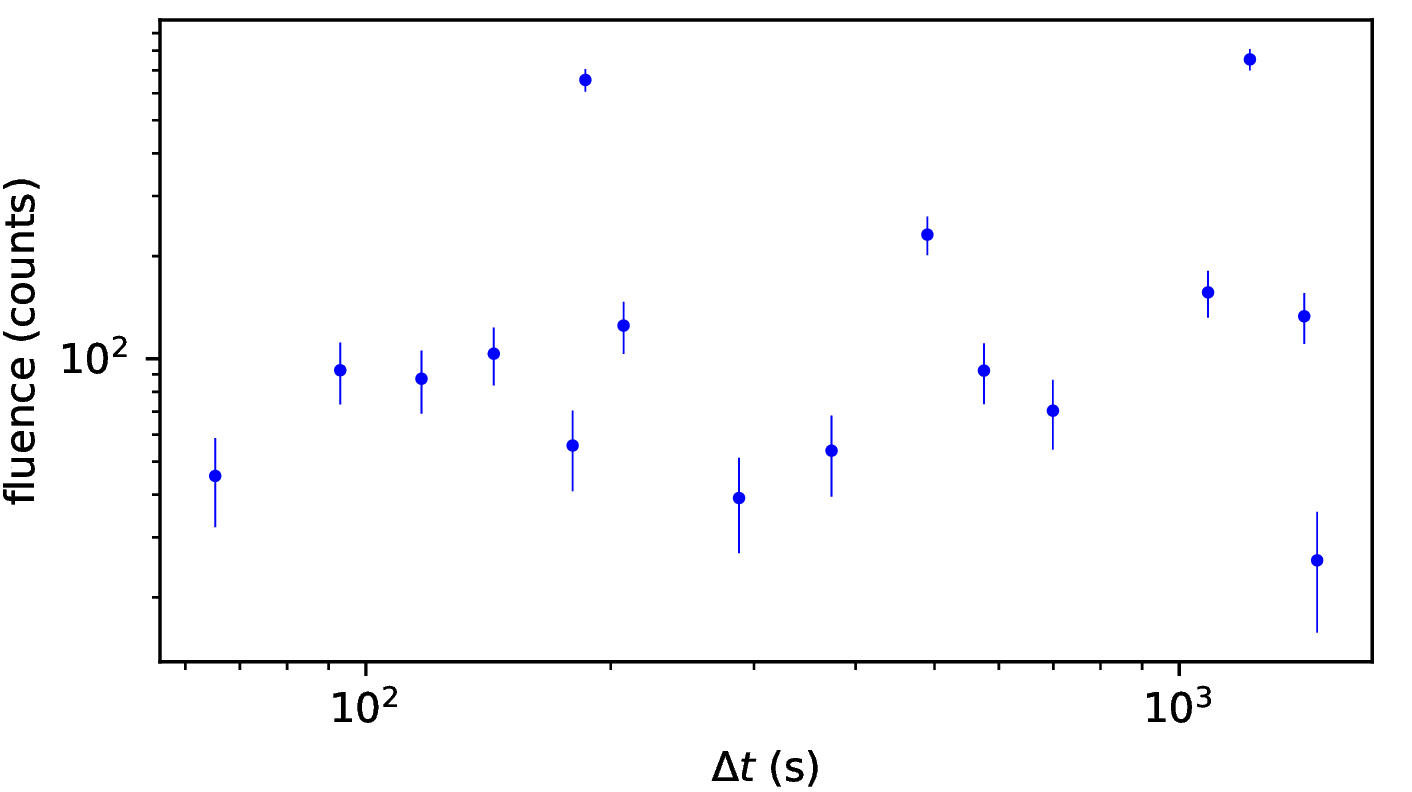
Our study (Sect. 4) and the previous classification of the optical counterpart (Greiss et al., 2011; Kaur et al., 2011) suggest that J17407 might be a LMXB, with M, F, or G type star, from main sequence to giant. Among LMXBs, some accreting millisecond pulsars (AMXP; see, e.g., Papitto et al. 2020) show flares with the same durations of those displayed by J17407, but their dynamic range () is lower than that observed in J17407 (see, for example the case of the “hiccup” accretion in IGR J182452452, Ferrigno et al. 2014). Other X-ray binaries showing similar flares are the LMXBs “Bursting Pulsar” GRO J174428, the “Rapid Burster” MXB 1730335, and the HMXB SMC X1 (see, e.g., Bagnoli et al., 2015; Court et al., 2018; Rai et al., 2018, and references therein). They exhibit type-II bursts, which typically last for a few tens of seconds (there are, however, some exceptions; see references above). Generally they are single peaked (although, in some cases, they show more complex structures) and there is no evidence of significant spectral variability between the persistent and the flaring states. At odds with J17407, these three sources show type-II bursts only during bright luminosity states where the persistent X-ray luminosity is erg s-1 and the dynamic range of the flares is (e.g. Bagnoli et al., 2015; Giles et al., 1996; Sazonov et al., 1997). Different models have been proposed to explain the type-II bursts. Among them, those that can also explain why the other NS LMXBs do not show these bursts belong to the family of the trapped disc models (Spruit & Taam, 1993; D’Angelo & Spruit, 2010, 2012; van den Eijnden et al., 2017). In this model, for some specific values of the magnetic field strength and mass capture rate ( G, roughly %% of the Eddington rate), the interaction between the inner region of the accretion disc and the magnetospheric boundary of the pulsar may interrupt the continuous flow and produce a cycle of accretion events (bursts). The fluence of the type-II bursts in the Rapid Burster is proportional to the waiting time to the following burst (Lewin et al., 1976). This is not observed in the Bursting Pulsar Kouveliotou et al. (1996) and, to the best of our knowledge, in SMC X-1. In Fig. 8 we checked if this is also the case for J17407, but we did not find any significant correlation between the fluence and the waiting time. For this calculations, we considered only flares and waiting times not interrupted by the regular gaps that characterise the NuSTAR observation, where other flares may have occurred.
J17407 shows some striking similarities with the LMXBs Swift J1858.60814, V404 Cygni, and V4641 Sgr. These sources show flares spanning few orders of magnitude () on timescales of s (see, e.g., Ludlam et al., 2018; Hare et al., 2020; Wijnands & van der Klis, 2000; Rodriguez et al., 2015). V404 Cygni and V4641 Sgr host BHs, while the compact object in Swift J1858.60814 was identified to be a NS, thanks to the detection of some type I X-ray bursts (Buisson et al., 2020). Despite these similarities, these sources show the flaring activity on top of longer (weeks to months) X-ray outbursts, and the flares show a remarkable spectral variability in the X-ray spectrum, at odds with J17407.
The fast and strong variability of J17407 is also reminiscent of that observed by XMM-Newton from the Be/XRBs A053866 in 2018. This binary system, located in the Large Magellanic Cloud, hosts a ms pulsar orbiting around a Be star in days, in a highly eccentric orbit (; Ducci et al. 2022; Rajoelimanana et al. 2017). During the XMM-Newton observations of 2018, A053866 showed X-ray flares with durations between 5 and 50 seconds, and peak X-ray luminosity up to erg s-1 (0.210 keV). Between the flares, the luminosity was erg s-1. Therefore, the dynamic range and flare durations of J17407 and A053866 are consistent, while the luminosities of J17407 are times lower than in A053866, assuming kpc. Another similarity between these two sources is that the flares of both show a single-peak or multi-peak structure. To explain the X-ray variability of A053866 observed by XMM-Newton in 2018, different plausible mechanism were considered. In particular, a gating mechanism in a regime of spherically symmetric inflow was explored in detail. In the proposed scenario, the observed X-ray variability is linked to fast transitions between accretion and supersonic propeller regimes (Ducci et al., 2019b). These accretion regimes and the transitions between them occur under particular conditions, which are mainly driven by the spin period of the pulsar, its magnetic field strength, and the rate of the mass it gravitationally captures (Davies & Pringle, 1981; Bozzo et al., 2008). In the introduction, we reported about an optical brightening of about 1 magnitude in J17407 (Kaur et al., 2011). Notably, A053866 also shows fast and bright optical flares ( d, ; rarely up to ; Ducci et al. 2016 and references therein). They were explained with reprocessing of the X-ray photons from the accreting pulsar in a cloud surrounding the binary system, and it was also pointed out that it was possible to have a non-negligible contribution to the optical brightening caused by the heating of the surface of the companion star irradiated by the X-ray pulsar (Ducci et al., 2019a).
6 Conclusions
We have reported the results of quasi-simultaneous NuSTAR and XMM-Newton observations of J17407. These show an astonishing variability, whose properties are so extreme to be difficult to explain by known accretion mechanisms applied to other accreting binary systems. We have shown that the variability of J17407 shows some similarities (and also substantial differences) with a few LXMBs, in particular Swift J1858.60814, and a remarkable similarity with A053866, which, however, is an HMXB. The uniqueness of the X-ray flashes displayed by J17407 requires further observations in the X-ray, optical, and infrared bands, to unveil the nature of the stars of the system and to determine the mechanism that causes its X-ray variability. In particular, future spectroscopic observations in optical near-infrared are fundamental to constrain the properties of the donor star.
Acknowledgements.
We thank the anonymous referee for constructive comments that helped to improve the paper. LD acknowledges Dr. Marilena Caramazza and Dr. Dante Minniti for their helpful suggestions. PR and EB acknowledge financial contribution from the agreement ASI-INAF I/037/12/0. This research has made use of the NuSTAR Data Analysis Software (NuSTARDAS) jointly developed by the ASI Space Science Data Center (SSDC, Italy) and the California Institute of Technology (Caltech, USA). Based on observations obtained with XMM-Newton, an ESA science mission with instruments and contributions directly funded by ESA Member States and NASA. Part of the data analysis was performed using stingray, an open source spectral-timing Python software package for astrophysical data analysis (Bachetti et al., 2022; Huppenkothen et al., 2019, 2019). This work made use of Astropy: http://www.astropy.org a community-developed core Python package and an ecosystem of tools and resources for astronomy (Astropy Collaboration et al., 2013, 2018, 2022). It also made use of dustmaps, a unified interface for several 2D and 3D maps of interstellar dust reddening and extinction (Green, 2018). This research has made use of the VizieR catalogue access tool, CDS, Strasbourg, France.References
- Anders & Grevesse (1989) Anders, E. & Grevesse, N. 1989, Geochim. Cosmochim. Acta., 53, 197
- Anitra et al. (2021) Anitra, A., Di Salvo, T., Iaria, R., et al. 2021, A&A, 654, A160
- Arnaud (1996) Arnaud, K. A. 1996, in Astronomical Society of the Pacific Conference Series, Vol. 101, Astronomical Data Analysis Software and Systems V, ed. G. H. Jacoby & J. Barnes, 17
- Astropy Collaboration et al. (2022) Astropy Collaboration, Price-Whelan, A. M., Lim, P. L., et al. 2022, apj, 935, 167
- Astropy Collaboration et al. (2018) Astropy Collaboration, Price-Whelan, A. M., Sipőcz, B. M., et al. 2018, AJ, 156, 123
- Astropy Collaboration et al. (2013) Astropy Collaboration, Robitaille, T. P., Tollerud, E. J., et al. 2013, A&A, 558, A33
- Bachetti et al. (2022) Bachetti, M., Huppenkothen, D., Khan, U., et al. 2022, StingraySoftware/stingray: v1.1
- Bagnoli et al. (2015) Bagnoli, T., in’t Zand, J. J. M., D’Angelo, C. R., & Galloway, D. K. 2015, MNRAS, 449, 268
- Bahramian & Degenaar (2022) Bahramian, A. & Degenaar, N. 2022, arXiv e-prints, arXiv:2206.10053
- Bozzo et al. (2018) Bozzo, E., Bahramian, A., Ferrigno, C., et al. 2018, A&A, 613, A22
- Bozzo et al. (2008) Bozzo, E., Falanga, M., & Stella, L. 2008, ApJ, 683, 1031
- Bozzo et al. (2022a) Bozzo, E., Ferrigno, C., Oskinova, L., & Ducci, L. 2022a, MNRAS, 510, 4645
- Bozzo et al. (2022b) Bozzo, E., Romano, P., Ferrigno, C., & Oskinova, L. 2022b, MNRAS, 513, 42
- Brazier (1994) Brazier, K. T. S. 1994, MNRAS, 268, 709
- Buccheri et al. (1983) Buccheri, R., Bennett, K., Bignami, G. F., et al. 1983, A&A, 128, 245
- Buisson et al. (2020) Buisson, D. J. K., Altamirano, D., Bult, P., et al. 2020, MNRAS, 499, 793
- Campana (2009) Campana, S. 2009, ApJ, 699, 1144
- Cardelli et al. (1989) Cardelli, J. A., Clayton, G. C., & Mathis, J. S. 1989, ApJ, 345, 245
- Cash (1979) Cash, W. 1979, ApJ, 228, 939
- Chambers et al. (2016) Chambers, K. C., Magnier, E. A., Metcalfe, N., et al. 2016, arXiv e-prints, arXiv:1612.05560
- Corbet et al. (2008) Corbet, R. H. D., Sokoloski, J. L., Mukai, K., Markwardt, C. B., & Tueller, J. 2008, ApJ, 675, 1424
- Cornelisse et al. (2004) Cornelisse, R., in’t Zand, J. J. M., Kuulkers, E., et al. 2004, Nuclear Physics B Proceedings Supplements, 132, 518
- Court et al. (2018) Court, J. M. C., Altamirano, D., Albayati, A. C., et al. 2018, MNRAS, 481, 2273
- D’Aì et al. (2015) D’Aì, A., Di Salvo, T., Iaria, R., et al. 2015, MNRAS, 449, 4288
- D’Angelo & Spruit (2010) D’Angelo, C. R. & Spruit, H. C. 2010, MNRAS, 406, 1208
- D’Angelo & Spruit (2012) D’Angelo, C. R. & Spruit, H. C. 2012, MNRAS, 420, 416
- Davies & Pringle (1981) Davies, R. E. & Pringle, J. E. 1981, MNRAS, 196, 209
- de Jager & Nieuwenhuijzen (1987) de Jager, C. & Nieuwenhuijzen, H. 1987, A&A, 177, 217
- Del Santo et al. (2010) Del Santo, M., Sidoli, L., Romano, P., et al. 2010, MNRAS, 403, L89
- Done et al. (2007) Done, C., Gierliński, M., & Kubota, A. 2007, A&A Rev., 15, 1
- Ducci et al. (2016) Ducci, L., Covino, S., Doroshenko, V., et al. 2016, A&A, 595, A103
- Ducci et al. (2019a) Ducci, L., Mereghetti, S., Hryniewicz, K., Santangelo, A., & Romano, P. 2019a, A&A, 624, A9
- Ducci et al. (2019b) Ducci, L., Mereghetti, S., & Santangelo, A. 2019b, ApJ, 881, L17
- Ducci et al. (2022) Ducci, L., Mereghetti, S., Santangelo, A., et al. 2022, A&A, 661, A22
- Ducci et al. (2010) Ducci, L., Sidoli, L., & Paizis, A. 2010, MNRAS, 408, 1540
- Ferrigno et al. (2014) Ferrigno, C., Bozzo, E., Papitto, A., et al. 2014, A&A, 567, A77
- Foight et al. (2016) Foight, D. R., Güver, T., Özel, F., & Slane, P. O. 2016, ApJ, 826, 66
- Giles et al. (1996) Giles, A. B., Swank, J. H., Jahoda, K., et al. 1996, ApJ, 469, L25
- Gonzalez et al. (2011) Gonzalez, O. A., Rejkuba, M., Zoccali, M., Valenti, E., & Minniti, D. 2011, A&A, 534, A3
- Götz et al. (2004) Götz, D., Mereghetti, S., Mowlavi, N., & Soldan, J. 2004, GRB Coordinates Network, 2793, 1
- Grebenev & Sunyaev (2007) Grebenev, S. A. & Sunyaev, R. A. 2007, Astronomy Letters, 33, 149
- Green (2018) Green, G. 2018, The Journal of Open Source Software, 3, 695
- Green et al. (2019) Green, G. M., Schlafly, E., Zucker, C., Speagle, J. S., & Finkbeiner, D. 2019, ApJ, 887, 93
- Greiss et al. (2011) Greiss, S., Steeghs, D., Maccarone, T., et al. 2011, The Astronomer’s Telegram, 3688, 1
- Hare et al. (2020) Hare, J., Tomsick, J. A., Buisson, D. J. K., et al. 2020, ApJ, 890, 57
- Harrison et al. (2013) Harrison, F. A., Craig, W. W., Christensen, F. E., et al. 2013, ApJ, 770, 103
- Heinke et al. (2009) Heinke, C. O., Tomsick, J. A., Yusef-Zadeh, F., & Grindlay, J. E. 2009, ApJ, 701, 1627
- Herpich et al. (2021) Herpich, F. R., Ferreira Lopes, C. E., Saito, R. K., et al. 2021, A&A, 647, A169
- Huppenkothen et al. (2019) Huppenkothen, D., Bachetti, M., Stevens, A. L., et al. 2019, ApJ, 881, 39
- Huppenkothen et al. (2019) Huppenkothen, D., Bachetti, M., Stevens, A. L., et al. 2019, Journal of Open Source Software, 4, 1393
- in’t Zand (2005) in’t Zand, J. J. M. 2005, A&A, 441, L1
- Jansen et al. (2001) Jansen, F., Lumb, D., Altieri, B., et al. 2001, A&A, 365, L1
- Jonker et al. (2003) Jonker, P. G., van der Klis, M., & Groot, P. J. 2003, MNRAS, 339, 663
- Kaur et al. (2011) Kaur, R., Heinke, C., Kotulla, R., et al. 2011, The Astronomer’s Telegram, 3695, 1
- King & Wijnands (2006) King, A. R. & Wijnands, R. 2006, MNRAS, 366, L31
- Kouveliotou et al. (1996) Kouveliotou, C., van Paradijs, J., Fishman, G. J., et al. 1996, Nature, 379, 799
- Kretschmar et al. (2019) Kretschmar, P., Fürst, F., Sidoli, L., et al. 2019, New A Rev., 86, 101546
- Kretschmar et al. (2004) Kretschmar, P., Mereghetti, S., Hermsen, W., et al. 2004, The Astronomer’s Telegram, 345, 1
- Lewin et al. (1976) Lewin, W. H. G., Doty, J., Clark, G. W., et al. 1976, ApJ, 207, L95
- Ludlam et al. (2018) Ludlam, R. M., Miller, J. M., Arzoumanian, Z., et al. 2018, The Astronomer’s Telegram, 12158, 1
- Madsen et al. (2022) Madsen, K. K., Forster, K., Grefenstette, B., Harrison, F. A., & Miyasaka, H. 2022, Journal of Astronomical Telescopes, Instruments, and Systems, 8, 034003
- Magnier et al. (2020) Magnier, E. A., Schlafly, E. F., Finkbeiner, D. P., et al. 2020, ApJS, 251, 6
- Mereminskiy et al. (2020) Mereminskiy, I., Lutovinov, A., Sunyaev, R., et al. 2020, The Astronomer’s Telegram, 13630, 1
- Minniti et al. (2017) Minniti, D., Lucas, P., & VVV Team. 2017, VizieR Online Data Catalog, II/348
- O’Donnell (1994) O’Donnell, J. E. 1994, ApJ, 422, 158
- Papitto et al. (2020) Papitto, A., Falanga, M., Hermsen, W., et al. 2020, New A Rev., 91, 101544
- Pecaut & Mamajek (2013) Pecaut, M. J. & Mamajek, E. E. 2013, ApJS, 208, 9
- Rai et al. (2018) Rai, B., Pradhan, P., & Paul, B. C. 2018, Research in Astronomy and Astrophysics, 18, 148
- Rajoelimanana et al. (2017) Rajoelimanana, A. F., Charles, P. A., Meintjes, P. J., et al. 2017, MNRAS, 464, 4133
- Rodriguez et al. (2015) Rodriguez, J., Cadolle Bel, M., Alfonso-Garzón, J., et al. 2015, A&A, 581, L9
- Romano (2015) Romano, P. 2015, Journal of High Energy Astrophysics, 7, 126
- Romano et al. (2011) Romano, P., Barthelmy, S. D., Krimm, H. A., et al. 2011, The Astronomer’s Telegram, 3685, 1
- Romano et al. (2016) Romano, P., Bozzo, E., Esposito, P., et al. 2016, A&A, 593, A96
- Romano et al. (2015) Romano, P., Bozzo, E., Mangano, V., et al. 2015, A&A, 576, L4
- Romano et al. (2014) Romano, P., Ducci, L., Mangano, V., et al. 2014, A&A, 568, A55
- Romano et al. (2023) Romano, P., Evans, P. A., Bozzo, E., et al. 2023, A&A, 670, A127
- Sazonov et al. (1997) Sazonov, S. Y., Sunyaev, R. A., & Lund, N. 1997, Astronomy Letters, 23, 286
- Scargle et al. (2013) Scargle, J. D., Norris, J. P., Jackson, B., & Chiang, J. 2013, ApJ, 764, 167
- Sguera et al. (2006) Sguera, V., Bazzano, A., Bird, A. J., et al. 2006, ApJ, 646, 452
- Shakura et al. (2014) Shakura, N., Postnov, K., Sidoli, L., & Paizis, A. 2014, MNRAS, 442, 2325
- Shaw et al. (2017) Shaw, A. W., Heinke, C. O., Degenaar, N., et al. 2017, MNRAS, 471, 2508
- Sidoli (2017) Sidoli, L. 2017, in XII Multifrequency Behaviour of High Energy Cosmic Sources Workshop (MULTIF2017), 52
- Sidoli et al. (2001) Sidoli, L., Belloni, T., & Mereghetti, S. 2001, A&A, 368, 835
- Smith et al. (2018) Smith, L. C., Lucas, P. W., Kurtev, R., et al. 2018, MNRAS, 474, 1826
- Spruit & Taam (1993) Spruit, H. C. & Taam, R. E. 1993, ApJ, 402, 593
- Staubert et al. (2019) Staubert, R., Trümper, J., Kendziorra, E., et al. 2019, A&A, 622, A61
- Strüder et al. (2001) Strüder, L., Briel, U., Dennerl, K., et al. 2001, A&A, 365, L18
- Tomsick et al. (2008) Tomsick, J. A., Chaty, S., Rodriguez, J., Walter, R., & Kaaret, P. 2008, ApJ, 685, 1143
- Turner et al. (2001) Turner, M. J. L., Abbey, A., Arnaud, M., et al. 2001, A&A, 365, L27
- Vallenari et al. (2022) Vallenari, A., Brown, A. G. A., Prusti, T., et al. 2022, arXiv e-prints, arXiv:2208.00211
- van den Eijnden et al. (2017) van den Eijnden, J., Bagnoli, T., Degenaar, N., et al. 2017, MNRAS, 466, L98
- van der Klis (2006) van der Klis, M. 2006, in Compact stellar X-ray sources, Vol. 39, 39–112
- van Paradijs (1998) van Paradijs, J. 1998, in NATO Advanced Study Institute (ASI) Series C, Vol. 515, The Many Faces of Neutron Stars., ed. R. Buccheri, J. van Paradijs, & A. Alpar, 279
- Wachter et al. (1979) Wachter, K., Leach, R., & Kellogg, E. 1979, ApJ, 230, 274
- Wijnands & van der Klis (2000) Wijnands, R. & van der Klis, M. 2000, ApJ, 528, L93
- Wilms et al. (2000) Wilms, J., Allen, A., & McCray, R. 2000, ApJ, 542, 914