Periodic super-radiance in Er:YSO crystal
Abstract
We observed periodic optical pulses from an Er:YSO crystal during irradiating with an continuous-wave excitation laser. We refer to this new phenomenon as ”periodic super-radiance”. This periodicity can be understood qualitatively by a simple model, in which a cyclic process of a continuous supply of population inversion and a sudden burst of super-radiance is repeated. The excitation power dependences of peak interval and the pulse area can be interpreted with our simple model. In addition, the linewidth of super-radiance is much narrower than an inhomogeneous broadening in a crystal. This result suggests that only Er3+ ions in a specific environment are involved in super-radiance.
A considerable number of theoretical and experimental studies on super-radiance (SR) have been conducted, starting with the prediction by R. H. Dicke in 1954 [1]. If a correlation between the atomic or molecular dipole moments is generated, the peak transition rate is accelerated and gets proportional to because a macroscopic dipole proportional to the number of atoms is created. For SR to occur, this macroscopic dipole has to develop within a decoherence time and a population inversion has to reach a certain threshold. So far SR has been demonstrated in gases [2, 3, 4] and solid-state materials [5, 6, 7, 8].
Recently, SR was observed from Er3+ ions doped in a Y2SiO5 crystal (Er:YSO) [9] 111In some literatures, as in [9], SR is referred to as super-fluorescence when it starts from uncorrelated fully excited states.. The intraconfiguration transitions of rare-earth ions doped into crystals has remarkably long decoherence time despite being in a solid environment because electrons are shielded by and shells from interactions with the host lattice. An Er:YSO crystal exhibits a narrowest homogeneous linewidth of 73 Hz in a solid [11]. Various applications towards quantum information processing [12, 13, 14] and fundamental physics [15, 16, 17] have been proposed.
In this paper, we report on experimental studies of SR with a quasi-periodic time structure observed in an Er:YSO crystal. In past SR experiments, usually a single SR pulse, with or without ringing, is generated after an excitation by a pulsed laser. In contrast, observed pulses in the present case are generated periodically while the continuous-wave (CW) excitation laser is turned on. In addition, its linewidth is found to be comparable to the Fourier limit, much narrower than an inhomogeneous broadening in a crystal. This phenomenon is not only interesting in itself, but also from the viewpoint that optical pulses with a narrow linewidth are generated for an input of a CW excitation laser. To our best knowledge, such phenomena have not been studied experimentally or theoretically up to now.
Below we describe the results of our experiment, focusing on the periodic nature. A simple model is also given which treats it as repetition of a cyclic process of a continuous supply of population inversion and a sudden burst of SR emissions after reaching an SR threshold.
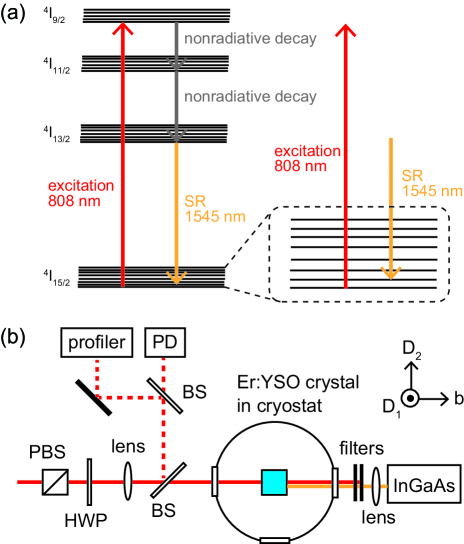
Figure 1 (a) shows the energy diagram of Er3+ ions doped in a YSO crystal. Each state is split into several Stark levels by the crystal field. Er3+ ions are excited from the ground state to the lowest Stark level of the 4I9/2 state with a wavelength of 808 nm. The excited Er3+ ions rapidly decay via nonradiative processes. In this way the population accumulates in the lowest Stark level of the 4I13/2 state with a long lifetime, which is measured by the fluorescence (spontaneous emission) to be roughly 10 ms. Besides the fluorescence, the optical pulses propagating in the forward direction are generated.
Figure 1 (b) shows the experimental setup. The target is an Er3+:YSO crystal grown by Scientific Materials, Inc. of Bozeman, Montana. The Er3+ ions at site 2 are used in our experiment. The number density of Er3+ ions at each site is roughly cm-3 according to the nominal concentration value of 0.1 %. The crystal is held by a copper holder in a cryostat and it is cooled to roughly 4 K by a Gifford-McMahon refrigerator. Almost all the Er3+ ions exist in the lowest Stark level of the 4I15/2 ground state at 4 K. The crystal is aligned with the laser vector parallel to the axis along a 6 mm path. Other crystal dimensions are 4 mm along axis and 5 mm along axis. The polarization of the input laser is parallel to axis. The beam diameter () is loosely focused on the crystal to roughly 300 m and it remains almost unchanged in the crystal. The input laser power is monitored by a photodetector and it is typically 90 mW. The laser position is also monitored by a beam profiler. An indium-gallium-arsenide (InGaAs) photodetector (HCA-S-200M-IN; FEMTO Messtechnik GmbH) detects generated optical pulses. The residual excitation laser is removed by long pass filters in front of the detector.
The time sequence of the laser excitation of Er3+ ions is controlled by an acousto-optic modulator (AOM). The excitation laser is turned on for 40 ms every 200 ms: this time sequence is chosen in such a way that the duration of the excitation laser is much longer than the observed pulse duration and period, and at the same time the temperature rise of the target crystal, which shortens the decoherence time, is enough low. The 40 ms excitation data is taken 10 times repeatedly.
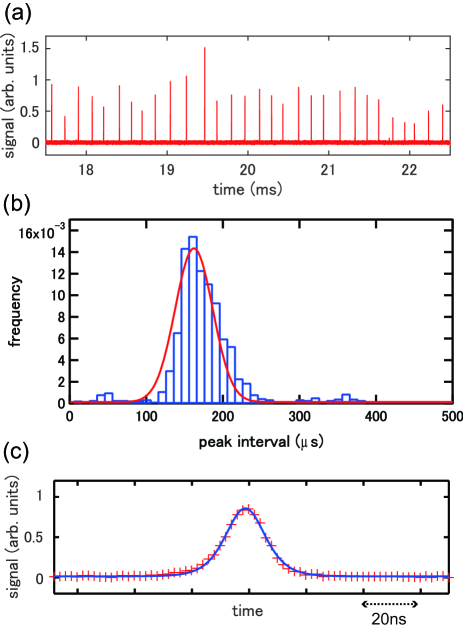
We observed a train of light pulses: the pulses begin to appear several ms after the laser is turned on (), and disappears right after it is turned off. Figure 2 (a) shows an example of the observed pulses in the middle 5 ms of the excitation. The pulses are generated at almost constant time intervals, in other words, periodically. Figure 2 (b) is a histogram of peak intervals, which are defined by the time difference between adjacent peaks (the data after ms are plotted, where the system has reached equilibrium). The red line is the Gaussian fit. The mean period and the standard deviation given by the fit are 160 s and 20 s, respectively. The pulses are generated in the transition from the lowest Stark level of the 4I13/2 state to the second lowest Stark level of the 4I15/2 ground state. It is confirmed by a monochromator and the wavelength of the pulses is 1545 nm.
The observed pulses are identified as SR based on the following observations: (i) short pulse duration, (ii) sech-squared pulse shape, (iii) relationship between pulse duration and height, and (iv) relationship between pulse area and height. Below we elaborate these points in more detail. Figure 2 (c) is a typical example of a single observed pulse (the red crosses). The FWHM (Full-Width-Half-Maximum) pulse duration of such pulses are observed to fluctuate with the mean duration of 20 ns and the standard deviation of 5 ns, respectively. They are given by the Gaussian fit to the histogram of the duration. The observed pulse duration is times shorter than the lifetime of the higher state of this transition ( 10 ms), whereas it is consistent with an expected time scale of SR. Actually, the characteristic time of SR is given in a simplified two-level model by [18]
| (1) |
where denotes a number density of Er3+ ions related to SR, is a wavelength of SR (1545 nm), is a sample length (6 mm), and is a radiative decay rate. An approximate value of may be estimated as follows. For , we use the number of photons in a single pulse divided by the excitation volume , where is estimated from the measured signal pulse area with the efficiency of the InGaAs photodetector, and the transmittance of the filters, and is taken to be times the laser beam cross section (). The upper limit of is given by the lifetime of the higher state multiplied by the radiative branching ratio to the lower states [19], and is found to be 40 Hz. Combining these factors, is calculated to be longer than (1 ns). Considering a numerical factor needed to convert to the pulse duration and ambiguity in , we conclude that our observed pulses are consistent with SR.
For our experimental configuration, it is expected that the macroscopic polarization (coherence) develops homogeneously over the target (), and thus SR pulse shapes become sech-squared function [20]. As shown by the blue solid line in Fig. 2 (c), the observed pulse shape is indeed well fit by this function. It is also expected that the pulse duration is inversely proportional to the square root of the peak height since the former is proportional to (Eq.1), and the latter to . Similarly the pulse area () is proportional to the square root of the peak height. These relationships are examined by the data and found to hold approximately (see Supplemental Material for more details).
The periodic behavior of the observed SR can be interpreted with the following simple model. (i) The excitation laser pumps up Er3+ ions to the higher state of the SR transition. (ii) A part of them deexcites to the lower states via spontaneous emissions. (iii) During the process, macroscopic polarization (coherence) also develops, until it reaches the SR threshold. (iv) Then, the population of the higher state (also the coherence) suddenly decreases, resulting in a sharp pulse. (v) The population of the lower state of SR decays to the ground state immediately. (vi) By repeating these processes, the periodic SR pulses are generated.
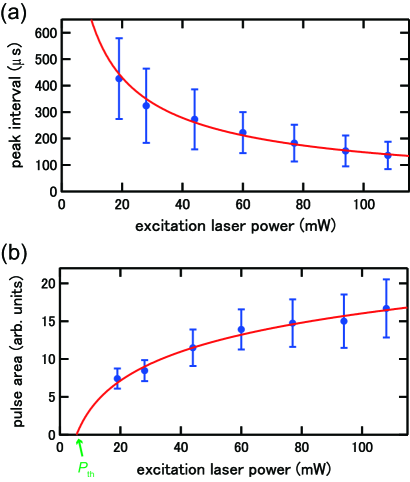
To confirm the validity of our model, we investigated the dependence on the excitation laser power. Figure 3 (a) and (b) show, respectively, the peak interval and pulse area as a function of the excitation laser power. All the observed pulses in 40 ms are used in this analysis. As the power increases, the period gets shorter and the area becomes larger. The solid lines in Figs. 3 (a) and (b) are the results of fits whose functional forms are derived from our model plus the assumption that the SR threshold (thus ) is independent of the laser power. Since the coherence build-up is a competing process between pumping and deexcitation rates, there should exist some threshold intensity for the excitation laser. The actual laser beam is not uniform spatially but has a radius dependence. Thus an effective area in which the intensity exceeds should increase as the laser power. Assuming a Gaussian intensity profile , we expect the effective volume also increases as . Here is a peak intensity for the excitation laser power and is a threshold radius determined by . From the constancy of or , not here, we expect (proportional to the pulse area) to increase as . The peak interval, on the other hand, is inversely proportional to the intensity averaged over the cross sectional area in our model: thus we expect it is proportional to . Actual fits to the data, both peak interval and pulse area, are done simultaneously using and with and as free parameters. The threshold power has a relationship of with . The measured results are fit well by using our model. The fitting results give mW. This error is scaled so that the reduced value is unity. The value of is consistent with the experimental fact that no periodic SR can be observed below 10 mW. The above results of the excitation laser power dependence support the validity of our model.
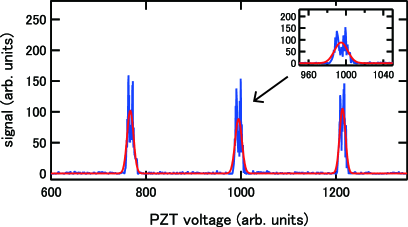
We now focus on the linewidth of SR. For this measurement, the SR pulses coming out of the crystal are coupled to an optical fiber, which is in turn sent to a confocal cavity (SA200-14; Thorlabs) whose Finesse and free spectral range (FSR) are and 1.5 GHz, respectively. While the cavity length is swept over 3 FSR slowly (at 0.013 Hz) by changing the PZT voltage, the light intensity transmitted from the cavity is measured by the same photodetector as in the SR experiment. Figure 4 is an example of the transmitted signal vs the cavity length. The red line is the Gaussian fit, which gives the FWHM linewidth of 100 MHz when averaged over three peaks. Several comments are in order here. First, the actual linewidth may be much narrower than the quoted value because it contains shot-by-shot frequency fluctuations of the SR pulse. In fact, the measured linewidth is broader than its Fourier limit, 20 MHz, which is estimated from the observed pulse width of 20 ns. Second, the measured width turns out to be much narrower than the typical inhomogeneous broadening in the crystal (1 GHz). This result indicates that only the Er3+ ions in a specific environment (with a narrow frequency range) are excited. If Er3+ ions were excited in a wider range of the inhomogeneous broadenings, we expect that each SR pulse would be generated independently, and thus randomly in time. We believe that the periodic nature of observed SR pulses is deeply related to this feature.
As a point of caution, the period changes depending on the excited region of the crystal due to inhomogeneity. It is confirmed by changing the alignment of the excitation laser. However, the periodic behavior can be reproduced if the alignment is adjusted properly. Even if the period itself changes, the various properties of the periodic pulses can be discussed in the same way as above at other regions of the crystal.
In summary, we observed a phenomenon which can be characterized as a periodic SR in an Er:YSO crystal. The periodic time structure can be understood by our simple model, which presumes that the periodic SR is generated in a cyclic process of continuous population inversion and a sudden burst of SR emissions initiated at the SR threshold. The validity of our model is supported, at least partially, by the results of the power dependence measurements. The model is admittedly qualitative: if more quantitative understanding is succeeded in, the control of the temporal behavior of the SR can be realized in the future. In addition to these features above, we revealed that, from the linewidth measurement, a narrow transition frequency range is selected for SR pulses within an inhomogeneous broadening. We believe that this is one of the key features to realize the periodic time structure. The periodic SR we observed also presents a potential as a light source, where narrow linewidth optical pulses are generated in a simple system without injection seeding. Coherent phenomena in a solid have possible applications towards quantum information processing [12, 13, 14] and fundamental physics [15, 16, 17]. Understanding and controlling coherent phenomena will play an important role in these research fields.
Acknowledgements.
We thank C. Braggio, F. Choissi, G. Carugno, and K. An for helpful discussions. This work was supported by JSPS KAKENHI (Grant Numbers JP20H00161 and JP21H01112).References
- Dicke [1954] R. H. Dicke, Phys. Rev. 93, 99 (1954).
- Skribanowitz et al. [1973] N. Skribanowitz, I. P. Herman, J. C. MacGillivray, and M. S. Feld, Phys. Rev. Lett. 30, 309 (1973).
- Gross et al. [1976] M. Gross, C. Fabre, P. Pillet, and S. Haroche, Phys. Rev. Lett. 36, 1035 (1976).
- Carlson et al. [1980] N. Carlson, D. Jackson, A. Schawlow, M. Gross, and S. Haroche, Optics Communications 32, 350 (1980).
- Florian et al. [1982] R. Florian, L. Schwan, and D. Schmid, Solid State Communications 42, 55 (1982).
- Rainò et al. [2018] G. Rainò, M. A. Becker, M. I. Bodnarchuk, R. F. Mahrt, M. V. Kovalenko, and T. Stöferle, Nature 563, 671 (2018).
- Angerer et al. [2018] A. Angerer, K. Streltsov, T. Astner, S. Putz, H. Sumiya, S. Onoda, J. Isoya, W. J. Munro, K. Nemoto, J. Schmiedmayer, et al., Nature Physics 14, 1168 (2018).
- Cong et al. [2016] K. Cong, Q. Zhang, Y. Wang, G. T. Noe, A. Belyanin, and J. Kono, J. Opt. Soc. Am. B 33, C80 (2016).
- Braggio et al. [2020] C. Braggio, F. Chiossi, G. Carugno, A. Ortolan, and G. Ruoso, Phys. Rev. Research 2, 033059 (2020).
- Note [1] In some literatures, as in [9], SR is referred to as super-fluorescence when it starts from uncorrelated fully excited states.
- Böttger et al. [2009] T. Böttger, C. W. Thiel, R. L. Cone, and Y. Sun, Phys. Rev. B 79, 115104 (2009).
- Simmon et al. [2010] C. Simmon, M. Afzelius, J. Appel, A. B. de la Giroday, S. Dewhurst, N. Gisin, C. Hu, A. Jelezko, S. Kröll, J. Müller, et al., European Physical Journal D 58, 1 (2010).
- Zhong et al. [2015] M. Zhong, M. P. Hedges, R. L. Ahlefeldt, J. G. Bartholomew, S. E. Beavan, S. M. Wittig, J. J. Longdell, and M. J. Sellars, Nature 517, 177 (2015).
- Rančić et al. [2018] M. Rančić, M. P. Hedges, R. L. Ahlefeldt, and M. J. Sellars, Nature Physics 14, 50 (2018).
- Sasao and Yoshimura [2018] N. Sasao and M. Yoshimura, The European Physical Journal C 78, 1 (2018).
- Hara and Yoshimura [2019] H. Hara and M. Yoshimura, The European Physical Journal C 79, 1 (2019).
- Hara et al. [2021] H. Hara, A. Yoshimi, and M. Yoshimura, Phys. Rev. D 104, 115006 (2021).
- Benedict et al. [1996] M. Benedict, A. Ermolaev, V. Malyshev, I. Sokolov, and E. Trifonov, Super-radiance: Multiatomic Coherent Emission (CRC Press, 1996).
- Böttger et al. [2006] T. Böttger, Y. Sun, C. W. Thiel, and R. L. Cone, Phys. Rev. B 74, 075107 (2006).
- Bonifacio and Lugiato [1975] R. Bonifacio and L. A. Lugiato, Phys. Rev. A 11, 1507 (1975).