Saying Hallo to M94’s Stellar Halo: Investigating the Accretion History of the Largest Pseudobulge Host in the Local Universe
Abstract
It is not yet settled how the combination of secular processes and merging gives rise to the bulges and pseudobulges of galaxies. The nearby (4.2 Mpc) disk galaxy M94 (NGC 4736) has the largest pseudobulge in the local universe, and offers a unique opportunity for investigating the role of merging in the formation of its pseudobulge. We present a first ever look at the M94’s stellar halo, which we expect to contain a fossil record of M94’s past mergers. Using Subaru’s Hyper Suprime-Cam, we resolve and identify red giant branch (RGB) stars in M94’s halo, finding two distinct populations. After correcting for completeness through artificial star tests, we can measure the radial profile of each RGB population. The metal-rich RGB stars show an unbroken exponential profile to a radius of 30 kpc that is a clear continuation of M94’s outer disk. M94’s metal poor stellar halo is detectable over a wider area and clearly separates from its metal-rich disk. By integrating the halo density profile, we infer a total accreted stellar mass of , with a median metallicity of [M/H]1.4. This indicates that M94’s most-massive past merger was with a galaxy similar to, or less massive than, the Small Magellanic Cloud. Few nearby galaxies have had such a low-mass dominant merger; therefore we suggest that M94’s pseudobulge was not significantly impacted by merging.
1 Introduction
Galaxy formation is driven by both secular and hierarchical processes: the former being the formation of stars and structures that happens internally in a galaxy as it evolves over time (in situ processes), and the latter being accreted through mergers and interactions with other galaxies (ex situ processes; e.g., Kormendy (1979); Barnes & Hernquist (1992); Conselice et al. (2008)). Though past studies (e.g., Kormendy & Kennicutt, 2004) have postulated that the nonsecular processes of hierarchical clustering and violent mergers were dominant in the early universe, giving way to slow and secular processes at later times, we now know that the evolution of galaxy features seen today arises from a combination of and interplay between these two processes, both of which are important in shaping the diverse morphologies of today’s galaxies (e.g., Hopkins et al., 2010; Somerville & Davé, 2015).
Secular evolution is the slow and steady evolution of a galaxy through either long-term interactions with its environment or internal process with timescales that are long compared to the dynamical timescale of the galaxy. Galaxies accumulate gas from external accretion and infall, which is then used as a catalyst for secular processes and the formation of disk instabilities and tidal interactions (Combes 2009). On the other hand, hierarchical evolution happens on dynamical timescales through events like mergers and satellite accretion, wherein galaxies are built out of mergers with smaller galaxies (White & Rees, 1978; Barnes & Hernquist, 1992; Bullock & Johnston, 2005; Purcell et al., 2007; Cooper et al., 2010). Mergers should therefore be important drivers of galaxy evolution. They can help shape a galaxy’s formation, morphological features such as bulges and disks, metallicity and color gradients, kinematics, and stellar populations (e.g., Kauffmann et al., 1999; Deason et al., 2015a; Brooks & Christensen, 2016; D’Souza & Bell, 2018; Gallart et al., 2019; Gargiulo et al., 2019).
Both of these impetuses have been predicted to result in different morphological evolutions for a galaxy. Disk instabilities from secular evolution can trigger gas to cascade into the center of the galaxy and impart angular momentum into the system. This high density of gas can fuel star formation and nuclear starbursts (Kormendy 2007), as well as form other structures such as spiral disks and bars. Bars also commonly drive gas inward and grow by transferring angular momentum to the outer disk. Even if a galaxy has a weak bar (or has an oval disk), a nonaxisymmetric potential is still created and the evolution of the central part of the galaxy is similar to barred galaxies (Kormendy & Kennicutt 2004).
The infalling gas can then create a structure known as a pseudobulge. Pseudobulges are the dense, flat, inner region of a galaxy that have retained some of their disk-like properties (Athanassoula 2005). They have more rotation than random-motion-dominated bulges, have active ongoing star formation with younger stellar populations that can fuel their growth, smaller Sérsic indices, and they do not follow the Faber-Jackson relation or fall on the fundamental plane (Kormendy & Kennicutt 2004, Fisher & Drory 2010, Kormendy et al. 2010).
Alternatively, it is widely believed that hierarchical evolution is a catalyst for the formation of classical bulges (Hopkins et al. 2010, Brooks & Christensen 2016), the bright center structure in some galaxies, historically called “ellipticals sitting in the middle of disks” (Renzini 1999). But this is not as clear cut as it seems: the formation of bulges during mergers is nearly inevitable in galaxy formation simulations (Kormendy et al., 2010), leading to an overrepresentation of bulge-dominated galaxies, relative to their observed prevalence in the nearby universe. The evolution of galactic features is an incredibly complex and dynamic process and one that can be influenced by both secular and nonsecular evolution at various stages (Brooks & Christensen, 2016; Gargiulo et al., 2019; Izquierdo-Villalba et al., 2019).
In order to learn about and constrain the creation physics of galactic bulge structures, we turn to the disk galaxy M94 (NGC 4736, D = 4.2 Mpc, GHOSTS (Galaxy Halos, Outer disks, Substructure, Thick disks, and Star clusters), Radburn-Smith et al. 2011). M94 has a stellar mass of (Karachentsev et al., 2004), thereby making it a Milky Way-stellar mass galaxy assuming the Milky Way has a stellar mass of (Licquia & Newman, 2015). At its center, M94 has an oval distortion and weak bar in its center that contains low-ionization nuclear emission-line region (LINER) emission (Trujillo et al., 2009; Watkins et al., 2016). Beyond, it hosts a exponentially declining inner disk that flattens out, hence classified as an antitruncated disk (Trujillo et al., 2009), which Younger et al. (2007) states can arise from a minor merger in certain cases. It has an intensely star-forming inner ring at around 50” (; Watkins et al. (2016)). Outside this, Trujillo et al. (2009) did an intensive, multiwavelength study of M94’s outer disk and found that in the UV and infrared, the outer parts of the galaxy shows a spiral arm structure with increased star formation as compared to the inner disk. While they favor a secular evolution explanation for this bright star-forming outer disk, they say they cannot rule out a scenario in which this extended disk originates from satellite accretion. In the optical, this spiral arm structure appears as an outer star-forming ring at 4 kpc and has some asymmetric features inside of 10 kpc (Watkins et al., 2016). Studies such as by Herrmann et al. (2009) have used planetary nebula kinematics to show that M94’s disk is flared at its outer parts where older stellar populations reside, which may be due to past interactions.
While estimates of M94’s rotational velocity are 120 km/s (de Blok et al., 2008), considerably lower than the Milky Way’s and considerably lower than would be expected for a galaxy of M94’s stellar mass, the combination of M94’s fairly face-on orientation and warped disk make its rotation velocity and inclination highly uncertain. Indeed, multiple studies have shown that M94 has large, noncircular motions throughout its disk (Moellenhoff et al., 1995; Wong & Blitz, 2000; de Blok et al., 2008; Trachternach et al., 2008; Walter et al., 2008; Watkins et al., 2016) and therefore one should use caution when interpreting its rotation curve or using its measured circular velocities for comparison with other galaxies. de Blok et al. (2008) specifically warn against using M94’s velocity profile to infer its total mass given the dominant impact of these noncircular motions. Accordingly, when we compare M94 with other galaxies, we compare it with galaxies with comparable stellar masses, irrespective of their published rotational velocities. Curiously enough, the presence of a warp in M94’s disk and its large noncircular motions are features that have been attributed to interactions in other galaxies such as the Milky Way (López-Corredoira et al., 2002; Bailin, 2003; López-Corredoira, 2006; Poggio et al., 2020). If M94 does not have evidence of a large star-rich merger, this would indicate that such morphological features can arise from nonmerger impetuses such as secular evolution or gas accretion from the surrounding medium.
M94 is unique in that it has the largest pseudobulge in our local universe, containing about 50% of its stellar mass (Trujillo et al. 2009). This pseudobulge is so concentrated and massive that this could only be caused by a significant loss of angular momentum by the system. Though M94 has been cited as a prime example of a pseudobulge galaxy driven by secular evolution (Kormendy & Kennicutt 2004), M94’s pseudobulge is so large, and bulge formation processes are sufficiently complex (Stinson et al. 2010; Brooks & Christensen 2016) that mergers could have contributed to its formation. Simulations have shown that there are examples of pseudobulges forming and surviving through active processes such as mergers (Combes 2005, Kormendy & Fisher 2008, Governato et al. 2009, Moster et al. 2010, Keselman & Nusser 2012). In fact, Barway et al. (2020) discovered a pseudobulge in the collisional ring galaxy Cartwheel, showing that pseudobulges can survive drop-through collisions in certain situations. Studies by Eliche-Moral et al. (2006) and Eliche-Moral et al. (2011) found that pseudobulge signatures can be created by satellite accretion, where the infalling satellite creates a disk instability that drives gas inward. Guedes et al. (2013) also showed that a pseudobulge could form quickly at high redshift from tidal interactions or mergers on dynamical, not secular, timescales, and other studies such as by Okamoto (2012) have found that under certain simulated conditions the main formation mechanism for a pseudobulge was starburst activity at early times (completed at ).
With this in mind, we use M94 as a testbed for galaxy evolution and aim to:
-
1.
Characterize M94’s stellar halo; and
-
2.
Answer the question: could M94’s dominant merger have played a role in the creation of its large pseudobulge, or was it formed due to other processes such as secular evolution?
Studying M94’s merger history and characterizing its stellar halo can shed light on this question and also give us insight into how a disk galaxy’s major merger can affect its internal structure.
That said, detecting and learning about the past mergers of galaxies is a difficult task. In the currently accepted -cold dark matter (CDM) cosmological framework, galaxies form through the process of hierarchical assembly wherein a large DM halo and the galaxy associated with it grows through many mergers with smaller objects over time (White & Rees 1978; Bullock et al. 2001). Even though an ongoing active merger often produces very distinctive and observable tidal features, the observational markers of mergers blend in with the main galaxy on short timescales as the gas disperses throughout the main body and the stars undergo phase mixing (Spitzer & Shapiro, 1972; Bullock & Johnston, 2005). This makes identifying the properties of a past merger a challenging task.
Fortunately, not all information is lost. During a merger, the infalling galaxy will deposit material into the main galaxy, and its disrupted stars will spread out and form a diffuse population of stars surrounding the disk of the main galaxy that we call the stellar halo (Bullock & Johnston 2005), a remnant of its hierarchical and collisionless merger history. Therefore, information about past accretions is encoded into the stellar halos of galaxies, making them useful fossils of past mergers (Bullock & Johnston 2005; Purcell et al. 2007; Cooper et al. 2010; Bell et al. 2017; D’Souza & Bell 2018; Monachesi et al. 2019). Theory and observations suggest that the halos of Milky Way-stellar mass galaxies predominantly manifest the properties of the most-massive galaxies that have previously merged with them (De Lucia & Helmi 2008; Deason et al. 2015a; D’Souza & Bell 2018; Monachesi et al. 2019; Smercina et al. 2020). Stellar halos are have low surface brightnesses, so it is critical to resolve red giant branch (RGB) stars, which trace the underlying faint stellar population and are luminous enough to be detected even outside the Local Group (Radburn-Smith et al., 2011), unlike Main Sequence (MS) stars. Deriving the mass, metallicity, and structure of a galaxy’s halo using RGB stars enables us to infer its most dominant merger event.
This insight has helped to investigate the impacts of mergers by using the stellar halos of the Milky Way (MW) and M31. Studies of the Milky Way’s halo have led to the discovery that a large interaction with a galaxy around nine billion years ago (Belokurov et al. 2018; Helmi et al. 2018) coincides with the formation of the Milky Way’s thick disk (Gallart et al. 2019), indicating an association between mergers of a characteristic size and thick disk formation. An investigation of the halo of our nearest neighbor, M31, showed that its most-massive merger thickened its disk (D’Souza & Bell 2018; Hammer et al. 2018) but failed to destroy it, causing a burst of star formation (Williams et al. 2017), while bringing in many of M31’s satellites (Weisz et al. 2019; D’Souza & Bell 2021).
Cognizant that mergers may be important in shaping galaxy morphology (Somerville & Davé, 2015; Brooks & Christensen, 2016) and in delivering satellite galaxies, (Deason et al., 2015b; Patel et al., 2017; D’Souza & Bell, 2018), multiple approaches are used to measure and characterize the stellar halos that can constrain merger histories. The least expensive of these are deep imaging surveys (Martínez-Delgado et al. 2010; van Dokkum et al. 2014; Merritt et al. 2016; Watkins et al. 2016). Resolved stellar population studies with Hubble Space Telescope (HST) pencil-beam observations (GHOSTS) or ground-based resolved-star wide-field imaging (Ibata et al. 2013; Okamoto et al. 2015; Crnojević et al. 2016; Smercina et al. 2020) are more observationally expensive, but can reach fainter surface brightness limits, give stellar population information (metallicities, insight into star formation histories, etc.) and do not suffer from contamination from galactic cirrus or scattered light.
In this paper, we present observations of the resolved stellar population of M94 using the Subaru’s Hyper Suprime-Cam (HSC) in three passbands. Three passbands enable us to both remove contaminants and measure the halo to a greater depth and lower surface brightness. HSC affords us both the high sensitivity and large coverage area we need in order to be able to probe resolved stellar populations. We take an unprecedented wide-field, sensitive look at M94’s stellar halo, and infer the stellar mass of its most dominant major merger in order to evaluate whether it could have played a role in the formation of M94’s pseudobulge.
2 Observations
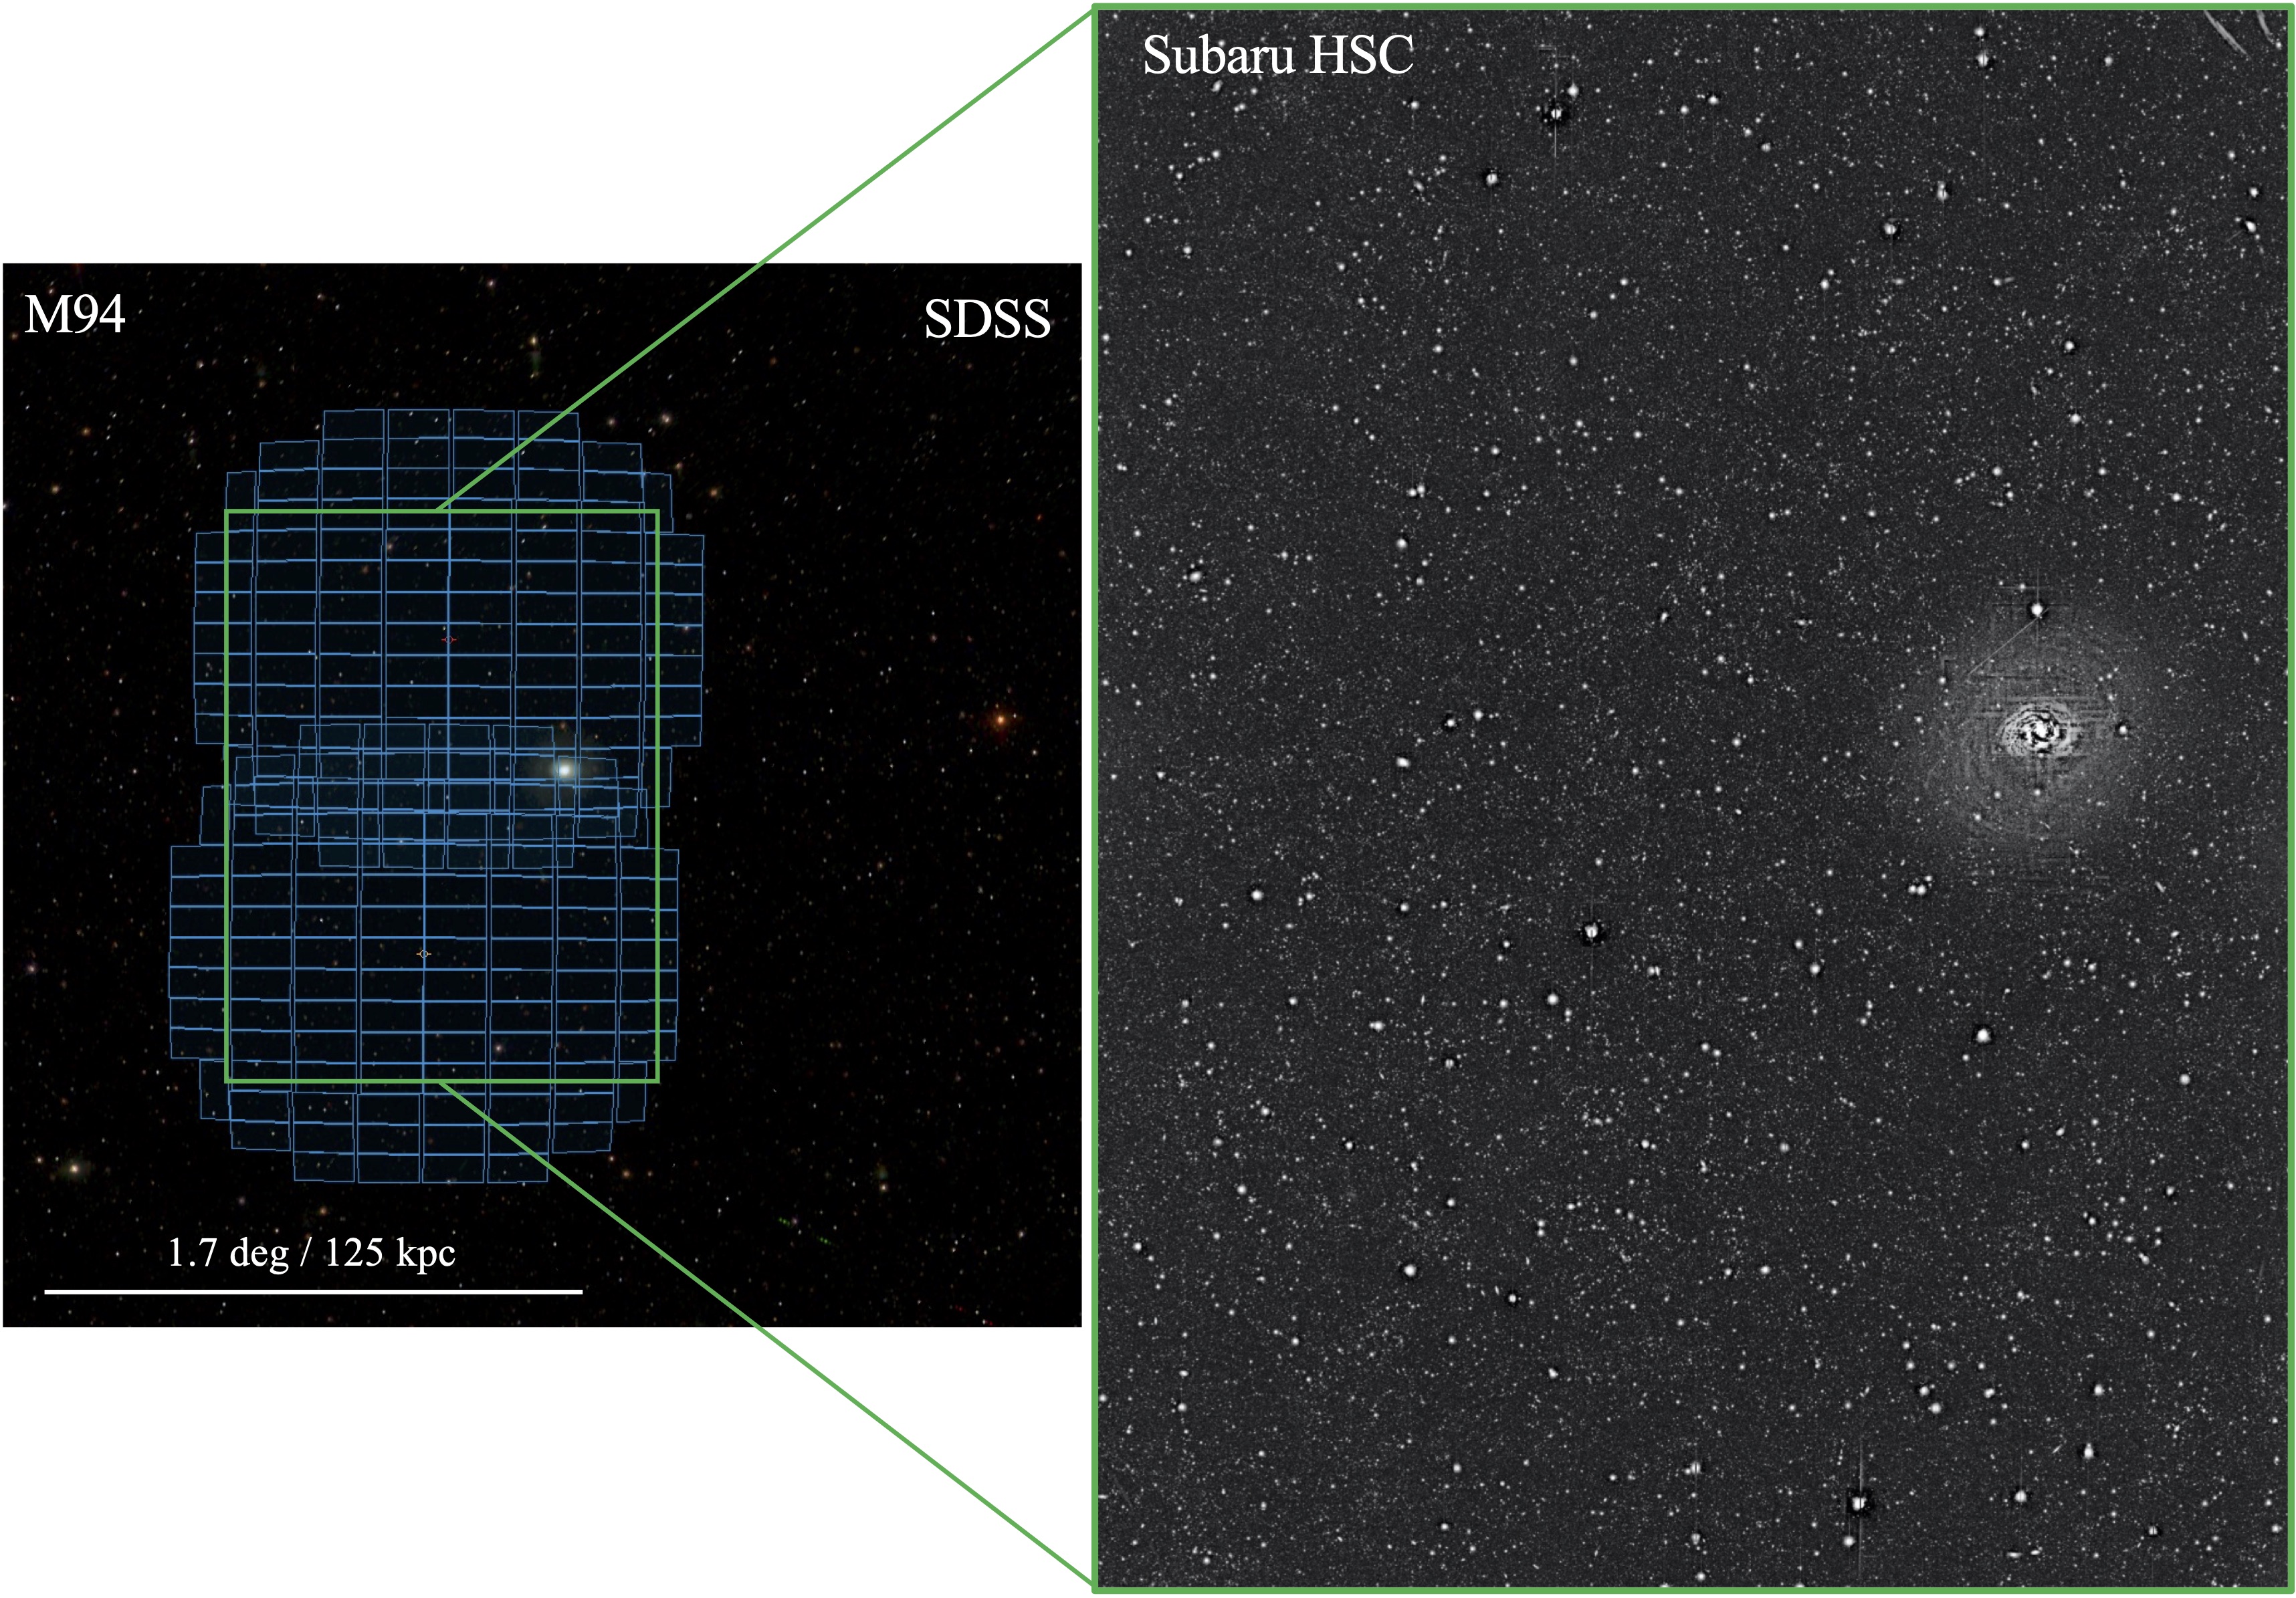
Resolved stellar imaging of M94 was carried out during two nights (2017 20–21 April) using Subaru’s HSC (Miyazaki et al. 2018) through the Gemini–Subaru exchange program (PI: Smercina, NOAO 2017A-0312). Two fields of 1.5 square degrees each were surveyed in the -, -, and bands, with a depth of hr per band per pointing. The image scale of HSC is 1’ per 1.22 kpc. Figure 1 shows an image of M94 from the Sloan Digital Sky Survey (SDSS), with the two HSC fields superimposed on top to show the full field of view. The combination of depth and image quality possible with HSC permit resolving the brightest tip of the red giant branch (TRGB) stars at the distance of M94, giving access to both stellar population information (e.g., metallicities from RGB colors; e.g., Monachesi et al. 2016a) and extremely sensitive inferred surface brightness limits (Smercina et al., 2020). Information about the observation cadence, filters, integration time, and 50% completeness limiting magnitudes is given in Table 1.
| Band | Exp Time (s) | # of Exposures | 50% Completeness Mag |
|---|---|---|---|
| 7200 | 5 | 27.7 | |
| 6200 | 11 | 26.9 | |
| 9000 | 27 | 26.3 |
Note. — Observation details for the Subaru HSC for each band in the program. The last column is the 50% completeness limit for recovering sources in each band.
The data were reduced and calibrated, and photometry was performed using the HSC optical imaging pipeline (Bosch et al., 2018). The pipeline performs photometric and astrometric calibration using the Pan-STARRS1 catalog (Magnier et al., 2013), reporting the final magnitudes in the HSC natural system. For each source, we perform background subtraction by measuring the clipped mean of deblended pixels within an annulus that extends from 7 to 15 times the point-spread function (PSF) , and we subtract that times the effective area of the aperture from the source flux measurement. We extract PSF photometry that has been corrected to match aperture photometry with a 12 pixel radius. Sources are detected in all three bands, although band is prioritized to determine reference positions for forced photometry. Forced photometry is then performed on sources in the coadded image stacks.
All magnitudes were corrected for (very modest) galactic extinction of an average E(B-V) = 0.01 following Schlegel et al. (1998) and adopting the updated transformations from inferred reddening to extinction favored by Schlafly & Finkbeiner (2011). The depths of the images were nearly uniform across the two fields, yielding extinction-corrected point-source detection limits of , , and . See Bosch et al. (2018) for an in-depth discussion of the photometric uncertainties output by the HSC pipeline. The seeing was relatively stable, resulting in consistent point-source sizes of 075.
3 Data and Methods
3.1 Stellar Selection
Resolved stellar populations are powerful tools for measuring halo properties, but at the distance of M94, old low- and intermediate-mass MS stars, containing the bulk of the stellar mass, are too faint to detect at the depths of HSC. Therefore, we rely on measuring RGB stars whose metallicities are a strong function of their color (Streich et al., 2014). They are also a more luminous population, hence we are able to resolve RGB stars within two magnitudes of the TRGB, which is 2-3 orders of magnitude brighter than their MS counterparts and still trace the underlying stellar population.
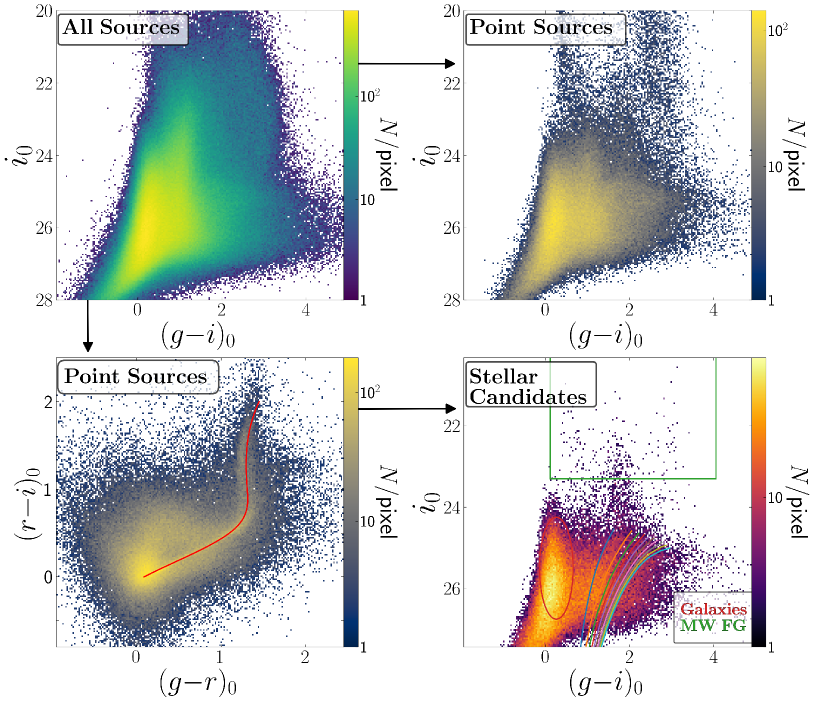
Unfortunately, at the depth achieved by HSC, resolved stellar sources are contaminated by galaxies because HSC can detect, but not resolve, distant galaxies (see Figure 2 top left), so it is important to have a systematic method to achieve star–galaxy separation. We first cut sources by FWHM with the criterion FWHM 075 to select only point and compact sources. This is shown at the top right of Figure 2, which depicts a color-magnitude diagram (CMD) of all unresolved ‘point’ sources in our sample. In shallower datasets, such cuts are sufficient owing both to the relatively lower number of galaxies and their typically larger FWHMs at brighter magnitudes. In our deep dataset, compact and unresolved galaxies still outnumber stars, being particularly apparent at colors .
Stars occupy an empirical ‘stellar locus’ in color-color diagrams that that can be distinct from galaxies. We use the / stellar locus (e.g., Covey et al., 2007; Ivezić et al., 2007; High et al., 2009; Davenport et al., 2014) to select stars in our survey and remove contaminants like galaxies and quasars. This is shown as the red line in Figure 2 at the bottom left. We chose sources that are within their photometric errors of this line. This leaves us with our final list of stellar candidates, whose CMD is shown at the bottom right of Figure 2. The RGB sequence is clearer in this CMD, and unresolved galaxies with are much reduced in number (compare the top-right and bottom-right panels of Fig. 2), but compact galaxies with are still numerous, primarily because it is at this point where distant background galaxies and stars have similar colors.
Using this final selection, we then narrow our focus to just the region around the RGB.
3.2 RGB Regions
We wish to obtain a more robust color distribution that will better reflect the metallicity of the population, so we calculate the ‘Q-color’ of candidate RGB stars following Monachesi et al. (2016a). The intention of this metric is to give the color of an RGB star, referenced to a magnitude 0.5 mag below the TRGB. We achieve this by rotating the (color, TRGB magnitude) point of (2,25.036) around a angle, making the metal-poor RGB vertical.
From the distribution of stellar sources between 12-30 kpc from the center of the galaxy, we see that the RGB branch on the CMD looks to have two different regions within it, one centered around a Q-color of and the other centered around . We also fit a four-component Gaussian mixture model to the peaks of the 1D Q-color distribution to obtain the peak colors of the two regions. The Q-color CMD and the 1D histogram of the Q-color is shown in Figure 3. Each fitting Gaussian peak is overlaid in yellow, with the sum of all the peaks shown in green.
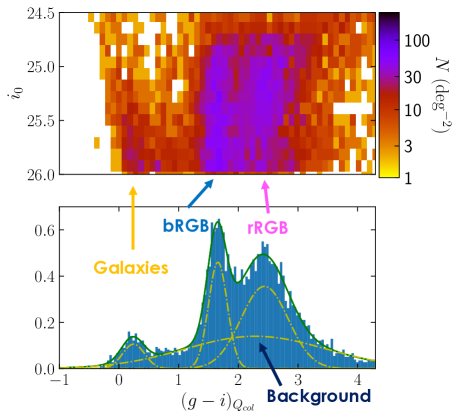
A four-component Gaussian mixture model describes the features of the Q-color distribution reasonably well. The RGB region of M94 has two clear and distinct populations corresponding to RGB stars at two different characteristic colors of = 1.64 and 2.22. In addition, a blue peak accounts for the population of background galaxies; this component has little impact in this study as we select against it in color–magnitude space. The fourth broad peak models (likely imperfectly) the foreground star and compact background population, which has a wide range in color, extending well beyond the colors expected of RGB stars. It is clear from this consideration that fore- and background objects do contaminate our RGB selections, requiring our later use of background subtraction for quantitative investigation of the density and color profiles of RGB stars.
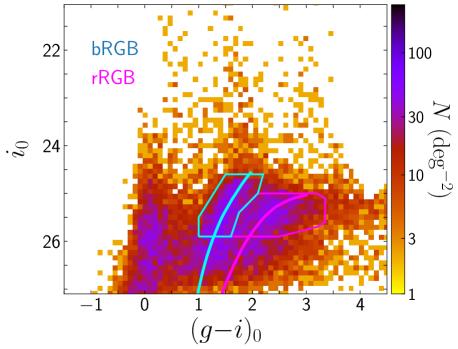
Bearing this in mind, we focus on the two RGB stellar populations for the remainder of this paper. These regions are displayed on top of the full stellar source CMD in Figure 4, with best-fit isochrones overlaid. We will refer to the blue-most region as bRGB and the redder one as rRGB throughout. The best-fit isochrones for each region have an [M/H] = 1.4 for bRGB and [M/H] = 0.4 for rRGB assuming an age of 10 Gyr. The metallicity for bRGB is derived from generating a set of PARSEC (Bressan et al. 2012) isochrones with metallicities between 0.0001 and 0.02 in 0.00005 increments, finding their TRGB + 0.5 color, and comparing to the peak Q-color of the region that has been transformed to a color. The metallicity for rRGB stars is derived star-by-star because the metal-richer isochrones are more tilted and curved than the metal-poorer ones, and so a conversion to Q-color becomes mildly magnitude dependent. For each star, we find the color difference at each i-band magnitude for each star in the RGB region. The best-fit metallicity is then taken from the model that minimizes the difference between the color of the RGB stars and the isochrone model. Thereby, the median metallicity of the rRGB stars is taken from the median of the individual metallicity measurements of all the rRGB stars111We note that adopting this process for the bRGB stars gives the same result for bRGB average metallicity as the Q-color based method, [M/H] = 1.4..
We note that it would be possible to fit the RGB colors with different combinations of age and metallicity. In particular, younger, slightly more metal-rich isochrones can also lead to a good fit (we estimate an [M/H] 1.07/0.17 and 1.25/0.3 for the bRGB/rRGB of a 4 and 7 Gyr population, respectively). This degeneracy does not affect the main conclusions of this paper, with the degree of systematic error introduced by the choice of stellar population being within the final quoted error bars. Nonetheless, we argue that our choice of a fiducial age for the halo stellar population of 10 Gyr is appropriate. Indeed, magnetohydrodynamics simulations such as those used in Monachesi et al. (2019) find that the median age for accreted stellar populations in the stellar halo of Milky Way-mass galaxies is 9.4 Gyr at a galactocentric distance of 30 kpc. Other studies such as by Font et al. (2006) and McCarthy et al. (2012) also find a lower limit on the age of accreted halo stars to be Gyr.
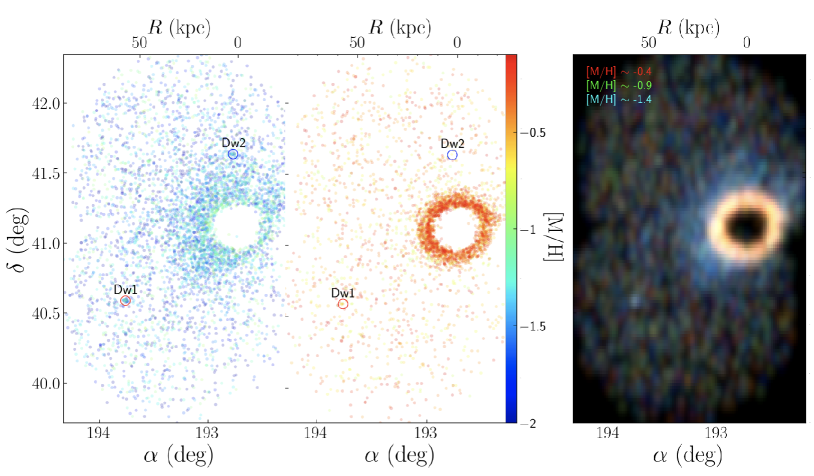
In Figure 5 we show the spatial distribution of stars in bRGB and rRGB color coded by their best-fit metallicities. Superimposed on a roughly uniform background of fore- and background contaminants, we see clear concentrations of stars at M94’s distance. This visualization shows the striking difference between the two regions in both spatial distribution and metallicity: bRGB is clearly composed of a more metal-poor population, and its stars are more widely distributed than those in the rRGB population, whose stars are clustered in a dense circular region at small radii until kpc. We later calculate the brightness profile of each population, showing that the rRGB population follows an exponential profile that directly follows the outer disk profile from Watkins et al. (2016); we therefore attribute the rRGB population to M94’s disk in what follows. We attribute the bRGB population, which is metal poorer, more diffuse, appears mildly asymmetric, and shows hints of possible streams, to M94’s stellar halo.
In order to calculate the color and surface brightness profiles accurately, it is important to determine the radius at which we are dominated by the roughly uniform background of contaminants apparent in Figs. 3 and 5. We examine Hess CMDs covering a series of radial bins from the center of the galaxy, as shown in Figure 6.
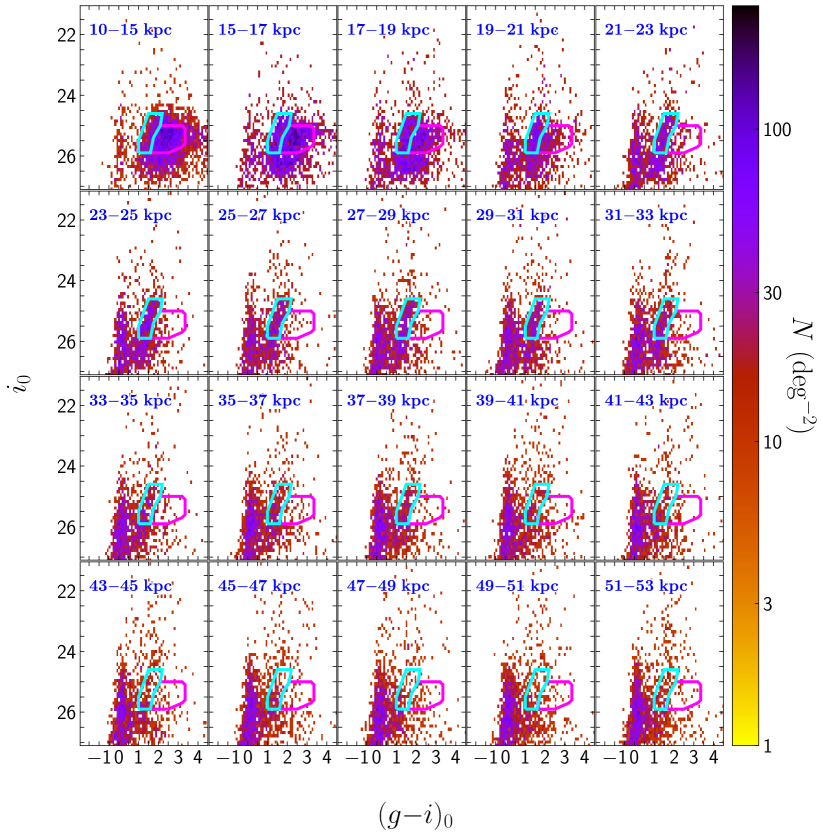
From the visual inspection, we conclude that the bRGB region starts to be dominated by background galaxies after kpc, and the rRGB region after kpc. After these thresholds, the density counts drop drastically in each respective region and we cannot see a clear RGB feature. These background thresholds are used for the rest of the analysis.
3.3 Artificial Star Tests
Before we can measure these profiles however, we need to account for completeness and crowding in our sample. As illustrated in Figure 5, there is a gap in the very central part of the galaxy due to crowding effects such that the HSC reduction pipeline was unable to extract sources reliably. There are also sources that overlap in high-density regions, especially around the first few radial bins away from the galaxy’s center. The HSC source detection pipeline is not able to locate and categorize every source with full accuracy, especially those that are blended together, making it necessary for us to account for this source of error.
In order to quantify the completeness of our sample rigorously, we ran a suite of artificial star tests (ASTs). In order to avoid the injected artificial stars from causing crowding, we inject a total of 674,980 artificial stars split into five runs of 134,996 stars each. Artificial stars were drawn from uniform grids in position, in -band magnitude between and , and color between and colors. The -band magnitudes were then calculated assuming each artificial star lies on the / stellar locus. At the input artificial source density of arcmin-2, these artificial sources do not measurably effect the measurement of the source properties by the pipeline (e.g., Smercina et al., 2020). The pipeline was then run on each of these five artificial star runs in the exact setup used to process the original observations, resulting in a list of recovered artificial stars. For our purposes, an input artificial star was declared recovered if its recovered -band magnitude was within 0.5 mag and its recovered position within of its input magnitude and position, respectively.
Our particular interest is in calculating the completeness in each of our two RGB regions (bRGB and rRGB), in the same regions of the image used to create the star count profiles (e.g. Fig. 7). We choose a set of radial bins, 5 kpc wide from 10-15 kpc and 2 kpc wide thereafter. Artificial stars in the color–magnitude regions bRGB and rRGB were analysed for each spatial region, and the fraction of those recovered was weighted by the ratio of the number of input stars to the expected luminosity function of RGB stars with their appropriate best-fit isochrones (from Fig. 4), as a function of -band magnitude. In this way, for each spatial region of interest, a single completeness for each of bRGB and rRGB stars was determined with which to scale the observed number of bRGB and rRGB stars, respectively, in each region.
4 Results
Here we present the color and median surface brightness (SB) profiles of M94’s RGB. We then use this to derive a stellar mass of M94’s halo and infer the mass accreted during its most massive-major merger.
4.1 Surface Brightness Profile
For studying resolved stellar populations in the context of mergers, typically one would like to measure only the stars along the minor axis of a galaxy since these are relatively free of contamination from in-situ stars (see Monachesi et al. 2016b; Smercina et al. 2020). Since M94 is not as highly inclined as galaxies such as M81, its minor axis traces stars in the plane of the disk, so we once again used the same circular radial regions as referenced in Section 3.3 for our analysis. We choose to analyze radial profiles out to a 70 kpc radius. For the bRGB (halo) population we adopt a background region from a 50-70 kpc projected radius, yielding a background density of 0.21 arcmin-2. The rRGB (disk) is detectable only at a much smaller radius, and a background density of 0.13 arcmin-2, determined between 30-70 kpc, was adopted.
For each radial bin, we calculate the RGB-selected and background-subtracted source density, dividing by the completeness fraction found from our AST analysis. The conversion between the number of RGB stars in the observed magnitude range to stellar mass assumes a [M/H] = () isochrone for the bRGB (rRGB) respectively and a 44% mass loss between initial and present day mass which is compatible with a Chabrier IMF. When calculating surface brightnesses, we adopt a -band mass to light ratio of 1.25, appropriate to Gyr-old populations with the range of relevant metallicities from Bruzual & Charlot (2003) single-burst models.
Formal uncertainties from counting statistics are negligible. Instead, we estimate uncertainties in our density profiles that incorporate larger-scale variations (owing to halo substructure or variations in background) by assessing the variation of our profiles as a function of azimuth. We divide the dataset into radial slices of 45 degrees wide and repeat the same background estimate and mass density calculations as before for both RGB regions. At each radius bin, we perform a bootstrap resampling analysis and chose one of the quadrant mass densities at that radius, with replacement. We repeat this 1000 times and find the 16th and 84th percentile values of the resulting distribution, which we use as the upper and lower error bars on Fig. 7.
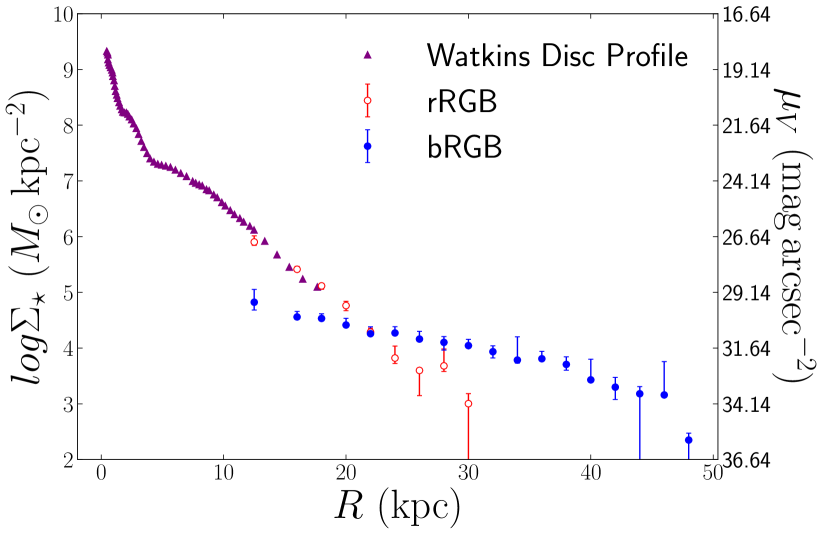
We also overplot the mass density from Watkins et al. (2016), who measured M94’s inner disk. These papers assume elliptical annuli around M94’s center, while we used circular annuli, so we adjust their given radii for this and convert to equivalent circular radii, assuming an axis ratio of b/a = 0.79 (Watkins et al., 2016). This is shown in Figure 7. The rRGB profile agrees closely with the profile of the outer disk from Watkins et al. (2016) within 20 kpc, the range where the measurements overlap. We can also see that bRGB’s profile is much flatter than rRGB’s. These stark differences leads us to affirm that bRGB and rRGB represent two different stellar populations in the galaxy. rRGB shows an exponential drop in its profile and agrees with Watkins et al. (2016)’s inner disk profile, strongly suggesting that its stars are actually in the disk of M94, while bRGB represents the halo population.
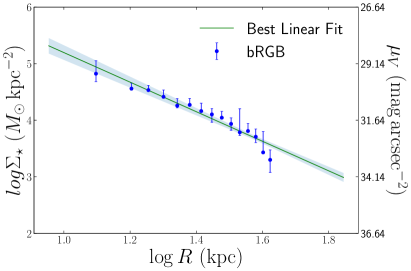
To measure the total accreted stellar mass, we fit a three-parameter power law model with intrinsic scatter following Hogg et al. 2010 from 16 – 42 kpc (Fig. 8). We use a power law of the form: with a likelihood of
where:
with being the error in the mass density in each radial bin and being the variance of the intrinsic scatter. kpc is a normalization factor that we take to be the mean of the radial bins used for fitting. We find best fit parameters of , , Following Harmsen et al. (2017), we integrate this profile from 10-40 kpc and calculate an accreted stellar mass of . Harmsen et al. (2017) uses simulated stellar halo data from Bullock & Johnston (2005) to estimate that the total accreted halo mass, , is about 3 times that of the mass between 10-40 kpc, , with variation of 40% from halo to halo. Accounting for this uncertainty in our error calculation, we extrapolate to total accreted mass following this method and get a total accreted stellar mass of .
4.2 Color Profile of the bRGB halo population
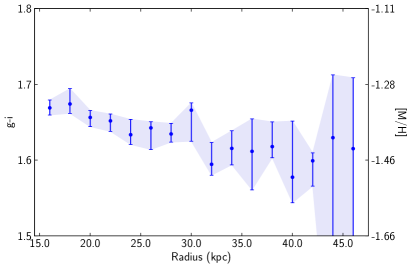
We calculate a median color and metallicity profile for bRGB using the same bins as the mass density profile. We first calculate a 2D histogram of all the sources and then estimate the area and sources in the background region (everything between 50 - 70 kpc) to get the background source color distribution. For each radial bin, we find the cumulative distribution of background Q-color weighted by the ratio of the bin area to background area, which we use to get the total number of background sources that correspond to a certain color. We then find the cumulative distribution of bRGB stars in each bin and subtract the cumulative background distribution normalized to the area of the radial bin and find the median of this background-subtracted distribution, converting back to color. The resulting color profile is shown in Figure 9. We estimate a metallicity gradient of slope dex/kpc between 16 and 40 kpc.
The color gradient is mag/kpc. Assuming 10 Gyr old stellar populations, and recalling that RGB color is a very weak function of age, the color should correspond to the metallicity of the population, shown schematically on the right-hand side of Fig. 9. While the mapping to metallicity is non-linear, in the color range relevant to M94’s bRGB population a metallicity gradient of dex/kpc is implied, if the color gradient is interpreted as being due to metallicity alone. To compare this with other halos requires translating to the HST passbands used in Monachesi et al. (2016a) and Harmsen et al. (2017). A linear fit to vs. for stars with HST measurements in the rough color range around gives a fit ; correspondingly, the implied color gradient in is mag/kpc. This color gradient is rather mild, similar to galaxies like the Milky Way, NGC 253 or NGC 4945.
5 Discussion
5.1 M94’s Stellar Halo
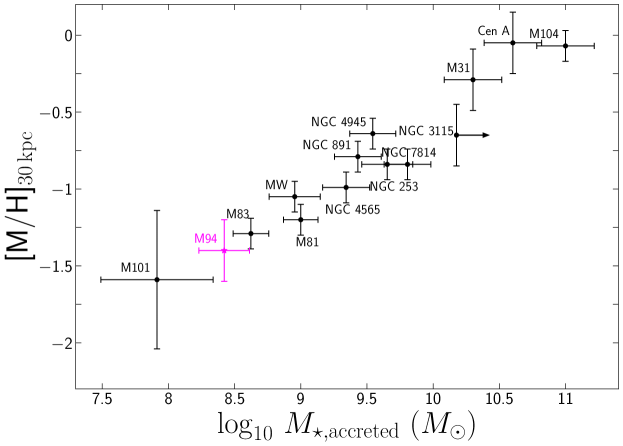
We follow numerous past works and use M94’s stellar halo properties to make inferences about its merger history, e.g. (Bell et al., 2017, and references therein). We show M94’s halo in context of the observed stellar halo metallicity–mass relation for 14 nearby MW-stellar mass galaxies in Figure 10, which was first discussed in Harmsen et al. (2017). Since RGB color is affected primarily by [M/H] and not [Fe/H] (Streich et al., 2014), we use the -agnostic [M/H] instead of converting our measurement to [Fe/H]. M94 follows the halo metallicity–mass correlation well and contains one of the least massive and most metal-poor halos compared to these other disk galaxies, with only M101 harboring a smaller, more anemic halo. This generally agrees with the general expectations from theoretical accretion-only models wherein the halo is accreted from the merger of its last satellite progenitors, and that a smaller halo is formed through the aggregation of a few less-massive satellites instead of being dominated by a single very massive merger (Monachesi et al., 2019). This also points to M94 likely having a more quiescent and quiet merger history compared to the majority of local MW-stellar mass galaxies (Deason et al., 2015a).
D’Souza & Bell (2018) found a correlation between the mass of a galaxy’s dominant merger, , and the halo’s total accreted stellar mass, , (see also Zhu et al. 2022). This assumed that only a fraction, frac, of the accreted mass is contributed to the stellar halo by the dominant merging partner. For the majority of galaxies that fall a slight ways below a 1-to-1 line on the plane, frac is less than 1. In most cases, the accreted halo mass is greater than the mass of the dominant progenitor . This is especially true at the lower mass end of and indicates that the halo contains contributions from a number of other merger events, consistent with our idea of the hierarchical build-up of galaxies. In order to estimate the mass of M94’s dominant merger partner, we follow D’Souza & Bell (2018) and correlate the dominant merger mass with the total accreted stellar mass for galaxies taken from the Illustris simulation suite (Genel et al., 2014; Vogelsberger et al., 2014a, b), chosen to have dark matter halo masses of . We fit this distribution with a line, and infer the mass of M94’s dominant merger from our accreted mass calculated in Section 4.1. The uncertainty in the dominant mass estimate is taken as a sum in quadrature of the intrinsic scatter in the distribution and the uncertainty of the measured accreted mass. The resulting dominant stellar mass is estimated to be . The Small Magellanic Cloud’s (SMC) stellar mass is (McConnachie 2012); M94’s most massive merger partner is likely to be less likely than even the SMC.

5.2 Psuedobulge Inferences
Thus we see that M94 is characterized by an inactive merger history which gives rise to its small, metal-poor halo. Two other nearby galaxies, M83 (, Cosby et al., in prep) and M101 (, Jang et al. 2020), exhibit this same type of quiet merger history. Yet all three of these galaxies have very different bulge masses. While M94’s pseudobulge is massive (Trujillo et al. 2009, almost ), there is no evidence for a classical bulge in either M101 (Kormendy et al., 2010) or M83 (de Jong et al. 2008, Fisher & Drory 2010); both galaxies hosting small () pseudobulges. These three galaxies — with outwardly very similar merger histories — have such wildly dissimilar bulge properties, suggesting that the mass of a galaxy’s dominant merger is not simply correlated with the mass or properties of its bulge.
We connect M94 to the broader population of galaxies with measured halos and bulges in Figure 12, with galaxies marked as having either a classical bulge or a pseudobulge. If we take the halo stellar mass to act as a proxy for the mass of a galaxy’s dominant merger, then we see that almost every other pseudobulge-hosting galaxy in our Local Universe underwent a larger merger than M94, and yet hosts less massive bulges. This adds evidence to the picture that mergers are not the primary drivers of pseudobulge creation, and any role that they play in determining its properties would be complicated and intertwined with other, secular processes that are on-going within the galaxy (Bell et al., 2017; Gargiulo et al., 2019, 2022). Indeed, gas flows in so-called “oval distortions” like the kind M94 has can be a major impetus for the formation of pseudobulges (Speights et al., 2019) and can also fuel star-forming rings and enhance star-formation in general (Athanassoula & Palous, 1984; Mulder & Combes, 1996; Li et al., 2016). M94 currently has about equal fractions of intermediate-age and old-age stars in its pseudobulge, found by taking spectra within its central 1” x 1.1” region (Cid Fernandes et al., 2004; Mason et al., 2015), indicating semi-recent star-formation, potentially from gas driven inward from a Lindblad resonance (Wong & Blitz, 2001; Trujillo et al., 2009).
What makes M94 even more interesting is features such as its warped disk, with its HI disk misaligned with its optical counterpart and differential alignment of its inner disk (oval distortion) and outer disk, and its highly non-circular motions (de Blok et al., 2008; Walter et al., 2008; Trujillo et al., 2009). Trujillo et al. (2009) rules out merger as an explanation for M94’s differential inclination, citing merger simulations that give too low of a resulting inclination to match observations. Instead, Trujillo et al. (2009) note that the inclination discrepancy in this case goes away if the “inner disk” is an oval distortion, so it has a completely different ellipticity than the outer disk. And while merger is a common explanation for irregularities in galactic morphology, given our inferences regarding M94’s quiet merger history, the presence of these features indicate that the gas morphology of a galaxy can be strongly distorted by processes that involve no merger with an established galaxy. M94 would not be the only curious example – galaxies such as M83 have been found to also harbor a warped and disturbed disk (Barnes et al., 2014; Heald et al., 2016), yet have no sign of a recent large merger event (Cosby et al., in prep).

5.3 Satellite Populations
The measure of M94’s accreted and dominant merger masses has also been used to gain insight into the satellite populations of MW-stellar mass galaxies. Satellite luminosity functions have now been measured for a substantial number of Local Volume galaxies, finding a large range in the number of satellites in each group (Smercina et al. 2018, Müller et al. 2019, Carlsten et al. 2020; see Carlsten et al. 2022 for an overview), where M94 is a particularly extreme example, having only two classical satellites (Smercina et al., 2018). The number of satellites appears to vary with the host galaxy’s stellar mass (Carlsten et al., 2020) as would be expected with a scaling with overall dark matter halo mass. Yet, considerable scatter remains, and has been claimed to correlate with several different measures that relate to a group’s merger history: ‘tidal index’ — a measure of enviromental density (D. Sand, priv. comm.), magnitude gap (Kim et al., 2022), and the mass of the galaxy’s most massive past merger (Smercina et al., 2022). While simulations do not yet show such behavior (Smercina et al., 2022), such correlations may broadly reflect the delivery of satellites in large merger events (Deason et al., 2015b; D’Souza & Bell, 2021). Owing to M94’s low number of satellites, it has particular constraining power in such correlations, and M94’s combination of low halo mass (thus low-mass dominant merger) and low satellite number are consistent with the view that satellite number correlates with merger mass (Smercina et al., 2022).
6 Conclusions
In this paper, we characterize the stellar halo of the spiral galaxy M94 (NGC 4736). M94 is unique in that it contains the largest pseudobulge in the Local Universe. The evolution of central structures such as bulges and pseudobulges hinge on the interplay of both secular and non-secular processes. Therefore, we use M94’s stellar halo as a fossil record of its previous merger history to infer how much impact it could have had on the formation of M94’s massive pseudobulge.
We use deep, high resolution data from Subaru’s Hyper Suprime-Cam (HSC) to distinguish between stars and galaxies using both size and color–color criteria. The color–magnitude diagram of these sources showed two clear red giant branches — one relatively blue (bRGB) and one substantially redder (rRGB). After correcting for completeness, the surface density profile of the rRGB is consistent with that of M94’s outer disk (Watkins et al., 2016), while the bRGB has a profile and structure consistent with a metal-poor stellar halo.
Integrating the halo profile from 10 – 40 kpc, we estimate a total accreted stellar mass of . Using the relation between and the accreted mass from D’Souza & Bell (2018), we infer that the mass of M94’s dominant merger is roughly , which is smaller than the SMC, indicating that M94 likely underwent a very quiet merger history compared to other local galaxies such as the MW, M81 or M31. We also calculated a color and metallicity profile of the halo, showing that M94 hosts one of the most metal-poor MW-stellar mass galaxy halos in the Local Universe (comparable to only M101), with a median metallicity at 30 kpc to be [M/H] . Therefore, we infer that M94’s pseudobulge and other interesting morphological features were not significantly impacted by its most major merger. In fact, every other galaxy in the Local Universe that has a pseudobulge hosts a smaller pseudobulge than M94’s, despite having undergone a larger merger, indicating that other processes are most likely the major stimuli for its creation and growth. Given our inferences, this would also have larger implications on galaxy formation and evolution: we now theorize that M94, M101, and M83 underwent similarly inactive merger histories, with very low-mass dominant mergers, and yet the three galaxies have completely different central structures, in particular their pseudobulges. This supports the picture that that there is a more complex mechanism which determines a galaxy’s structural properties and that merger history cannot always reliably indicate what structure a galaxy will form.
7 Acknowledgements
This work was partly supported by the National Science Foundation through grant NSF-AST 2007065 and by the WFIRST Infrared Nearby Galaxies Survey (WINGS) collaboration through NASA grant NNG16PJ28C through subcontract from the University of Washington. AM gratefully acknowledges support by FONDECYT Regular grant 1212046 and by the ANID BASAL project FB210003, as well as funding from the Max Planck Society through a ”PartnerGroup” grant. This research has made use of NASA’s Astrophysics Data System Bibliographic Services.
Based on observations utilizing Pan-STARRS1 Survey. The Pan-STARRS1 Surveys (PS1) and the PS1 public science archive have been made possible through contributions by the Institute for Astronomy, the University of Hawaii, the Pan-STARRS Project Office, the Max-Planck Society and its participating institutes, the Max Planck Institute for Astronomy, Heidelberg and the Max Planck Institute for Extraterrestrial Physics, Garching, The Johns Hopkins University, Durham University, the University of Edinburgh, the Queen’s University Belfast, the Harvard-Smithsonian Center for Astrophysics, the Las Cumbres Observatory Global Telescope Network Incorporated, the National Central University of Taiwan, the Space Telescope Science Institute, the National Aeronautics and Space Administration under Grant No. NNX08AR22G issued through the Planetary Science Division of the NASA Science Mission Directorate, the National Science Foundation Grant No. AST-1238877, the University of Maryland, Eotvos Lorand University (ELTE), the Los Alamos National Laboratory, and the Gordon and Betty Moore Foundation.
Based on observations obtained at the Subaru Observatory, which is operated by the National Astronomical Observatory of Japan, via the Gemini/Subaru Time Exchange Program. We thank the Subaru support staff for invaluable help preparing and carrying out the observing run.
The authors wish to recognize and acknowledges the very significant cultural role and reverence that the summit of Maunakea has always had within the indigenous Hawaiian community. We are most fortunate to have the opportunity to conduct observations from this mountain.
References
- Astropy Collaboration et al. (2013) Astropy Collaboration, Robitaille, T. P., Tollerud, E. J., et al. 2013, A&A, 558, A33, doi: 10.1051/0004-6361/201322068
- Athanassoula (2005) Athanassoula, E. 2005, MNRAS, 358, 1477, doi: 10.1111/j.1365-2966.2005.08872.x
- Athanassoula & Palous (1984) Athanassoula, E., & Palous, J. 1984, Bulletin of the Astronomical Institutes of Czechoslovakia, 35, 380
- Bailin (2003) Bailin, J. 2003, ApJ, 583, L79, doi: 10.1086/368160
- Barnes & Hernquist (1992) Barnes, J. E., & Hernquist, L. 1992, ARA&A, 30, 705, doi: 10.1146/annurev.aa.30.090192.003421
- Barnes et al. (2014) Barnes, K. L., van Zee, L., Dale, D. A., et al. 2014, ApJ, 789, 126, doi: 10.1088/0004-637X/789/2/126
- Barway et al. (2020) Barway, S., Mayya, Y. D., & Robleto-Orús, A. 2020, MNRAS, 497, 44, doi: 10.1093/mnras/staa1887
- Bell et al. (2017) Bell, E. F., Monachesi, A., Harmsen, B., et al. 2017, The Astrophysical Journal, 837, L8, doi: 10.3847/2041-8213/aa6158
- Belokurov et al. (2018) Belokurov, V., Erkal, D., Evans, N. W., Koposov, S. E., & Deason, A. J. 2018, Monthly Notices of the Royal Astronomical Society, 478, 611–619, doi: 10.1093/mnras/sty982
- Bosch et al. (2018) Bosch, J., Armstrong, R., Bickerton, S., et al. 2018, PASJ, 70, S5, doi: 10.1093/pasj/psx080
- Bressan et al. (2012) Bressan, A., Marigo, P., Girardi, L., et al. 2012, Monthly Notices of the Royal Astronomical Society, 427, 127, doi: 10.1111/j.1365-2966.2012.21948.x
- Brooks & Christensen (2016) Brooks, A., & Christensen, C. 2016, Galactic Bulges, 317–353, doi: 10.1007/978-3-319-19378-6_12
- Bruzual & Charlot (2003) Bruzual, G., & Charlot, S. 2003, MNRAS, 344, 1000, doi: 10.1046/j.1365-8711.2003.06897.x
- Bullock & Johnston (2005) Bullock, J. S., & Johnston, K. V. 2005, ApJ, 635, 931, doi: 10.1086/497422
- Bullock et al. (2001) Bullock, J. S., Kravtsov, A. V., & Weinberg, D. H. 2001, The Astrophysical Journal, 548, 33–46, doi: 10.1086/318681
- Carlsten et al. (2020) Carlsten, S. G., Greco, J. P., Beaton, R. L., & Greene, J. E. 2020, ApJ, 891, 144, doi: 10.3847/1538-4357/ab7758
- Carlsten et al. (2022) Carlsten, S. G., Greene, J. E., Beaton, R. L., Danieli, S., & Greco, J. P. 2022, arXiv e-prints, arXiv:2203.00014. https://arxiv.org/abs/2203.00014
- Cid Fernandes et al. (2004) Cid Fernandes, R., González Delgado, R. M., Schmitt, H., et al. 2004, ApJ, 605, 105, doi: 10.1086/382217
- Combes (2005) Combes, F. 2005, arXiv e-prints, astro. https://arxiv.org/abs/astro-ph/0506265
- Combes (2009) Combes, F. 2009, Secular evolution and the assembly of bulges. https://arxiv.org/abs/0901.0178
- Conselice et al. (2008) Conselice, C. J., Rajgor, S., & Myers, R. 2008, Monthly Notices of the Royal Astronomical Society, 386, 909
- Cooper et al. (2010) Cooper, A. P., Cole, S., Frenk, C. S., et al. 2010, MNRAS, 406, 744, doi: 10.1111/j.1365-2966.2010.16740.x
- Covey et al. (2007) Covey, K. R., Ivezić, Ž ., Schlegel, D., et al. 2007, The Astronomical Journal, 134, 2398, doi: 10.1086/522052
- Crnojević et al. (2016) Crnojević, D., Sand, D. J., Spekkens, K., et al. 2016, The Astrophysical Journal, 823, 19, doi: 10.3847/0004-637x/823/1/19
- Davenport et al. (2014) Davenport, J. R. A., Ivezić, Ž., Becker, A. C., et al. 2014, MNRAS, 440, 3430, doi: 10.1093/mnras/stu466
- de Blok et al. (2008) de Blok, W. J. G., Walter, F., Brinks, E., et al. 2008, The Astronomical Journal, 136, 2648, doi: 10.1088/0004-6256/136/6/2648
- de Jong et al. (2008) de Jong, R. S., Radburn-Smith, D. J., & Sick, J. N. 2008, in Astronomical Society of the Pacific Conference Series, Vol. 396, Formation and Evolution of Galaxy Disks, ed. J. G. Funes & E. M. Corsini, 187. https://arxiv.org/abs/0710.5511
- De Lucia & Helmi (2008) De Lucia, G., & Helmi, A. 2008, Monthly Notices of the Royal Astronomical Society, 391, 14–31, doi: 10.1111/j.1365-2966.2008.13862.x
- Deason et al. (2015a) Deason, A. J., Belokurov, V., & Weisz, D. R. 2015a, MNRAS, 448, L77, doi: 10.1093/mnrasl/slv001
- Deason et al. (2015b) Deason, A. J., Wetzel, A. R., Garrison-Kimmel, S., & Belokurov, V. 2015b, MNRAS, 453, 3568, doi: 10.1093/mnras/stv1939
- D’Souza & Bell (2018) D’Souza, R., & Bell, E. F. 2018, Monthly Notices of the Royal Astronomical Society, 474, 5300, doi: 10.1093/mnras/stx3081
- D’Souza & Bell (2021) D’Souza, R., & Bell, E. F. 2021, MNRAS, 504, 5270, doi: 10.1093/mnras/stab1283
- D’Souza & Bell (2018) D’Souza, R., & Bell, E. F. 2018, Nature Astronomy, 2, 737–743, doi: 10.1038/s41550-018-0533-x
- Eliche-Moral et al. (2006) Eliche-Moral, M. C., Balcells, M., Aguerri, J. A. L., & González-García, A. C. 2006, A&A, 457, 91, doi: 10.1051/0004-6361:20065394
- Eliche-Moral et al. (2011) Eliche-Moral, M. C., González-García, A. C., Balcells, M., et al. 2011, A&A, 533, A104, doi: 10.1051/0004-6361/201116509
- Fisher & Drory (2010) Fisher, D. B., & Drory, N. 2010, The Astrophysical Journal, 716, 942–969, doi: 10.1088/0004-637x/716/2/942
- Font et al. (2006) Font, A. S., Johnston, K. V., Bullock, J. S., & Robertson, B. E. 2006, ApJ, 646, 886, doi: 10.1086/505131
- Gallart et al. (2019) Gallart, C., Bernard, E. J., Brook, C. B., et al. 2019, Nature Astronomy, 3, 932–939, doi: 10.1038/s41550-019-0829-5
- Gargiulo et al. (2019) Gargiulo, I. D., Monachesi, A., Gómez, F. A., et al. 2019, MNRAS, 489, 5742, doi: 10.1093/mnras/stz2536
- Gargiulo et al. (2022) —. 2022, MNRAS, 512, 2537, doi: 10.1093/mnras/stac629
- Genel et al. (2014) Genel, S., Vogelsberger, M., Springel, V., et al. 2014, MNRAS, 445, 175, doi: 10.1093/mnras/stu1654
- Governato et al. (2009) Governato, F., Brook, C. B., Brooks, A. M., et al. 2009, MNRAS, 398, 312, doi: 10.1111/j.1365-2966.2009.15143.x
- Guedes et al. (2013) Guedes, J., Mayer, L., Carollo, M., & Madau, P. 2013, The Astrophysical Journal, 772, 36, doi: 10.1088/0004-637x/772/1/36
- Hammer et al. (2018) Hammer, F., Yang, Y. B., Wang, J. L., et al. 2018, Monthly Notices of the Royal Astronomical Society, 475, 2754–2767, doi: 10.1093/mnras/stx3343
- Harmsen et al. (2017) Harmsen, B., Monachesi, A., Bell, E. F., et al. 2017, Monthly Notices of the Royal Astronomical Society, 466, 1491, doi: 10.1093/mnras/stw2992
- Harris et al. (2020) Harris, C. R., Millman, K. J., van der Walt, S. J., et al. 2020, Nature, 585, 357, doi: 10.1038/s41586-020-2649-2
- Heald et al. (2016) Heald, G., de Blok, W. J. G., Lucero, D., et al. 2016, MNRAS, 462, 1238, doi: 10.1093/mnras/stw1698
- Helmi et al. (2018) Helmi, A., Babusiaux, C., Koppelman, H. H., et al. 2018, Nature, 563, 85–88, doi: 10.1038/s41586-018-0625-x
- Herrmann et al. (2009) Herrmann, K. A., Ciardullo, R., & Sigurdsson, S. 2009, ApJ, 693, L19, doi: 10.1088/0004-637X/693/1/L19
- High et al. (2009) High, F. W., Stubbs, C. W., Rest, A., Stalder, B., & Challis, P. 2009, The Astronomical Journal, 138, 110, doi: 10.1088/0004-6256/138/1/110
- Hogg et al. (2010) Hogg, D. W., Bovy, J., & Lang, D. 2010, arXiv e-prints, arXiv:1008.4686. https://arxiv.org/abs/1008.4686
- Hopkins et al. (2010) Hopkins, P. F., Bundy, K., Croton, D., et al. 2010, ApJ, 715, 202, doi: 10.1088/0004-637X/715/1/202
- Hunter (2007) Hunter, J. D. 2007, Computing in Science Engineering, 9, 90, doi: 10.1109/MCSE.2007.55
- Ibata et al. (2013) Ibata, R. A., Lewis, G. F., McConnachie, A. W., et al. 2013, The Astrophysical Journal, 780, 128, doi: 10.1088/0004-637x/780/2/128
- Ivezić et al. (2007) Ivezić, Ž ., Smith, J. A., Miknaitis, G., et al. 2007, The Astronomical Journal, 134, 973, doi: 10.1086/519976
- Izquierdo-Villalba et al. (2019) Izquierdo-Villalba, D., Bonoli, S., Spinoso, D., et al. 2019, Monthly Notices of the Royal Astronomical Society, 488, 609–632, doi: 10.1093/mnras/stz1694
- Jang et al. (2020) Jang, I. S., De Jong, R. S., Holwerda, B. W., et al. 2020, Astronomy and Astrophysics, 637, doi: 10.1051/0004-6361/201936994
- Karachentsev et al. (2004) Karachentsev, I. D., Karachentseva, V. E., Huchtmeier, W. K., & Makarov, D. I. 2004, AJ, 127, 2031, doi: 10.1086/382905
- Kauffmann et al. (1999) Kauffmann, G., Colberg, J. M., Diaferio, A., & White, S. D. M. 1999, MNRAS, 303, 188, doi: 10.1046/j.1365-8711.1999.02202.x
- Keselman & Nusser (2012) Keselman, J. A., & Nusser, A. 2012, MNRAS, 424, 1232, doi: 10.1111/j.1365-2966.2012.21300.x
- Kim et al. (2022) Kim, Y. J., Kang, J., Lee, M. G., & Jang, I. S. 2022, ApJ, 929, 36, doi: 10.3847/1538-4357/ac58f3
- Kluyver et al. (2016) Kluyver, T., Ragan-Kelley, B., Pérez, F., et al. 2016, in Positioning and Power in Academic Publishing: Players, Agents and Agendas, ed. F. Loizides & B. Schmidt, IOS Press, 87 – 90
- Kormendy (1979) Kormendy, J. 1979, ApJ, 227, 714, doi: 10.1086/156782
- Kormendy (2007) Kormendy, J. 2007, Proceedings of the International Astronomical Union, 3, 107–112, doi: 10.1017/s1743921308017407
- Kormendy et al. (2010) Kormendy, J., Drory, N., Bender, R., & Cornell, M. E. 2010, The Astrophysical Journal, 723, 54–80, doi: 10.1088/0004-637x/723/1/54
- Kormendy & Fisher (2008) Kormendy, J., & Fisher, D. B. 2008, in Astronomical Society of the Pacific Conference Series, Vol. 396, Formation and Evolution of Galaxy Disks, ed. J. G. Funes & E. M. Corsini, 297. https://arxiv.org/abs/0810.2534
- Kormendy & Kennicutt (2004) Kormendy, J., & Kennicutt, R. C. 2004, Annual Review of Astronomy and Astrophysics, 42, 603, doi: 10.1146/annurev.astro.42.053102.134024
- Li et al. (2016) Li, Z., Gerhard, O., Shen, J., Portail, M., & Wegg, C. 2016, ApJ, 824, 13, doi: 10.3847/0004-637X/824/1/13
- Licquia & Newman (2015) Licquia, T. C., & Newman, J. A. 2015, ApJ, 806, 96, doi: 10.1088/0004-637X/806/1/96
- López-Corredoira (2006) López-Corredoira, M. 2006, MNRAS, 369, 1911, doi: 10.1111/j.1365-2966.2006.10435.x
- López-Corredoira et al. (2002) López-Corredoira, M., Cabrera-Lavers, A., Garzón, F., & Hammersley, P. L. 2002, A&A, 394, 883, doi: 10.1051/0004-6361:20021175
- Magnier et al. (2013) Magnier, E. A., Schlafly, E., Finkbeiner, D., et al. 2013, ApJS, 205, 20, doi: 10.1088/0067-0049/205/2/20
- Martínez-Delgado et al. (2010) Martínez-Delgado, D., Gabany, R. J., Crawford, K., et al. 2010, The Astronomical Journal, 140, 962–967, doi: 10.1088/0004-6256/140/4/962
- Mason et al. (2015) Mason, R. E., Rodríguez-Ardila, A., Martins, L., et al. 2015, ApJS, 217, 13, doi: 10.1088/0067-0049/217/1/13
- McCarthy et al. (2012) McCarthy, I. G., Font, A. S., Crain, R. A., et al. 2012, MNRAS, 420, 2245, doi: 10.1111/j.1365-2966.2011.20189.x
- McConnachie (2012) McConnachie, A. W. 2012, The Astronomical Journal, 144, 4, doi: 10.1088/0004-6256/144/1/4
- Merritt et al. (2016) Merritt, A., Dokkum, P. v., Abraham, R., & Zhang, J. 2016, The Astrophysical Journal, 830, 62, doi: 10.3847/0004-637x/830/2/62
- Miyazaki et al. (2018) Miyazaki, S., Komiyama, Y., Kawanomoto, S., et al. 2018, PASJ, 70, S1, doi: 10.1093/pasj/psx063
- Moellenhoff et al. (1995) Moellenhoff, C., Matthias, M., & Gerhard, O. E. 1995, A&A, 301, 359. https://arxiv.org/abs/astro-ph/9503032
- Monachesi et al. (2016a) Monachesi, A., Bell, E. F., Radburn-Smith, D. J., et al. 2016a, Monthly Notices of the Royal Astronomical Society, 457, 1419, doi: 10.1093/mnras/stv2987
- Monachesi et al. (2016b) Monachesi, A., Gómez, F. A., Grand, R. J., et al. 2016b, Monthly Notices of the Royal Astronomical Society: Letters, 459, L46, doi: 10.1093/mnrasl/slw052
- Monachesi et al. (2019) Monachesi, A., Gómez, F. A., Grand, R. J. J., et al. 2019, MNRAS, 485, 2589, doi: 10.1093/mnras/stz538
- Moster et al. (2010) Moster, B. P., Macciò, A. V., Somerville, R. S., Johansson, P. H., & Naab, T. 2010, MNRAS, 403, 1009, doi: 10.1111/j.1365-2966.2009.16190.x
- Mulder & Combes (1996) Mulder, P. S., & Combes, F. 1996, A&A, 313, 723
- Müller et al. (2019) Müller, O., Rejkuba, M., Pawlowski, M. S., et al. 2019, A&A, 629, A18, doi: 10.1051/0004-6361/201935807
- Okamoto et al. (2015) Okamoto, S., Arimoto, N., Ferguson, A. M. N., et al. 2015, ApJ, 809, L1, doi: 10.1088/2041-8205/809/1/L1
- Okamoto (2012) Okamoto, T. 2012, Monthly Notices of the Royal Astronomical Society, 428, 718–728, doi: 10.1093/mnras/sts067
- Patel et al. (2017) Patel, E., Besla, G., & Sohn, S. T. 2017, MNRAS, 464, 3825, doi: 10.1093/mnras/stw2616
- Poggio et al. (2020) Poggio, E., Drimmel, R., Andrae, R., et al. 2020, Nature Astronomy, 4, 590, doi: 10.1038/s41550-020-1017-3
- Purcell et al. (2007) Purcell, C. W., Bullock, J. S., & Zentner, A. R. 2007, The Astrophysical Journal, 666, 20–33, doi: 10.1086/519787
- Radburn-Smith et al. (2011) Radburn-Smith, D. J., de Jong, R. S., Seth, A. C., et al. 2011, ApJS, 195, 18, doi: 10.1088/0067-0049/195/2/18
- Renzini (1999) Renzini, A. 1999, in The Formation of Galactic Bulges, ed. C. M. Carollo, H. C. Ferguson, & R. F. G. Wyse, 9. https://arxiv.org/abs/astro-ph/9902108
- Schlafly & Finkbeiner (2011) Schlafly, E. F., & Finkbeiner, D. P. 2011, ApJ, 737, 103, doi: 10.1088/0004-637X/737/2/103
- Schlegel et al. (1998) Schlegel, D. J., Finkbeiner, D. P., & Davis, M. 1998, ApJ, 500, 525, doi: 10.1086/305772
- Smercina et al. (2018) Smercina, A., Bell, E. F., Price, P. A., et al. 2018, The Astrophysical Journal, 863, 152, doi: 10.3847/1538-4357/aad2d6
- Smercina et al. (2022) Smercina, A., Bell, E. F., Samuel, J., & D’Souza, R. 2022, ApJ, 930, 69, doi: 10.3847/1538-4357/ac5d56
- Smercina et al. (2020) Smercina, A., Bell, E. F., Price, P. A., et al. 2020, The Astrophysical Journal, 905, 60
- Somerville & Davé (2015) Somerville, R. S., & Davé, R. 2015, Annual Review of Astronomy and Astrophysics, 53, 51
- Speights et al. (2019) Speights, J. C., Godwin, C., Reimer, R., Benton, A., & Lemaire, R. 2019, ApJ, 883, 77, doi: 10.3847/1538-4357/ab3b54
- Spitzer & Shapiro (1972) Spitzer, Lyman, J., & Shapiro, S. L. 1972, ApJ, 173, 529, doi: 10.1086/151442
- Stinson et al. (2010) Stinson, G. S., Bailin, J., Couchman, H., et al. 2010, MNRAS, 408, 812, doi: 10.1111/j.1365-2966.2010.17187.x
- Streich et al. (2014) Streich, D., de Jong, R. S., Bailin, J., et al. 2014, A&A, 563, A5, doi: 10.1051/0004-6361/201220956
- Trachternach et al. (2008) Trachternach, C., de Blok, W. J. G., Walter, F., Brinks, E., & Kennicutt, R. C., J. 2008, AJ, 136, 2720, doi: 10.1088/0004-6256/136/6/2720
- Trujillo et al. (2009) Trujillo, I., Martinez-Valpuesta, I., Martínez-Delgado, D., et al. 2009, The Astrophysical Journal, 704, 618–628, doi: 10.1088/0004-637x/704/1/618
- van Dokkum et al. (2014) van Dokkum, P. G., Abraham, R., & Merritt, A. 2014, The Astrophysical Journal, 782, L24, doi: 10.1088/2041-8205/782/2/l24
- Van Rossum & Drake (2009) Van Rossum, G., & Drake, F. L. 2009, Python 3 Reference Manual (Scotts Valley, CA: CreateSpace)
- Virtanen et al. (2020) Virtanen, P., Gommers, R., Oliphant, T. E., et al. 2020, Nature Methods, 17, 261, doi: 10.1038/s41592-019-0686-2
- Vogelsberger et al. (2014a) Vogelsberger, M., Genel, S., Springel, V., et al. 2014a, Nature, 509, 177, doi: 10.1038/nature13316
- Vogelsberger et al. (2014b) —. 2014b, MNRAS, 444, 1518, doi: 10.1093/mnras/stu1536
- Walter et al. (2008) Walter, F., Brinks, E., de Blok, W. J. G., et al. 2008, AJ, 136, 2563, doi: 10.1088/0004-6256/136/6/2563
- Watkins et al. (2016) Watkins, A. E., Mihos, J. C., & Harding, P. 2016, The Astrophysical Journal, 826, 59, doi: 10.3847/0004-637x/826/1/59
- Weisz et al. (2019) Weisz, D. R., Dolphin, A. E., Martin, N. F., et al. 2019, Monthly Notices of the Royal Astronomical Society, 489, 763–770, doi: 10.1093/mnras/stz1984
- White & Rees (1978) White, S. D. M., & Rees, M. J. 1978, MNRAS, 183, 341, doi: 10.1093/mnras/183.3.341
- Williams et al. (2017) Williams, B. F., Dolphin, A. E., Dalcanton, J. J., et al. 2017, The Astrophysical Journal, 846, 145
- Wong & Blitz (2000) Wong, T., & Blitz, L. 2000, ApJ, 540, 771, doi: 10.1086/309368
- Wong & Blitz (2001) —. 2001, Ap&SS, 276, 659, doi: 10.1023/A:1017560421188
- Younger et al. (2007) Younger, J. D., Cox, T. J., Seth, A. C., & Hernquist, L. 2007, ApJ, 670, 269, doi: 10.1086/521976
- Zhu et al. (2022) Zhu, L., Pillepich, A., van de Ven, G., et al. 2022, Mass of the dynamically hot inner stellar halo predicts the ancient accreted stellar mass. https://arxiv.org/abs/2110.13172