Research \authorfooter Haotian Li and Huamin Qu are with the Hong Kong University of Science and Technology. E-mail: haotian.li@connect.ust.hk and huamin@cse.ust.hk. Yun Wang is with Microsoft Research Asia. E-mail: wangyun@microsoft.com. Yun Wang is the corresponding author. Q. Vera Liao is with Microsoft Research Montréal. E-mail: veraliao@microsoft.com.
Why is AI not a Panacea for Data Workers?
An Interview Study on Human-AI Collaboration in Data Storytelling
Abstract
Data storytelling plays an important role in data workers’ daily jobs since it boosts team collaboration and public communication. However, to make an appealing data story, data workers spend tremendous efforts on various tasks, including outlining and styling the story. Recently, a growing research trend has been exploring how to assist data storytelling with advanced artificial intelligence (AI). However, existing studies may focus on individual tasks in the workflow of data storytelling and do not reveal a complete picture of humans’ preference for collaborating with AI. To better understand real-world needs, we interviewed eighteen data workers from both industry and academia to learn where and how they would like to collaborate with AI. Surprisingly, though the participants showed excitement about collaborating with AI, many of them also expressed reluctance and pointed out nuanced reasons. Based on their responses, we first characterize stages and tasks in the practical data storytelling workflows and the desired roles of AI. Then the preferred collaboration patterns in different tasks are identified. Next, we summarize the interviewees’ reasons why and why not they would like to collaborate with AI. Finally, we provide suggestions for human-AI collaborative data storytelling to hopefully shed light on future related research.
keywords:
Data storytelling, human-AI collaboration, interview study1 Introduction
In the era of big data, data analysis has become a routine task for many data workers, such as business analysts, data journalists, and researchers. According to previous research [26, 65, 1], the workflow of data analysis involves multiple steps, including data collection, cleaning, exploration, modeling, and communication111Data storytelling and data communication are interchangeable in this paper.. Among these steps, communicating data findings has a crucial role in boosting collaboration in teams [8], conveying messages to clients [23], raising public awareness [31], and so on.
However, communicating data findings is challenging for data workers. They have to spend substantial effort preparing clear, coherent, and engaging data stories to effectively communicate their results to the target audience. Informed by the advance of artificial intelligence (AI), including the recent development of large-scale AI models (e.g., DALL·E [38] and ChatGPT [39]), researchers have attempted to tackle the challenge by introducing AI-powered data storytelling tools. However, most of the existing tools are limited to studying human-AI collaboration in specific steps. For example, Calliope [48] and Erato [53] help humans to create story outlines. InfoColorizer [68] and ColorCook [49] utilize AI models to suggest color usage. These studies failed to present an overall picture of where and how humans would like to collaborate with AI in the entire storytelling workflow.
To better leverage the powerful AI capabilities in intelligent tools, the philosophy of human-centered design [12] informs the necessity of a comprehensive understanding of data workers’ needs, workflows, and attitudes toward AI, rather than making assumptions about where, how, and even whether these tools should be developed. With this in mind, we conducted an interview study involving data workers, aiming to illuminate future research directions for intelligent tools, particularly in the context of supporting data storytelling.
We focused on three research questions in our interview study. The first question is where would humans like to collaborate with AI in the data storytelling workflow? The answers to this question can potentially guide the selection of tasks that the tools target. After identifying the tasks, a follow-up point of consideration is how to design the functionality of AI models in these tools. To support it, we proposed the second research question, how would humans like to collaborate with AI? To answer the research questions, we conducted interviews with 18 data workers with diverse backgrounds. Overall, our interviewees demonstrated a positive attitude in collaborating with AI in data storytelling. However, they also expressed their deep concerns that slowed their pace of introducing AI to their entire storytelling workflow. As a result, we proposed our third research question, why and why not do humans prefer to collaborate with AI?
The responses collected in interviews first confirm and refine the theoretical workflow of data storytelling [31] with empirical results. The workflow involves three stages, planning, execution, and communication, and eight tasks. Then we outline four different roles of AI collaborators and analyze them with the “agency vs. automation” framework [21]. These roles are creator, optimizer, reviewer, and assistant following the order of decreasing AI automation. Based on the results, participants’ preferences for collaborative tasks and AI roles are summarized. Furthermore, we report the participants’ reasons why or why not AI is desired in their data storytelling workflows. For example, AI was appreciated due to its quick turnover time but criticized for its limited ability to understand humans’ contexts. To conclude our research, we discuss the implications for future human-AI collaborative data storytelling tool design. Furthermore, we examine the generalizability of our findings and propose future directions.
The contributions of our research include the following:
-
•
Characterization of stages and tasks in the data storytelling workflow based on empirical evidence;
-
•
Summarization of where, how, and why (not) users would like to collaborate with AI in their daily data work;
-
•
Suggestions for future AI-powered data storytelling research.
2 Related work
Our work is situated within HCI research that conducts need-finding studies for AI-powered tools (e.g., [41, 70, 52, 24]). These studies emphasize involving targeted users and impacted stakeholders early on, understanding their workflow and social contexts, eliciting their desired ways to use AI, and critically examining their concerns and perceived risks of AI. While these broader works on human-AI collaboration informed our interview methods, below we focus on reviewing existing human-AI collaborative storytelling tools and empirical research in the data science domain.
2.1 Empirical research on human-AI collaboration in data science
Currently, data science tasks are still labor intensive and require deep domain expertise. A typical data science workflow includes preparing data, exploring data, modeling data, communicating data insights, and deploying models [69, 36, 26, 1]. To assist these labor-intensive tasks, most relevant to our work is prior research exploring and developing intelligent tools that augment the data science workflow. For example, prior work produced tools such as conversational agents to assist the insight exploration task [45, 46]. More recently, AutoML technologies that leverage advanced ML capabilities to automate data preparation and modeling have received much attention in academia and industry.
Besides developing new tools for AutoML [59, 37, 64], HCI researchers have conducted empirical studies to examine data scientists’ needs and concerns around AutoML [58, 57, 15, 66, 13]. For example, Wang et al. [58] conducted an interview study with 20 data scientists about their perception of AutoML tools and discovered their concerns around job security and desire for human-AI collaboration, in which both automation and human expertise of data science are indispensable. Focusing on data workers’ trust in AutoML systems, Drozdal et al.’s [15] study revealed a strong need for transparency features such as performance metrics and visualization to establish trust in AutoML. By interviewing 29 enterprise data scientists, Crisan and Fiore-Gartland [13] identified common usage scenarios of AutoML systems and provided a framework summarizing the level of automation desired by data workers.
Besides data preparation and modeling, communicating data, or data storytelling, is an important phase in the data science pipeline, usually for data team cooperation [8] and communicating with clients [23]. To eliminate the considerable effort in telling a data story, AI-powered storytelling tools have been studied in recent years (see Sec. 2.2). However, the previous empirical studies about human-AI collaboration in data science mainly focus on the data preparation and modeling phase (AutoML), and thus limited their scope to certain steps. Human-AI collaborative data storytelling in the data science pipeline has not been covered by them. To better design such tools, it is crucial to systematically understand data workers’ needs and attitudes toward this part. We conducted an interview study to investigate where, how, and why (not) data workers would like to collaborate with AI in data storytelling.
2.2 AI-powered data storytelling tools
Data storytelling and narrative visualization tools have become increasingly popular in recent years. These tools aim to help users create compelling data stories by providing data-driven insights and suggestions for visualization. AI in these tools has the potential to significantly enhance the storytelling process by automating certain tasks and providing users with new ways of analyzing and visualizing data.
To enhance the workflow of data storytelling, researchers have used AI techniques for different parts. Researchers have used vision techniques to the visual structure and semantics of infographics [33, 60]. They are also used to help with different dimensions of design to make data storytelling more effective and engaging for communicating the intended message. The dimensions include color [68], layout [42], graphics [28, 63], motions and animations [54, 60, 18]. Researchers also try to understand the design space of data storytelling [44, 5, 3, 9, 43], and to automate or semi-automate the process of creating and recommending data storytelling in the form of infographics [14], data videos [2, 47, 50], data comics [27], etc., from various sources of data. To produce better results, data storytelling researchers also try to evaluate and compare different infographics designs and methods using quantitative and qualitative measures, from the perspectives of memorability [7], cognition [6], or aesthetics [20, 17].
These studies have considered the human-AI collaboration from separate perspectives of the whole data communication pipeline. There is also research that considers the whole process of data storytelling. For example, Samuel et al.[19], Chen et al.[10], and Li et al.[32] consider data exploration and storytelling as an integrated workflow. Data practitioners may come back to data exploration when they create data stories, and the workflow should be bridged to ease these iterations. Taking one step further, we conduct an interview study from the data analysts’ perspectives to understand their daily work. Further, we dig deeper into how users think of AI collaborators’ jobs and roles when they do data storytelling with the help of recent AI advances.
3 Methodology
Our study was conducted in the first quarter of 2023 when multiple breakthrough AI systems appeared, such as ChatGPT [39], new Bing [35], and GPT-4 [40]. These systems might lead to data workers’ changing attitudes toward AI and encouraged us to investigate their needs and ideas about human-AI collaboration. This section introduces how we conducted the research, including the recruitment of participants (Sec. 3.1), the procedure of interviews (Sec. 3.2), and the analysis of results (Sec. 3.3).
3.1 Participant recruitment
In our study, we recruited data workers from both academia and industry. We adopted multiple approaches to recruiting participants, including posting ads on social media or in special interest groups through communication software and sending invitations leveraging our professional network. The participants are required to have experiences in data storytelling, such as creating slides for presentations or writing data articles. Ultimately, we recruited 18 participants (12 males and 6 females, 9 from academia and 9 from the industry, average experience in data analysis = 5.39, the standard deviation of experience in data analysis = 3.10). P6 and P17 are now postgraduate researchers, but they mainly talked about their data storytelling-related experiences in the interviews when they took full-time duties in the industry. Therefore, we only reported their industrial backgrounds. All participants have AI-related experiences, such as using chatbots or applying AI algorithms. Their detailed demographic information is in Table 1.
| ID | Gender | Age | Job | Domain | Exp. | |
|---|---|---|---|---|---|---|
| 1 | Male | 25-30 | Researcher | Data Science | 6 | |
| 2 | Male | 40-45 | Software Engineer | Data Science | 10 | |
| 3 | Male | 25-30 | Researcher | Chemistry | 4 | |
| 4 | Male | 25-30 | Researcher | Data Science | 6 | |
| 5 | Female | 25-30 | Researcher | Algorithm | 3 | |
| 6 | Male | 25-30 | Data Scientist | Consulting | 4.5 | |
| 7 | Male | 25-30 | Researcher | Data Science | 6 | |
| 8 | Female | 25-30 | Researcher | Data Science | 5 | |
| 9 | Female | 25-30 | Researcher | Data Science | 3 | |
| 10 | Female | 25-30 | Data Analyst | Finance | 4 | |
| 11 | Male | 25-30 | Business Analyst | Finance | 1.5 | |
| 12 | Male | 25-30 | Business Analyst | Consulting | 7 | |
| 13 | Male | 25-30 | Researcher | HCI | 3 | |
| 14 | Male | 25-30 | Student | Economics | 5 | |
| 15 | Male | 25-30 | Researcher | Medical Imaging | 3 | |
| 16 | Female | 30-35 | Business Analyst | Finance | 8 | |
| 17 | Female | 25-30 | Journalist | Journalism | 3 | |
| 18 | Male | 40-45 | Applied Researcher | Software | 15 |
3.2 Interview procedure
In our study, we conducted semi-structured interviews with the participants through online meetings. Each interview involved one or two authors and the participant. Before the interview, we first introduce the purpose of our study. Then we collected participants’ consent to participation in the study and recorded the entire meeting. All interviews started with a query about the participants’ data storytelling-related background, such as their job nature. Then we introduced two main parts of our interview: (1) understanding participants’ practice of data storytelling and (2) brainstorming where and how they would like to collaborate with AI when creating data stories. In the first part, we asked the participants about their familiar format of data story and then invited them to share a recent piece of their stories with us if convenient. Then we created mind maps with the participants to help them recall and organize their workflow of data storytelling. After the participants finished the introduction of their workflow, we moved on to the second part. The second part began with examples of AI applications in data storytelling to help brainstorm. We encouraged them to consider beyond the existing advanced AI models (e.g., ChatGPT). Then the participants freely proposed where and how they prefer to collaborate with AI for data storytelling. We also further probed on the reasons behind their preferences. When the participants were satisfied with their lists of ideas, we moved to the last part of the interview. In the last part, we asked about overall perceptions of human-AI collaboration in data storytelling, such as the difference between collaboration with AI and human designers. Each interview lasted for around 0.5-1 hour. All interviews were recorded and transcribed.
3.3 Result analysis
Following the prior practice [26], we adopted an iterative coding approach. At the beginning of our study, two leading authors attended the first six interviews together to ensure a common understanding of the protocol and its coverage of the research questions. After the interviews, the leading authors derived a preliminary version of the frequently desired collaboration patterns with AI and related reasons through open coding and iterative discussions. Along with more interviews conducted, the collaboration patterns and reasons were examined, refined, merged, and enriched. In the next section, we present the interview results supported by participant quotes.
4 Results
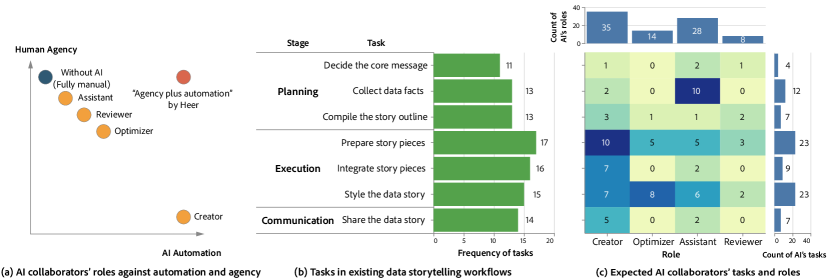
This section targets answering the research questions with the results from interviews. Sec. 4.1 illustrates the interviewees’ common workflow of data storytelling to ground results for our research questions. Then we attempt to answer the first research question by summarizing the roles of AI collaborators and where AI can take the roles according to interviewees’ feedback (Sec. 4.2). Fig. 1 shows the summary of results in Sec. 4.1 and Sec. 4.2. Next, Sec. 4.3 and Sec. 4.4 present interviewees’ reasons about why and why not they would like to collaborate with AI, which is outlined in Fig. 2. In this section, we label participants’ IDs for opinions they expressed (P1-P18).
4.1 What is the general workflow of data storytelling?
In the first part of the interviews, we invite the participants to share their workflow of data storytelling. Most of them frequently use slide decks as the format of their data stories. Some other formats of data stories include reports and articles. According to their feedback, we summarize the general workflow as three major stages and seven tasks. Fig. 1(b) presents the frequency of tasks mentioned by our interviewees.
The first stage in the workflow is planning, where the interviewees comprehend their results from data analysis and brainstorm the overall picture of a data story. In this stage, the interviewees commonly first decide on the core message of the data story based on their data findings and the broader context of their projects, such as the background and the target. After having a clearer core idea of the story, they move on to collecting supportive data facts. These data facts mainly come from their analysis and sometimes are collected in related materials such as news. When the supportive information is ready, the next task is to compile the story outline, where the interviewees organize the related information according to their topics and logical relationship. After the three tasks, the interviewees have a plan for their data story.
In the second stage, the interviewees execute the plans created in the first stage. They commonly first prepare story pieces using the collected information in the first stage. Unlike the task of collecting related information, this task transforms collected facts into a presentable format. For example, they draft the introduction to their background and methods. They also design and make charts to facilitate the delivery of their findings. The next task is to integrate story pieces, where the interviewees may make presentation slides or reports to accommodate the story pieces according to the outline. In this step, some supportive information that is irrelevant to the data may be added to the data story. For example, when making slides, it is common to add pages for the title, section, and outline pages to facilitate the audience’s understanding. To make the data story more effective and appealing, at the end of the execution stage, the interviewees often style the data story. Some examples of styling the story include adjusting the layout of visual elements, unifying the color usage, annotating the charts, and applying animations. Notably, the interviewees may review the results at the end of each task and iteratively improve the results. At the end of this stage, the interviewees have complete data stories that can be shared with other stakeholders.
In the final stage, the interviewees communicate their data stories with others. After finishing and checking the story, the authors will share the story informally or formally. When sharing the story informally with the team, the authors often want to seek advice on improving the story quality, such as the core message’s clearness and the content’s completeness. Then the authors may perform the previous tasks again to refine their story. When the stories are shared formally, multiple actions can be taken according to the sharing format. For example, if the sharing is a live talk or video recording, it is possibly necessary to write scripts and rehearsal the presentation. When the story is shared as a document, the authors may need to upload it to the cloud or send it to others through communication software.
Though we attempt to divide the workflow into stages and tasks according to their chronological order, the procedure of data storytelling is not always linear. Most of the time, the interviewees may experience conducting several tasks back and forth to polish their data stories. For example, it is quite common that in the styling task, the authors can go back to prepare story pieces according to a more unified style. Another example is that the authors may share the story with their teams several times. They can review the story outline before execution to improve the story iteratively in an agile manner. For example, P2 mentioned that he often communicated with team members to review his stories in different stages, including planning and execution:
“The first thing is to really decide what you want to focus on, right?… Or which data you want to focus on showing… I actually use paper to take some notes or some ideas. And then I prefer to discuss with someone else.” “and trying to make [findings] visual… But then you still need to see if they work into the framework that you want to explain. Sometimes, maybe there is some step missing or sometimes some of the visuals are not clear enough. So I also tried to discuss with someone and got some feedback.”
Reviewing and improving data stories was also considered an opportunity to gain new ideas or identify potential problems in their data analysis by some participants. For example, P13 mentioned:
“When I am reviewing [the data story], I can have some new insights. Then I need to verify these ideas with some new experiments.”
With these steps, his understanding of the problem could be enhanced.
We also notice that some participants, under certain scenarios, may not conduct some tasks, as shown in Fig. 1(b). They may skip some steps according to the nature of their stories, such as the target audience’s backgrounds and whether the story is communicated in a formal occasion. For example, P5 mentioned that she might not integrate story pieces into slides or reports when discussing findings with her supervisor. She instead showed several charts and presented the messages directly. The reason was that they discussed a familiar project in an informal meeting.
4.2 Where and how do humans want to collaborate with AI?
To answer our first research question, we summarize the proposed roles of AI collaborators by interviewees to illustrate how data workers would like to collaborate with AI (Sec. 4.2.1). Then we take one step further to examine our interviewees’ preferences towards the collaboration approach in different tasks of their workflow (Sec. 4.2.2).
4.2.1 What are AI collaborators’ roles?
According to our interviews, the desired roles of AI can be categorized into four types, creator, optimizer, assistant, and reviewer. The characterization of roles reflects how humans would like to divide the work in data storytelling between AI collaborators and themselves.
The first role of AI is the creator. When AI collaborators are assigned to a task in the workflow of data storytelling, they finish the entire task independently. The responsibility of humans is limited to providing the raw materials as input and reviewing the AI-created output. In other words, humans are not involved in the creation process.
The second role of AI collaborators is the optimizer. When AI collaborators act as optimizers, they do not handle the entire task but take the duty of fine-tuning humans’ created content. AI optimizers need to understand the input content and then improve the content. In this collaboration mode, humans bear more workload and outsource optimization to AI.
The third role of AI collaborators is the reviewer. Under this role, AI evaluates the task performance of humans and suggests potential issues or improvements. Compared to AI optimizers, reviewers do not need to improve humans’ created content directly. They only need to point out the problems or provide suggestions based on understanding humans’ input content. Then humans can decide how to fix the problem or which suggestion is adopted.
The fourth role of AI collaborators is the assistant. Compared to the previous roles, AI collaborators take even less work when acting as assistants. They are not authorized to modify anything created by humans and do not need to understand the content. Instead, they provide assistance on specific tasks according to humans’ requirements.
We further assess the four roles using the “agency vs. automation” framework [21]. The framework is derived from the ideal goal of human-AI collaborative tools, achieving “agency plus automation”, where AI automates the tasks (i.e., automation) under humans’ control (i.e., agency). According to Heer [21], tool designers may need to estimate human-AI collaborative tools’ levels of agency and automation and examine if they fit users’ tasks and requirements. Following this idea, we characterize the four roles of AI summarized from the interview using the agency and automation levels when humans collaborate with different AI collaborators. Fig. 1(a) shows the estimated levels of human agency and AI automation of four AI roles and two anchor points, i.e., fully manual data storytelling without AI and the ideal “agency plus automation”.
When AI collaborators serve as creators, humans have little control over how AI performs tasks and AI fully automates the task. Therefore, it has the lowest level of agency among the four roles, while the level of automation is the highest. When working with AI optimizers, humans have a higher agency but take more workload. AI optimizers only automate content improvement based on understanding humans’ input. AI assistants have a lower level of automation since it only reacts to specific requirements given by humans. We consider that when AI collaborators serve as reviewers, both their level of automation and human collaborators’ level of agency are between those of assistants and creators because AI reviewers need to understand the input by themselves and may not execute an optimization plan automatically. Moreover, reviewers do not directly follow humans’ instructions but give humans control over whether and how they follow the advice.
4.2.2 What are AI collabortators’ expected tasks?
This section reports concrete desired collaboration patterns, i.e., tasks and roles of AI collaborators, which were coded based on participants’ comments following the definition in Sec. 4.1 and Sec. 4.2.1. Fig. 1(c) illustrates the frequency of preferred collaboration patterns. In Fig. 1(c), it is apparent that the desired collaboration concentrates on the planning and execution stages, while fewer participants hope to receive help from AI in the communication stage. At the task level, the most frequently mentioned tasks include preparing story pieces (23 times), styling the story (23 times), and collecting data facts (12 times). The number of times may exceed the number of participants since some participants mentioned multiple types of collaboration patterns in one task. If a participant mentioned one collaboration pattern multiple times, we only count once in Fig. 1(c). More specifically, most of the participants would like to have AI collaborators as creators in creating story pieces and styles and assistants in collecting data facts.
The distribution indicates that participants have different preferences for AI collaborators’ roles at different stages. It is clear that the participants prefer AI collaborators as assistants in the planning stage so that they can control the core idea and the outline of the data story. Next, they prefer to let AI automates the execution stage as creators or optimizers to offload their efforts while respecting their defined outline. Finally, most of the participants prefer to share data stories with their audience without collaborating with AI. In this way, their story can be conveyed more faithfully with sufficient interactions with the audience. We hypothesized that it is more likely to achieve the goal of high human agency and high AI automation by combining different collaboration patterns at different stages of the workflow.
The rest of this section presents the most frequently mentioned task in each stage. Since preparing and styling story pieces share the highest frequency in the execution stage, both of them are discussed.
Collect data facts
Collecting supportive data facts is the most popular task for participants to collaborate with AI in the planning stage. It was mentioned by 12 participants (P1-P4, P7, P9, P11-P13, P16-P18), where AI collaborators were expected to be assistants by 10 of them (P1-P4, P9, P11-P13, P16, P17). To utilize AI assistants in this step, participants would like to ask them to collect and organize data facts from various sources. Such work was often considered repetitive and time-consuming. P12, as a business analyst, spoke about his expected AI assistant in collecting numbers from multiple documents:
“When I make a report for a company now, I may need to search for [its annual reports] with search engines, let’s say, annual reports of 2021, 2022, and 2020. After collecting these annual reports, I may find each year’s income… Then I need to input each number manually to build the chart. This is a very cumbersome task… [The information] is very fragmented so you cannot get the numbers that you want at once. If AI can do something like collecting accurate income data in the past five years for me… I feel I can save lots of time collecting the data.”
The opinion was echoed by P8, who thought AI was good at summarizing existing information.
Besides collecting data facts, it was also desired to have AI for searching background information to enrich the data story. P1 expressed his need for an AI assistant to collect public opinions to illustrate the importance of his data story:
“When I design the foreshadowing [for data stories], maybe it is possible to let [AI] write some stories. The stories are not fiction stories. I feel they are more like explaining why the topic [of a data story] is important… What [AI] does is more like collecting some public opinions or focuses.”
The help of AI can offload the efforts of collecting background information and have humans focused on the core of their data story.
Prepare story pieces
When preparing data story pieces, it was necessary to plot charts and write explanatory texts, which introduced a considerable burden to data workers. Therefore, almost all participants mentioned that they preferred to receive help for this task. The largest group of participants preferred to have AI create story pieces, such as writing texts or plotting charts (P5, P7, P8, P10-P12, P14-P16, P18). They appreciated the collaboration where they input the outline and data facts, and AI could generate story pieces automatically. Such collaboration was described with a metaphor by P14, “it is like that I prepare all ingredients for [AI] and ask them to cook dishes.” P16 further explained her opinion:
“I want to have AI to write texts… It can read the information in charts and analyze it. It is simple. For example, if the chart writes the average value of years or the yearly compound growth rate, then I don’t need to calculate it, and AI can write [the related findings] itself based on the chart.”
Another two groups of users preferred to let AI optimize (P5, P13, P16-P18) or review their accomplished story pieces (P1, P12, P13) to improve the quality of story pieces or customize them according to the context of data stories. For example, P13 sometimes felt unsure whether the story piece was hard to be understood by the audience. Therefore, he hoped that AI could provide suggestions:
“If we discuss the [research] problem with many lay people, their expected and data scientists’ expected slide contents must be different. Under such scenarios, AI can provide more advice. For example, it can suggest that this chart is too complex, so you should break it into multiple charts to explain.”
P12 hoped that AI could review his story pieces using professional knowledge, such as statistical theories.
Some participants (P2, P3, P12, P13, P16) thought AI could assist story piece creation, such as enabling voice-based input (P12), auto-completing chart plotting code (P13), and one-click translation (P16).
Style the data story
Styling data stories often does not improve stories’ content but enhances their appearance and facilitates understanding. According to our interviews, common styling actions included adjusting the layout, changing color palettes, applying designated templates, and adding animations. These actions were often cumbersome and could be non-trivial for data workers with a weak background in graphical design. Therefore, aid from AI is welcomed.
Six participants preferred to have AI collaborators as assistants in styles (P1-P3, P6, P8, P9). Potential assistance provided by AI included unified color palette management and suggesting layouts as the design idea function in Microsoft PowerPoint [34] does. P3 indicated the color usage in his domain was semantically meaningful since he often dealt with optical phenomena in chemistry experiments. Therefore, he expected that an AI assistant could help him manage color palettes considering both semantic meanings and visual effectiveness.
Furthermore, seven participants expected that AI could create styles for their data stories (P7-P9, P11, P14, P16, P18). Several participants (P1, P8, P17) implied that they frequently used the design idea function in Microsoft PowerPoint to suggest alternative styles for their slides. However, its design suggestions were “limited” (P17) and sometimes “outdated” (P8). As a result, P8 would like to further extend the function to transferring the styles in online well-designed slides to their own data story with AI collaborators as style creators. P7 also mentioned a similar function. Other examples of creating styles by AI included animating the presentation slides automatically (P9, P16). Furthermore, P8 expected that generative AIs could create decorative or background figures for her data stories.
Lastly, AI might also optimize the existing style according to eight participants (P2, P3, P7, P8, P14-P17). They hoped that AI could beautify the charts, tables, or the entire story automatically.
Share the data story
In the communication stage, the desired collaboration patterns focused on one-way communication where storytellers might spread their data stories using videos or slides. Five participants expressed their willingness to ask AI collaborators to share the story instead of them in one-way communication (P4, P7, P8, P10, P16). For example, as a researcher on data storytelling strategies herself, P8 had an observation that “it is necessary to have multilingual videos when I want to spread my videos on worldwide platforms.” She thought AI could facilitate spreading data stories by automatically creating multilingual videos based on the original data story. Similarly, P16 thought AI could create videos that would be delivered to the public instead of her. Furthermore, P10 and P16 preferred to have AI collaborators as assistants to upload their slides to the internal server or send them in an email to all attendees. Therefore, they could save efforts from these auxiliary tasks. Unlike one-way communication, the participants often thought AI had no role in two-way data story communication, such as meetings. The reasons will be explained in Sec. 4.4.3 and Sec. 4.4.4.
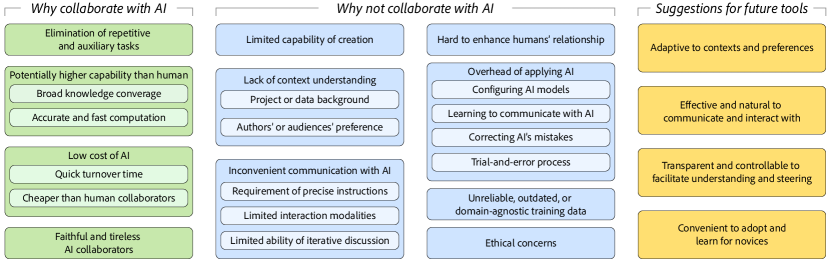
4.3 Why AI is desired in data storytelling?
Our interviews showed that almost all participants expressed their need to collaborate with AI on some tasks. This section summarizes the participants’ four common reasons why AI is desired. We note that these comments reflect the participants’ general beliefs about AI technologies, and should not be taken as absolute facts.
4.3.1 AI reduces the workload of repetitive and auxiliary tasks.
A frequently mentioned reason for having AI collaborators is that they can reduce the workload of repetitive and auxiliary tasks. The reason was mentioned by 14 participants (P1-P5, P7-P13, P16, P18).
Our interviewees often complained that they spent tremendous effort on repetitive and auxiliary tasks when creating appealing data stories. P11 described such tasks as “dirty work.” Some example tasks included plotting charts, collecting data facts, and adjusting the layout. P16 complained that she spent “most of the time” adjusting the charts’ or tables’ styles according to her company’s presentation template in the execution stage. However, this auxiliary task did not add much value to her story. She hoped that AI collaborators could eliminate her efforts:
“I finish my own work well and leave PPT [slides] to the professionals, like AI… Why do I need to spend much time styling PPT [slides]?”
Another example was mentioned by P7. As a researcher, he sometimes gave talks at different lengths ranging from 5 minutes to 15 minutes depending on the occasion. He needed several versions of slides then. If AI automatically created slides according to the time requirement, P7 could avoid making slides several times.
Despite creators, AI collaborators could also serve as optimizers and assistants to save effort. Some examples can be found in Sec. 4.2.2.
4.3.2 AI models are believed to have a higher level of capability than humans in some tasks.
Among the 18 participants, 14 expressed that they would like to collaborate with AI since they believed AI might have a higher capability in specific tasks than humans. The participants often mentioned two merits that they believed AI had and might potentially benefit data storytelling.
The first potential advantage of AI over humans is that they can possibly have a broader knowledge coverage led by the large quantity of training data (P7-P10, P12-P14, P18). P12 mentioned that humans had limited capability of searching and collecting information but AI could be more powerful. Therefore, he expected that AI could give him more complete results when he asked them to collect data facts. Similarly, P9 mentioned a case where AI might provide explanations for data facts leveraging additional knowledge outside the dataset, such as explaining “the reasons why the sales in one year increase or decrease suddenly.” P8 proposed that she could ask AI to generate presentation transcripts with different styles, such as humorous or formal ones.
The second potential advantage of AI is that its high computational power is likely to enable a fast and accurate search over the data or design space (P1, P3, P4, P6, P10, P12, P14-P16, P18). For example, P18 thought that AI could quickly create several data stories with different styles. Then he could pick one style for sharing conveniently. P6 mentioned the AI’s potential in brainstorming ideas:
“AI might help us to find interesting combinations between these ideas or it may be able to show us some possible spaces which are not really explored by our ideas… AI should be really good at this kind of task.”
To utilize these advantages, other than having AI collaborators as creators, a frequently proposed way was to ask them to provide inspiration as assistants to different tasks, such as selecting supportive data facts and choosing styles. P1 further hoped that AI could help him check the problematic content, which might be led by data bias or incompleteness, or only provide a checklist. His motivation was that humans could make mistakes since they were sometimes forgetful or lack of related knowledge. AI could compensate for these issues using its knowledge and computational power.
4.3.3 Collaborating with AI may cost less than with humans.
When the participants talked about collaborating with AI and designers, an advantage of AI was the low time and money cost.
First, they often appreciated that AI could have a quick response time (P7-P12, P15, P17), especially “when the schedule is tight” (P7). P17 described the collaboration with AI as a “What You See Is What You Get” experience. P15 liked that AI could possibly allow him to iterate the data story swiftly. In contrast, participants commented that working with designers or other human collaborators in data storytelling might take up to hours or days to finish tasks. P9 further said that human collaborators could sometimes “miss their deadlines”. When working with AI, she did not have such concerns.
Furthermore, several participants (P8, P9, P11) thought AI could be cheaper than human collaborators’ money costs. Therefore, P8 believed AI might be more accessible to data workers than professional designers when handling less important tasks, such as preparing data stories for her regular team meetings.
4.3.4 AI collaborators bear tasks faithfully and tirelessly.
According to our participants, it was common to polish the story pieces or styles several times until the authors felt satisfied with them. Several participants thought AI was much easier to be asked to handle repetitive tasks or revise its outputs many times until data workers felt that the results totally matched their expectations (P4, P5, P7, P9, P14, P16). The reason was that AI collaborators were more like “machines” (P4). Therefore, human users did not need to consider whether they were willing and available to handle the tasks. For example, P4 commented that he could continuously ask AI to do some repetitive work without any worries. When asking human collaborators to polish their work, the participants might feel reluctant or inconvenient since they needed to consider their collaborators’ willingness and availability. P16 compared the experience with human and AI collaborators:
“You cannot continuously trouble others. If they did something incorrectly, you may ask them, ‘can you modify it here?’ But when they continuously do something incorrectly, you may sometimes give up [asking them to revise] since you have already made several requirements or they become busy. If [working with] AI, you can ask them whenever you have new requirements.”
Furthermore, the participants thought that AI collaborators could follow their ideas faithfully. When collaborating with human collaborators, the participants might need to respect and compromise with others’ preferences and opinions. This point stood out when creating data stories since people tended to have their personal styles of storytelling. P14 said:
“When talking about styles, everyone may have different preferences. Therefore, I will respect [human collaborators’ opinions] more. If I have some professionals, I believe that their designs can be appreciated more.”
When collaborating with AI, he could ask AI to make the story as close as possible to his intent. P7 and P16 even thought that future AI could learn their personal preferences and create content as they did.
4.4 Why AI is not a panacea for data storytelling?
When the research was launched, we anticipated that AI collaboration is desired by data workers. However, to our surprise, almost all participants were skeptical about whether AI can be qualified collaborators in the entire workflow. Furthermore, participants provided various reasons for not collaborating with AI throughout the interviews. This section summarizes these reasons for why AI collaborators may not be favorable. Again, these concerns reflect participants’ general beliefs about AI and, as we observed below, are heavily influenced by their experience with recent generative large-scale AI models.
4.4.1 AI’s capability of creation requires more improvements.
13 participants had a deep concern regarding the performance of AI in creating data stories (P1-P3, P5-P8, P12-P17). The potentially unsatisfactory performance has become an obstacle to introducing them to the production of data stories. For example, P13 said:
“If [AI’s] output can only achieve 40 to 50 marks [over 100 marks], I prefer to make drafts [of data stories] by myself or collaborate with other team members.”
Our participants mentioned their prior experience with AI’s poor performance. P15 distrusted AI-generated content since he had seen some misleading academic paper explanations created by ChatGPT. He believed that such misleading content could be dangerous to users with limited expertise. P8 expressed her opinion on AI’s capability by saying, “some AI-created figures may have counter-intuitive mistakes, such as drawing a person with one ear missing.” P5 and P8 worried that AI could only produce a limited variety of voices when narrating data stories and the stories may not be engaging or interesting enough for their audience.
4.4.2 AI may lack the understanding of data story contexts.
According to our participants, understanding the contexts of data stories is another challenging issue for AI. Here contexts included both the project and data background of the data story and the authors’ and audiences’ preference. It is a common viewpoint among our participants that AI is hard to take contexts into consideration.
Five participants considered that AI could not understand the project and data background (P1, P3, P6, P10, P12). Among them, P1 mentioned the importance of the background of analytical projects and doubted whether AI could capture them:
“When you analyze a dataset, I feel somehow the important things are outside the dataset. I feel the background is actually very important. When you only analyze the dataset about cars222The Car dataset is a widely used example dataset. It can be found at https://github.com/vega/vega-datasets/blob/main/data/cars.json., [the findings] are very boring. However, under some specific scenarios, that dataset can be very important… I think AI may not capture [the background] well.”
P6 thought that AI might fail to understand the semantic meaning of domain-specific data, which was a challenging part of his consulting work. He mentioned that he needed to meet his clients several times to understand the meanings of data with domain experts’ help.
Regarding understanding the authors’ and audiences’ preferences, several participants expressed their concerns (P3, P8, P9, P11, P12, P14, P16, P18). P3, P12, and P14 did not think AI could understand their intent from their gathered data facts or story pieces. P16 further discussed her difficulty in understanding her data story co-authors’ intent when the feedback from them are unclear. It was necessary to leverage her previous experience of working with them and discuss her understanding with the collaborators to align the ideas. She considered that AI could not handle the case since AI required a “very clear idea” as the input. Another issue pointed out by P9 and P18 was that AI might have the same output regardless of the users, which might limit the expression of authors’ personal style.
Due to the missing consideration of contexts, our participants thought that AI collaborators could hardly work as creators in the planning stage (see Fig. 1(c)), such as deciding the core message or outlining the story. Alternatively, AI collaborators could serve as assistants in the stage to execute humans’ instructions and save effort.
4.4.3 AI models are hard to communicate as collaborators.
Our participants frequently mentioned that they found AI was not as easy to interact with as humans (P2, P8, P9, P11-P13, P15, P16, P18). Therefore, they had doubts about AI collaborators in data storytelling.
The first issue is that the participants believe that AI needs precise instructions when taking action (P9, P15, P18). However, giving such instructions in data storytelling might not always be easy. For example, P9 thought it was impossible to tell AI the concrete RGB values or the name of a color, so AI could hardly help her with the color adjustment task. P15 expressed a similar idea about general style adjustment.
A more critical issue is that most current AI models are limited to communicating with humans in specific modalities (P8, P9). For example, ChatGPT, a frequently mentioned AI system by interviewees, only communicates with humans using natural languages. P8 considered that multi-modal communication was important in data storytelling:
“When communicating with humans, many modalities can be applied. Despite using natural language to describe what you want, you can also show them pictures or your sketch. You can even use gestures to describe [your idea]. However, the current AI algorithms may only have one way of input. Then we possibly need to learn how to write prompts. Furthermore, we are hard to estimate whether AI understands what we want to do.”
She further pointed out that the lack of communication modalities might lead to miscommunication. Even worse, humans could hardly realize the misunderstanding between humans and AI models. Despite P8, P11 and P16 also expressed their concerns about miscommunication.
The last issue is that participants consider AI to have limited capabilities to communicate with humans to reach a consensus when there is disagreement (P8, P16). Our participants thought this issue hindered AI’s application in two-way communication. P8 mentioned that AI could not have an insightful discussion with humans when “[presenters] need to argue with others based on understanding the problem and the project requirements.” She felt that AI lacked the ability to conduct “iterative” discussions with humans and may not understand the goal of the conversation well. Such discussions could happen in pitch talks or project meetings.
4.4.4 AI storytellers can hardly enhance humans’ relationships.
Another issue is that AI might not be able to help build relationships between storytellers and their audiences (P11, P12). According to P11, a business analyst, data stories can play an important role in enhancing humans’ relationships. He mentioned that the communication of data stories between his team and clients helped to build trust:
“I think AI cannot replace the [communication] between humans and humans… It is more important to let others feel that your team has its own insights, a proper way to work, great characters, and good communication skills in our pitches.”
He indicates that the usage of AI in communication might not help create a good image of his team and therefore affect building partnerships with his clients. P12 further thought the application of AI might have a risk of impairing the relationship between him and his clients. He considered that his data stories demonstrated his values as a professional to clients. If his stories were made and communicated completely by AI, the clients might “question your value” and have a lower willingness to work with his team.
4.4.5 The overhead of applying AI is considerable.
Our participants pointed out that various overheads could hinder the wide application of AI collaborators in data storytelling.
The first type of overhead is the learning cost of effective communication with AI. According to P13, the quality of AI’s output depended on the quality of the communication between humans and AI models. Therefore, it was critical to learn the proper ways of communication, which was echoed by P8’s comment above. P13 considered it necessary to have a “checklist” to assist the interaction with AI.
The second type of overhead is configuring AI models. It might require a tremendous effort to configure AI models before involving them as collaborators. P3, as an amateur user of generative AI models, complained about the overhead of deploying them, “if the AI model requires setting up the deployment environment, it is quite annoying.” P12 described configuring AI’s functionalities as “teaching” AI and said “if AI is not smart enough, I need to spend much time on teaching them. Then I prefer to do it myself or ask someone else to do it.” By saying it, P12 indicated that he needed to balance the overhead and benefit when collaborating with AI. Similarly, P5 thought that it required some effort to configure AI to mimic her voice when asking AI to record a data story for her. Therefore, she preferred to present the story herself.
The third type of overhead is led by AI’s potential mistakes (P3, P9). Our participants mentioned humans needed to spend effort to correct AI’s mistakes. When the task itself was trivial, it might be even easier to conduct it by humans directly. Therefore, the participants preferred to finish the simple tasks, such as adding annotations and moving the positions of visual elements, by themselves.
The unclear capability of AI models could also lead to the unnecessary overhead of trial-and-error. P15 and P16 indicated their concern that they might spend unnecessary time exploring whether AI could help them and received no assistance in the end. Their time and effort in exploring AI’s ability could become an overhead to the task.
4.4.6 The reliance on training data may limit AI’s usage.
Our participants expressed their concerns about AI’s reliance on training data. They thought most of the existing AI models’ performance often relied on large-scale training datasets built with public data.
First, general AI models might only be trained on public domain-agnostic data. As a result, several participants worried that the general AI models could fail when dealing with domain problems (P3, P4, P6, P7, P11, P12, P16). Our participants mentioned that some domain-specific data could hardly be collected, processed, and approached due to compliance issues. Therefore, most of the commercialized AI systems might not access such data and lack the ability to handle it.
Second, AI cannot perform with the latest data since their training data can be outdated and AI may not have the ability to collect new data. P12 expressed his concern that AI trained on outdated data might be useless in his time-sensitive work. P9 had a similar concern. P17, as a journalist, further pointed out:
“[The top journalists] need to conduct in-depth interviews. Each interview can last one hour. Each article can consist of ten to twenty interviews. Then they will organize the viewpoints and write an article with 10,000 words… If you do not interview, there will be nothing in the database. How could you ask AI to generate?”
She thought that AI was greatly limited by its ability to talk with humans and collect first-hand data to write compelling stories. P7 also thought he had to collect data for AI before collaboration.
Finally, since AI models can be trained with data collected from the web, the created content’s reliability is questionable. P12 mentioned that most of the data on the web was not provided by the authority. Since AI-created content could be based on such data, it was hard to judge the content’s accuracy and authority. As a result, he could not use AI-created content in his data story.
4.4.7 The application of AI can lead to ethical concerns.
When collaborating with AI, many participants thought that the potential ethical problems were not easy to be addressed.
Multiple participants (P1, P8, P10-P12, P14) raised their concerns about the responsibility of the story content. They might need to be responsible for AI collaborators’ mistakes led by their insufficient capability or unreliable training data (see Sec. 4.4.6). If the responsibility issues were not well addressed, they would not feel confident to collaborate with AI. P3 also worried about how to handle the copyright of human-AI co-created content.
Another potential issue is data security (P3, P12). P12 thought that the data security problem hindered the broad usage of commercial AI systems. He mentioned that his company limited the usage of AI due to the risk of data leakage. He could only use the AI systems provided by his company even though their performance was unsatisfactory.
The final concern is the transparency of AI models. P8 and P10 thought that they might have trouble knowing whether AI really understands their intent in making data stories. P7 and P18 proposed that AI models should explain their rationales when humans felt skeptical about certain decisions.
5 What should future human-AI collaborative tools look like?
Our interviewees showed their passion for introducing AI to their workflow. As discussed in Sec. 4.2.2, they commonly preferred collaborating with AI rather than asking AI to create a story from data in an end-to-end manner. Based on the observation, we consider that more human-AI collaborative tools should be studied and offered to data workers. In this section, we propose recommendations for future data storytelling tools according to our findings in the interview.
5.1 Adaptive to different contexts and preferences
We envision that AI in future storytelling tools should consider user-specified contexts and preferences.
Most of the existing AI-powered storytelling tools (e.g., [62, 48]) only consider the data relationship between story pieces. However, as indicated in Sec. 4.4.2, the lack of considering contexts may hinder their acceptance. Examples of contexts include the goal of a project, the social background, the authors’ previous data stories, and the team members’ preferences. Modeling these contexts can help AI to understand what a data story targets and how the story can be compelling. As P7 and P16 suggested (see Sec. 4.3.4), AI collaborators are ultimately expected to serve as personal assistants so they can learn the contexts of data stories implicitly through their daily actions, which was also mentioned by Horvitz [22]. Another potential approach is to allow users to set up contexts and their preferences explicitly. For example, P7 imagined that he could use the context of his presentation as part of the input parameters. He could tell AI his need to tell a data story formally or informally in different countries. AI could adjust the story according to the occasion and the audience’s cultural background.
Furthermore, as our summary in Fig. 1(c) indicates, users may prefer different patterns of collaboration, which may be related to their work nature. For example, the interviewees with business backgrounds considered human-human communication irreplaceable and did not prefer collaborating with AI in the communication stage (see Sec. 4.4.4). Therefore, the tools should not assume that AI collaborators’ roles are fixed and provide the same help to different users. They can be adaptive to different requirements according to users’ configuration.
5.2 Effective and natural to communicate and interact with
Our second recommendation is to build effective communication channels between humans and AI by leveraging natural interactions.
Despite mouses and keyboards, more interaction approaches have been explored recently. For example, SketchStory [30] reveals that sketching can make data stories more engaging. VisTalk [61] and Falx [56] propose natural language-based and example-based chart authoring. These tools have the potential to enrich the communication channels in human-AI collaborative data storytelling.
Beyond these tools that support a new modality of communication, we argue that it is promising to enhance communication by combining multiple modalities (see Sec. 4.4.3). The idea is inspired by a sequence of research in multi-modal interaction with visualizations [51, 29, 55]. For example, Srinivasan et al. [51] verified the value of multi-modal interactions in data exploration. The multi-modal interactions can make the experience closer to human-human communication and better fit the multi-modal nature of data stories [11]. For example, users can sketch to indicate their preferred layouts and transitions, while they can indicate their expected emotions in the data story with facial expressions or gestures. Similarly, AI can present drafts to humans and ask related questions. Recently, GPT-4 [40] has taken a step toward multi-modal interaction between humans and AI models. It allows both images and texts as the input but limits the output to texts only. When communication is more natural and convenient, concerns about miscommunication and the learning cost of effective communication (see Sec. 4.4.5) should also be mitigated.
5.3 Transparent and controllable AI to facilitate users’ understanding and steering
The third design suggestion is to make AI more transparent to users. Our participants had concerns regarding the black-box nature of AI models, including the unclear and potentially unreliable data sources (see Sec. 4.4.6), the miscommunication between humans and AI collaborators, and consequent responsibility problems (see Sec. 4.4.7).
A potential way of addressing these concerns is to enhance the explainability of AI [16]. We imagine that future AI collaborators in data storytelling should be able to explain their actions as human collaborators do. For example, AI may explain how a generated storyline aligns with design guidelines (e.g., [4]). In this way, users can better understand and judge whether AI’s actions are reasonable. We hope that future research could work on explaining AI’s behavior in storytelling tools, including what and how to explain. Furthermore, humans should be provided with functions to steer AI models according to various needs. For example, to handle the potential data reliability issues, despite providing the source of created content, AI should remove all content without authoritative information sources per users’ request.
Another benefit of being transparent is to possibly enhance humans’ understanding of their produced data stories (see Sec. 4.1). For example, if humans and AI have divergent ideas about the data story, AI’s explanations may help humans reflect on their understanding and improve their stories. At the same time, humans’ feedback to AI may also help AI understand humans and their context better [25].
5.4 Convenient to adopt and learn for novices
The last recommendation is that AI-powered tools should be convenient for novice users. They should have low adoption and learning cost.
As mentioned in Sec. 4.4.5, configuring AI models can result in overhead that hinders users from using them. Therefore, we consider it necessary to ease the adoption of tools. For example, the tools can be web-based applications, similar to ChatGPT, to eliminate the need to deploy AI models locally. Another potential is to be seamlessly integrated into users’ familiar tools, such as PowerPoint plug-ins. In these ways, novice users can approach helpful AI-powered tools without configuring them from setting up environments.
The second perspective is to lower the learning cost by having clear instructions when collaborating with AI in these tools. Recent large AI models (e.g., ChatGPT) can handle various downstream tasks. However, their boundaries of capabilities, such as the possible tasks and the performances, are unclear. When dealing with such unclear boundaries, humans may have to figure out if their tasks are feasible for AI with trial and error. This process can introduce additional overhead (see Sec. 4.4.5). Furthermore, communicating tasks effectively can be challenging (see Sec. 4.4.3). To address these issues, we suggest that the developers should prepare clear instructions when designing future human-AI collaborative data storytelling tools. The instruction should include an estimated boundary of the tools (i.e., tasks and performances) and clear guidelines for the communication approaches. With instructions, users can be clearer about what and how they can collaborate with AI in these tools.
6 Discussion
This section discusses our study’s generalizability and limitation.
6.1 Generalizability
In our paper, Sec. 4.2.1 delineates the roles of AI collaborators based on our participants’ feedback. Sec. 4.3 and Sec.4.4 summarize their opinions on why AI is or is not preferred in data storytelling. Though our interviewees proposed them in the context of data storytelling, we notice that some of them can be generalized to broader data-related human-AI collaboration while others are more specific to data storytelling. This section discusses the generalizability of our findings.
We consider that the roles of AI collaborators have the potential to inspire research in other contexts. As discussed in Sec. 4.2.1, these roles mainly reflect the work division between humans and AI. Therefore, they may not be limited to the context of data storytelling.
Among all reasons, we find the reasons why AI is preferred are likely to be generalizable to other contexts. However, some reasons why humans would not like to collaborate with AI can be more data storytelling-specific. In our opinion, the reasons about context (see Sec. 4.4.2) and communication (see Sec. 4.4.3 and Sec. 4.4.4) are only generalizable to similar contexts, while others can be suitable for a broader context. Data storytelling aims to convey messages derived from data to the audience via multiple modalities, such as visual and auditory channels. Therefore, we need to consider the value of human-human communication and the multi-modal communication between humans and AI under the scenario of data storytelling. Furthermore, the approach of storytelling heavily depends on the context, such as the audience. Considering the relationship between these reasons and the features of data storytelling, we hypothesize that these reasons may only be meaningful to similar scenarios, such as intelligent education. In contrast, they may be less valuable in other data-intensive scenarios, such as AI-assisted programming, where little human-human communication is involved.
Moreover, since our findings may be meaningful to human-AI collaboration in other contexts, our suggestions in Sec. 5 have the potential to inspire tool design in these contexts.
6.2 Limitations
The first limitation of our research is the coverage of interviewees. We notice that most of our interviewees conducted research or white-collar jobs. Furthermore, since data analysis has only been an emerging daily job in recent years, most of our participants are between 25 and 30 years old. The limited coverage of interviewees leads to the risk of incomplete results. Therefore, we think that our participants’ ideas should be treated as a probe into humans’ attitudes toward human-AI collaborative data storytelling. We hope our research can inspire future studies where other groups of data storytellers, such as elders and YouTubers [67], can be investigated.
Another limitation is the timeliness of our research. Our interviews with data workers were conducted in the first quarter of 2023. Along with the quick iteration of AI techniques, data workers’ attitudes toward AI may change fast. Our participants’ understanding of the technology advances may also be obsolete. Therefore, some of our results can be outdated in the future. However, data workers’ inherent needs (e.g., eliminating repetitive work) and concerns about AI (e.g., communicating with AI) may not change. As a result, we believe that our research is a starting point for raising researchers’ awareness of data workers’ attitudes toward human-AI collaboration. We sincerely hope that future research can continuously improve and complete our findings.
7 Conclusion and future directions
Data storytelling plays an important role in data workers’ daily work nowadays. However, telling a good data story requires both skills and efforts. To address the challenges, introducing AI collaborators has been considered a promising direction. Informed by the approach of human-centered design, this paper investigates data workers’ attitudes and needs toward collaborating with AI through an interview study with 18 interviewees from academia and industry. The participants expressed their opinions on where, how, and why (not) they would like to collaborate with AI in their workflow. Based on their comments, we outlook the designs of future AI-powered data storytelling tools.
Our research can be extended from multiple perspectives. First, it is possible to increase the coverage of the interviewees to gain more comprehensive results, such as other types of content creators or data workers’ employers. Second, it is worth more investigation about detailed preferences for human-AI collaboration, such as modalities of communication with AI. Finally, the roles of AI collaborators might be further studied and enriched based on our summarized four roles.
Acknowledgements.
We would like to express our gratitude to all interviewees for their insightful feedback.References
- [1] S. Alspaugh, N. Zokaei, A. Liu, C. Jin, and M. A. Hearst. Futzing and moseying: Interviews with professional data analysts on exploration practices. IEEE Transactions on Visualization and Computer Graphics, 25(1):22–31, 2018.
- [2] F. Amini, N. H. Riche, B. Lee, A. Monroy-Hernandez, and P. Irani. Authoring data-driven videos with DataClips. IEEE Transactions on Visualization and Computer Graphics, 23(1):501–510, 2016.
- [3] B. Bach, N. H. Riche, S. Carpendale, and H. Pfister. The emerging genre of data comics. IEEE Computer Graphics and Applications, 37(3):6–13, 2017.
- [4] B. Bach, M. Stefaner, J. Boy, S. Drucker, L. Bartram, J. Wood, P. Ciuccarelli, Y. Engelhardt, U. Koeppen, and B. Tversky. Narrative design patterns for data-driven storytelling. In Data-Driven Storytelling, pp. 107–133. AK Peters/CRC Press, 2018.
- [5] B. Bach, Z. Wang, M. Farinella, D. Murray-Rust, and N. Henry Riche. Design patterns for data comics. In Proceedings of the 2018 CHI Conference on Human Factors in Computing Systems, pp. 1–12, 2018.
- [6] M. A. Borkin, Z. Bylinskii, N. W. Kim, C. M. Bainbridge, C. S. Yeh, D. Borkin, H. Pfister, and A. Oliva. Beyond memorability: Visualization recognition and recall. IEEE Transactions on Visualization and Computer Graphics, 22(1):519–528, 2015.
- [7] M. A. Borkin, A. A. Vo, Z. Bylinskii, P. Isola, S. Sunkavalli, A. Oliva, and H. Pfister. What makes a visualization memorable? IEEE Transactions on Visualization and Computer Graphics, 19(12):2306–2315, 2013.
- [8] M. Brehmer and R. Kosara. From jam session to recital: Synchronous communication and collaboration around data in organizations. IEEE Transactions on Visualization and Computer Graphics, 28(1):1139–1149, 2022.
- [9] M. Brehmer, B. Lee, B. Bach, N. H. Riche, and T. Munzner. Timelines revisited: A design space and considerations for expressive storytelling. IEEE Transactions on Visualization and Computer Graphics, 23(9):2151–2164, 2016.
- [10] S. Chen, J. Li, G. Andrienko, N. Andrienko, Y. Wang, P. H. Nguyen, and C. Turkay. Supporting story synthesis: Bridging the gap between visual analytics and storytelling. IEEE Transactions on Visualization and Computer Graphics, 26(7):2499–2516, 2018.
- [11] H. Cheng, J. Wang, Y. Wang, B. Lee, H. Zhang, and D. Zhang. Investigating the role and interplay of narrations and animations in data videos. Computer Graphics Forum, 41(3):527–539, 2022.
- [12] M. Cooley. Human-centered design. In Information Design, pp. 59–81. MIT Press Cambridge, 2000.
- [13] A. Crisan and B. Fiore-Gartland. Fits and starts: Enterprise use of AutoML and the role of humans in the loop. In Proceedings of the 2021 CHI Conference on Human Factors in Computing Systems, pp. 1–15, 2021.
- [14] W. Cui, X. Zhang, Y. Wang, H. Huang, B. Chen, L. Fang, H. Zhang, J.-G. Lou, and D. Zhang. Text-to-Viz: Automatic generation of infographics from proportion-related natural language statements. IEEE Transactions on Visualization and Computer Graphics, 26(1):906–916, 2019.
- [15] J. Drozdal, J. Weisz, D. Wang, G. Dass, B. Yao, C. Zhao, M. Muller, L. Ju, and H. Su. Trust in AutoML: exploring information needs for establishing trust in automated machine learning systems. In Proceedings of the 25th International Conference on Intelligent User Interfaces, pp. 297–307, 2020.
- [16] U. Ehsan, Q. V. Liao, M. Muller, M. O. Riedl, and J. D. Weisz. Expanding explainability: Towards social transparency in AI systems. In Proceedings of the 2021 CHI Conference on Human Factors in Computing Systems, pp. 1–19, 2021.
- [17] X. Fu, Y. Wang, H. Dong, W. Cui, and H. Zhang. Visualization assessment: A machine learning approach. In Proceedings of the 2019 IEEE Visualization Conference (VIS), pp. 126–130, 2019.
- [18] T. Ge, B. Lee, and Y. Wang. Cast: Authoring data-driven chart animations. In Proceedings of the 2021 CHI Conference on Human Factors in Computing Systems, pp. 1–15, 2021.
- [19] S. Gratzl, A. Lex, N. Gehlenborg, N. Cosgrove, and M. Streit. From visual exploration to storytelling and back again. Computer Graphics Forum, 35(3):491–500, 2016.
- [20] L. Harrison, K. Reinecke, and R. Chang. Infographic aesthetics: Designing for the first impression. In Proceedings of the 2015 CHI Conference on Human Factors in Computing Systems, pp. 1187–1190, 2015.
- [21] J. Heer. Agency plus automation: Designing artificial intelligence into interactive systems. Proceedings of the National Academy of Sciences, 116(6):1844–1850, 2019.
- [22] E. Horvitz. Principles of mixed-initiative user interfaces. In Proceedings of the 1999 CHI Conference on Human Factors in Computing Systems, pp. 159–166, 1999.
- [23] J. Hullman, S. Drucker, N. H. Riche, B. Lee, D. Fisher, and E. Adar. A deeper understanding of sequence in narrative visualization. IEEE Transactions on Visualization and Computer Graphics, 19(12):2406–2415, 2013.
- [24] M. Jacobs, J. He, M. F. Pradier, B. Lam, A. C. Ahn, T. H. McCoy, R. H. Perlis, F. Doshi-Velez, and K. Z. Gajos. Designing AI for trust and collaboration in time-constrained medical decisions: A sociotechnical lens. In Proceedings of the 2021 CHI Conference on Human Factors in Computing Systems, pp. 1–14, 2021.
- [25] E. Kamar. Directions in hybrid intelligence: Complementing AI systems with human intelligence. In Proceedings of the 25th International Joint Conference on Artificial Intelligence, pp. 4070–4073, 2016.
- [26] S. Kandel, A. Paepcke, J. M. Hellerstein, and J. Heer. Enterprise data analysis and visualization: An interview study. IEEE Transactions on Visualization and Computer Graphics, 18(12):2917–2926, 2012.
- [27] D. Kang, T. Ho, N. Marquardt, B. Mutlu, and A. Bianchi. ToonNote: Improving communication in computational notebooks using interactive data comics. In Proceedings of the 2021 CHI Conference on Human Factors in Computing Systems, pp. 1–14, 2021.
- [28] N. W. Kim, E. Schweickart, Z. Liu, M. Dontcheva, W. Li, J. Popovic, and H. Pfister. Data-driven guides: Supporting expressive design for information graphics. IEEE Transactions on Visualization and Computer Graphics, 23(1):491–500, 2016.
- [29] Y.-H. Kim, B. Lee, A. Srinivasan, and E. K. Choe. Data@Hand: Fostering visual exploration of personal data on smartphones leveraging speech and touch interaction. In Proceedings of the 2021 CHI Conference on Human Factors in Computing Systems, pp. 1–17, 2021.
- [30] B. Lee, R. H. Kazi, and G. Smith. SketchStory: Telling more engaging stories with data through freeform sketching. IEEE Transactions on Visualization and Computer Graphics, 19(12):2416–2425, 2013.
- [31] B. Lee, N. H. Riche, P. Isenberg, and S. Carpendale. More than telling a story: Transforming data into visually shared stories. IEEE Computer Graphics and Applications, 35(5):84–90, 2015.
- [32] H. Li, L. Ying, H. Zhang, Y. Wu, H. Qu, and Y. Wang. Notable: On-the-fly assistant for data storytelling in computational notebooks. In Proceedings of the 2023 CHI Conference on Human Factors in Computing Systems, pp. 1–16, 2023.
- [33] M. Lu, C. Wang, J. Lanir, N. Zhao, H. Pfister, D. Cohen-Or, and H. Huang. Exploring visual information flows in infographics. In Proceedings of the 2020 CHI Conference on Human Factors in Computing Systems, pp. 1–12, 2020.
- [34] Microsoft. Create professional slide layouts with Designer. https://support.microsoft.com/en-us/office/create-professional-slide-layouts-with-designer-53c77d7b-dc40-45c2-b684-81415eac0617. Accessed Mar. 24, 2023.
- [35] Microsoft. Introducing the new Bing. https://www.bing.com/new. Accessed Mar. 24, 2023.
- [36] M. Muller, I. Lange, D. Wang, D. Piorkowski, J. Tsay, Q. V. Liao, C. Dugan, and T. Erickson. How data science workers work with data: Discovery, capture, curation, design, creation. In Proceedings of the 2019 CHI Conference on Human Factors in Computing Systems, pp. 1–15, 2019.
- [37] S. Narkar, Y. Zhang, Q. V. Liao, D. Wang, and J. D. Weisz. Model LineUpper: Supporting interactive model comparison at multiple levels for AutoML. In Proceedings of the 26th International Conference on Intelligent User Interfaces, pp. 170–174, 2021.
- [38] OpenAI. DALL·E 2. https://openai.com/product/dall-e-2. Accessed Mar. 24, 2023.
- [39] OpenAI. Introducing ChatGPT. https://openai.com/blog/chatgpt. Accessed Mar. 24, 2023.
- [40] OpenAI. GPT-4 technical report. arXiv preprint arXiv:2303.08774, 2023.
- [41] H. Park, D. Ahn, K. Hosanagar, and J. Lee. Designing fair AI in human resource management: Understanding tensions surrounding algorithmic evaluation and envisioning stakeholder-centered solutions. In Proceedings of the 2022 CHI Conference on Human Factors in Computing Systems, pp. 1–22, 2022.
- [42] C. Qian, S. Sun, W. Cui, J.-G. Lou, H. Zhang, and D. Zhang. Retrieve-then-Adapt: Example-based automatic generation for proportion-related infographics. IEEE Transactions on Visualization and Computer Graphics, 27(2):443–452, 2020.
- [43] D. Ren, M. Brehmer, B. Lee, T. Höllerer, and E. K. Choe. ChartAccent: Annotation for data-driven storytelling. In Proceedings of the 2017 IEEE Pacific Visualization Symposium, pp. 230–239, 2017.
- [44] E. Segel and J. Heer. Narrative visualization: Telling stories with data. IEEE Transactions on Visualization and Computer Graphics, 16(6):1139–1148, 2010.
- [45] V. Setlur, S. E. Battersby, M. Tory, R. Gossweiler, and A. X. Chang. Eviza: A natural language interface for visual analysis. In Proceedings of the 29th Annual Symposium on User Interface Software and Technology, pp. 365–377, 2016.
- [46] V. Setlur and M. Tory. How do you converse with an analytical chatbot? revisiting gricean maxims for designing analytical conversational behavior. In Proceedings of the 2022 CHI Conference on Human Factors in Computing Systems, pp. 1–17, 2022.
- [47] D. Shi, F. Sun, X. Xu, X. Lan, D. Gotz, and N. Cao. AutoClips: An automatic approach to video generation from data facts. Computer Graphics Forum, 40(3):495–505, 2021.
- [48] D. Shi, X. Xu, F. Sun, Y. Shi, and N. Cao. Calliope: Automatic visual data story generation from a spreadsheet. IEEE Transactions on Visualization and Computer Graphics, 27(2):453–463, 2020.
- [49] Y. Shi, S. Chen, P. Liu, J. Long, and N. Cao. ColorCook: Augmenting color design for dashboarding with domain-associated palettes. Proceedings of the ACM on Human-Computer Interaction, 6(CSCW2):1–25, 2022.
- [50] M. Shin, J. Kim, Y. Han, L. Xie, M. Whitelaw, B. C. Kwon, S. Ko, and N. Elmqvist. Roslingifier: Semi-automated storytelling for animated scatterplots. IEEE Transactions on Visualization and Computer Graphics, 2022.
- [51] A. Srinivasan, B. Lee, and J. Stasko. Interweaving multimodal interaction with flexible unit visualizations for data exploration. IEEE Transactions on Visualization and Computer Graphics, 27(8):3519–3533, 2020.
- [52] J. Sun, Q. V. Liao, M. Muller, M. Agarwal, S. Houde, K. Talamadupula, and J. D. Weisz. Investigating explainability of generative AI for code through scenario-based design. In Proceedings of the 27th International Conference on Intelligent User Interfaces, pp. 212–228, 2022.
- [53] M. Sun, L. Cai, W. Cui, Y. Wu, Y. Shi, and N. Cao. Erato: Cooperative data story editing via fact interpolation. IEEE Transactions on Visualization and Computer Graphics, 29(1):983–993, 2022.
- [54] J. R. Thompson, Z. Liu, and J. Stasko. Data Animator: Authoring expressive animated data graphics. In Proceedings of the 2021 CHI Conference on Human Factors in Computing Systems, pp. 1–18, 2021.
- [55] J. Walny, B. Lee, P. Johns, N. H. Riche, and S. Carpendale. Understanding pen and touch interaction for data exploration on interactive whiteboards. IEEE Transactions on Visualization and Computer Graphics, 18(12):2779–2788, 2012.
- [56] C. Wang, Y. Feng, R. Bodik, I. Dillig, A. Cheung, and A. J. Ko. Falx: Synthesis-powered visualization authoring. In Proceedings of the 2021 CHI Conference on Human Factors in Computing Systems, pp. 1–15, 2021.
- [57] D. Wang, Q. V. Liao, Y. Zhang, U. Khurana, H. Samulowitz, S. Park, M. Muller, and L. Amini. How much automation does a data scientist want? arXiv preprint arXiv:2101.03970, 2021.
- [58] D. Wang, J. D. Weisz, M. Muller, P. Ram, W. Geyer, C. Dugan, Y. Tausczik, H. Samulowitz, and A. Gray. Human-AI collaboration in data science: Exploring data scientists’ perceptions of automated AI. Proceedings of the ACM on Human-Computer Interaction, 3(CSCW):1–24, 2019.
- [59] Q. Wang, Y. Ming, Z. Jin, Q. Shen, D. Liu, M. J. Smith, K. Veeramachaneni, and H. Qu. ATMSeer: Increasing transparency and controllability in automated machine learning. In Proceedings of the 2019 CHI Conference on Human Factors in Computing Systems, pp. 1–12, 2019.
- [60] Y. Wang, Y. Gao, R. Huang, W. Cui, H. Zhang, and D. Zhang. Animated presentation of static infographics with InfoMotion. Computer Graphics Forum, 40(3):507–518, 2021.
- [61] Y. Wang, Z. Hou, L. Shen, T. Wu, J. Wang, H. Huang, H. Zhang, and D. Zhang. Towards natural language-based visualization authoring. IEEE Transactions on Visualization and Computer Graphics, 29(1):1222–1232, 2022.
- [62] Y. Wang, Z. Sun, H. Zhang, W. Cui, K. Xu, X. Ma, and D. Zhang. DataShot: Automatic generation of fact sheets from tabular data. IEEE Transactions on Visualization and Computer Graphics, 26(1):895–905, 2019.
- [63] Y. Wang, H. Zhang, H. Huang, X. Chen, Q. Yin, Z. Hou, D. Zhang, Q. Luo, and H. Qu. InfoNice: Easy creation of information graphics. In Proceedings of the 2018 CHI Conference on Human Factors in Computing Systems, pp. 1–12, 2018.
- [64] D. K. I. Weidele, J. D. Weisz, E. Oduor, M. Muller, J. Andres, A. Gray, and D. Wang. AutoAIViz: opening the blackbox of automated artificial intelligence with conditional parallel coordinates. In Proceedings of the 25th International Conference on Intelligent User Interfaces, pp. 308–312, 2020.
- [65] K. Wongsuphasawat, Y. Liu, and J. Heer. Goals, process, and challenges of exploratory data analysis: An interview study. arXiv preprint arXiv:1911.00568, 2019.
- [66] D. Xin, E. Y. Wu, D. J.-L. Lee, N. Salehi, and A. Parameswaran. Whither AutoML? understanding the role of automation in machine learning workflows. In Proceedings of the 2021 CHI Conference on Human Factors in Computing Systems, pp. 1–16, 2021.
- [67] L. Yang, X. Xu, X. Lan, Z. Liu, S. Guo, Y. Shi, H. Qu, and N. Cao. A design space for applying the Freytag’s pyramid structure to data stories. IEEE Transactions on Visualization and Computer Graphics, 28(1):922–932, 2021.
- [68] L.-P. Yuan, Z. Zhou, J. Zhao, Y. Guo, F. Du, and H. Qu. InfoColorizer: Interactive recommendation of color palettes for infographics. IEEE Transactions on Visualization and Computer Graphics, 28(12):4252–4266, 2021.
- [69] A. X. Zhang, M. Muller, and D. Wang. How do data science workers collaborate? Roles, workflows, and tools. Proceedings of the ACM on Human-Computer Interaction, 4(CSCW1):1–23, 2020.
- [70] H. Zhu, B. Yu, A. Halfaker, and L. Terveen. Value-sensitive algorithm design: Method, case study, and lessons. Proceedings of the ACM on Human-Computer Interaction, 2(CSCW):1–23, 2018.